
Abstract
The flow mechanism that is realized in 3-D depending on the fabric’s porosity structure determines the fabric’s permeability performance. During the flow movement that happens both in the in-plane and through-plane directions, not only the inter-yarn pore properties but inter-fiber pore properties play a significant role as well. The aim of this study is to offer a new method to identify intra-yarn porosity, which has mostly been neglected during the theoretical studies. In this method, initially the cross-sectional images of the cotton yarn in the fabric were achieved, and then the intra-yarn porosity was predicted via image processing and analysis steps. Besides, intra-yarn porosity was calculated theoretically depending on fiber and yarn parameters. The results that were obtained through the image analysis method and theoretical approaches were compared with the experimental data achieved by using Stereo Investigator. As a result, it was observed that the image analysis method was giving fast, objective, successful and expected results while predicting the intra-yarn porosity.
Introduction
The performance property called ‘fabric permeability’, which is the result of the flow in fabric, is the function of firstly the pore properties of fabric and some environmental factors such as heat, pressure, moisture, and the function of the properties of the fluid material that pass through the fabric, such as viscosity and surface tension. The pore properties of the fabric, such as the pore size, pore size distribution, pore shape and porosity, are determined by the fiber and yarn properties and the fabric’s structural properties, such as setting and weave type. Accordingly, the prediction of the permeability performance of the fabric used in a certain area can be obtained by the control of the pore properties which have been determined through the fabric’s structural properties. It is extremely important in terms of production development, time and cost to be able to predict the performance property during the designing period, especially in the technical textiles where permeability performance has a great importance during usage, such as airbags, geotextile, filtration textile, and sportswear.
Porosity is defined as the ratio of the total empty area to the total area or as the ratio of the total empty volume to the total volume. The fabric’s porosity was introduced as having three different components, which were the intra-fiber, intra-yarn (inter-fiber) and inter-yarn porosities; 1 and the effective porosity of the flow that took place in the fabric was described as a function of the inter-yarn and intra-yarn porosities.
Many experimental and/or theoretical studies were realized to define what fabric porosity was. During the theoretical studies, yarns were modeled as impermeable monofilament structures and fabric porosity has only been studied in the inter-yarn areas. It was suggested that inter-yarn porosity depended on different structural properties, such as weave type, setting, yarn diameter, fabric thickness, and yarn twist.2–7 It was observed that the shape and the size of the empty spaces of the inter-yarn that were put in an order one after another in the fabric might differ according to the setting of the yarns and the yarns’ packing degree when the yarns intersected. 8 Ariaduari et al. predicted the permeability properties of the woven geotextile fabrics by using Poiseuille flow equations through calculating the pore of both the inter-yarn and inter-fiber 9 theoretically. In another study to examine the inter-fiber porosity, it was seen that the flow model that was applied to the monofilament fabrics was not suitable for the multifilament fabrics because of the yarn flattening and pore types being different. 10 On the other hand, the porosity of the fabrics were investigated both in the inter-yarn section and intra-yarn section in the studies where some computer aided softwares such as CFD were used; as a result, the permeability was predicted by using different flow equations depending on the flow type at both sections.11–16 In recent years, one popular method to define the fabric porosity is the image analysis method. This method is used to predict the inter-yarn porosity of the woven and knitted fabrics as well as to determine the interrelation of the porosity, permeability and structural properties.17–22 This method has also been used to determine some properties of fabrics, such as pore size, and pore size distribution, in the nonwoven fabrics. 23 Aydilek et al. observed the plane and cross-sectional images of the fabric by using the image analysis method 24 to determine the three-dimensional pore structure of nonwoven fabrics.
The flow that occurs in the porous structure is a three-dimensional complex mechanism that depends on the shape, place and size distribution of the empty spaces. Not only the inter-yarn pores but also the intra-yarn pores are effective in the flow mechanism that moves in the in-plane and through-plane directions of the fabric. The inter-fiber pores play a very significant role in the movement and distribution of the flow through capillary pressure that they provide. Therefore, it may lead to make mistakes in the permeability predictions while describing the pore properties of the fabric if the yarns are considered as impermeable structures. The aim of this study is to develop a new method depending on the image analysis so as to describe the intra-yarn porosity which plays an important role in the permeability mechanism. The cross-sectional images of cotton fabrics were taken in order to investigate the yarn structure in the fabric. The results achieved in this method were compared with the direct measurement results achieved on the yarns’ cross-sectional images and with theoretically calculated results.
Experimental
Material
The cross-sectional images of the fabric were captured and the yarn images in the woven fabric structure were examined in order to analyze the intra-yarn porosity by yarn’s cross-sectional images. For this purpose, the cross-sections of nine different types of fabrics in the directions of warps and wefts were taken. The basic properties of these fabrics were their weave types, plain, 2/1 twill and 3/1 twill, and being woven at three different weft settings. The test group used for investigating the yarn porosity was made up of fifty samples to include at least one yarn image from the warps and wefts of every fabric type. Fabrics were produced by using 29.53 tex cotton yarn in the direction of warps and wefts. The fineness of the cotton fiber used was 5.4 micronaire. As all the weave types were produced with the same yarn type, the yarn was expected to affect the intra-yarn porosity of different weave types similarly. Minitab 14, a statistical software package, was used to observe the relationship between the porosity results achieved via different methods.
Sectioning fabric: frozen section techniques
This study clarified that the clearest images for assessing the fiber and pore regions were obtained using a cryostat microtome to obtain cross-section images of the yarn within the fabric after the preparatory studies, which were conducted using different cross-section methods (PES resin, paraffin embedding, compressing with glass plates, cryostat, etc.). The method used especially in medicine for histological examinations included, primarily, the frozen section procedure for samples. According to the formed experiment plan, five 1.5 × 1.5 cm2 samples were first cut for warp and weft directions of the nine types of cotton fabric, which did not contain the same warp and weft yarns. The samples, cut from each fabric, were placed in plastic molds (Croyomold) in the form of five layers and a special embedding medium was created by dripping Killik (cryostat embedding medium) on fabrics in order to section using a cryostat microtome. After being left for an hour to soak up all the solid solution, every fabric was frozen at −20°C. Using more than one fabric layer in prepared samples made it possible to obtain more images from one section. Then, frozen samples were placed in a Leica CM 1850 cryostat microtome to enable them to be sectioned, once they were removed from their molds (Figure 1). Prior to placing cross-sections on slides for examination, the first sections obtained from the frozen mold using a microtome were disregarded to clean the surface and to eliminate parts which were damaged during the preparation of the fabric samples during the cutting procedure. After this process, 5 µm thick sections were taken in such a way to include every layer of the fabric and placed on a slide. After taking each section, 10 sections were disregarded in order to analyze a new region. Samples were prepared for microscopic examination by taking five sections from every sample and covering them with Canadian Balsam (balsam of fir) and Xylol mixture at a 1:1 ratio on the slide.
Sectioning fabric by cryostat-microtome.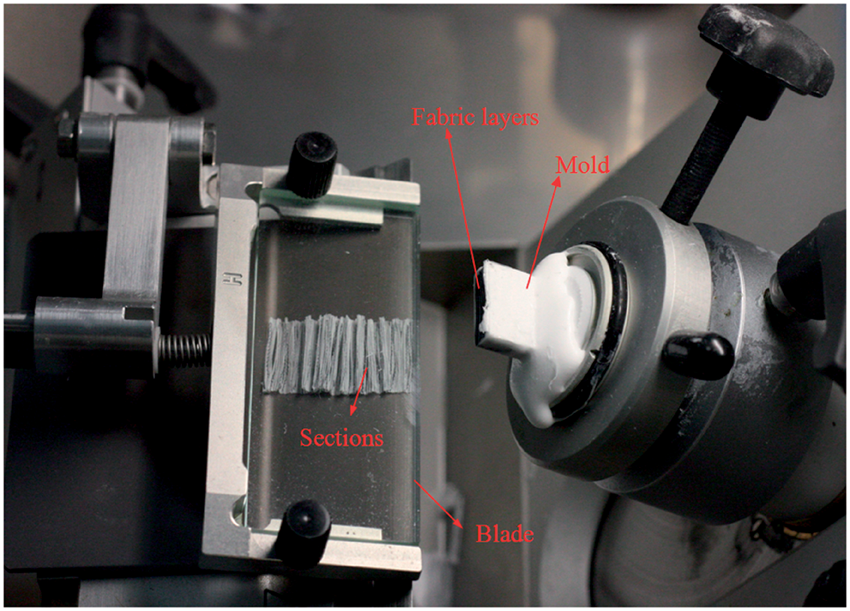
Experimental measurements: Stereo Investigator
Yarn size (major and minor diameter), yarn area, and every fiber area were measured by using a Stereo Investigator 8 (SI) program after examining the microscopic images (Figure 2). The borders were defined by using closed contours in order to measure the 2-D cross-section areas of the yarn and fibers. In this method, the area in a closed curve with definite borders was calculated using the distance between the marked coordinates.
25
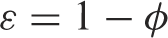
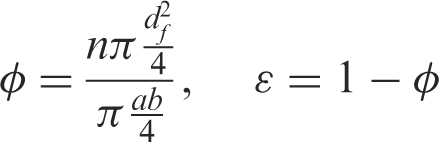
After taking the linear and areal measurements for the yarn and fibers, the packing density (ϕ) was identified for each yarn in order to calculate the intra-yarn porosity using the data obtained from measurements. ϕ is the ratio of the total fiber area to the yarn area. Equation 1 was used to calculate the yarn porosity (PSI), defined as the ratio of the pore area to the yarn area.
The dimension measurements of the yarn and fibers from Stereo Investigator.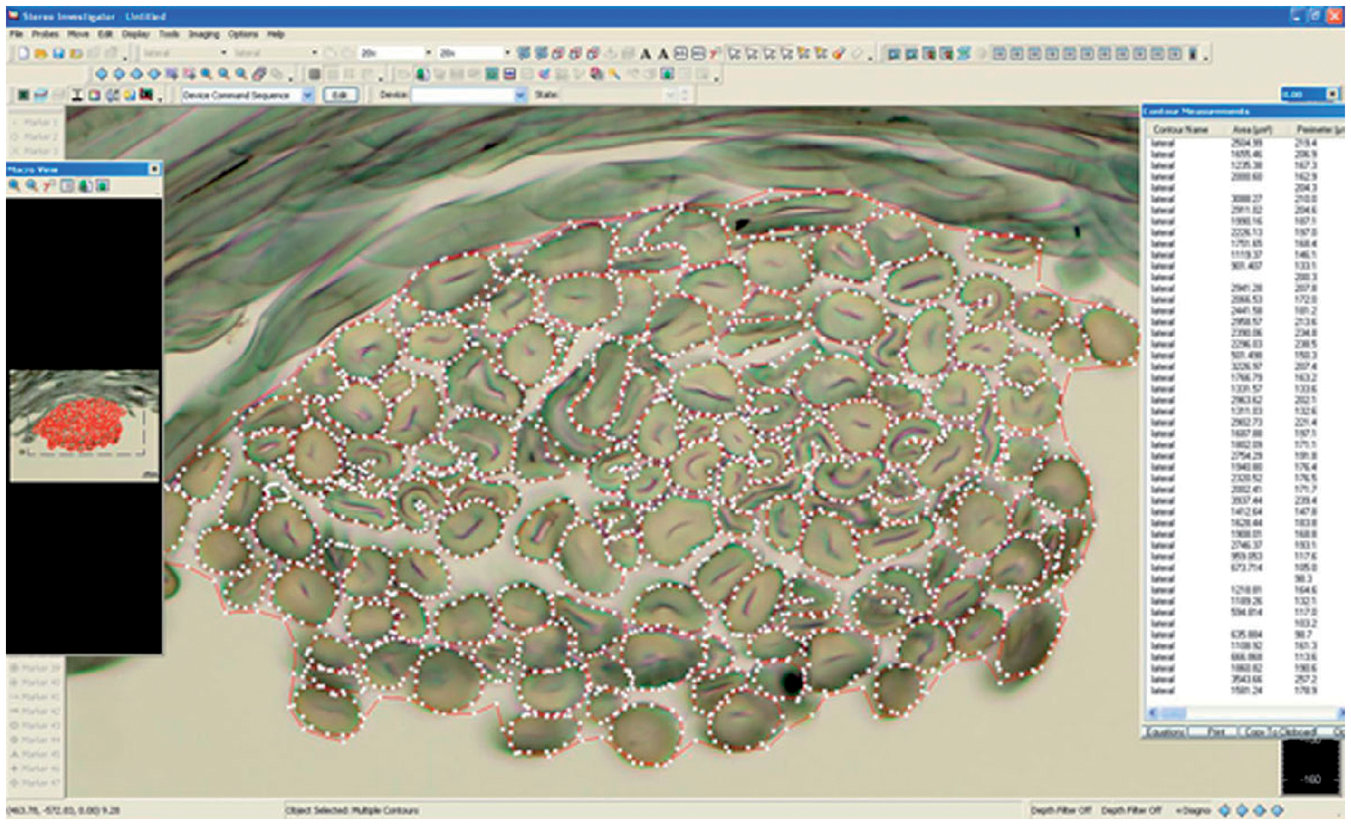
The image analysis method
The first stage of the image analysis method is to obtain, digitally, yarn images to be examined. The image analysis system used in this study included a research microscope (Leica DM 4000B) with an integrated camera (Olympus DP71) to take images, a computer system to conduct analyses, and software (MATLAB) equipped with image processing and analysis instruments. 24-bit colored 4080 × 3072 pixel (143.9 × 108.4 cm linear field size) images were obtained by using a 20× magnifying lens to analyze the yarn structure within the fabric in detail (Figure 3). At the second stage, the analysis of the cross-sectional image of one yarn was achieved as a result of editing and cropping using a Photoshop CS3 program (Figure 4a). Then, images were converted to 8 bpp, 256 gray level images in the image analysis program using the MATLAB image processing toolbox (Figure 4b). The purpose of this process was to speed up the analysis and shorten the process duration by decreasing the file size. At the next stage, the gray level image was converted into a black and white image (binary image) using a suitable threshold value to define the porosity using the image analysis method by separating the fiber and pore regions in the cross-section images of the yarn. The Otsu method was used to determine the threshold value used in the program. Black pixels represented fibers, and white pixels represented pore areas in the obtained binary image.
The cross-sectional image of the yarn in the fabric. a. Original image, b. Gray level image, c. Binary image, d. Edge detection process, e. Final binary image, f. The elliptical yarn area.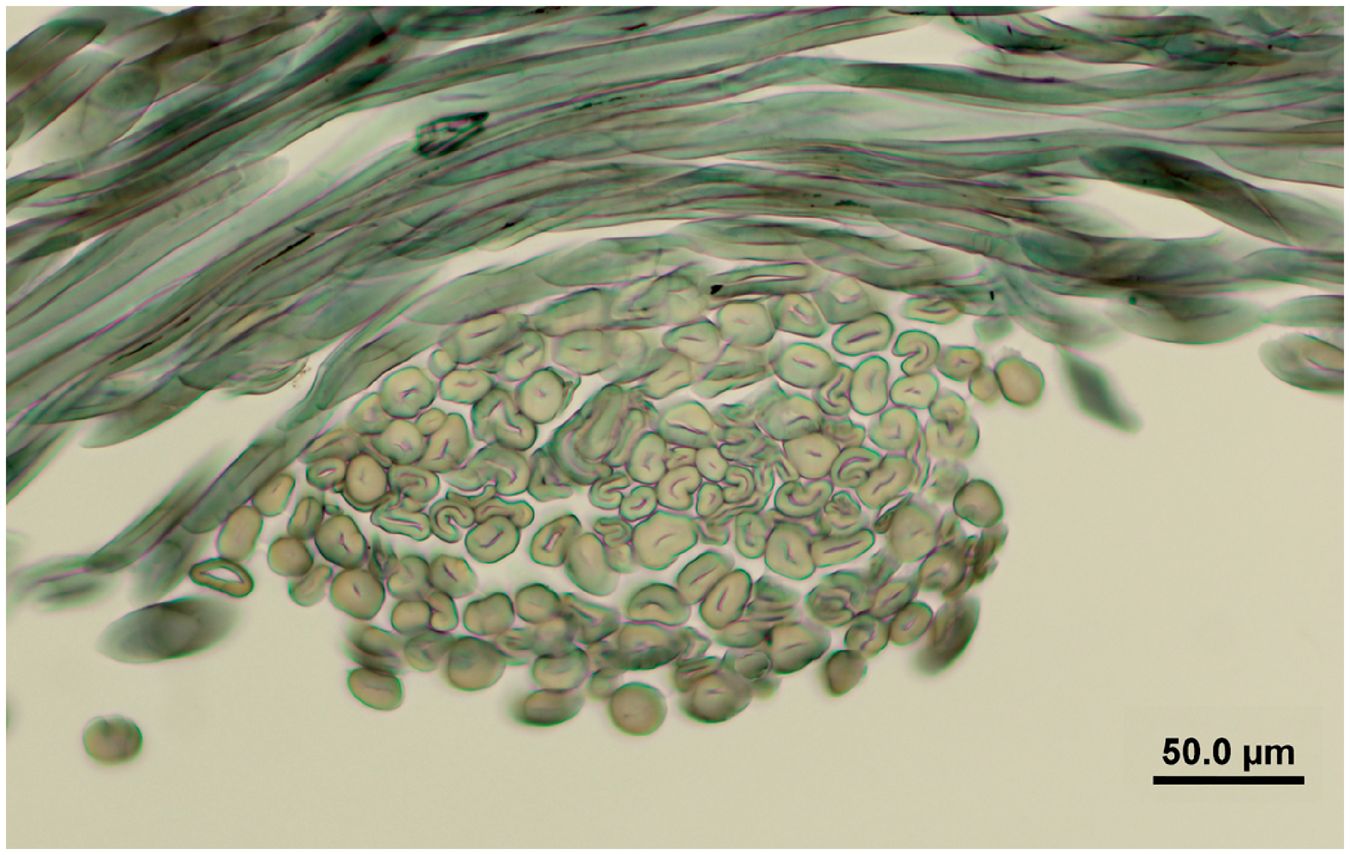
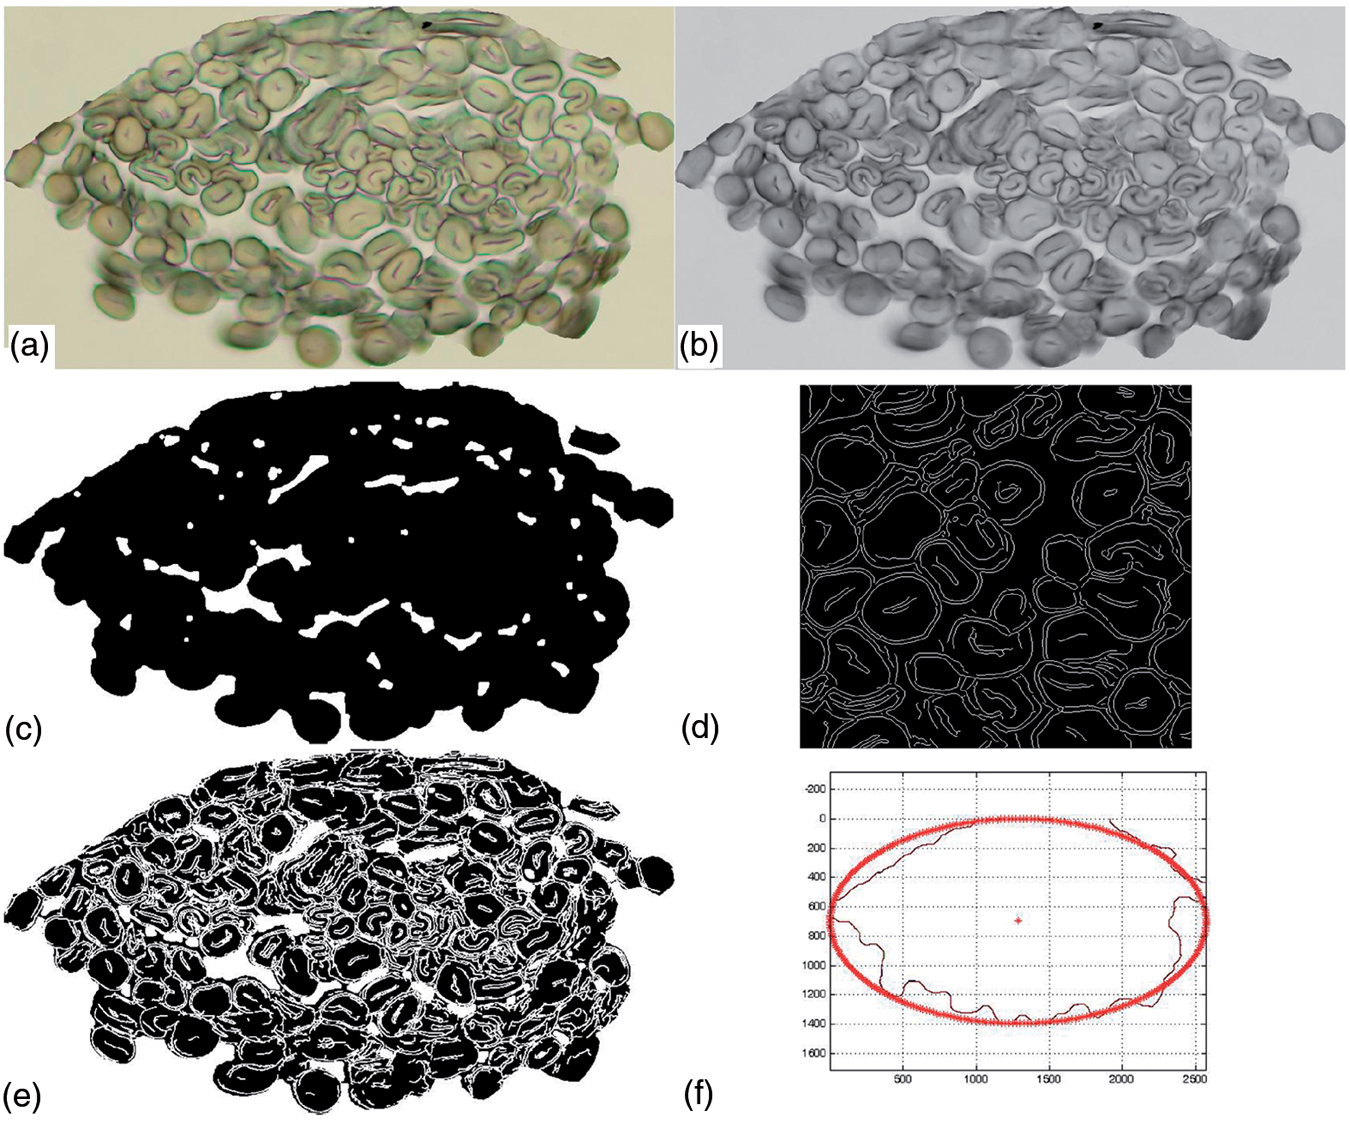
Light transmission at the center regions of the fiber increased due to the wide lumen of some cotton fibers in the image and this affected the color distribution and contrast in the fiber image. Therefore, fiber regions within the fiber, which were close to the lumen, were also converted to white pixels when the image was converted into a binary image. The studies for improving the binary image were made to minimize this error by using ‘Opening’ and ‘Closing’ functions (Figure 4c). Opening and closing functions were morphological image processing applications that resolved details in the image with a small matrix element (strel function), known as the structuring element, defined by shape and parameters. 26
Another cause of mistakes, which was encountered while converting yarn images to binary images, was the misclassification of the regions which were close to the borders of the fiber. Since the edges of the fiber could not be imaged sharply, the fiber and pore regions could not be distinguished in regions near the border and pore regions close to fiber borders turned to black. A group of image enhancement process was required as this situation had a major effect on the porosity rate calculated at later stages. The ‘edge detection process’ was applied on the binary image using the ‘canny’ function in order to determine border regions and to define regions outside the border as pores. The edge borders that gave rise to this error were illustrated in Figure 4d in detail. The only problem encountered at this stage was the fact that cotton yarn lumens were also detected during edge detection. After determining edge borders, edges were thickened using the dilation function and it was ensured that the black pixels, in the region that caused the error, would convert into white pixels (Figure 4e). In this way, the final binary image was obtained to calculate the porosity of the yarn using the image analysis method. The packing density was calculated using the ratio of the total fiber area (represented with black pixels) to the yarn area and the image analysis porosity data (PI2) were determined. The yarn area was calculated using the M × N binary image size, assuming that the cross-sectional shape of the yarn was an ellipse (Figure 4f). Porosity was also calculated for the unimproved binary image in order to analyze the effect of the image enhancement process (PI1). The porosity results obtained from image analysis (PI1, PI2) were compared with the porosity results obtained from Stereo Investigator measurements (PSI).
Porosity calculations
Theoretical and semi-theoretical approaches were used in order to estimate the porosity of the yarn within the fabric, using certain assumptions based on yarn and fiber parameters; results were compared with the porosity results obtained from Stereo Investigator and image analysis.
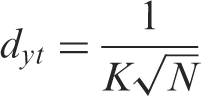
The circular yarn diameter, used in calculations, was determined using two different methods as theoretical and experimental. In the theoretical method, the circular diameter of the yarn (dyt) was calculated based on the coefficient of the yarn spinning system (K) and the metric count system
27
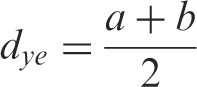
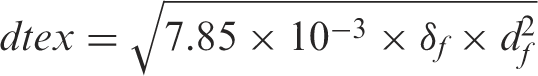
(equation 2). In the experimental approach, the circular yarn diameter (dye) was calculated using the major and minor diameter (a, b) of the yarn, obtained from Stereo Investigator measurements, and the assumption of constant perimeter (equation 3). The circular cross-sectional theoretical diameter of the fiber (df) was calculated based on fineness and specific weight (δf) of the fiber, using equation 4.
Theoretical approaches
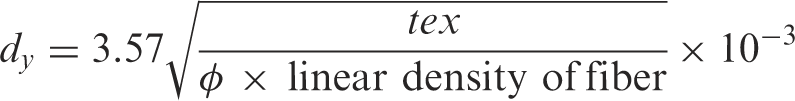
The equation which Grosberg suggested in order to calculate the yarn diameter of the circular cross-section was applied in the first approach, which is used to calculate the intra-yarn porosity theoretically. Grosberg defined the yarn diameter (dy) based on the linear density of the yarn (tex), the packing density (ϕ), and the specific weight of the yarn (δf = 1.53 g/cm3 for cotton fiber), as illustrated in equation 5.
28
According to this approach, the packing density of the yarn was achieved using the theoretical circular yarn diameter (dyt) and the theoretical yarn porosity (PGrosberg-T) was calculated using equation 1 according to Grosberg’s yarn diameter approach.
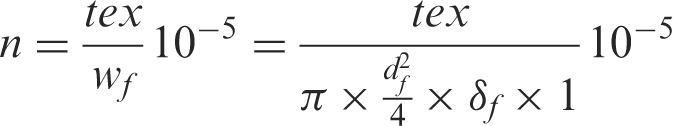
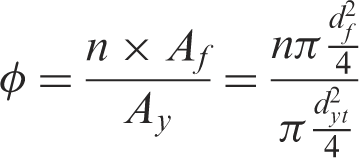
In the second approach used to calculate the intra-yarn porosity theoretically, the packing density of the yarn was calculated by using the ratio of total fiber area to the total yarn area. The theoretical circular yarn diameter (dyt) was used to calculate the total yarn area (Ay). The total fiber area was calculated using the number of fibers in the cross-section (n) and the area of one fiber (Af), assuming that the fiber diameters within the yarn section were equal to one another. The average number of fibers (n) in the cross-section of the yarn was found theoretically using the ratio of linear density of the yarn to the weight of one fiber (wf) per unit length (1 cm) (equation 6). Equation 7 was used to calculate the packing density of the yarn (ϕ) based on the theoretical fiber number (n), the area of the one fiber (Af), whose cross-section was assumed to be circular, and the yarn area (Ay). By this way, the theoretical porosity (Pn-T) was calculated using equation 1, based on the theoretical fiber number in the cross-section of the yarn (n), the theoretical fiber diameter (df), and the theoretical yarn diameter (dyt).
Semi-theoretical approaches
The yarn diameter, number of fibers in the yarn cross-section, and fiber diameter parameters used in theoretical approaches were constant values calculated theoretically; change was not considered in these calculations. However, all these parameters related to yarn properties changed along the yarn. In this part of the study, porosity for each yarn was calculated semi-theoretically using Grosberg’s approach and the theoretical fiber number approach, taking into consideration the change in yarn diameter. In these approaches, known as semi-theoretical, data from the yarn diameter obtained from Stereo Investigator measurements was used, providing all other parameters remain the same.
The packing density and yarn porosity (PGrosberg) of 50 yarns were calculated using the circular yarn diameter (dye), calculated from the major and minor diameters of the yarn obtained from Stereo Investigator measurements, in Equation 5 in order to calculate the porosity of each yarn according to the Grosberg approach taking into consideration the change in yarn size.
In another approach, assuming the cross-section shape of the yarn as an ellipse, the packing density and yarn porosity (Pn139) were calculated for each yarn based on the theoretical fiber number (n), the theoretical fiber diameter (df), and the yarn area calculated using the a and b diameters obtained from Stereo Investigator measurements (equation 8).
Finally, in this study, the packing density was calculated using the average fiber number, obtained from results of experimental measurements, and measured yarn diameters (a, b) and the yarn porosity was defined according to the experimentally determined average fiber number (Pn164).
The porosity results obtained by using theoretical (PGrosberg-T, Pn-T) and semi-theoretical (PGrosberg, Pn139, Pn164) approaches were compared with the porosity results obtained from Stereo Investigator measurements (PSI).
Results and discussion
Even though the SI measurement method, used in this study, was time consuming due to the fact that the user determined the contour points, the method provided linear and areal measurements on yarn images that were very close to real values; ultimately, producing experimental data that could be compared to theoretical and image analysis results. The measurement method also helped to obtain the average fiber and yarn data, to be used in theoretical calculations, and to determine the variation in cotton fiber that was used in this study. When the relationship between the yarn area, obtained from Stereo Investigator measurements of 50 yarns (SI-Ay), and the yarn area, calculated using the measured major and minor diameters of the yarn assuming it was elliptical (SI-Ae), were examined, the correlation coefficient was found to be 0.860 and the difference between them was observed to be statistically insignificant (Figure 5).
The relationship between the measured area (SI-Ay) and calculated area (SI-Ae) of the yarn.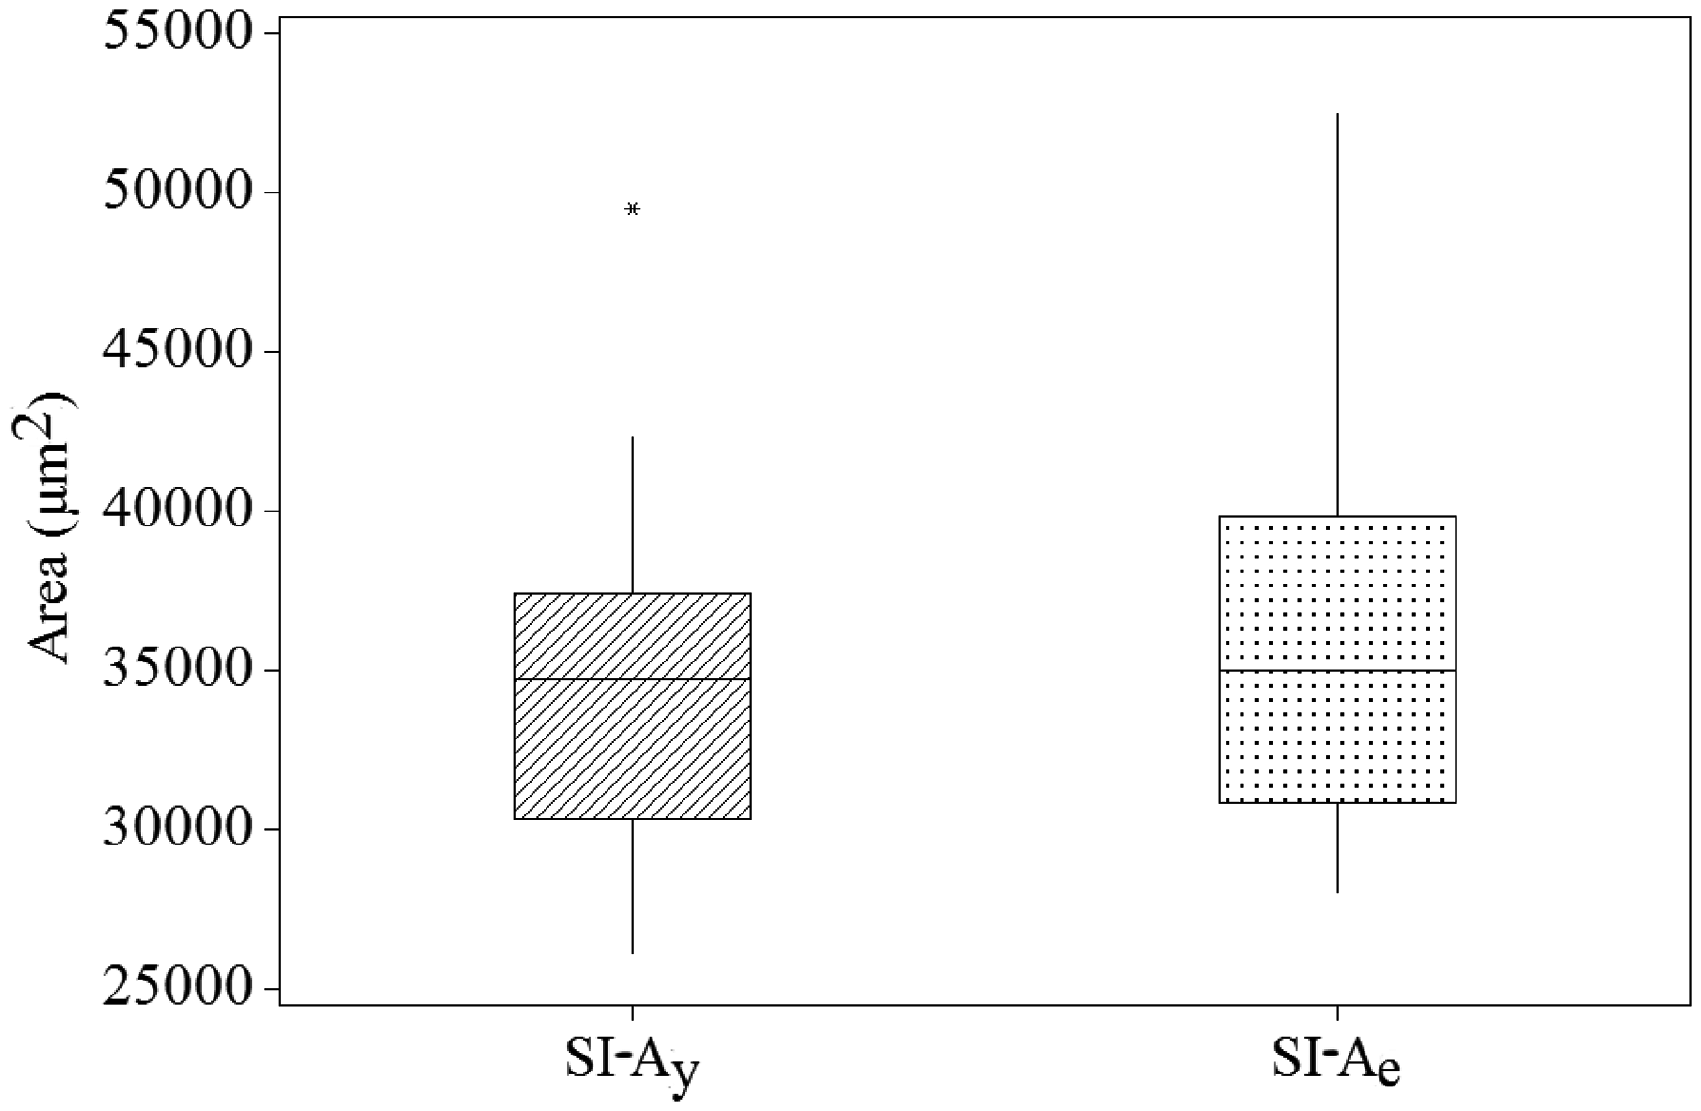
The fiber number and porosity (PSI) distributions of 50 yarns, obtained through Stereo Investigator measurements, was illustrated in Figure 6. By measurements, the average number of fibers within the yarn was found to be 164. The 95% confidence interval for the number of fibers in the cross-section of the yarn was calculated as 159–170. The 95% confidence interval for the yarn porosity obtained from PSI measurements was found to be 34.96–37.40; the average yarn porosity was found to be 36%. The average cross-sectional area of all fibers, measured during experiments, was 133 µm2. The theoretically calculated cross-section area of the fiber, calculated from 5.4 micronaire index value, assuming the cross-sectional area of the fiber was circular, was 139 µm2.
a. Distribution of fiber number (n), b. Distribution of the porosity (PSI) of the measured yarns by Stereo Investigator.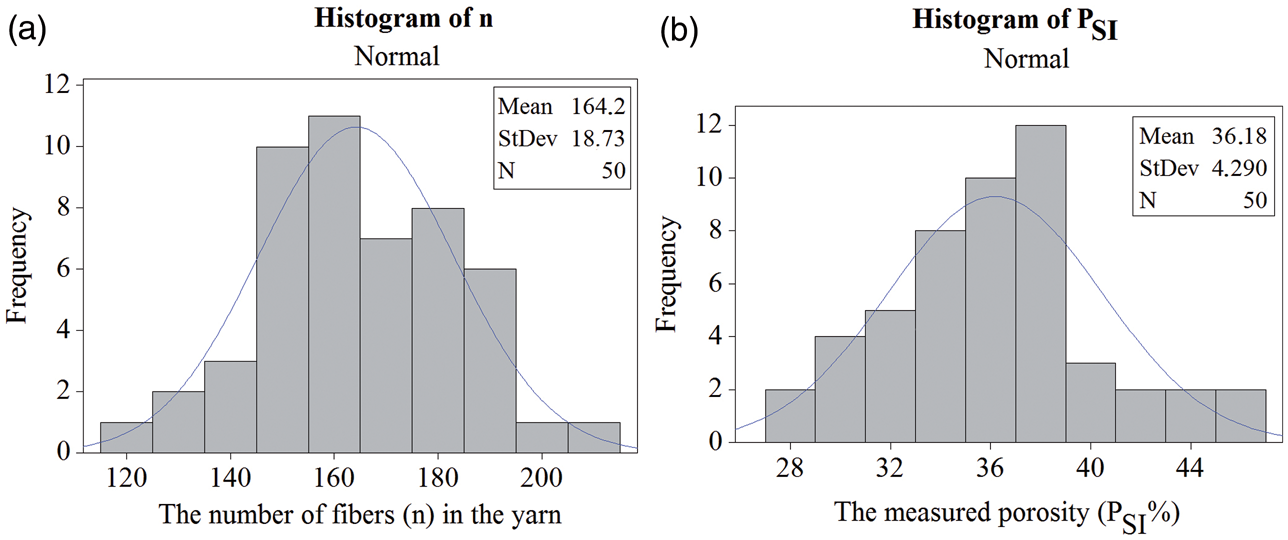
The correlation coefficient for the relationship between the porosity (PSI) calculated using the experimental method and the porosity (PI1) calculated using the image analysis method (with no enhancement processes conducted on the images) was found to be 0.654; the relationship between them was significant according to a 0.01 confidence level, but there was a 70% difference between them (Figure 7). The reason was that some pore regions appeared as black pixels in the initial binary images, where the fiber and pore regions could not be distinguished in areas close to the edges of fiber. The correlation coefficient between PSI and the inter-fiber porosity (PI2) calculated from the final binary images, after image enhancement processes were applied, was 0.74.
a. The relationship between the measured porosity (PSI) and the porosity of un-processed binary image (PI1), b. The relationship between PSI and the porosity of final binary image (PI2).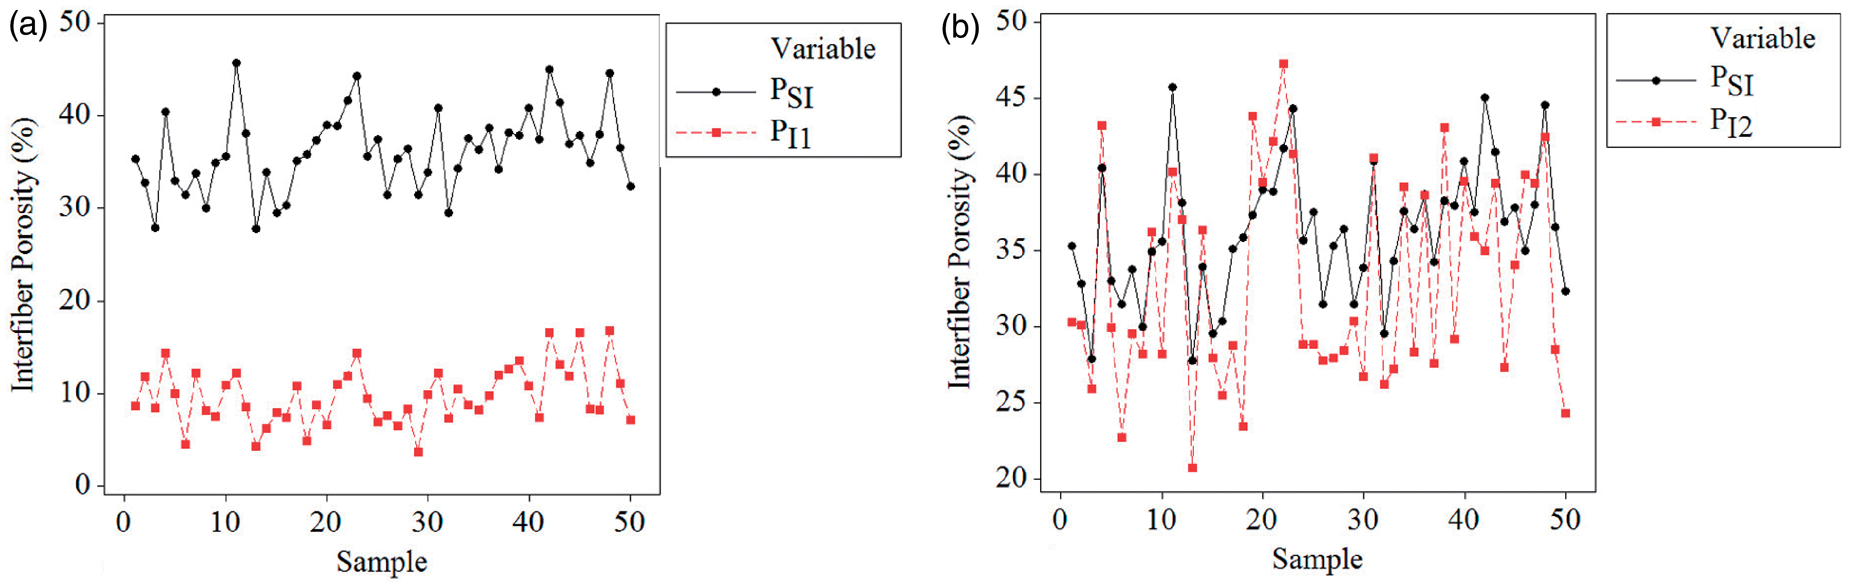
The porosity results of each method
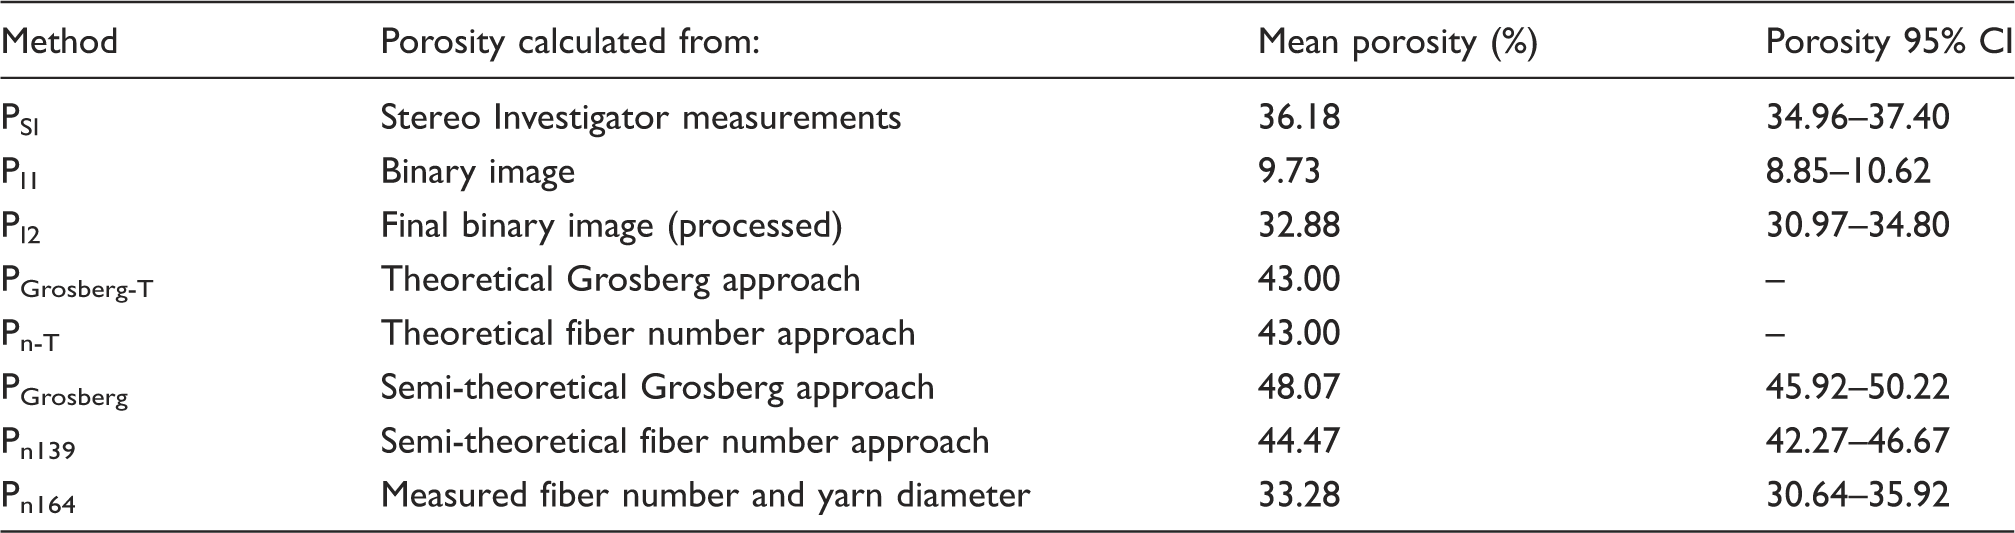
When the relationship between the yarn porosity obtained from theoretical results and the yarn porosity obtained from measurements (PSI) was examined, the difference between PSI and PGrosberg, and between PSI and Pn139, was found to be significant for the 95% confidence interval. The theoretical fiber number (n = 139) calculated for 29.53 tex yarn using the specific volume approach was significantly lower than the measured average fiber number. The fiber number of the yarn section was not determined as close to the experimental results due to the changes in structural properties of natural fibers such as cotton fiber; as a result, the effect of change was not reflected in the theoretical approach.
The difference between the yarn porosity calculated using the measured average fiber number (Pn164) and PSI was not found to be significant for a 95% confidence interval (Figure 8). The correlation coefficient between them was 0.273. In semi-theoretical approaches, the calculations were carried out by using the yarn diameter values obtained from Stereo Investigator measurements. Nevertheless, it was observed while investigating the relationship between semi-theoretical results and measurement results that the obtained results exhibited a low correlation coefficient with the experimental results because of the variation of the fiber diameter and the variation of the number of fibers within the yarn cross-section.
The comparison of the intra-yarn porosity of the methods.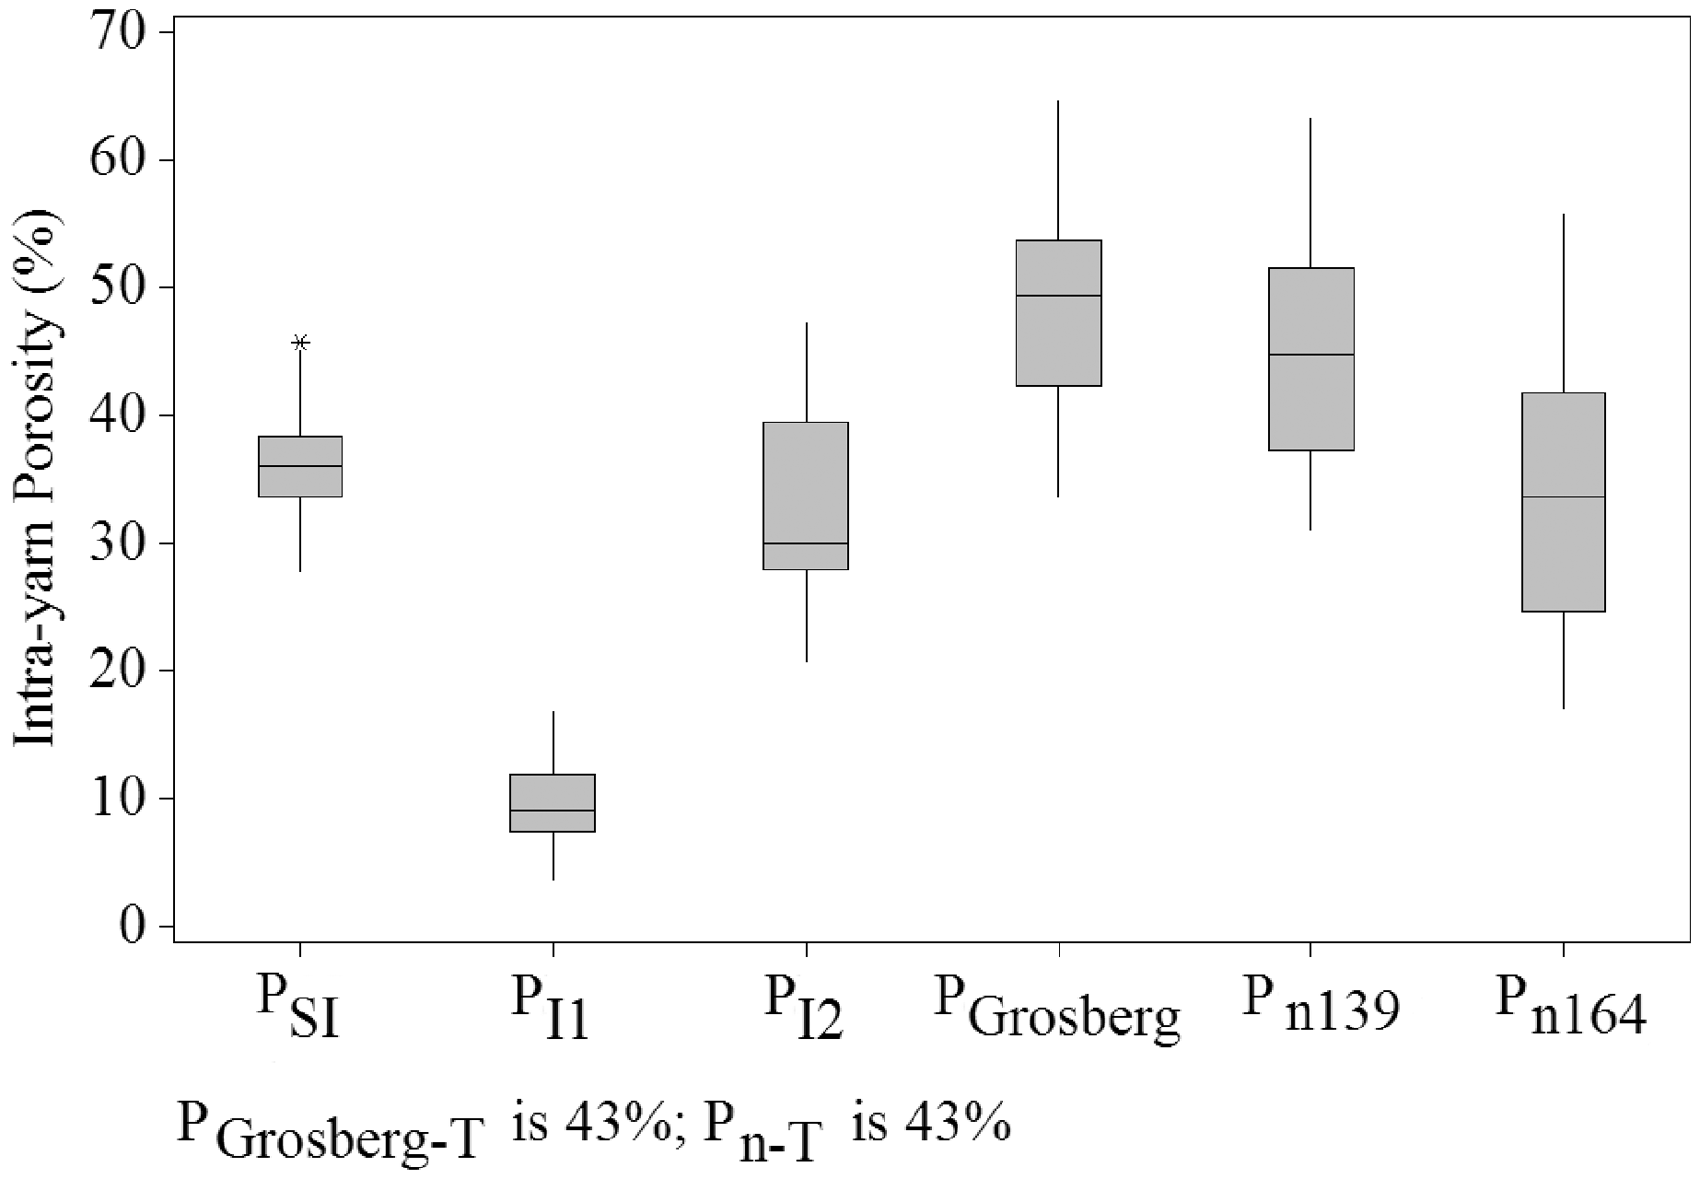
In conclusion, in terms of correlation coefficients and confidence intervals, the image analysis method could predict the porosity of the yarn more precisely, rapidly, and objectively in comparison to other methods as every yarn image contained statistical information about the variation in fiber and yarn.
Conclusion
In this study, a new method was developed, based on the image analysis method, in order to estimate inter-fiber porosity, a parameter generally neglected in theoretical studies regarding the permeability and porosity of fabric. Studies were conducted to theoretically estimate the porosity of the yarn using fiber and yarn parameters and all obtained results were compared with experimental results measured using the Stereo Investigator method. Even though care, attention and time were required when conducting section preparation studies, the image analysis method could successfully estimate intra-yarn porosity as variation parameters regarding fiber and yarn were built-in.
Footnotes
Funding
This research received no specific grant from any funding agency in the public, commercial, or not-for-profit sectors.
Acknowledgments
This paper has been produced from Phd. Thesis entitled as “Relationships Between Permeability Properties and Structural-Geometrical Properties of Fabrics” which is carried out at Dokuz Eylül University, Graduate School of Natural and Applied Science.