
Abstract
Polypyrrole was deposited on polyester yarns by vapour phase polymerization technique. Ferric chloride was used as an initiator. In order to determine the effect of the initiator concentration on polymerization process, four different initiator concentrations (0.2, 0.4, 0.6 and 0.8 mol/l) were used. The effect of the initiator in terms of tensile properties, electrical resistivities and morphological properties of the yarns was investigated. The polypyrrole deposited polyester yarns were then weaved in a handloom to form fabric for the investigation of surface resistivity and electromagnetic shielding effectiveness. Scanning electron microscopy, energy dispersive spectroscopy and Fourier transform infrared analyses illustrated that polypyrrole has penetrated into the yarn structure and the highest polypyrrole deposition was obtained at the initiator concentration of 0.6 mol/l. Also, the highest electromagnetic shielding effectiveness value and the lowest surface resistivity were obtained at this concentration.
Keywords
The electromagnetic interference (EMI) problem has emerged as a result of enormous and sophisticated increase in the application of electronic devices and equipments. These electronic devices are transparent to electromagnetic radiation because they consist of plastic materials. Electromagnetic radiation can have a negative effect on the operation of electric devices and human health. Therefore, an efficient system should be developed in order to reduce or eliminate the harmful effect of electromagnetic radiation.
Electromagnetic shielding effectiveness (EMSE) is a notion that shows a shields’ efficiency in terms of decibels. There are three ways to prevent electromagnetic waves. One is the absorption of the wave by the shield, second is reflection and third is transmission. Shielding effectiveness (SE) value is the sum of these three parameters. 1
The achievement of appropriate electromagnetic protection is of vital importance: this can be achieved by introducing conductivity to the shield. In general, textile materials have non-conductive properties. The introduction of the conductivity to a textile material can be performed by two methods: the addition of conductive particles into the textile polymer matrix2-5 or coating the textile material with conductive polymers.6-8 Conductive polymer usage instead of metals for EMI shielding has many advantages such as an absorption dominant shielding property, 8 good processibility, considerably low density, etc. Conductive polymer coated textile substrates can be produced by in-situ chemical, 9 electrochemical 10 and vapour phase polymerization processes.11-13 With the vapour phase polymerization technique, a smooth and thin polymer layer can applied onto the material surface. In addition, the vapour phase polymerization is environmentally favourable, because this technique can eliminate the solvent wastes and effectively suppress the side reactions. 14 Among conductive polymers, polypyrrole (PPy) possess high conductivity, easy synthesis, less toxicological problem and good environmental stability. 15
In this paper, PPy was formed directly on the polyester (PES) yarn surface through vapour phase polymerization. In the first step, PES yarns were impregnated with ferric chloride (FeCl3) in methanol, then they were gently dried by a hot air stream. After the initiator treatment, yarns were sent to the polymerization chamber. The monomer solution was heated around 60°C then the monomer vapour was carried to the polymerization chamber by nitrogen gas. The yarn was transported inside this chamber with a constant speed (2 m/min). At the end of the experimental set-up, a winding machine took the PPy deposited PES yarns onto a bobbin. The PPy deposited yarn specimens were evaluated in terms of tensile, morphological and electrical properties, and then they were transformed into fabric form in a handloom for the measurement of EMSE and surface resistivity. The polymerization process was performed at four different initiator concentrations (0.2, 0.4, 0.6 and 0.8 mol/l) to determine the initiator effect.
Experimental details
Materials
300 denier 44 filament PES yarns were used in the experimental process. All glassware used in the experimental set-up was purchased from Boru-Cam Co
Vapour phase polymerization of PPy
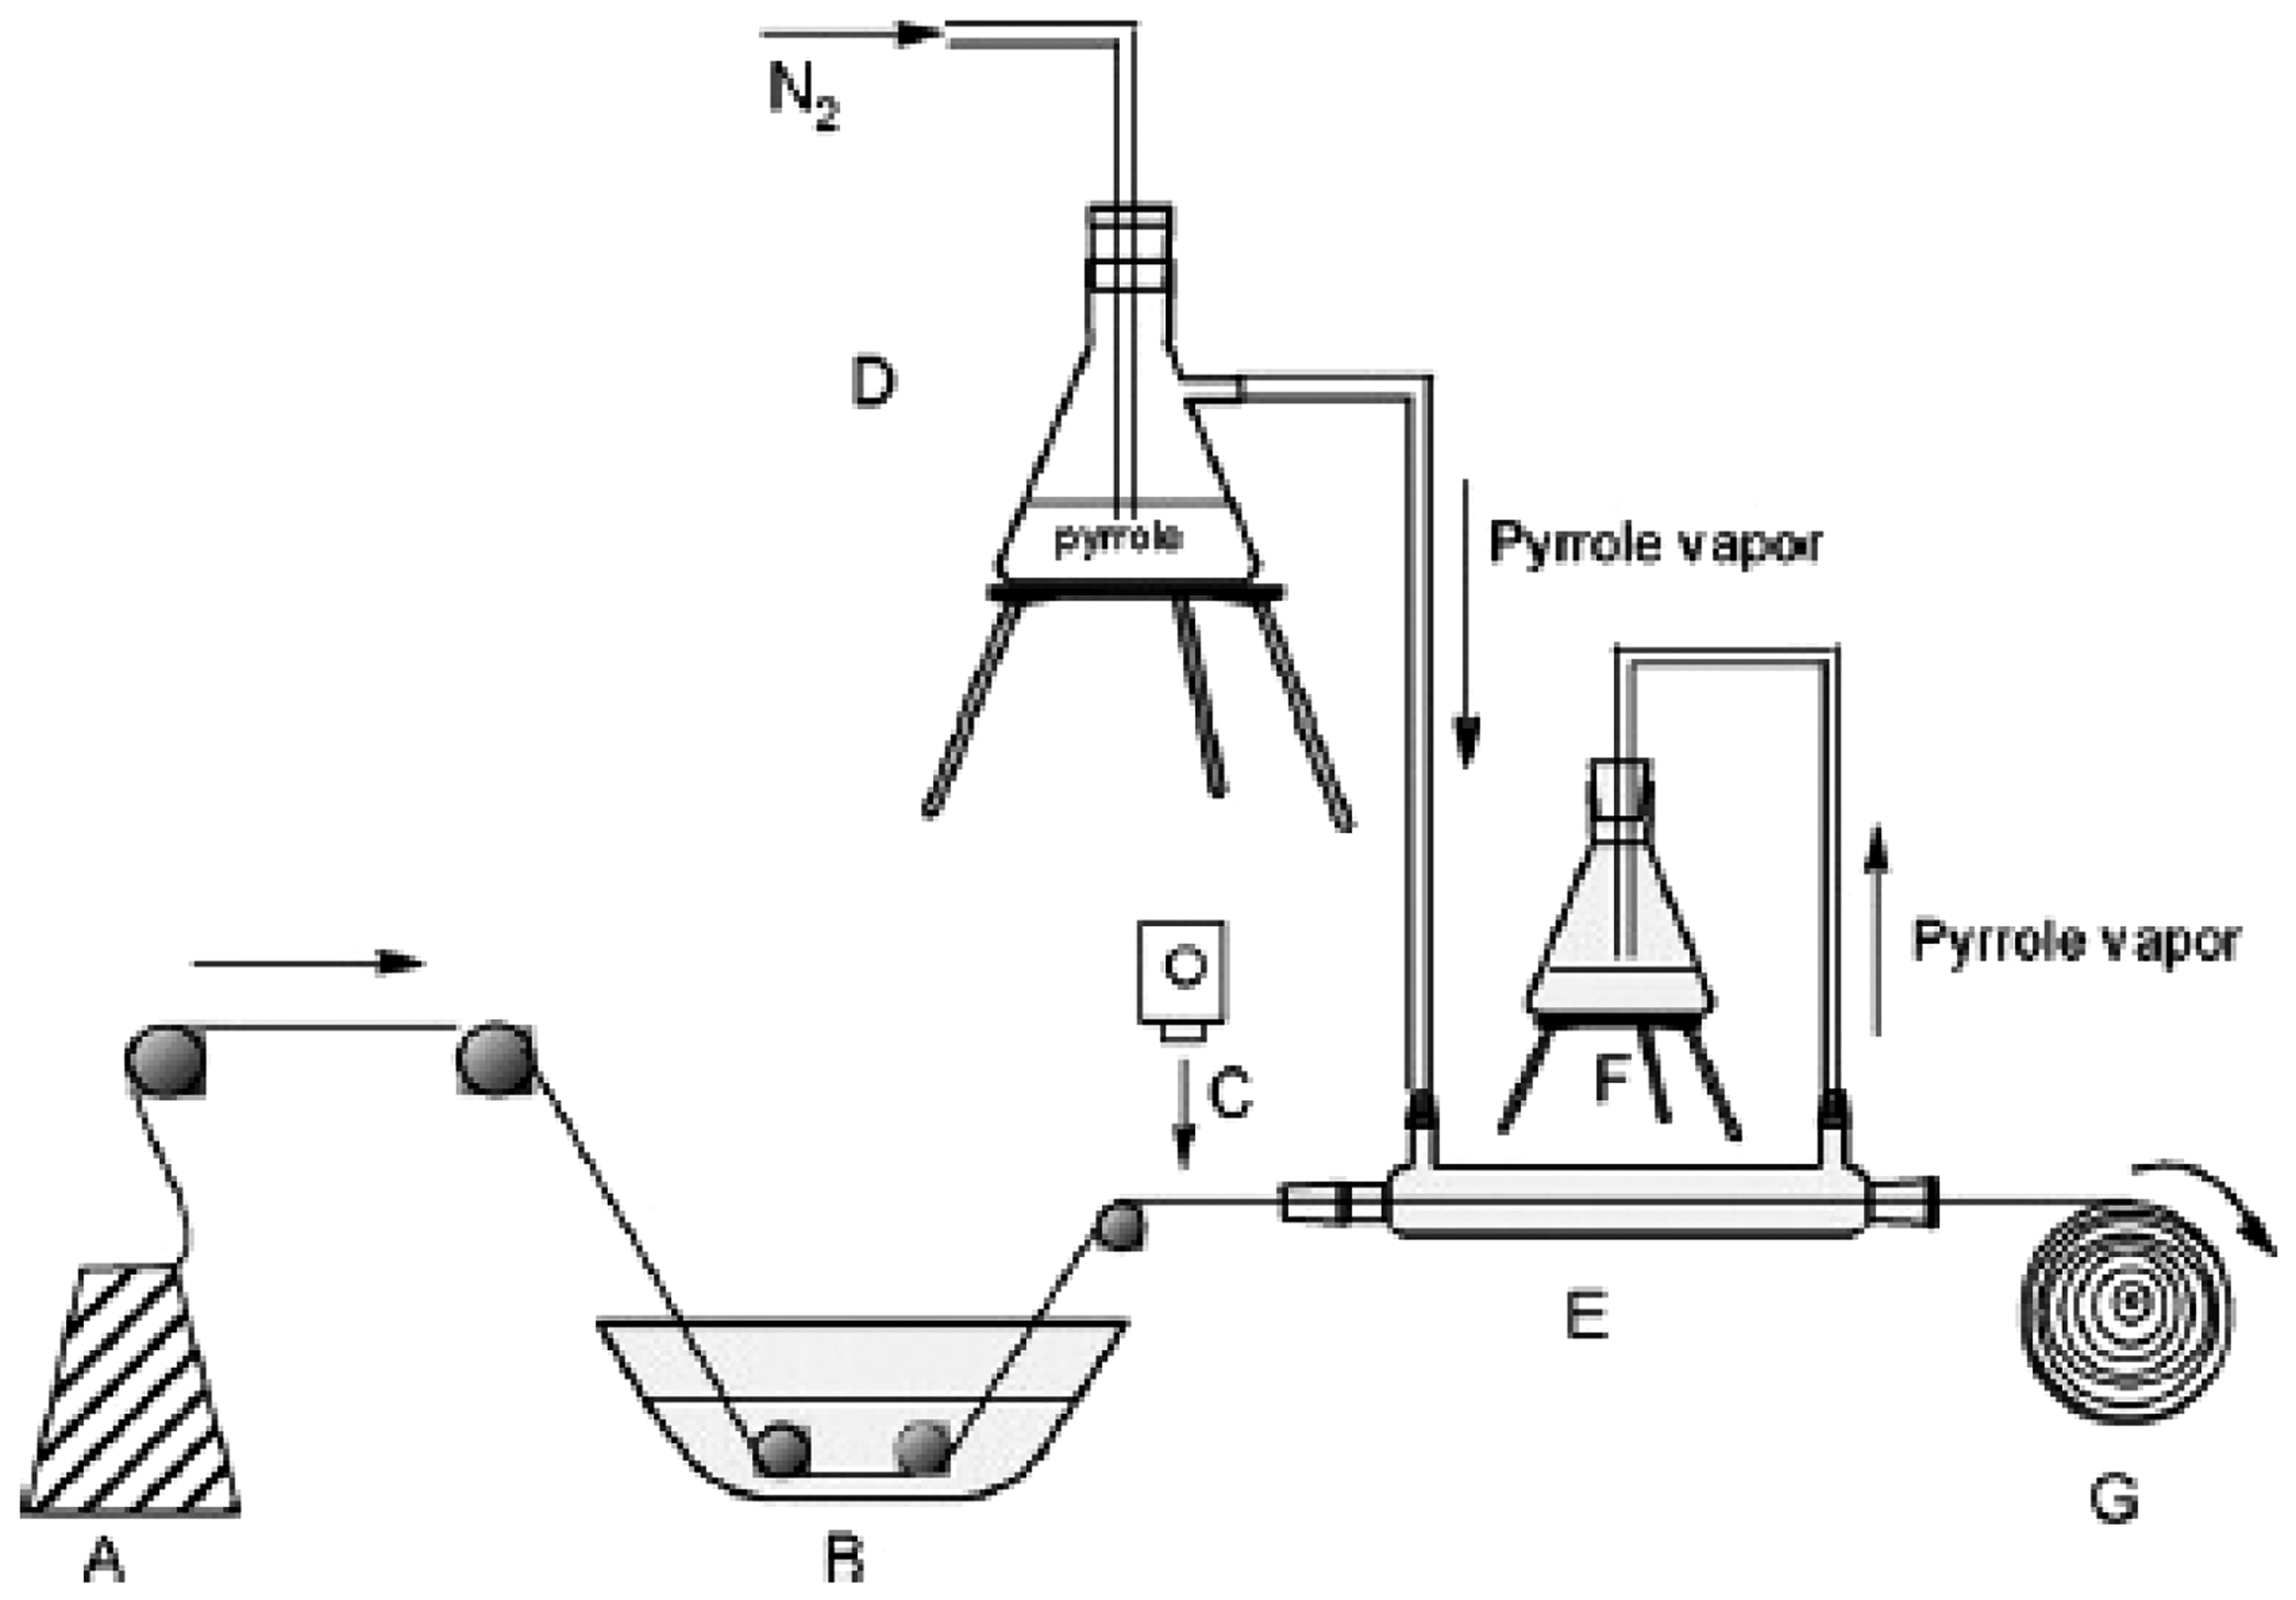
The experimental set-up for the continuous vapour phase polymerization method can be seen in Figure 1. At the beginning of the experimental procedure, PES yarn is unwound from a bobbin (A) at a constant speed of 2 m/min and directed into the glass flask (B) which contains FeCl3 in methanol. The yarn specimens are immersed into this initiator solution then directed to a heat gun (heating temperature is 30°C and the speed of the air is 18 m/min) (C). After the drying process, specimens are sent to the polymerization chamber (E). Pyrrole monomer is situated in a flask (D) and continuously being carried to polymerization chamber with the help of nitrogen gas as an inert atmosphere. At the end of polymerization chamber there is another flask (F) containing distilled water which helps to eliminate non-polymerized pyrrole vapour. The PPy deposited yarn is wound to a bobbin with the help of a winding machine (G) at 2 m/min constant speed.
Experimental set-up.
13
Characterization
Polypyrrole deposited PES yarn specimens were conditioned for 24 h under the standard conditions of 20 ± 2°C and 65 ± 2% relative humidity before the characterization process. The tensile strength of the yarns were measured with an Instron 4411 instrument according to the TS 245 EN ISO 2062 standard. 16 Each test was repeated five times to provide reliability of the result. The electrical resistance of the PPy deposited yarn specimens were measured with a multimeter DL MULT3999D by applying 3.3 g/tex pretension to the yarn. The electrical resistance results were given in two different approaches. First is the difference in electrical resistance depending on the distance between two probes. In this approach, three specimens were taken from different parts of the bobbin in the length of 12 cm. Electrical resistance was measured in every cm range at the same electrode distances for all specimens. Then the average values were measured for the three specimens, respectively. The second approach is the mass specific resistivity, which is given in a previous study, 12 in terms of the FeCl3 concentration. Scanning electron microscopy (SEM; JEOL Ltd, JSM-5910LV), energy dispersive spectrometry (EDS; Oxford Industries, INCAx-sight 7274) and Fourier transform infrared (FTIR; Perkin Elmer Spectrum, 100 ATR-FTIR) spectroscopy were employed for spectral characterization.
The thickness of the PPy deposition on the yarn surface was measured in the ImageJ programme by using the SEM cross-section images. The deposition amount from five different filaments in a cross-sectional image was measured, and then the average value and standard deviation were calculated for each initiator concentration. An example to the measurement method can be seen in Figure 2 with red arrows.
Cross-section of PPy deposited PES fibre at 0.6 mol/l FeCl3 concentration. Thickness measurement was performed from the areas indicated by red arrows.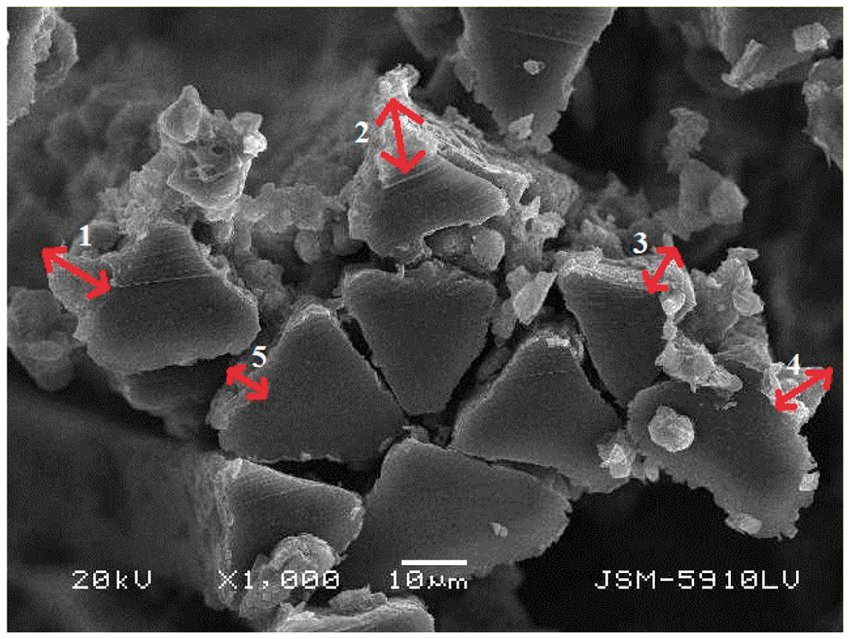
PPy deposited PES yarns were weaved in a handloom in order to measure the surface resistivity and EMSE. A Keithley 6517A Electrometer/High Resistance Meter instrument was used to determine the surface resistivity of the fabrics according to the ASTM D257-07 standard.
17
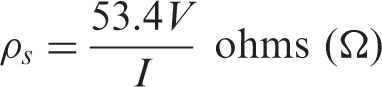
Surface resistivity is measured by applying a voltage potential across the surface of the specimen, measuring the resultant current and then performing the following calculation:
By using the ASTM D4935-10 standard,
18
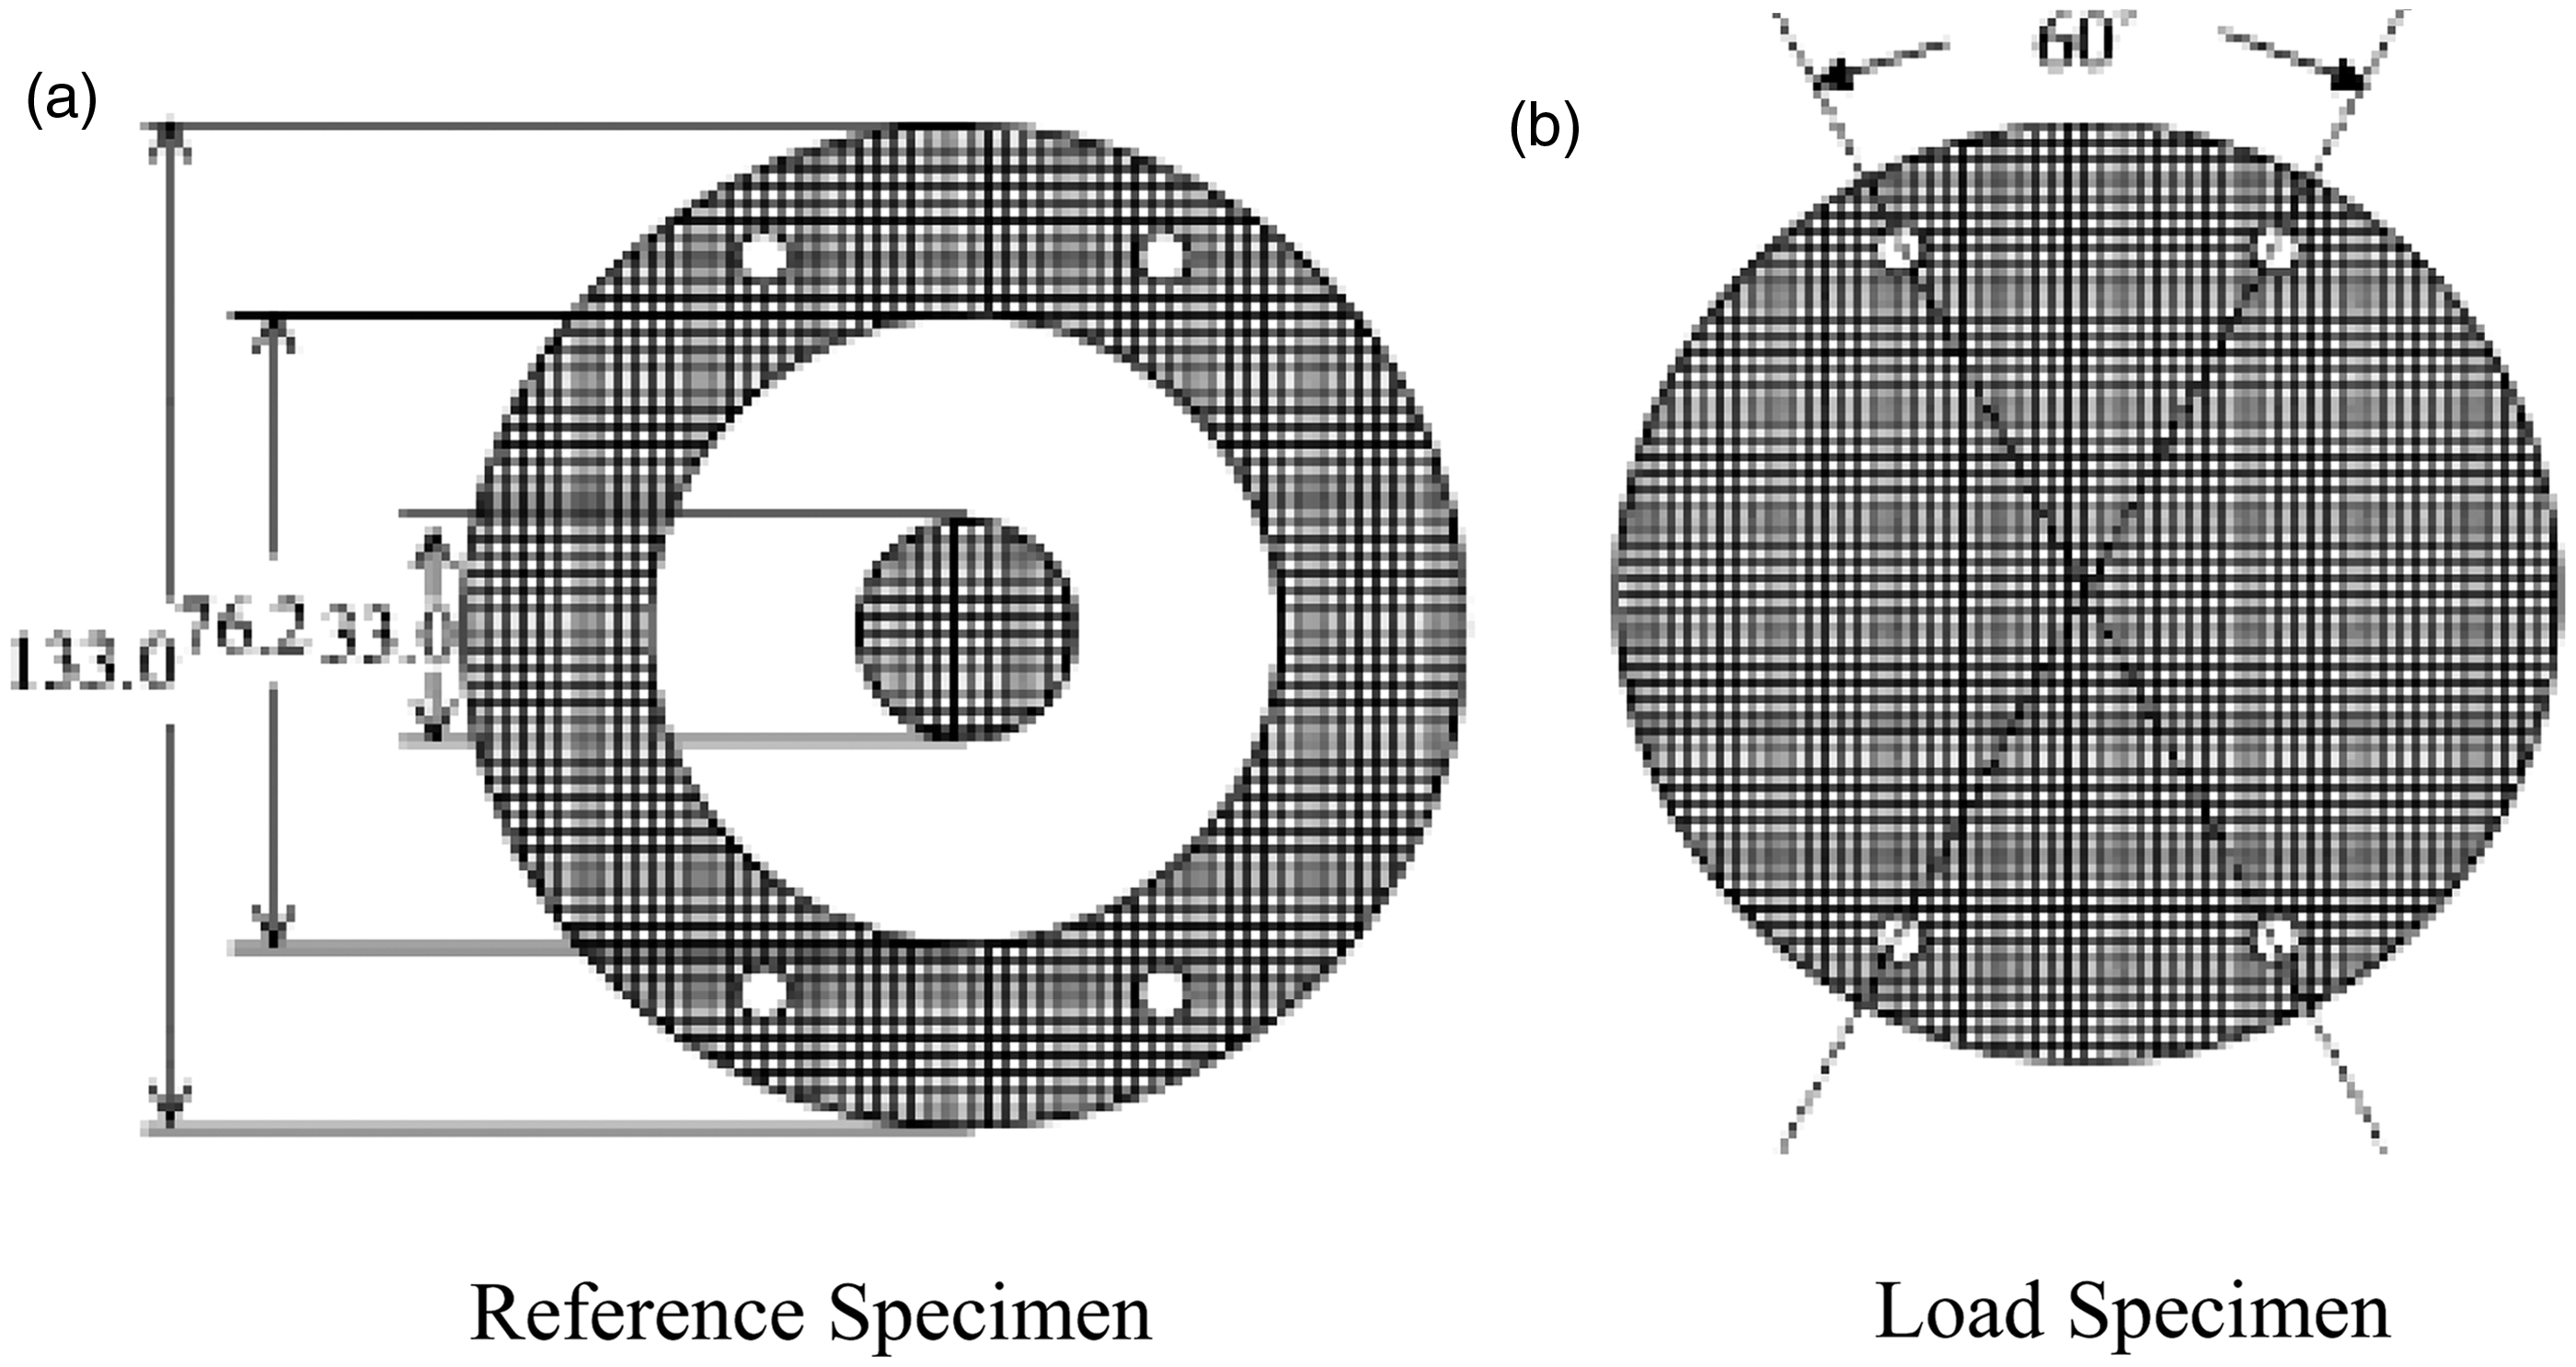
A Network Analyzer instrument (ROHDE&SCHWARZ) was used for the measurement of EMSE values of the fabrics. The coaxial transmission line method (Figure 3) was used to measure the SE of the specimens. At first a gold-filmed reference specimen was used for the calibration. This calibration specimen shows certain SE values at certain frequencies, for instance it shows 32 dB SE value at 200 MHz. After calibration process, specimens are prepared with the standard test size of various thicknesses as shown in Figure 4. SE is determined by first taking a measurement of the received power with a reference specimen (Figure 4(a)), which is in the diameter of 133 mm of the outer ring in the test fixture. The load specimen (Figure 4(b)) is then fastened into the fixture and another received power measurement is taken. The SE in decibels is determined by using the following equation:
A typical coaxial transmitter for EMSE testing. Specimen dimension for reference (left) and load test (right) ASTM D4935 (unit: mm).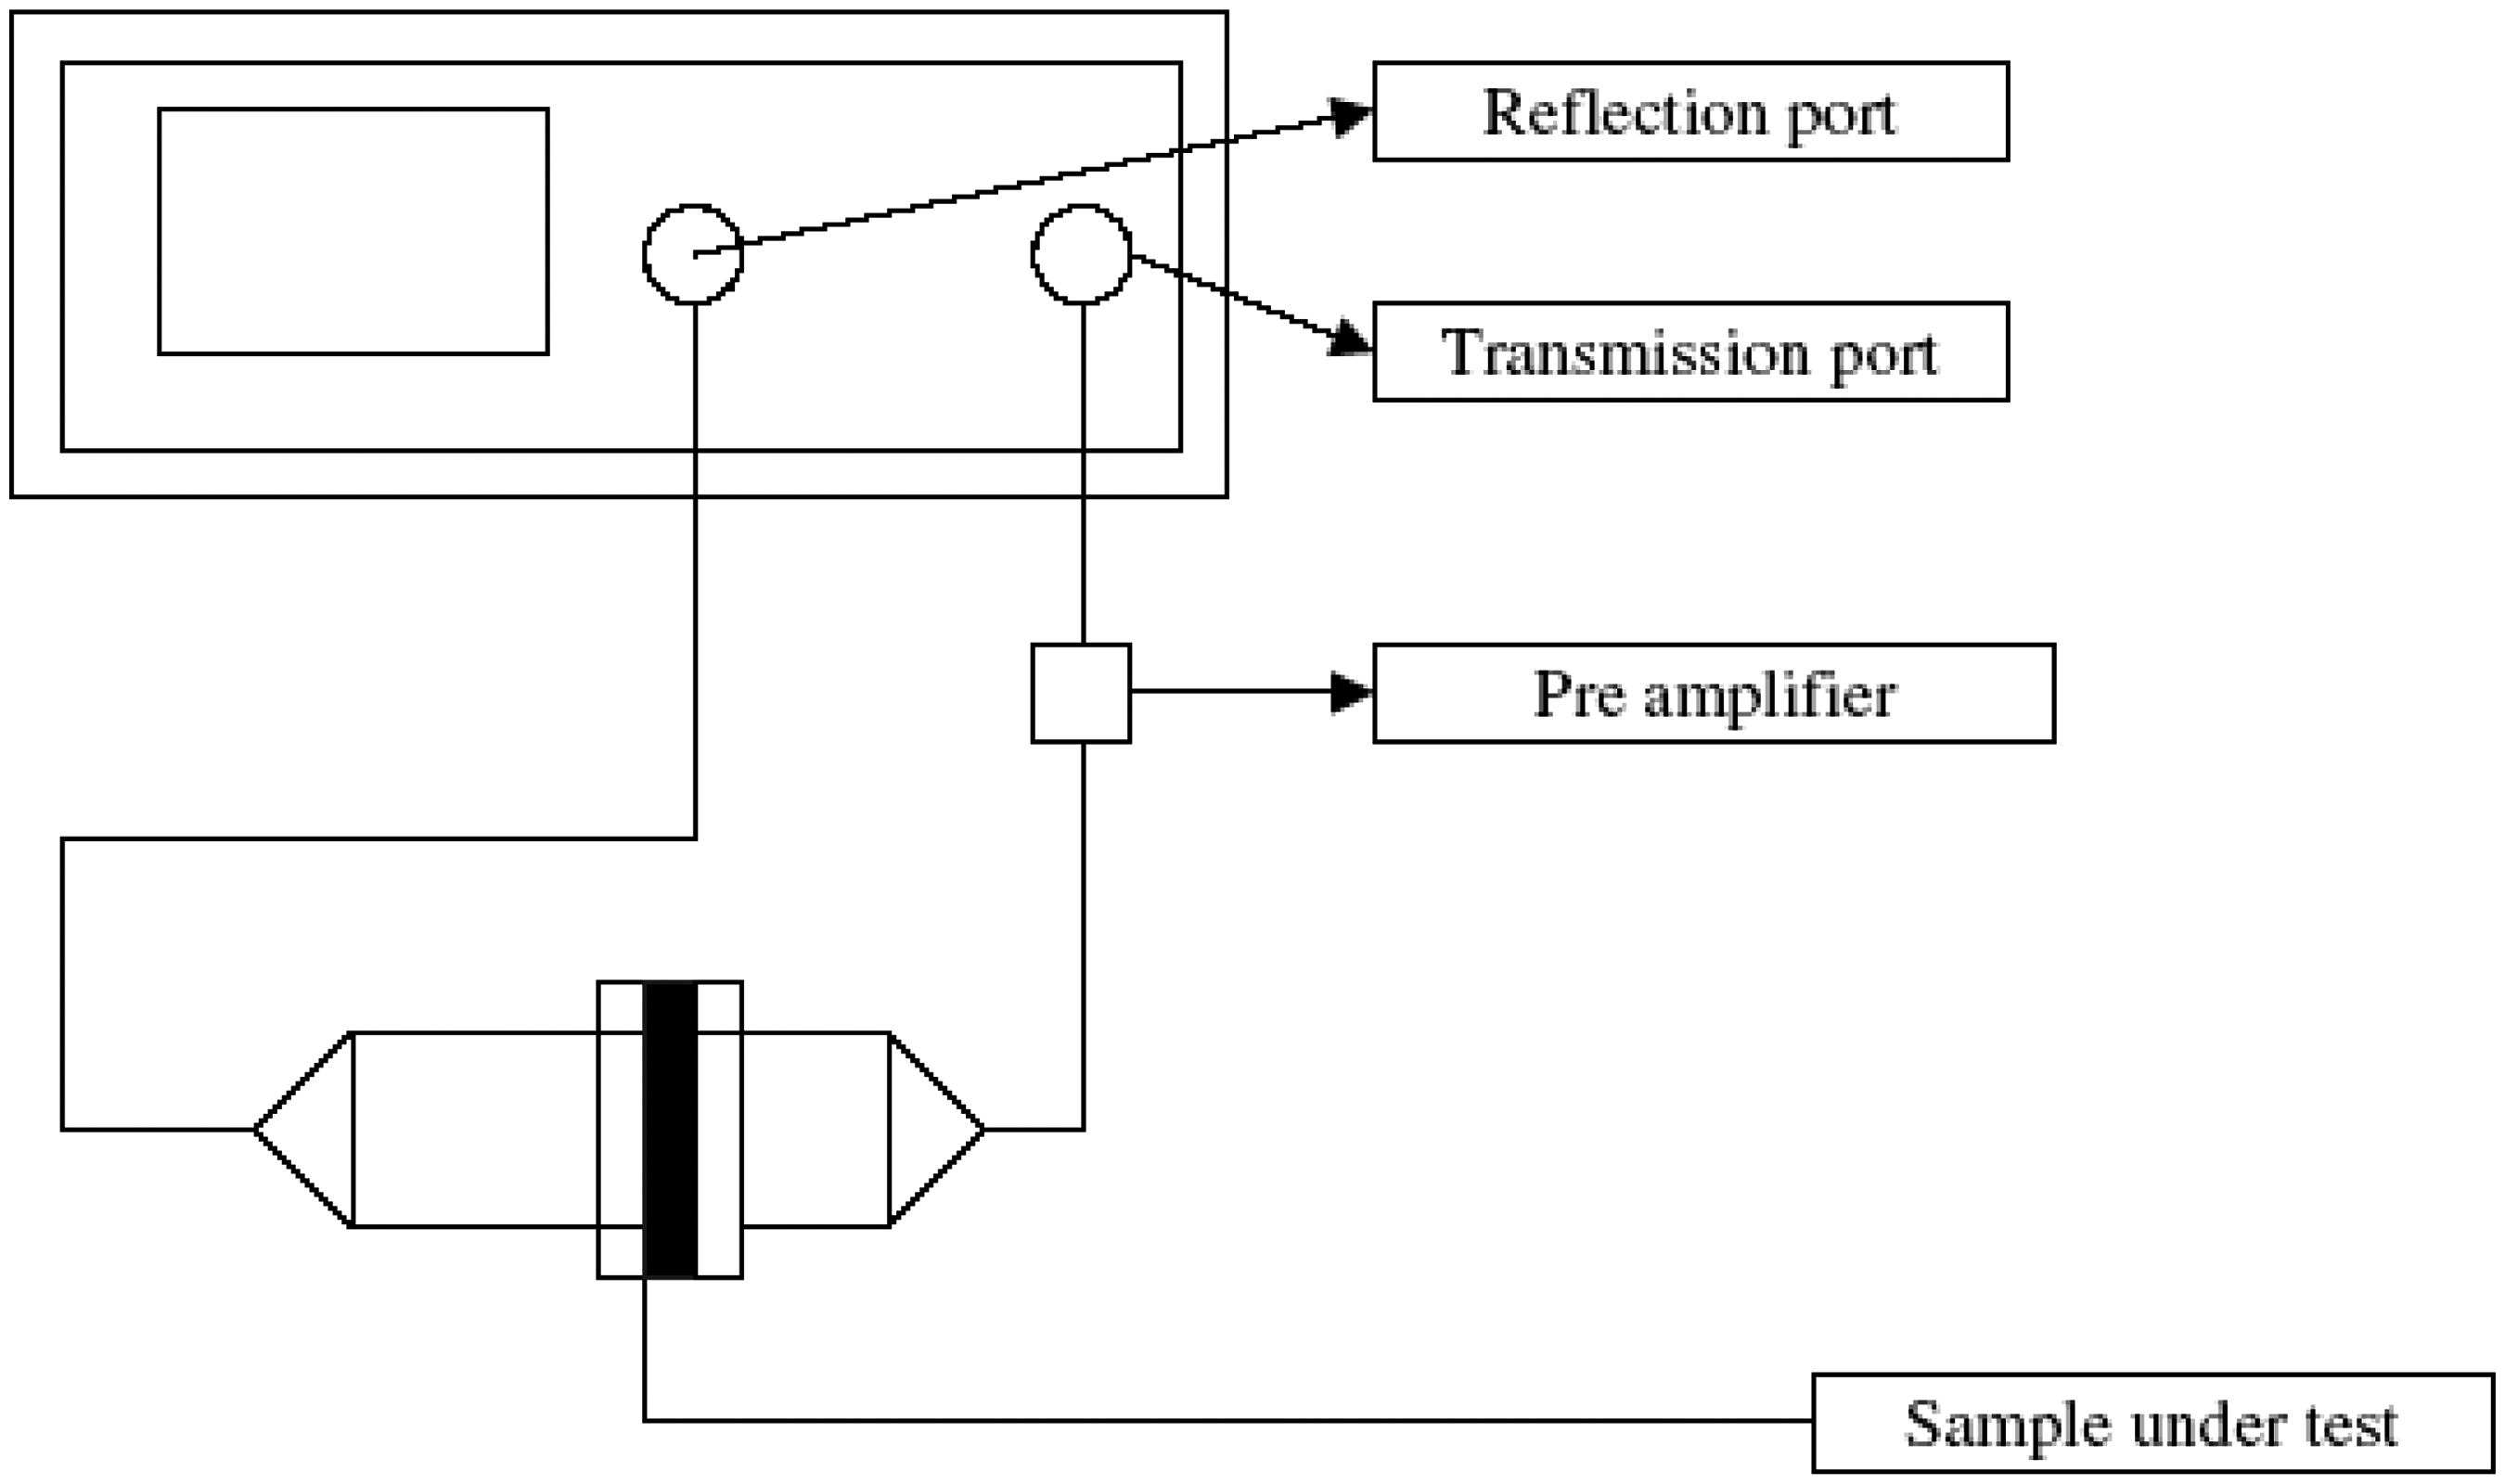

Results and discussion
Tensile properties of PES yarn specimens as a function of FeCl3 concentration
The effects of FeCl3 concentration on tensile strength and elongation at break values for both treatment with FeCl3 and after PPy deposition can be seen in Table 1 and with R2 values in Figure 5. Accordingly, with 0.2 mol/l FeCl3 treatment, the yarn tenacity was decreased then as the 0.4 mol/l concentration increased, and finally with the addition of more FeCl3, the tenacity was decreased gradually. This decline is caused by the excess Fe ions which are not participating to the polymerization process.
(a) Yarn tenacity and (b) yarn elongation values with correlation coefficients depending on the initiator concentration. The average (Avg) and standard deviation (SD) of yarn tenacity and elongation values for both treatment with FeCl3 and after polypyrrole (PPy) deposition in various FeCl3 concentrations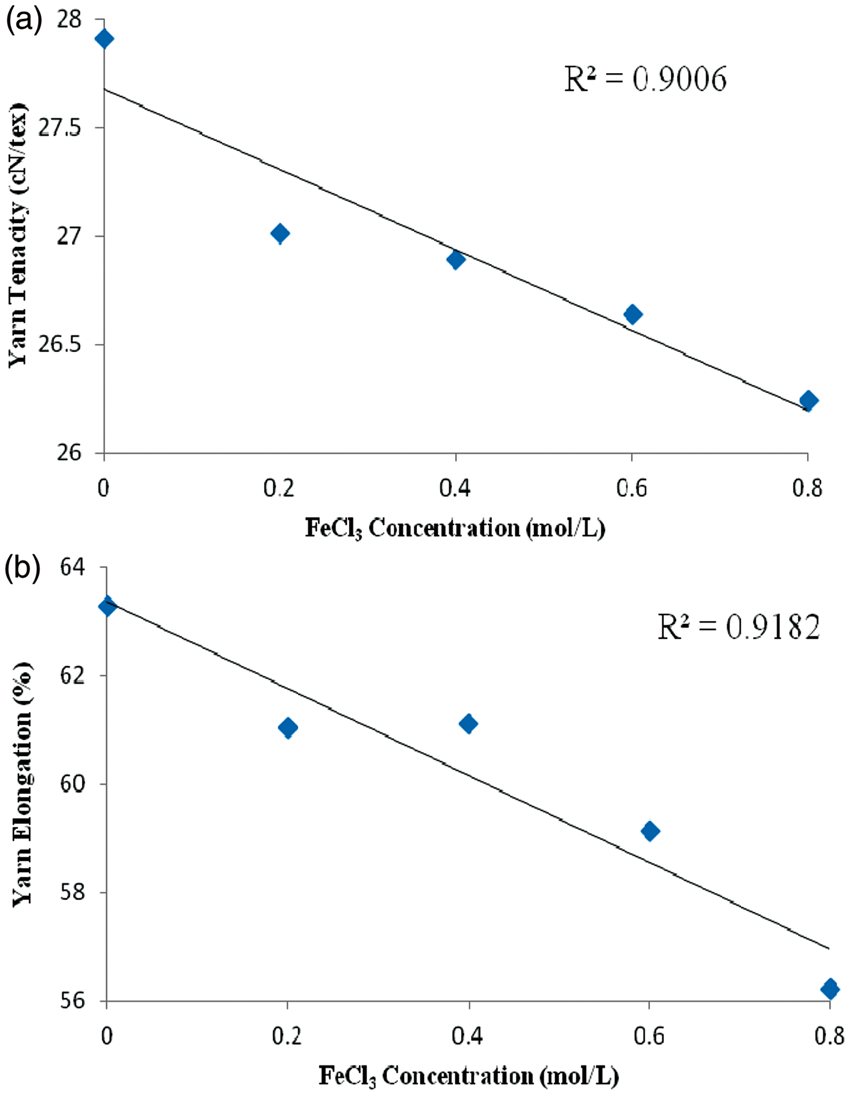
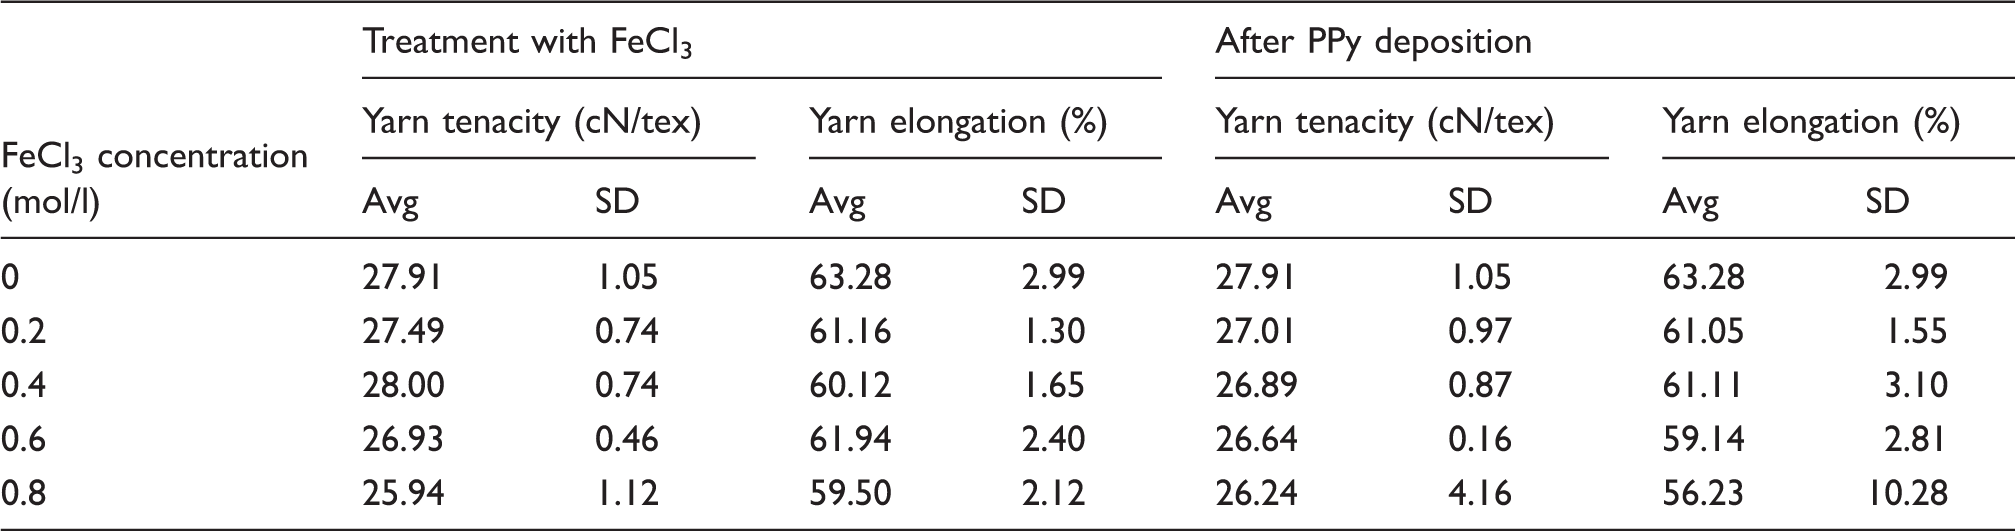
In terms of the yarn elongation it can be seen that after PPy deposition the elongation was decreased generally. Only at the concentration of 0.6 mol/l FeCl3 addition, the elongation was increased a little. The reason of the decrease in yarn elongation percentage after PPy deposition is that PPy is a brittle polymer. As it can be seen in Table 1 yarn elongation was decreased generally with the increment of FeCl3 concentration.
The effects of FeCl3 concentration and PPy on electrical resistance of PES yarns
Mass specific electrical resistivities of PPy deposited PES yarn specimens at various initiator concentrations can be seen in Figure 6. According to this figure it can be said that the lowest mass specific electrical resistivity, in other words the highest conductivity, was obtained at the 0.6 mol/l FeCl3 concentration. After the optimum level of 0.6 mol/l initiator concentration, with the increase of concentration, resistivity also increases. This result occurs depending on the over-oxidation of the yarn which leads the formation of carbonyl defects on the PPy backbone. Carbonyl defects cause interruptions in the π conjugation and act as electron withdrawing groups, inhibiting charge transfer, thus reducing conductivity. This can explain the resistivity increase at the 0.8 mol/l initiator concentration.19,20
Mass specific electrical resistivities of PPy deposited PES yarn specimens in various FeCl3 concentrations.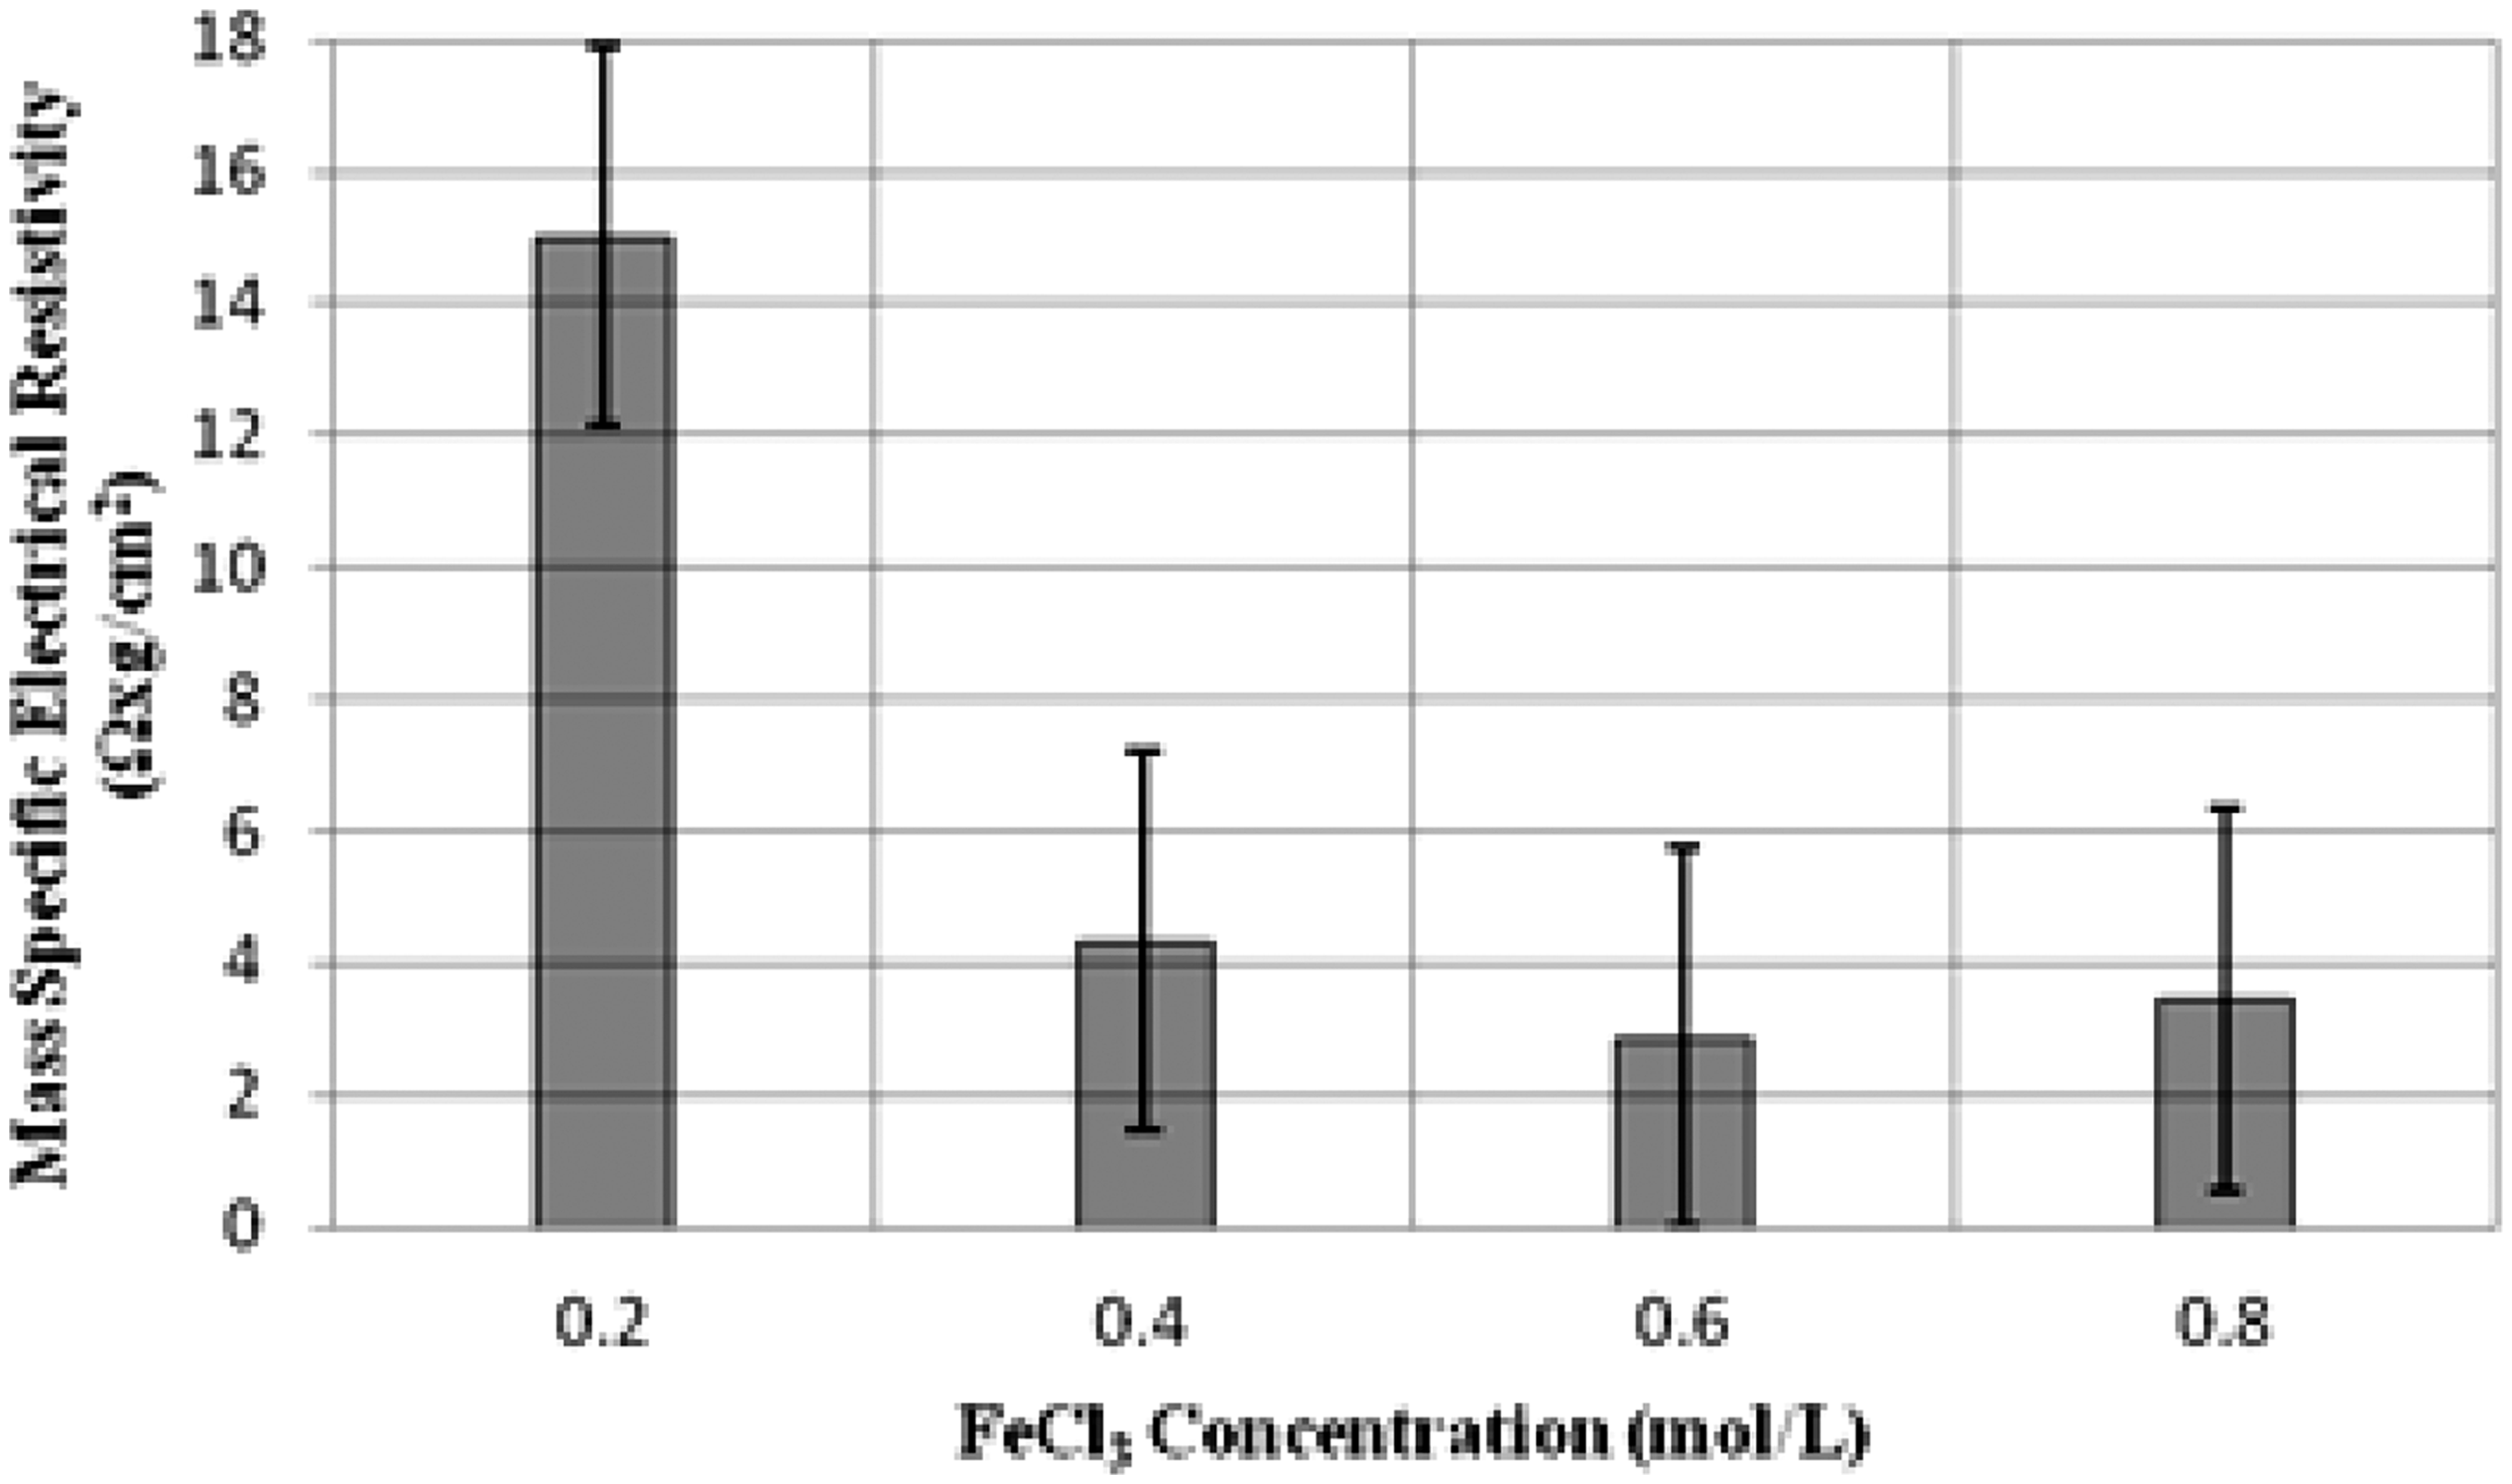
Figure 7 shows the electrical resistance values of the PPy deposited PES yarns depending on the electrode distance in various FeCl3 concentration. The correlation coefficients between the electrode distance and electrical resistance are very close to 1. This result indicates that PPy was deposited onto the yarn surface uniformly. So, any point of the yarn surface shows the same electrical property resulting from a homogeneous deposition process.
Electrical resistance depending on the electrode distance at the concentration of (a) 0.2 mol/l, (b) 0.4 mol/l, (c) 0.6 mol/l, (d) 0.8 mol/l FeCl3 after the PPy deposition process.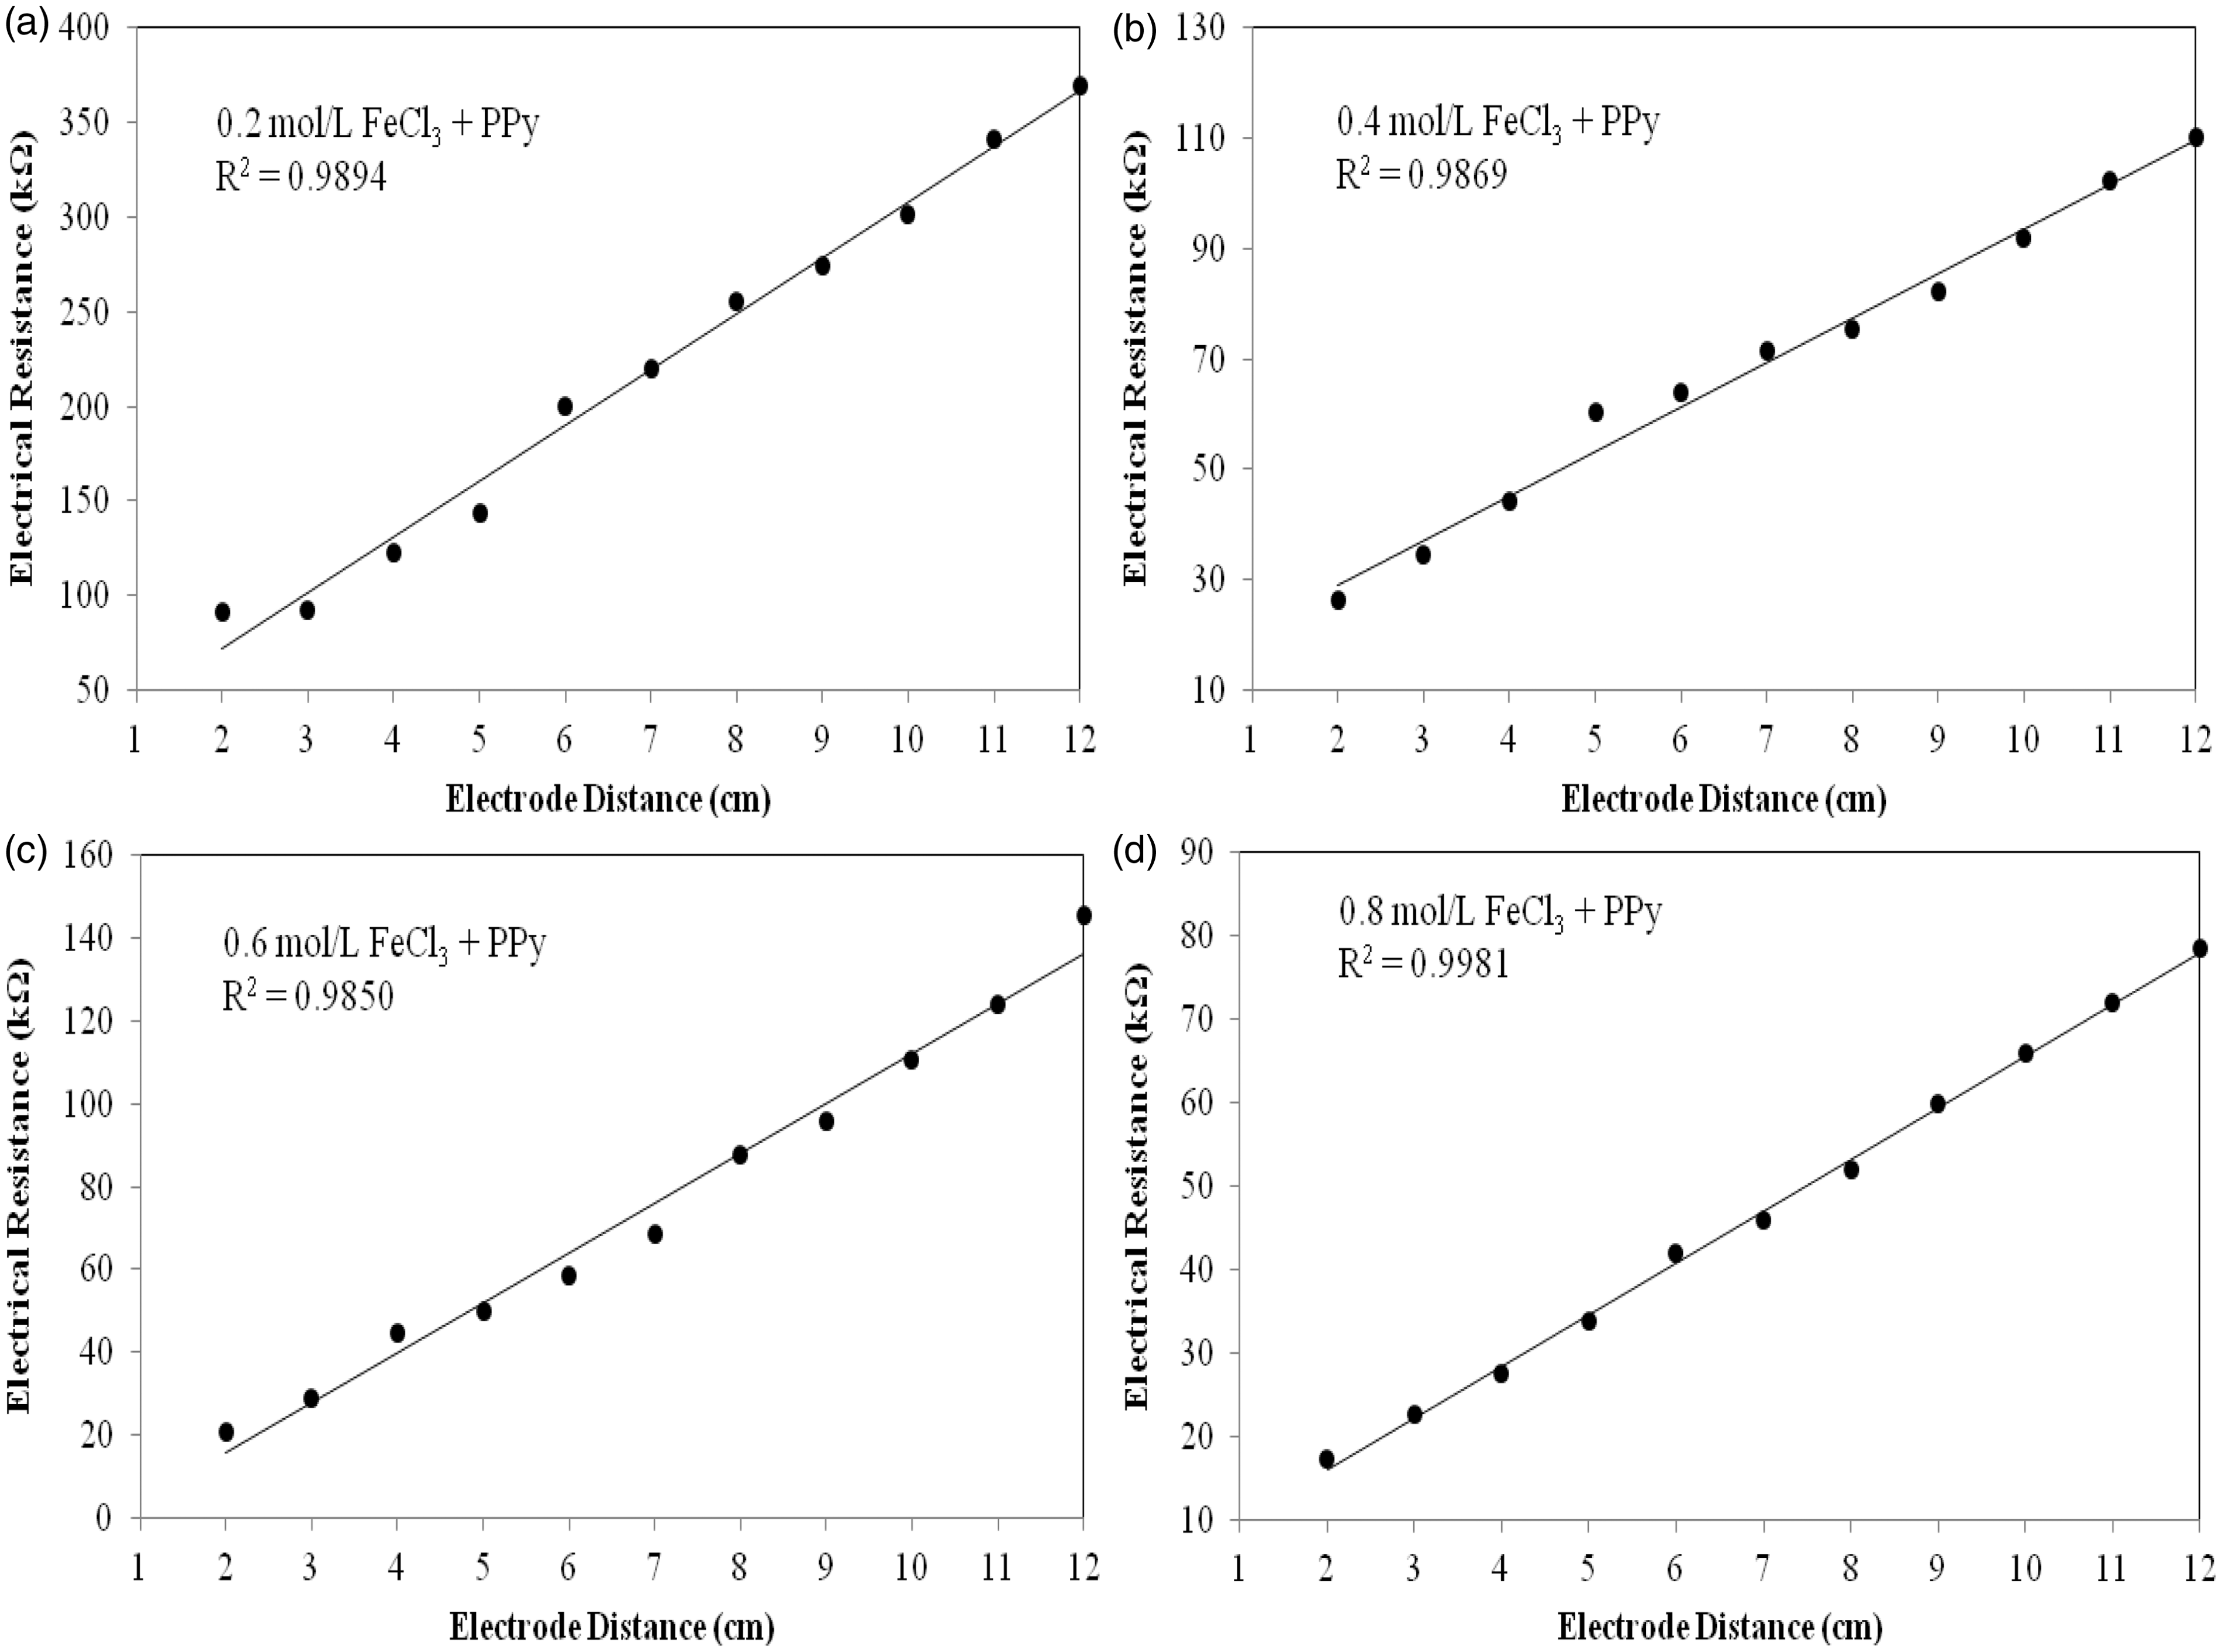
SEM, EDS and FTIR analyses
The morphology of the PES fibres after treatment with FeCl3 can be seen in Figure 8 (magnification × 1000). According to the SEM images, the initiator was well penetrated into the fibre structure. The initiator increment can be noticeable from the SEM images.
SEM images of PES fibres after treatment with FeCl3 at various concentrations (a) 0.2 mol/l, (b) 0.4 mol/l, (c) 0.6 mol/L and (d) 0.8 mol/l.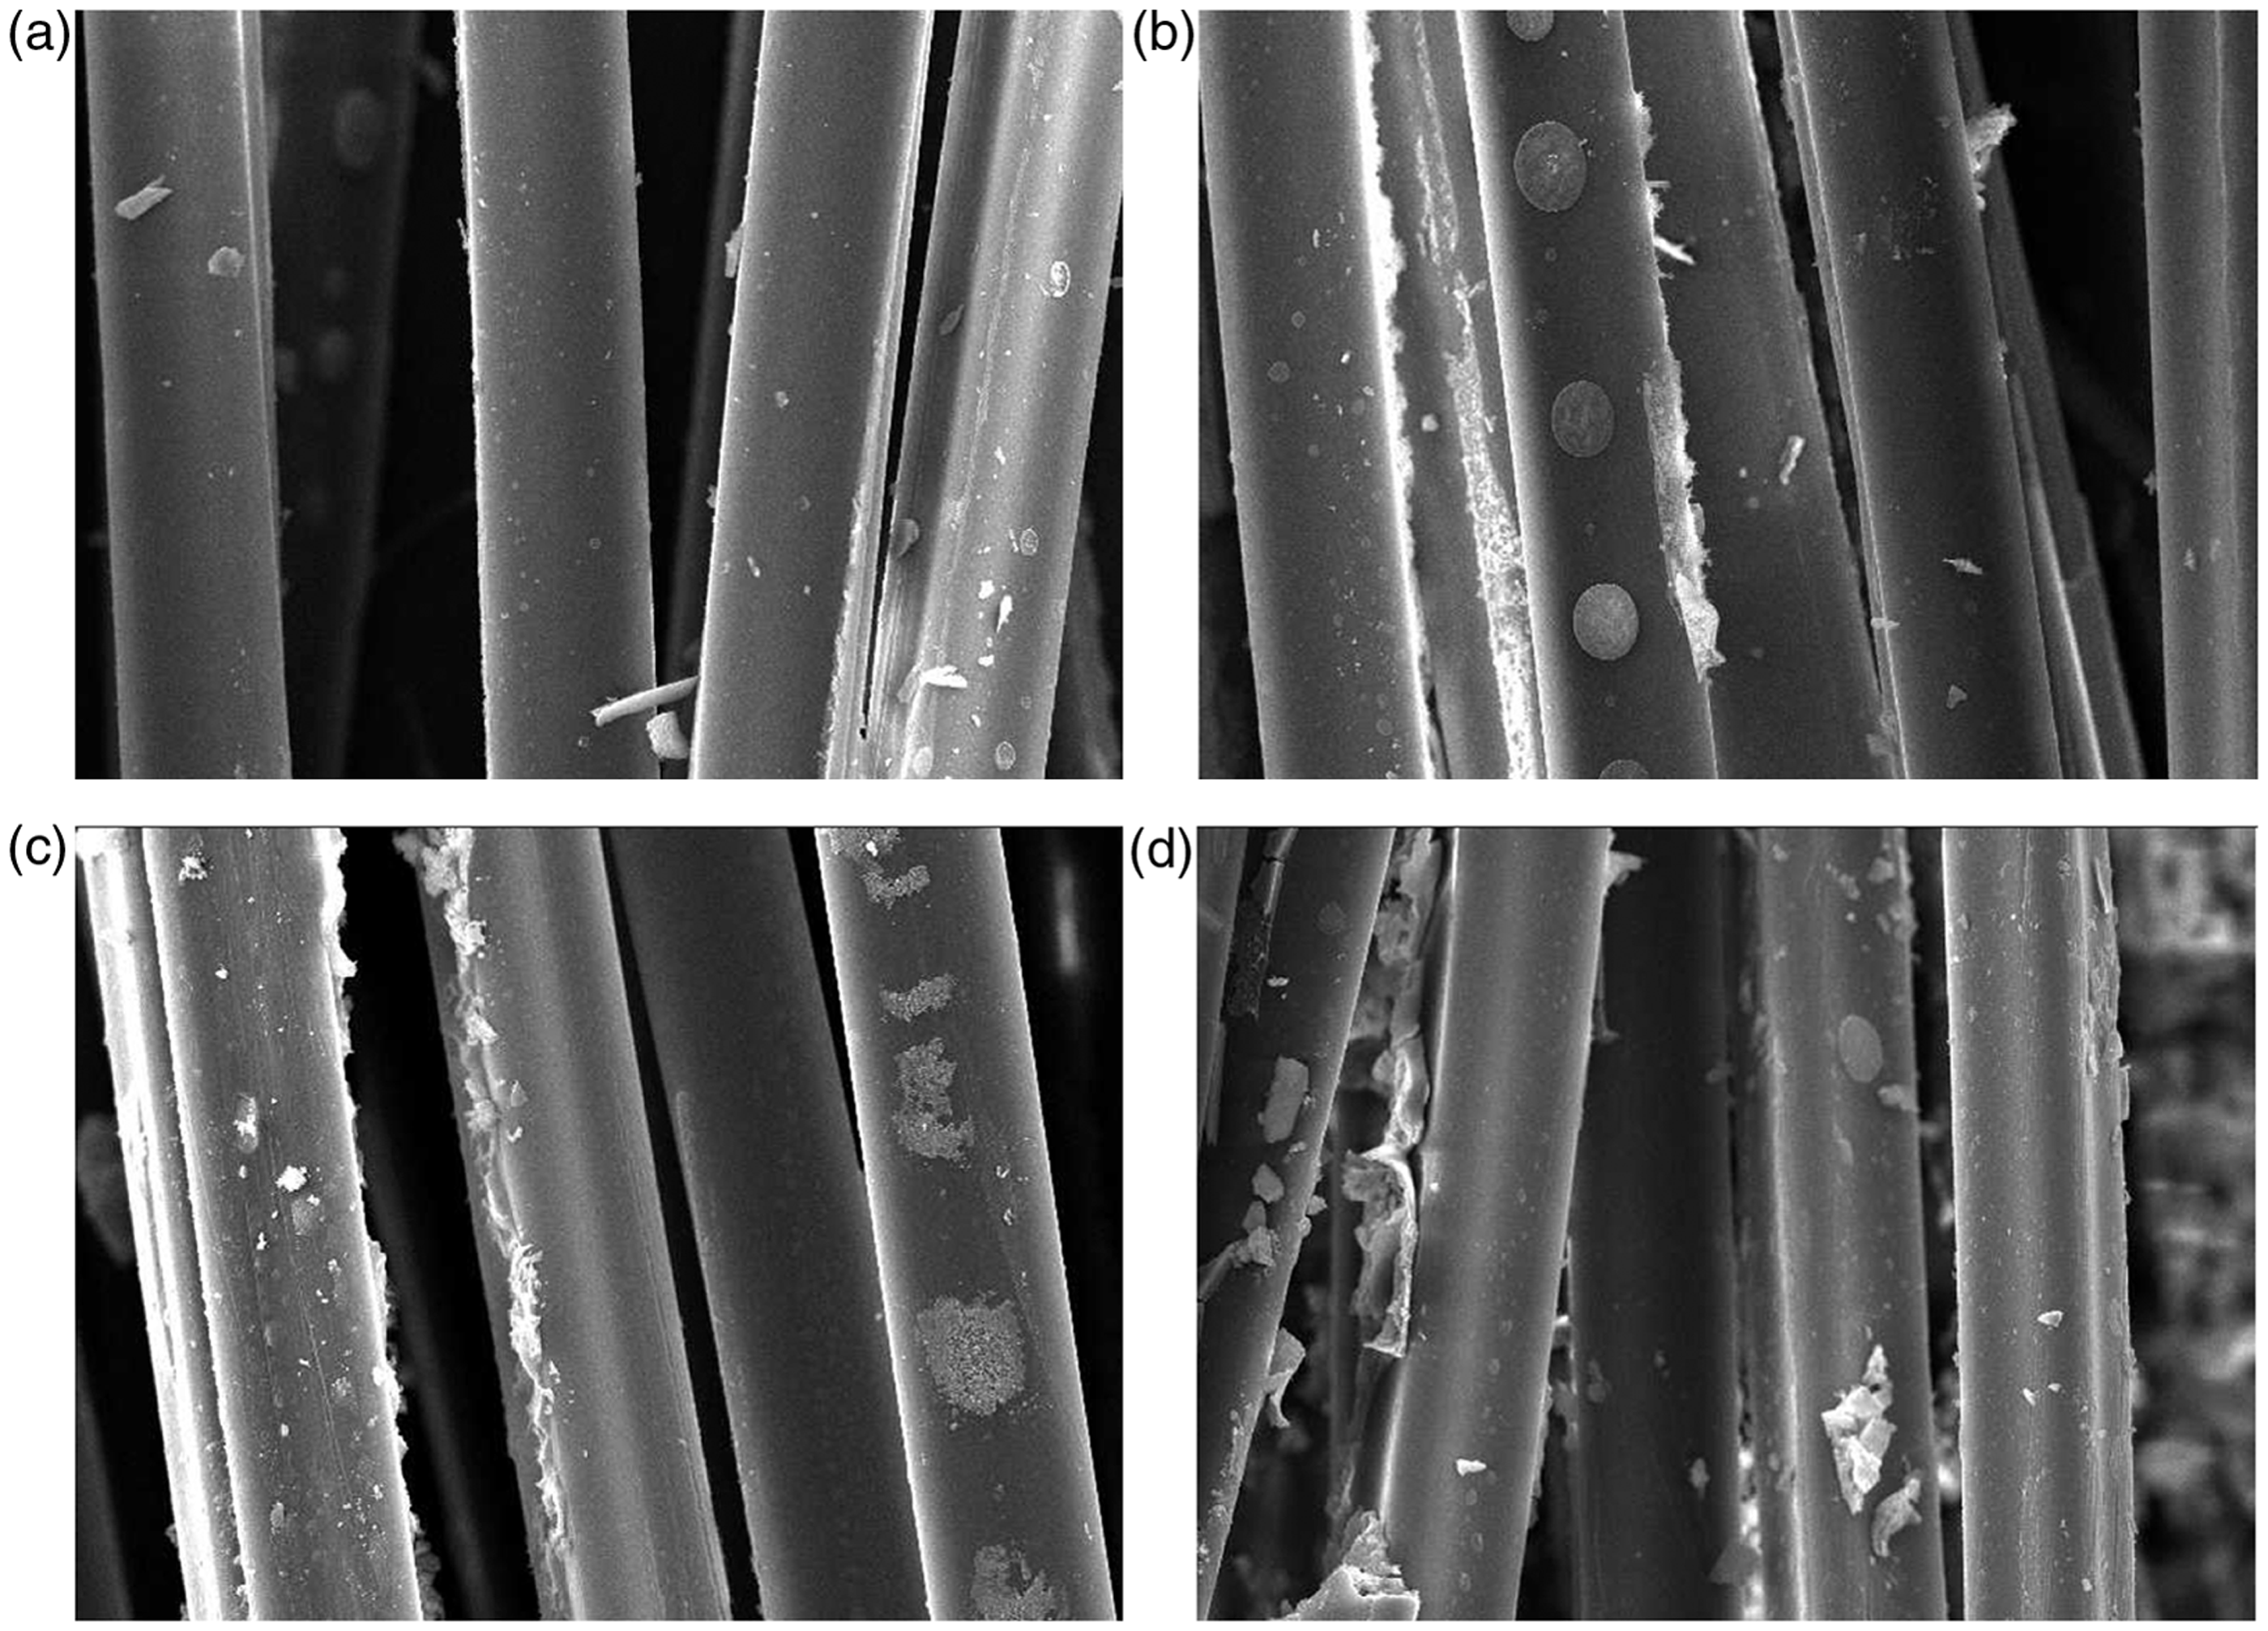
After the PPy deposition process, the morphology of the PES fibres can be seen in Figure 9 (magnification × 1000). SEM images illustrate that the highest PPy deposition occurred at the 0.6 (Figure 9(c)) and 0.8 mol/l (Figure 9(d)) initiator concentrations. In Figure 9(d), there are some substrate redundancies along the fibre surface. These excessive Fe ions affect the total shielding property of the fabric negatively.
SEM images of PPy deposited PES fibres at various FeCl3 concentrations (a) 0.2 mol/l, (b) 0.4 mol/l, (c) 0.6 mol/l and (d) 0.8 mol/l.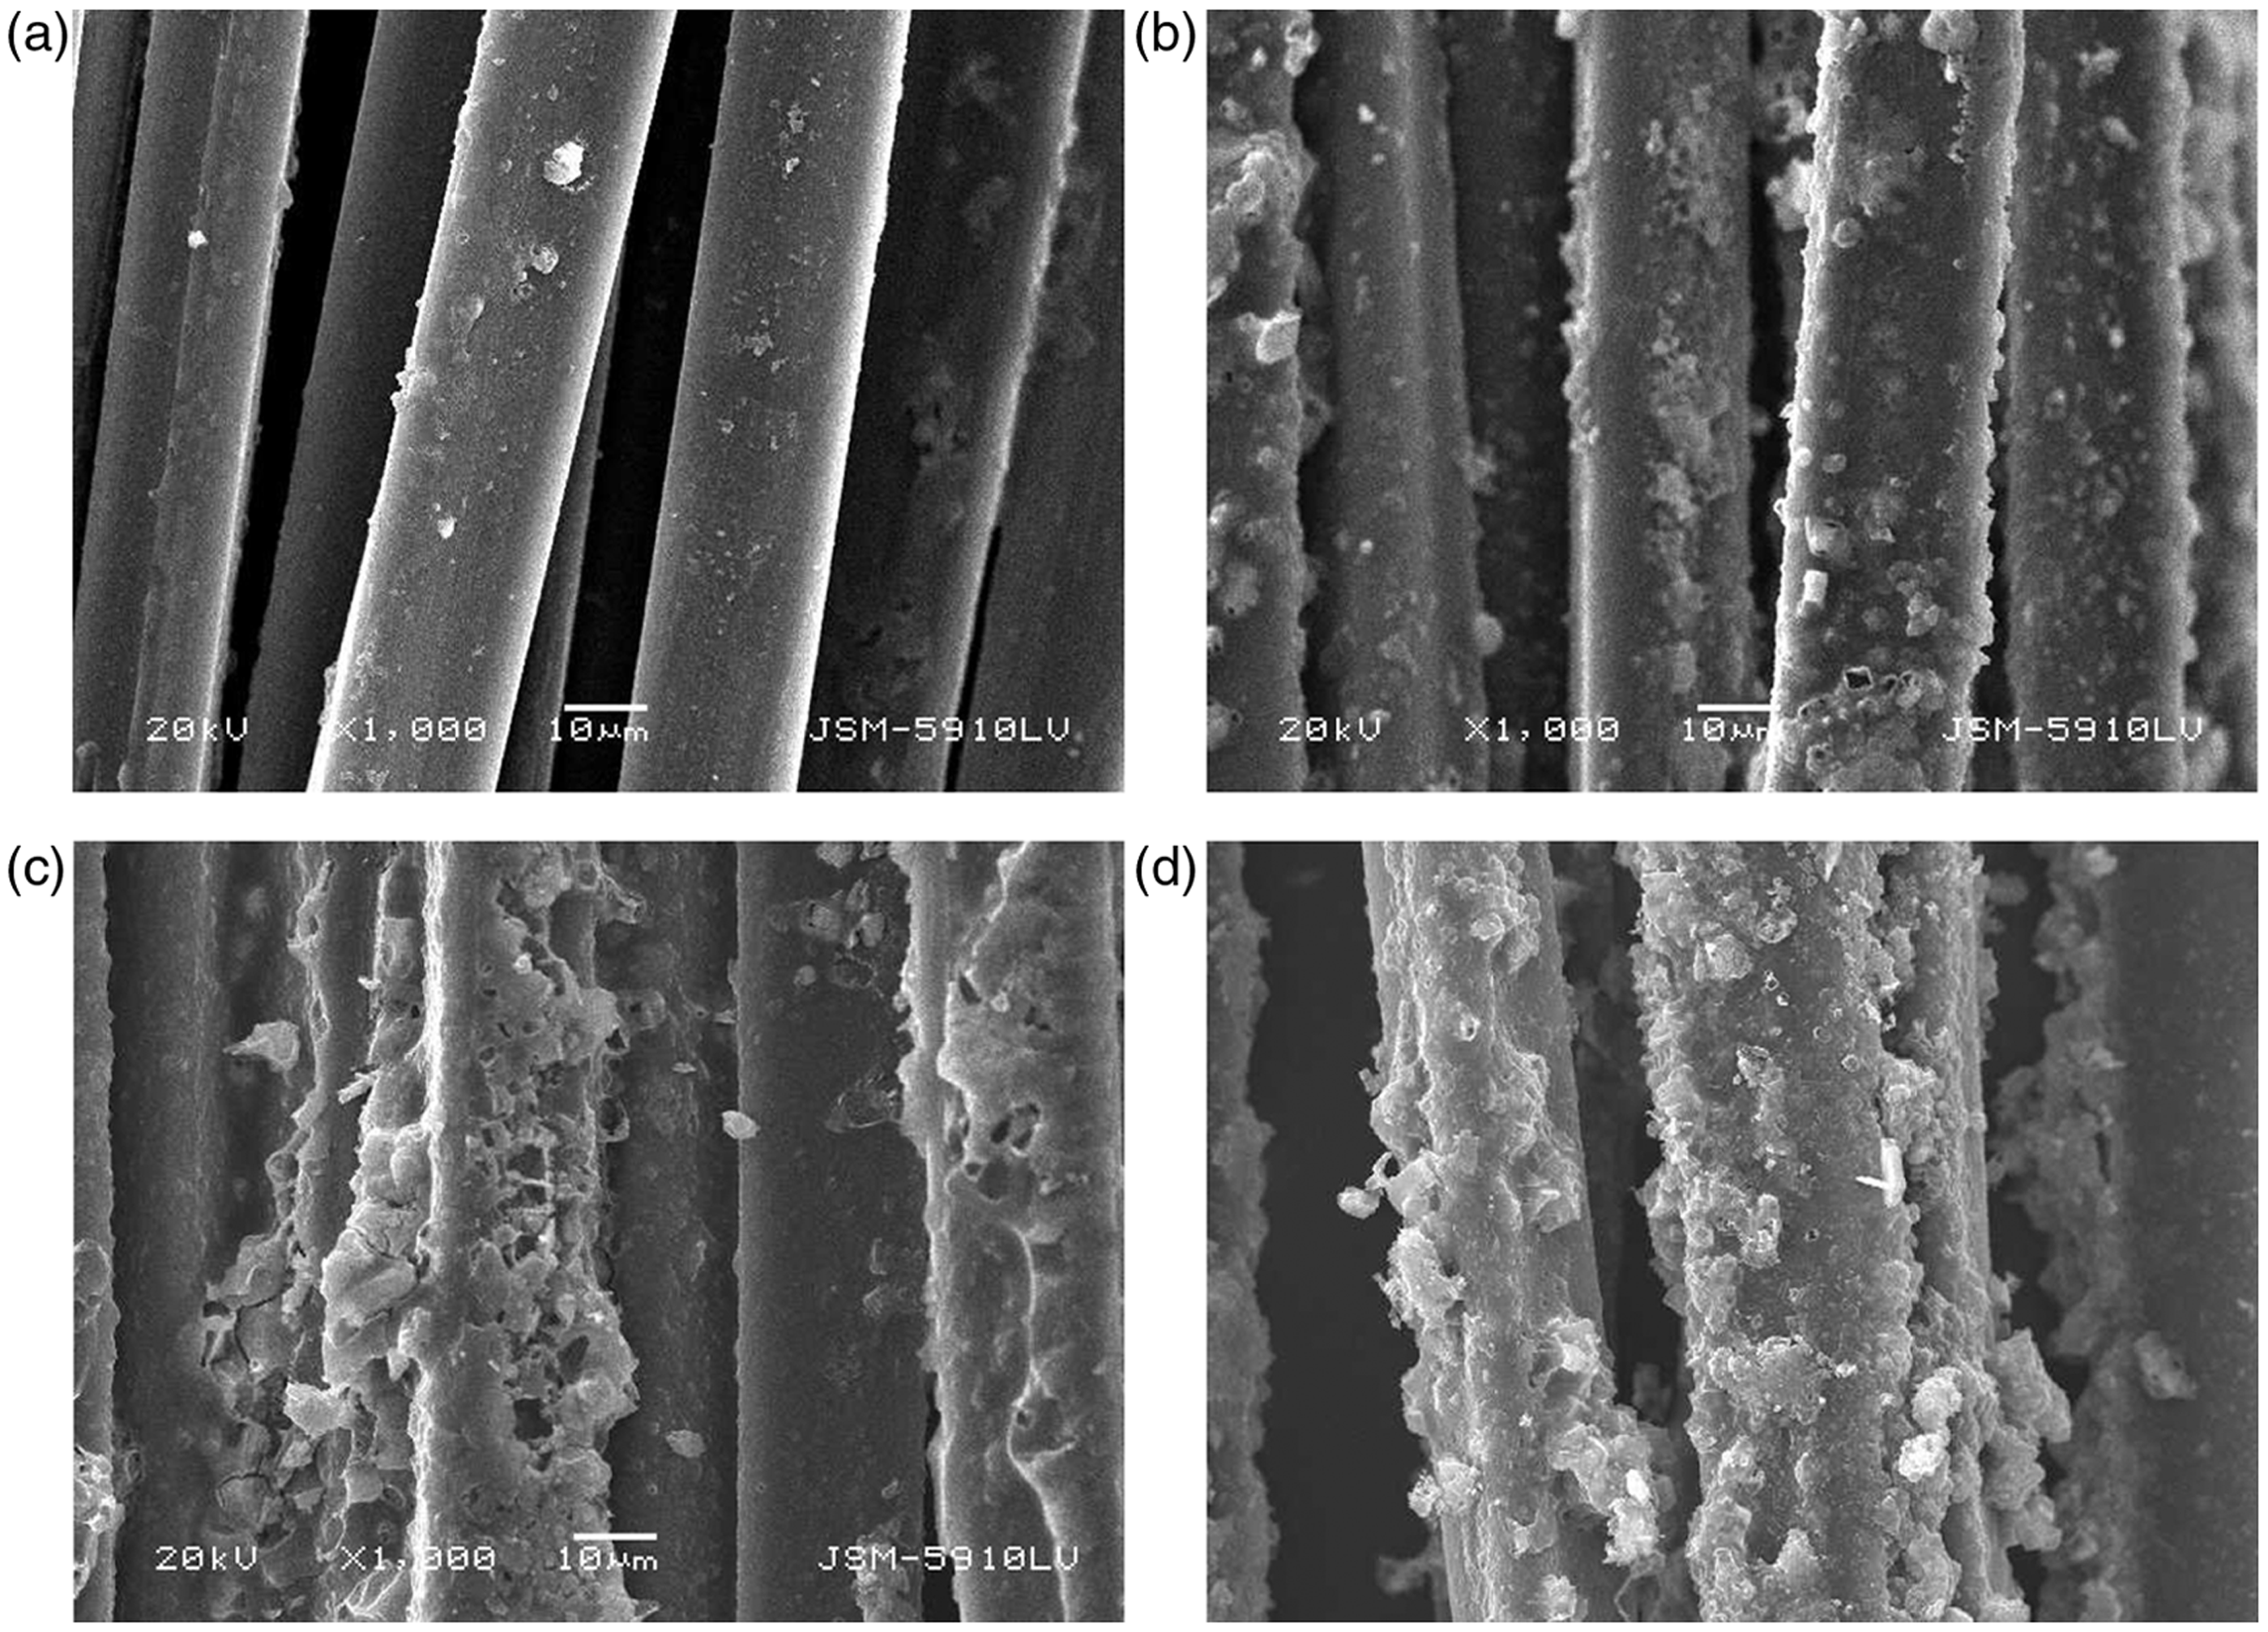
Figure 10 shows the cross-sections of PPy deposited PES fibres at various initiator concentrations (magnification × 1000). At the concentrations of 0.2 and 0.4 mol/l FeCl3, SEM images showed that the PPy layer was not uniform. There were some gaps of uncoated parts in the yarn cross-section. However, at the 0.6 mol/l initiator concentration (Figure 10(c)) the amount of PPy deposition thickness is considerably more uniform than with the other three concentrations.
Cross-sections of PPy deposited PES fibres at various FeCl3 concentrations (a) 0.2 mol/l, (b) 0.4 mol/l, (c) 0.6 mol/l and (d) 0.8 mol/l.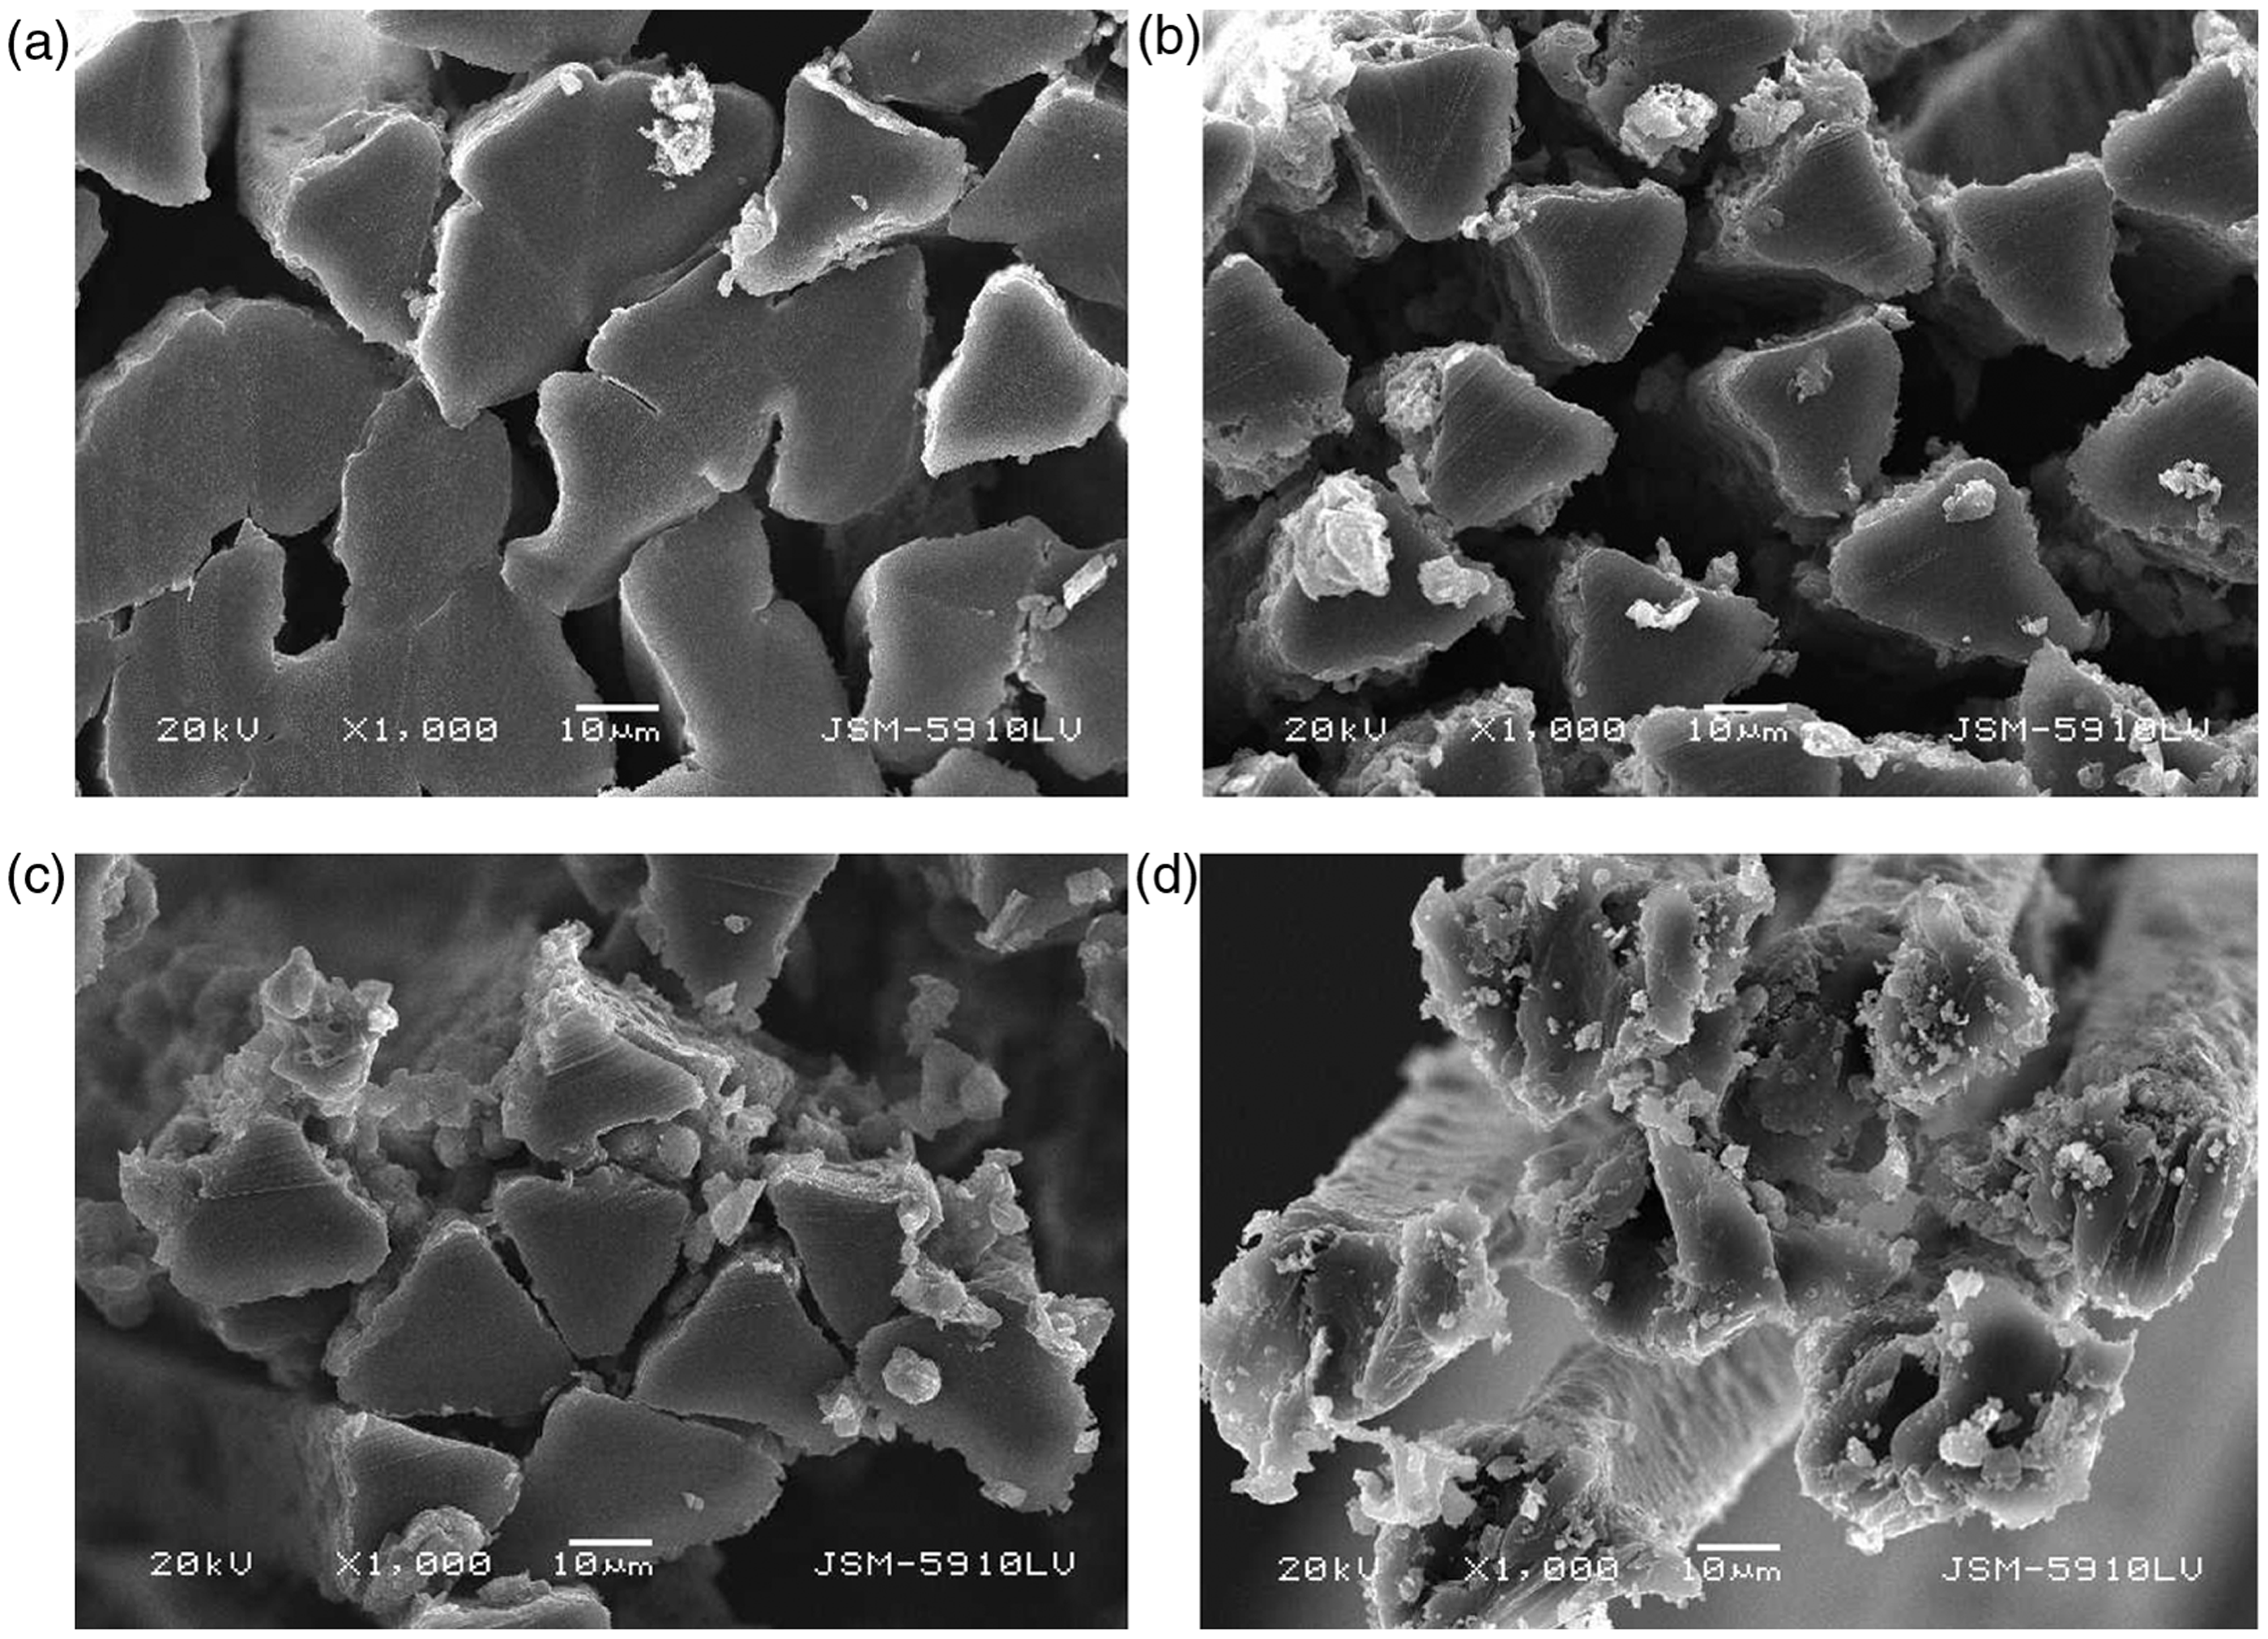
Figure 11 shows the EDS spectra of PES fibre at 0.6 mol/l FeCl3 initiator treatment. According to the figure, it is obvious that both Fe and Cl ions were deposited onto the yarn surface in remarkable amounts after FeCl3 treatment.
EDS spectra of PES fibre at 0.6 mol/l FeCl3 concentration.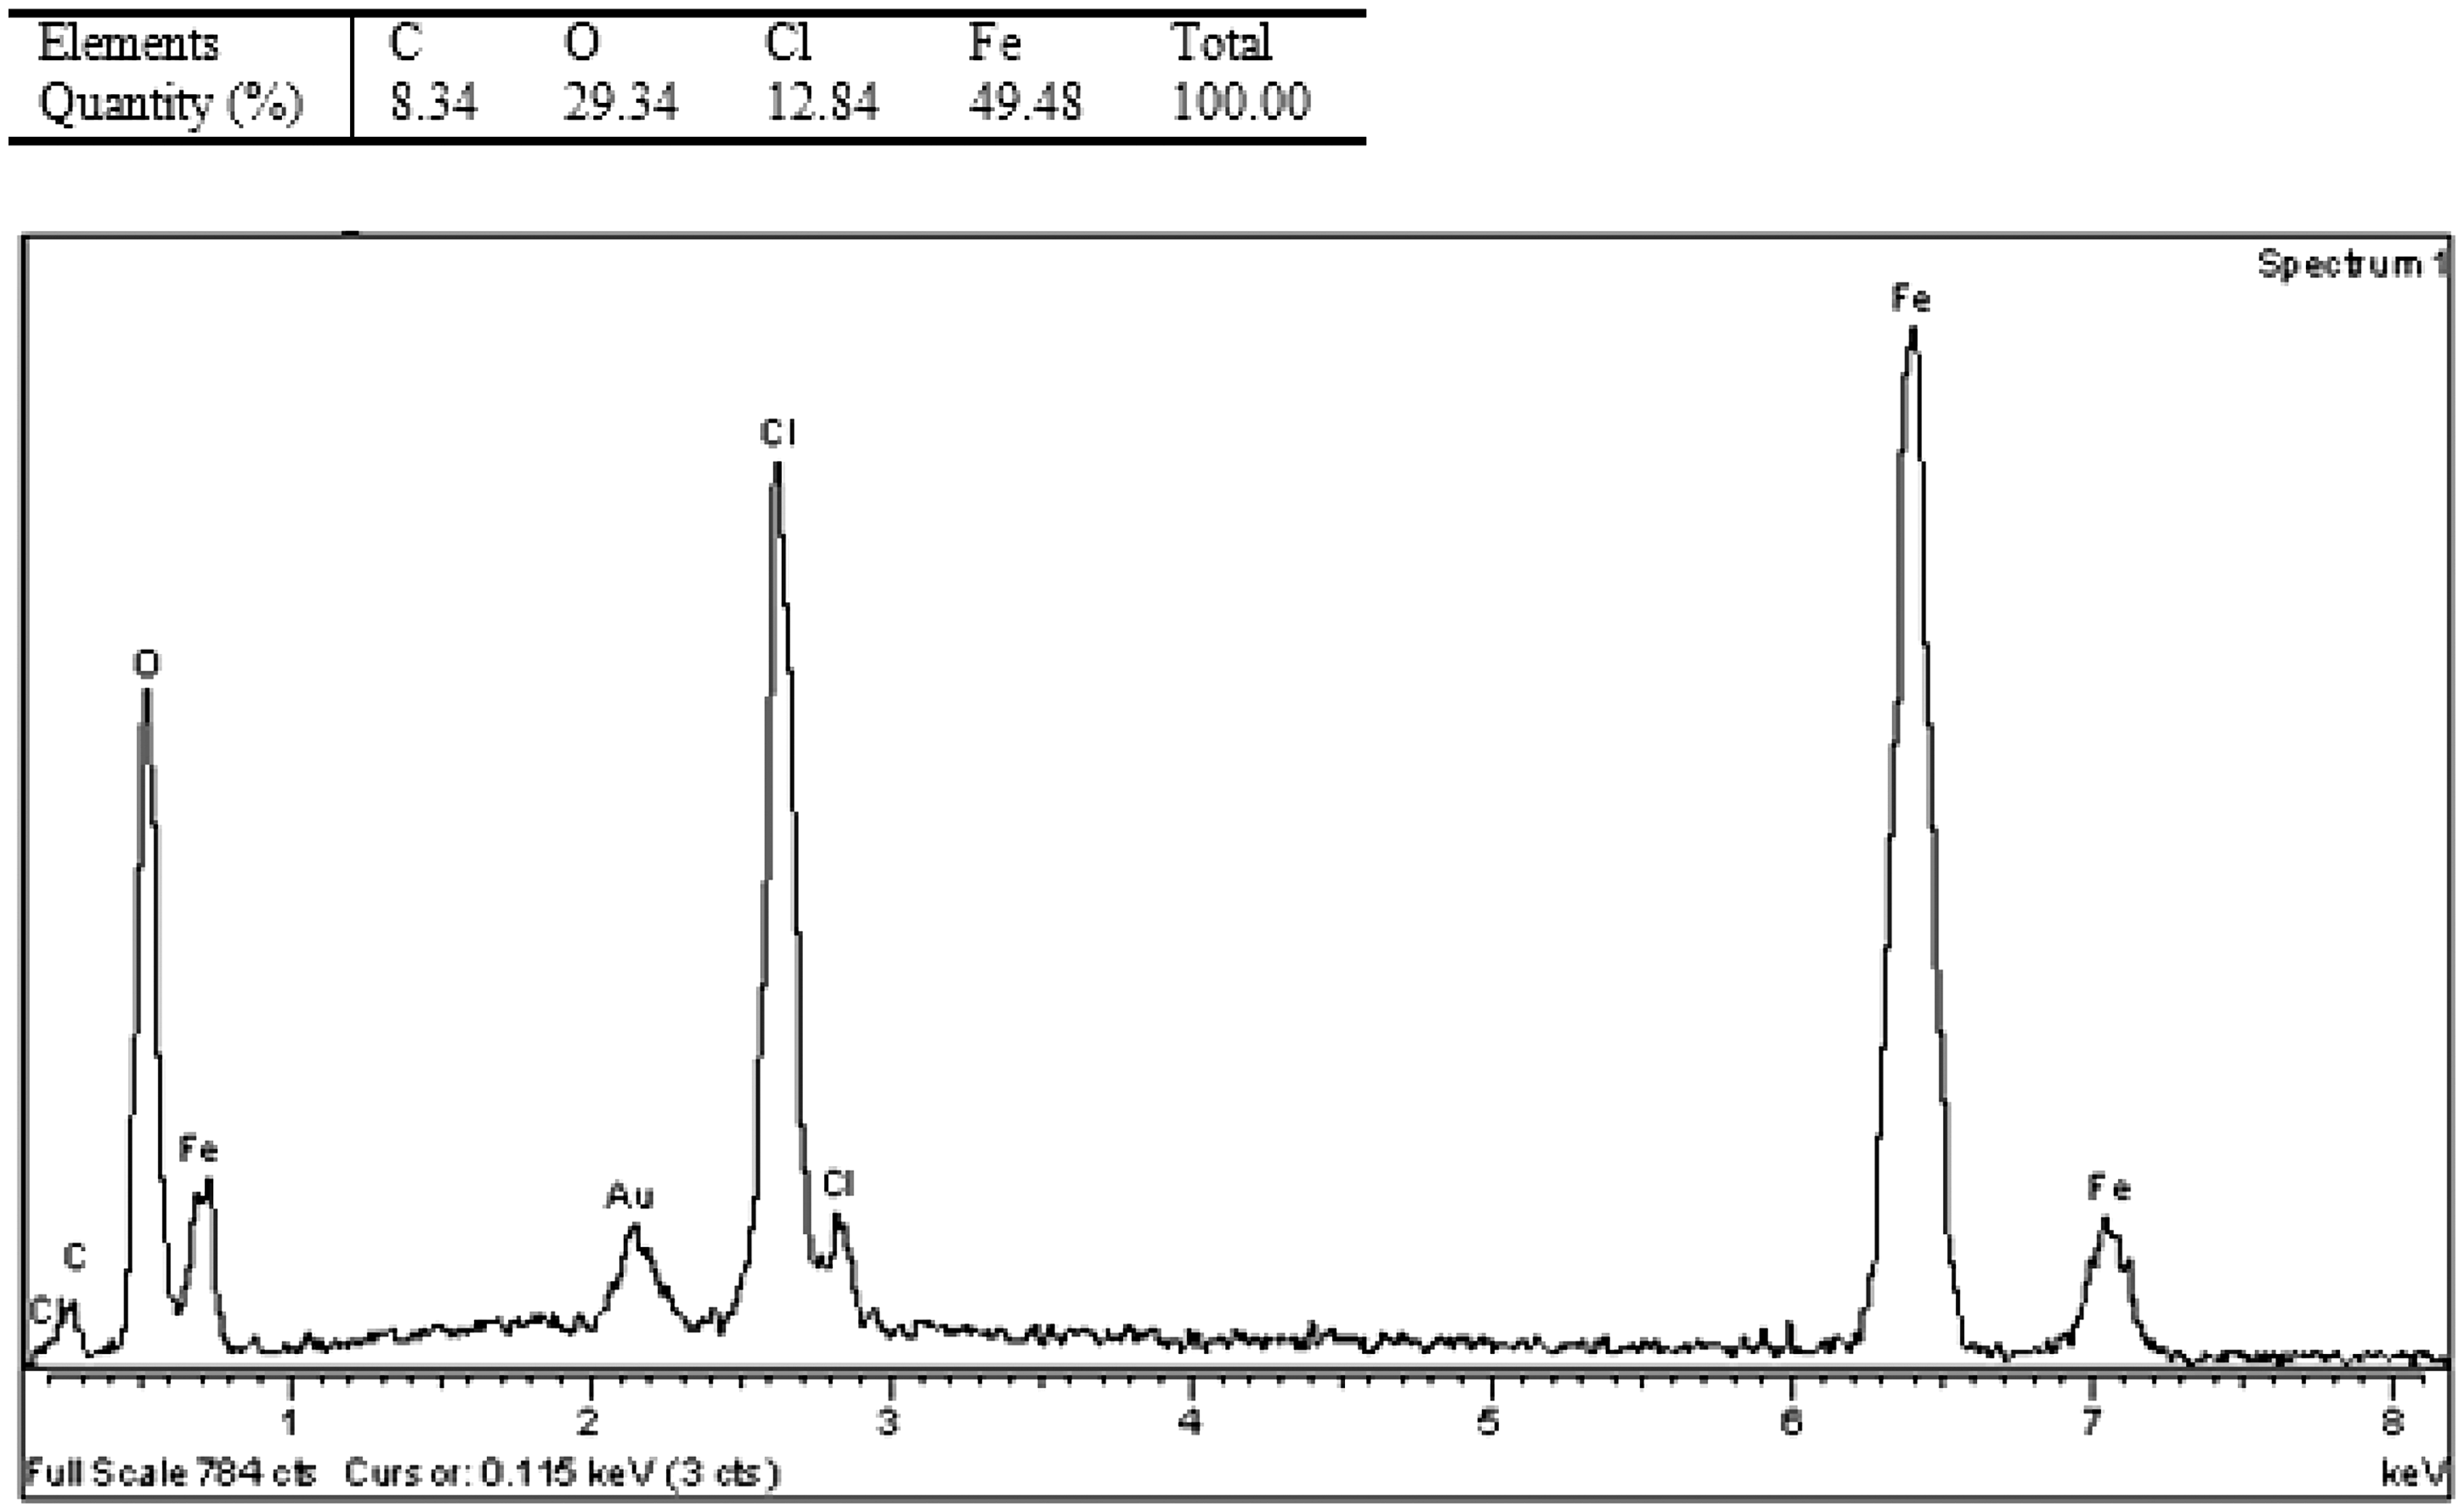
The FTIR spectra of PPy deposited PES yarn specimens can be seen in Figure 12. After the deposition process the peaks at 784, 1094 and 3200 cm−1 are the characteristic peaks of the PPy, namely N–H plane inner deformation peaks, which occur in the deprotonation process. The peaks at 1303 cm−1 and 1040 cm−1 correspond to the =C–H bands smooth vibration. The peak at 678 cm−1 is a plane deformation peak and at 900 cm−1 is a plane vibration peak.
FTIR spectra of PPy deposited PES yarns in different FeCl3 concentrations (a) pure PES, (b) 0.2 mol/l, (c) 0.4 mol/l, (d) 0.6 mol/l and (e) 0.8 mol/l.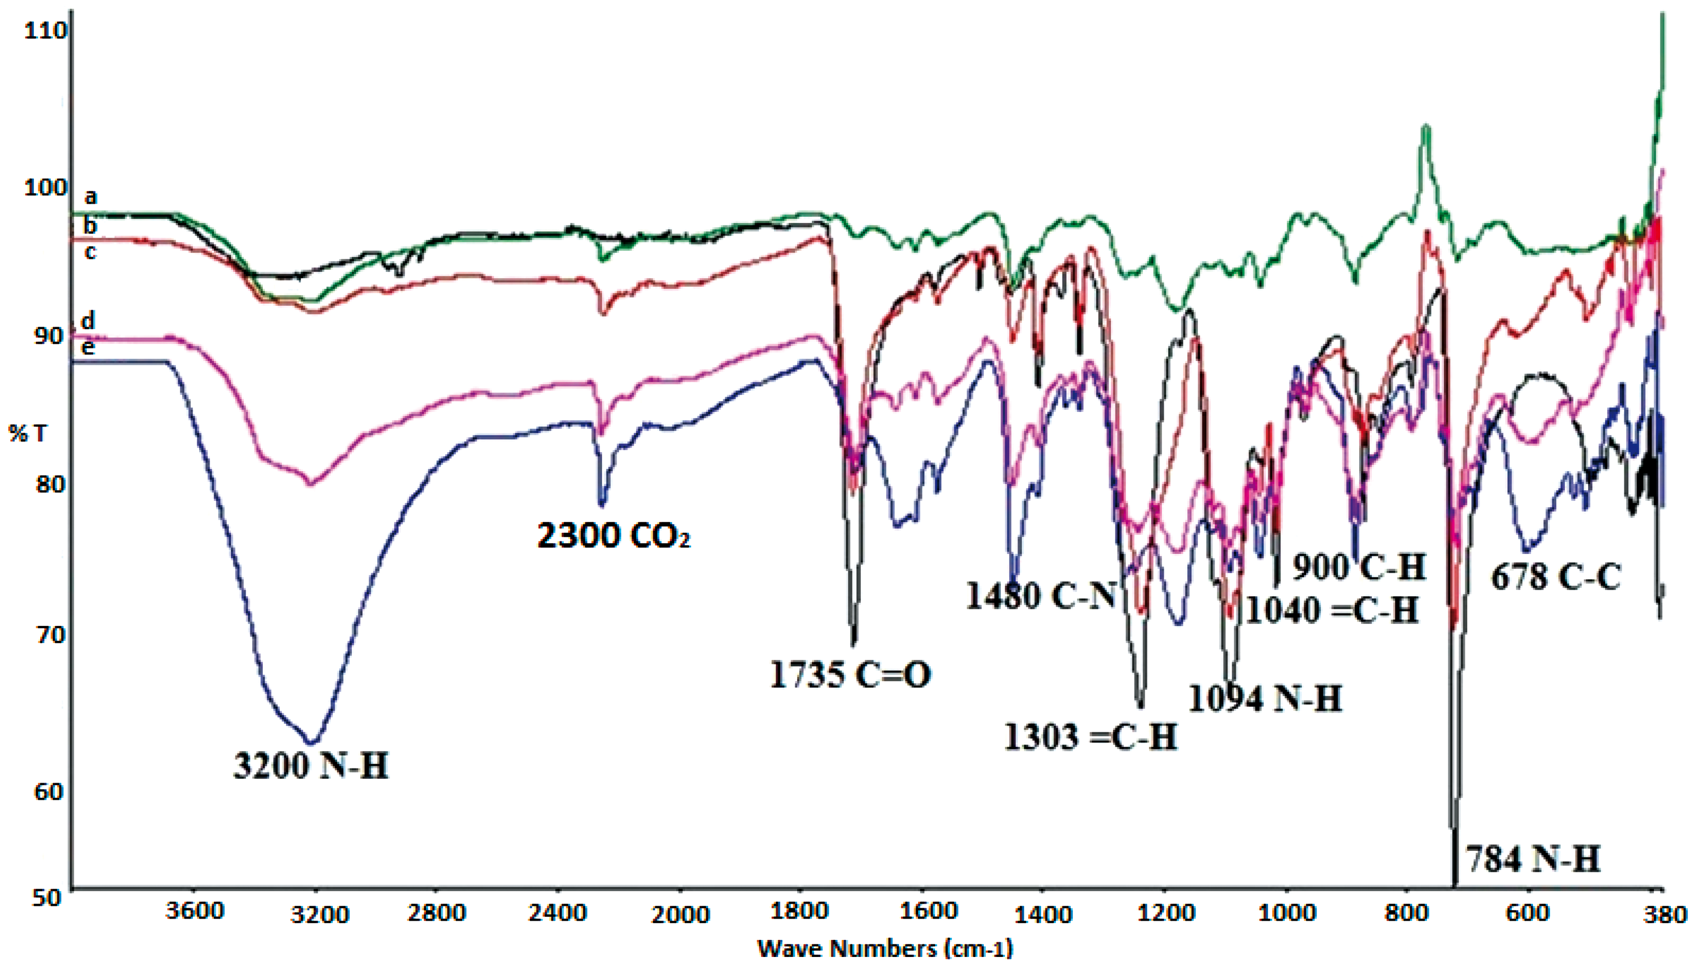
Thickness measurement of PPy deposition on PES yarns
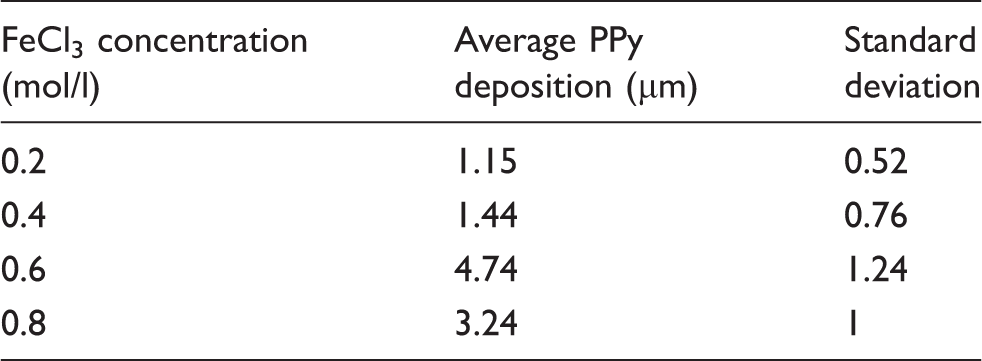
The average amounts of PPy deposition of the PPy deposited PES yarns were measured from the cross-section SEM images. Results showed that the highest deposition value was obtained as 4.55 µm in the 0.6 mol/l FeCl3 concentration.
Measurement of material amount deposited onto the yarn surface
Figure 13 shows the weight increment (%) as a function of initiator concentration for both with and without PPy deposition. According to the figure, it is obvious that at the 0.6 mol/l initiator concentration, the PPy amount, which is deposited onto the yarn surface, is much more than the other concentrations. This result is consistent with the other measurements such as EMSE and surface resistivity.
Weight increase with/without PPy as a function of FeCl3 concentration.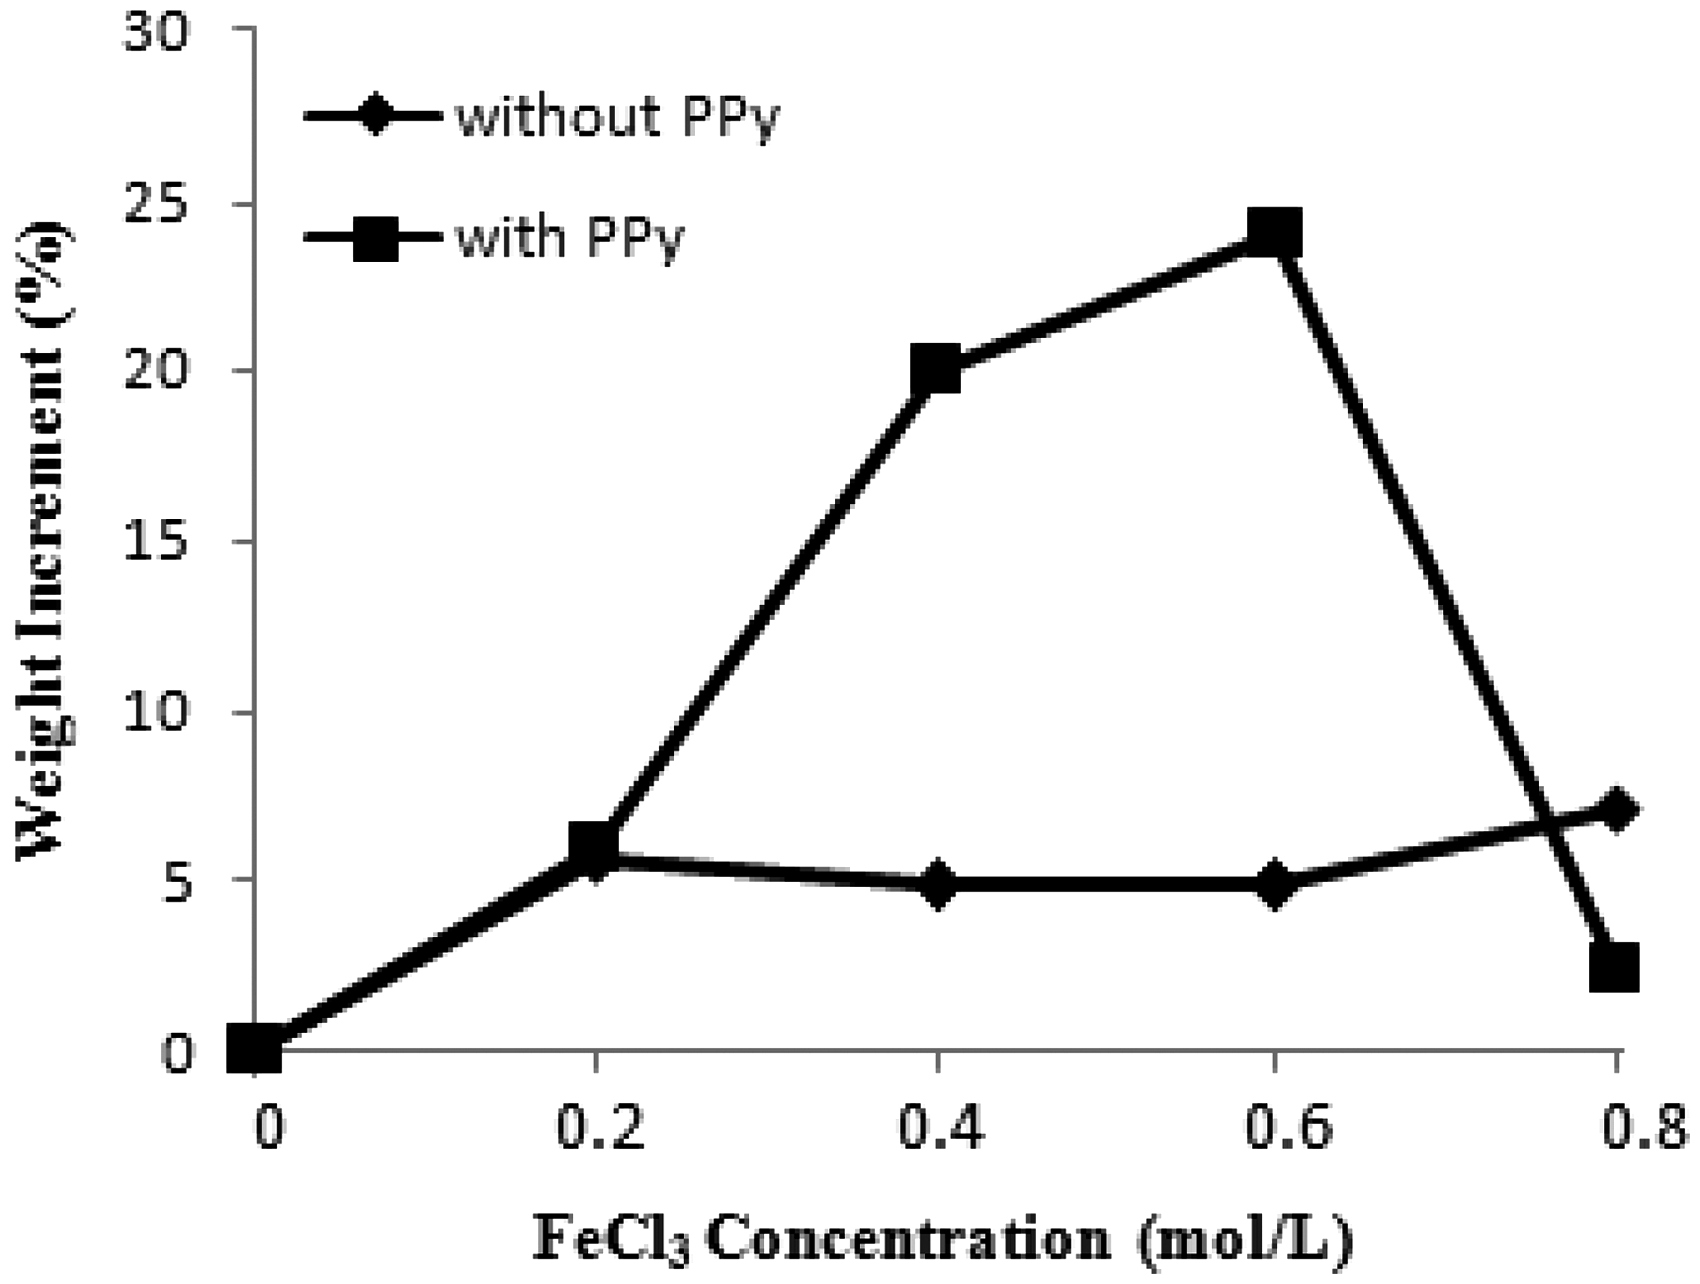
Electromagnetic shielding behaviour of the fabrics
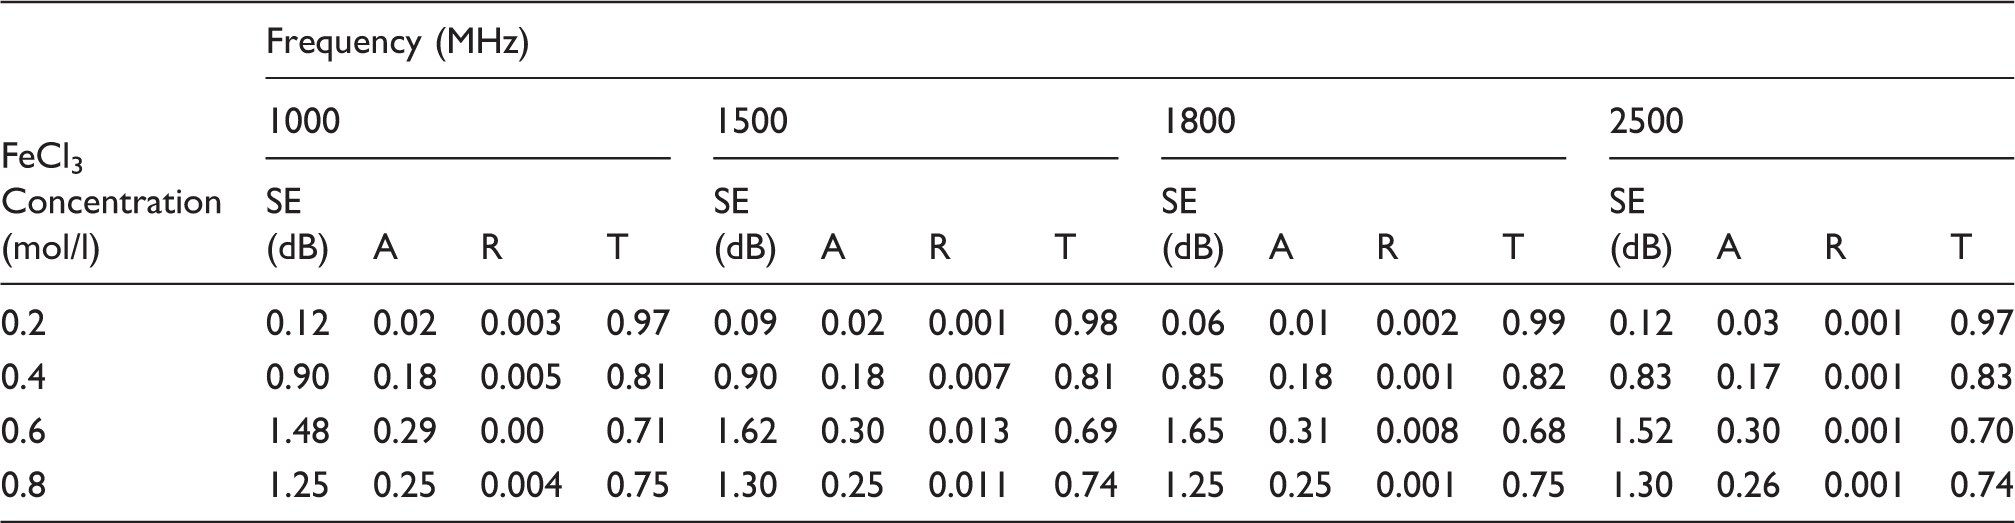
EMSE values of PPy deposited PES fabric obtained from various initiator concentrations can be seen in Figure 14. As it can be seen in figure, the EMSE values were increased parallel to the increment of FeCl3 concentration up to 0.6 mol/l. The highest shielding value was obtained at 0.6 mol/l initiator concentration usage. After that, at the 0.8 mol/l concentration, the EMSE value was decreased. The decline of EMSE after 0.6 mol/l results from the excessive Fe ions which do not participate in the polymerization process. As mentioned before the excessive Fe ions cause the over-oxidation of the yarn which leads the formation of carbonyl defects on the PPy backbone. Carbonyl defects cause interruptions in the π conjugation and act as electron withdrawing groups, inhibiting charge transfer, thus reducing conductivity. Thus, the shielding value was decreased at the 0.8 mol/L initiator concentration.19,20 According to the Figure 14, up to the 500 MHz frequency, the best shielding effect was seen in 0.8 mol/l FeCl3 concentration. In addition, for each concentration, the best shielding value was obtained at the 200 MHz frequency. Thus, this shielding material should be used at low frequencies. In general, especially in the frequency range of 1000–2000 MHz, a linear shielding behaviour was observed. Being linear in shielding property is a characteristic behaviour for conductive polymer deposited materials.
EMSE values of PPy deposited PES fabric in various initiator concentrations.
The amount of average polypyrrole (PPy) deposition and standard deviation values of the PPy deposited polyester yarns in terms of initiator concentration
Shielding effectiveness (SE), absorption (A), reflection (R) and transmission (T) values of the polypyrrole (PPy) deposited polyester fabrics with various FeCl3 concentrations
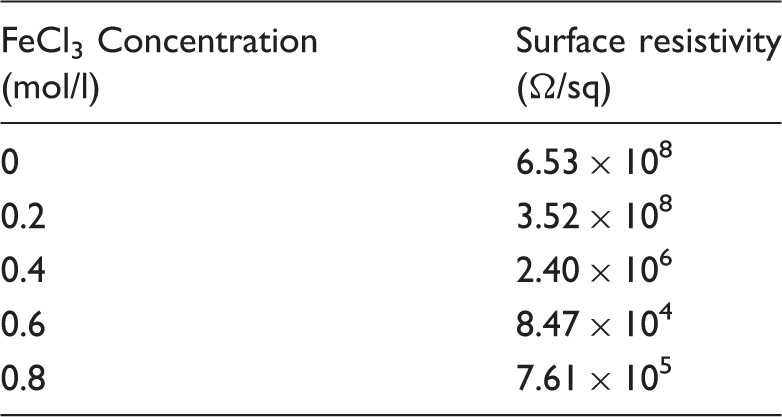
Measurement of surface resistivity of the fabric
The surface resistivity of the polypyrrole deposited polyester fabrics at various initiator concentrations
Conclusions
In this study, vapour phase polymerization of pyrrole on the PES yarn surface was performed. The effects of the FeCl3 concentration on the polymerization process, tensile, electrical, morphological properties and SE were investigated. After PPy deposition onto the yarn surface, the yarn specimens were weaved in a handloom in order to measure the surface resistivity and EMSE values. According to the tensile results, PPy deposition decreased the tenacity and elongation generally. Electrical resistance values parallel to the electrode distance showed a high correlation. This correlation means that a homogeneous PPy deposition was obtained through the yarn surface. The least mass specific electrical resistivity, in other words the highest conductivity, was shown at 0.6 mol/l FeCl3 concentration. SEM and FTIR analyses confirmed the PPy layer existence onto the yarn surface. According to the SEM longitudinal images the best deposition layer was seen at the initiator concentration of 0.6 mol/l. According to the SEM cross-sectional images the thickest PPy layer (4.74 µm) was obtained at 0.6 mol/l FeCl3 concentration. The EMSE values were determined from the fabric surface. The best EMSE value of about 2 dB was obtained at the 0.6 mol/l initiator concentration. At the 0.8 mol/l initiator concentration all of these results have become worse due to the over-oxidation of the yarn leading the formation of carbonyl defects which cause interruptions in the π conjugation and act as electron withdrawing groups, inhibiting charge transfer, thus reducing conductivity on the PPy backbone.19,20 It can be concluded that in order to obtain higher EMSE values and conductivities, before the deposition process, the textile material surface should be treated by some techniques such as plasma treatment. Thus, a deeper penetration into the yarn surface can be obtained.
Footnotes
Acknowledgement
The authors thank Professor Dr Serdar Salman from Marmara University for providing access to his laboratory facilities during the entire research.