
Abstract
The removal of the color of dye from wastewaters is one of the main problems of the textile industry for both colorists and manufacturers. In this study, ozone gas was used to decolorize the reactive dye effluents. Nine commercial dyes were used for preparing the reactive dye effluents. These dyes have different three anchors (monochlorotriazine, vinylsulphone, monochlorotriazine-vinylsulphone) and three chromophore groups (monoazo, diazo, azo-cu). Thus, in this study, the effect of ozone treatments was investigated on the decolorization efficiency of dyes having different chromophore and anchor groups. In addition, the effect of ozone on the decolorization efficiency depending on the presence of ultrasound energy and dyeing auxiliaries was studied. The results showed that ozonation treatment was an effective method for the decolorization of reactive dye effluents and, generally, the presence of ultrasound had generally positive effect on the efficiency of decolorization.
The textile industry consumes large amounts of water and its effluents contain a wide range of contaminants. These contaminants include dyes with strong color.1–3 Over 700,000 tons of approximately 10,000 types of dyes and pigments are produced annually worldwide, of which about 20% are assumed to be discharged as industrial effluent during the textile dyeing processes, and some are known to be toxic and carcinogenic.4,5 The removal of dye color in the treatment of textile dyeing and dye manufacture wastewaters is one of the main problems of the textile industry.1–20 Apart from the aesthetic problems created when colored effluents reach natural water currents, dyes strongly absorb sunlight, thus impeding the photosynthetic activity of aquatic plants and seriously threatening the whole ecosystem.4,6
All kinds of dyes do not have the same rate of problem on decolorization: it depends on the structure of dyes and the affinity of dyes to textile fibers.6,7 Reactive dyes have very poor fixation rates of 60–80% and these dyes occur in textile dyehouse wastewater in concentrations ranging from 5 to 1500 ppm due to their poor fixation properties.4,6,8–10 These dyes are extensively used in the dyeing processes and this dye class represents almost 45% of the market share among all textile dyes produced. 4 Due to their toxicity and recalcitrance, these dyes can be hazardous to the environment and resistant to destruction by biological treatment methods.4,6,8–10
Reactive dyes used to dye cellulose fibers are colored molecules. The reactive dyes consist of a chromophoric system (e.g. azo, anthraquinone, phthalocyanine), groups that increase the water solubility (mostly
Most of the dye molecules have a polyaromatic structure with high molecular weight and contain atoms of nitrogen, sulfur and metals; hence, it is very difficult to break them down by any biological method and they cannot be treated efficiently by an activated sludge or some combination of biological, chemical or physical methods. 1 In addition, there are many different types of dyes and different dyeing manufacture processes, making it difficult that only a single applied process answers satisfactorily the treatment requirements in all situations. 3 Therefore, for removing the color from the wastewater, it is necessary to take additional precautions. 10 Oxidative treatments seem to be the most promising among various decolorization processes, such as coagulation, flocculation, adsorption on activated carbon, filtration and oxidation methods. 13 Ozone (O3) oxidations have been extensively studied to decolorize dyes or pre-oxidation to enhance the biodegradability or to reduce inert chemical oxygen demand (COD) fractions and toxicity removal and post treatment of textile industry wastewater. 14
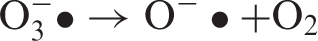
The ozone is an extremely strong oxidant. It can undergo self-decomposition in an aqueous solution to form hydroxyl free radicals that have a stronger oxidizing capability. Hence, the ozone gas has many uses. In some commercialized industrial applications, it has been widely accepted as an effective disinfectant and a chemical oxidant. Studies have reported some data on the reaction between ozone and dyes, and indicated that ozone possesses an excellent decolorizing capability. 2 Ozone destroys the conjugated chains of the dye molecules to impart color. 1
Ozone reacts with organic compounds either directly by electrophilic attack or indirectly by radical chain type of reactions depending on the operation pH:4,6,8,21


Typically, at pH < 4, direct ozonation dominates, whereas in the range of pH 4–9, both are important, and at a pH > 9 the indirect pathway dominates. The pH influences the generation of hydroxyl radicals and thereby the decolorization efficiency:4,6,8,21


In the literature, some experimental studies were found that combined the usage of ozone gas and ultrasound or any other mechanical effects (mechanical mixing with rotor) for different dye groups. When these studies were investigated, it was found that ultrasound caused an increase to the efficiency of ozone gas (or other oxidative chemicals) in terms of solubility capability of ozone in the water. In addition, the ultrasound increases the textile wet treatment activity due to its property of increasing mass transfer into textile materials.21–31 When we analyzed whole studies, it was found that researchers generally used classic ultrasound producers (low-frequency apparatus), which was also used for ultrasonic cleaners in different industry branches.
The ultrasound produces its chemical effects through several different physical mechanisms: the most important non-linear acoustic process for sonochemistry is cavitation. The cavitation is the formation of gas-filled micro bubbles or cavities in a liquid, their growth and, under proper conditions, implosive collapse.
22
The combined operation of sonolysis and ozonation renders synergistic effects in organic matter destruction. The synergy is partly due to excess hydroxyl radicals formed upon thermal decomposition of ozone in the gas phase (Reactions (6) and (7)), and partly due to the increased mass transfer of ozone in solution by mechanical effects of ultrasound:23–25

In addition, an ultraviolet (UV) and ozone combination was reported for decolorization processes. 21
In this study, the ozonation process was used to decolorize the wastewater containing nine commercial reactive dyes, which had different anchor and chromophore groups. Thus, the effect of ozonation on the decolorization efficiency of reactive dyes, which had different anchor and chromophore groups and their tricromy combinations, could be investigated. At the same time, the effect of ozone on the decolorization efficiency, depending on dye concentration (%), ozonation time and usage of ultrasound energy (with a high-frequency probe), was investigated. Furthermore, to simulate the dyeing solutions as real wastewater, some auxiliaries that were used in the dyeing processes and dye combinations were used. The absorbance values of unprocessed and processed wastewaters were measured at 436 nm wavelength with an UV-Visible spectrophotometer. In this experimental study, it was aimed to find out the optimum ozonation conditions (ozonation time and presence of ultrasound) for decolorization of different reactive dyes at different dye concentrations.
The experimental designs mentioned in the study consisted of the following investigation tasks regarding ozone decolorization, which are different to those found in the literature:
– the effect and reaction of both chromophore and anchor groups of reactive dyes on the ozonation performance; – the effect of both nine different reactive dyes and their two different owf % values in conjunction with high-frequency ultrasound applications and the presence of dyeing auxiliaries on the ozonation performance; – the effect of the tricromy combination of these dyes, depending on the anchor group, on the ozonation performance; – the effect of reactive dyeing effluent prepared with salt and sodium carbonate on the ozonation performance.
Experimental study
Materials
Reactive dyes and auxiliaries
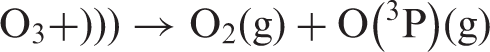
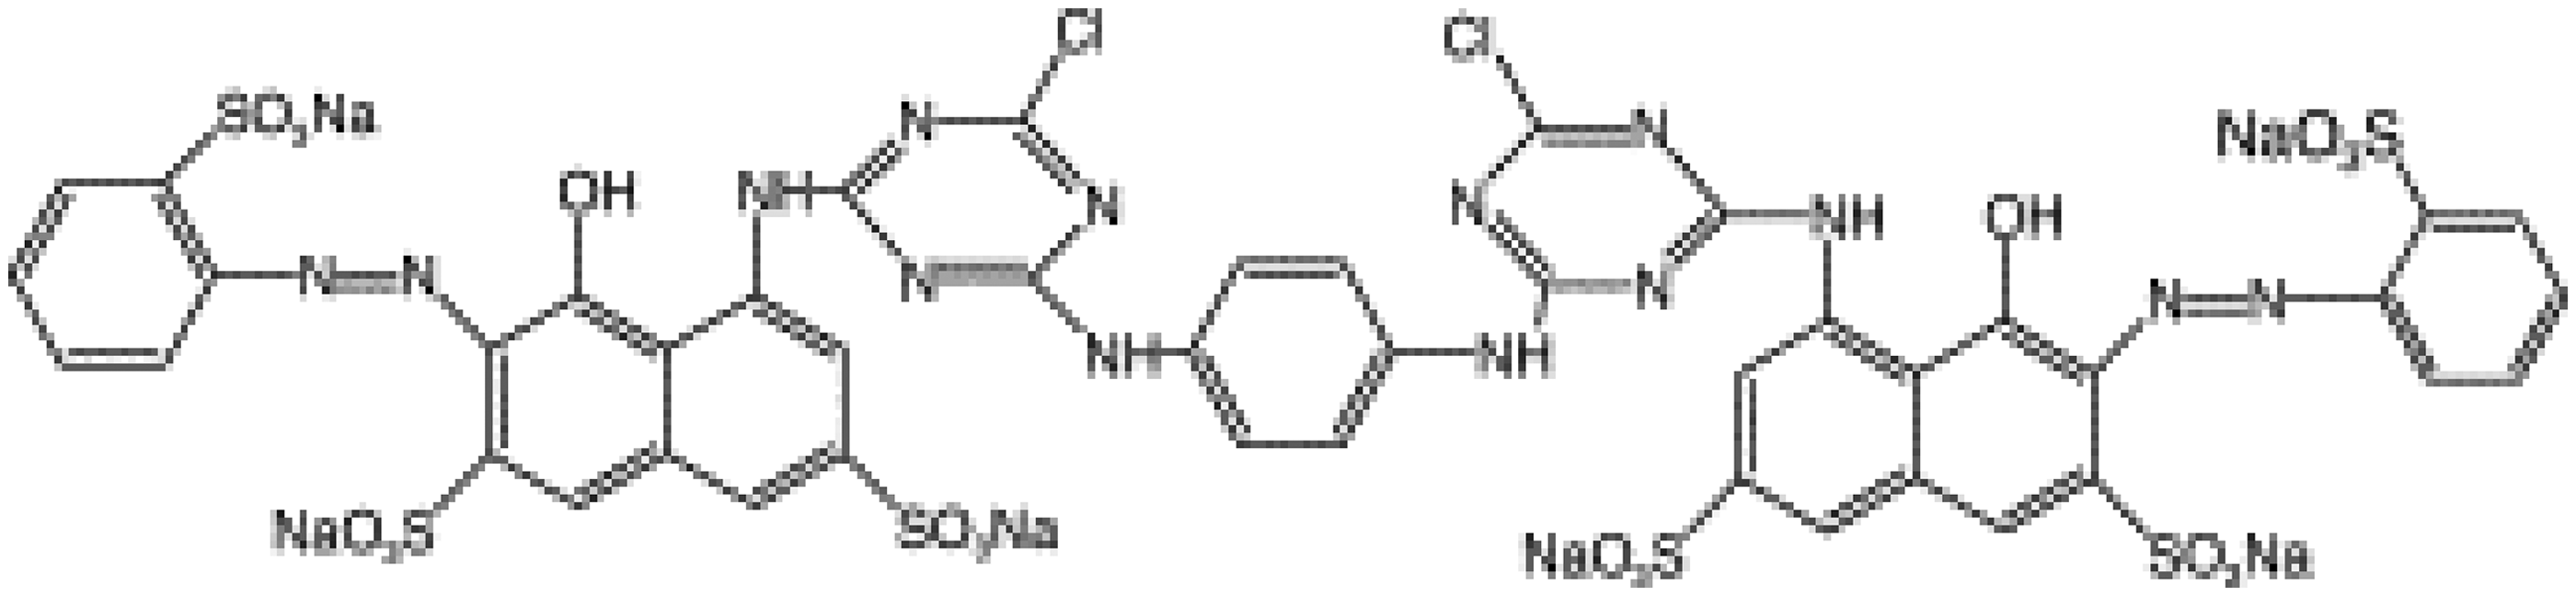
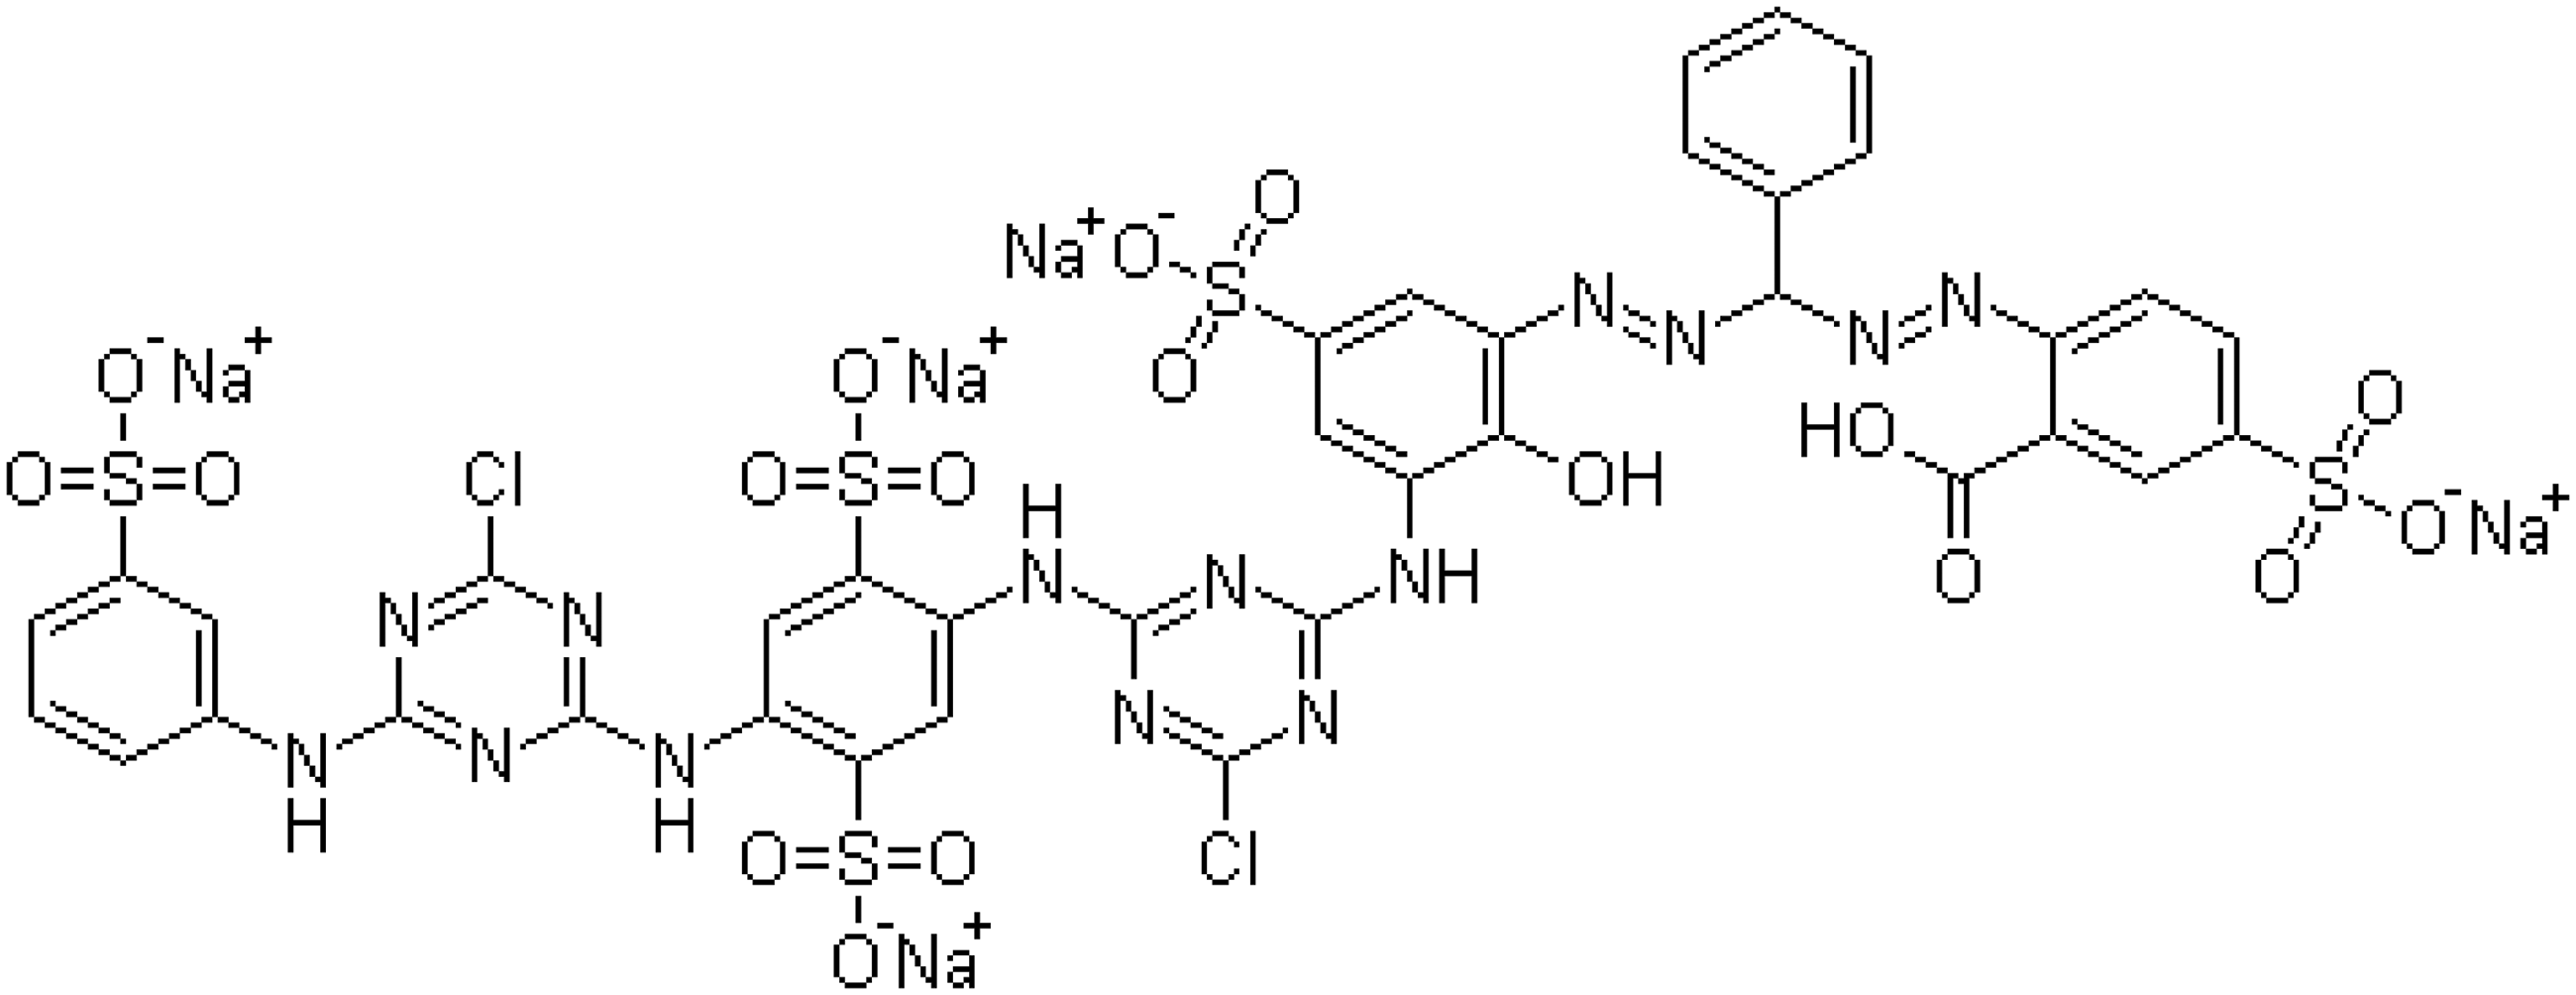
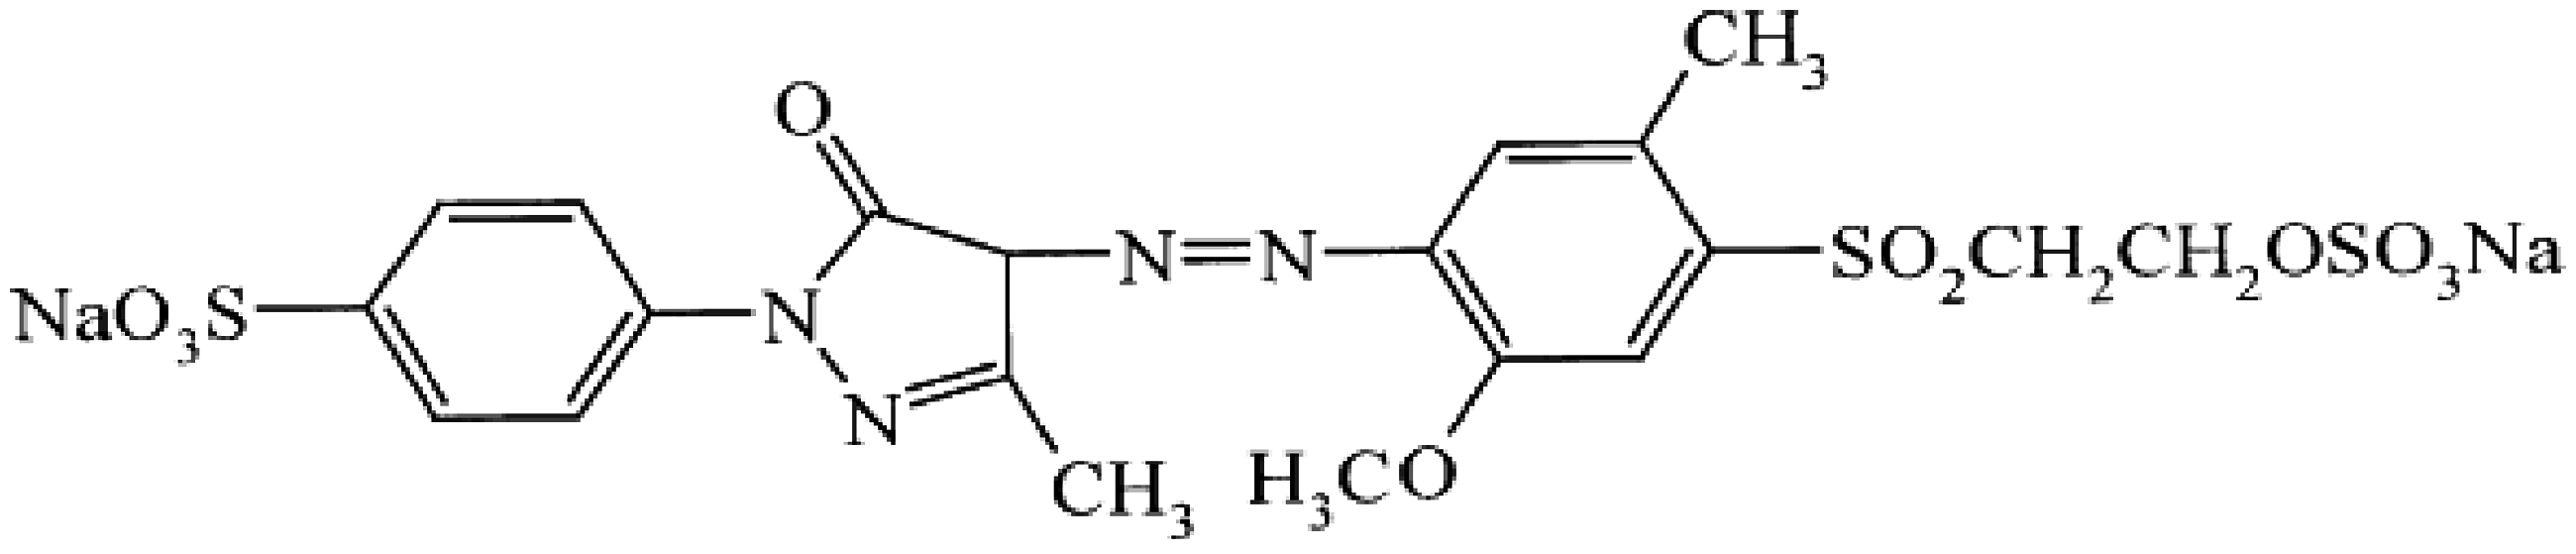
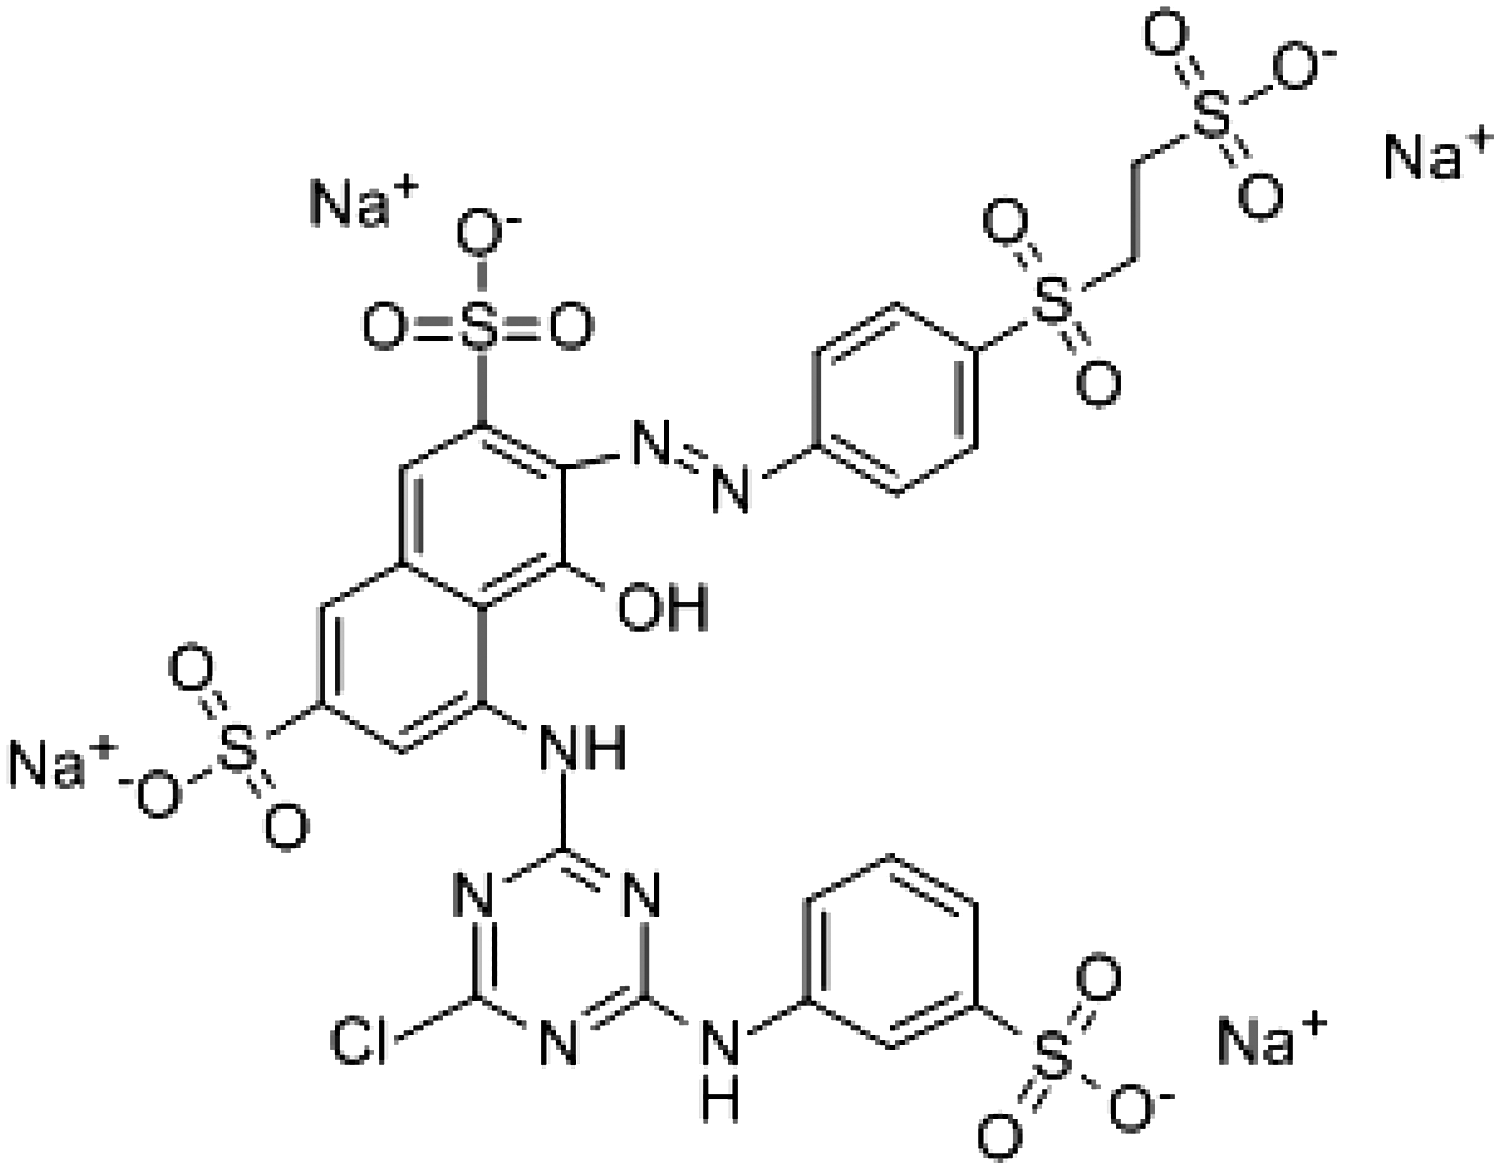
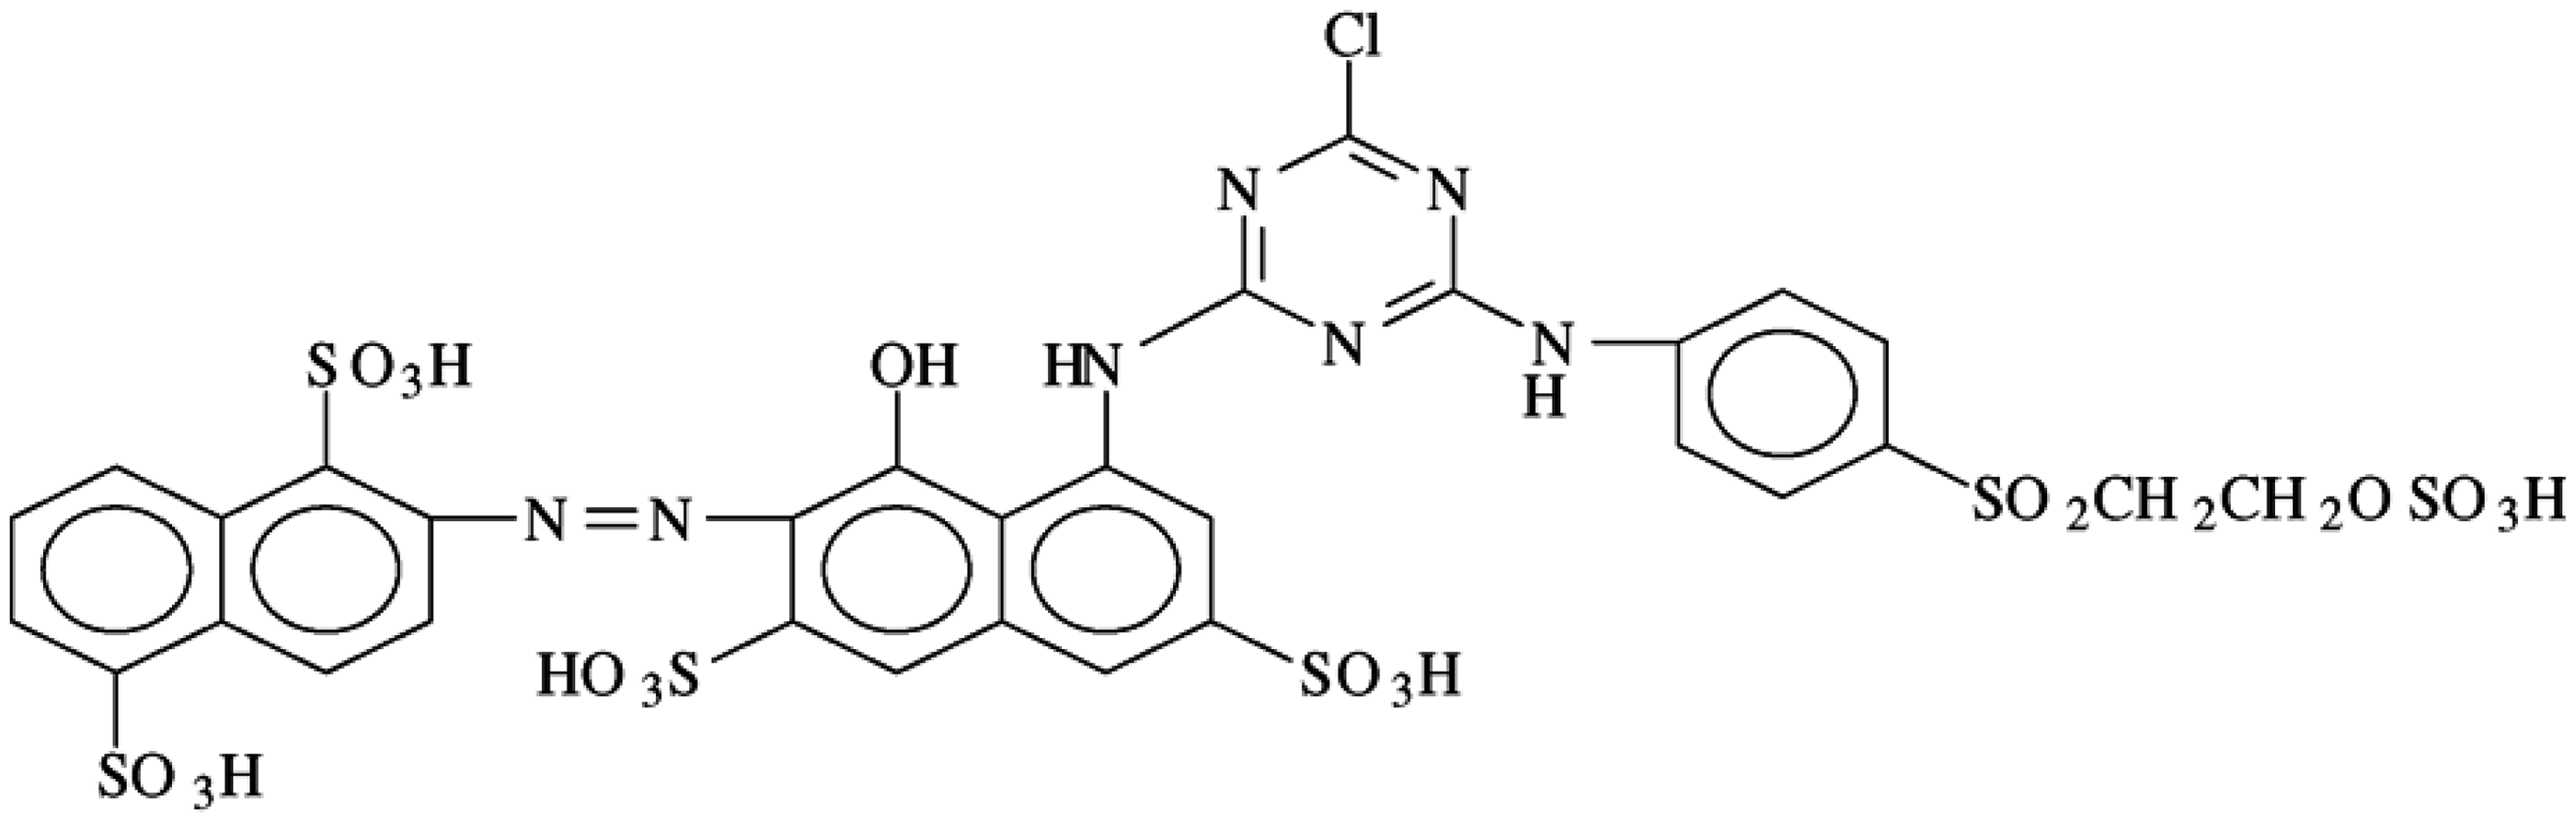
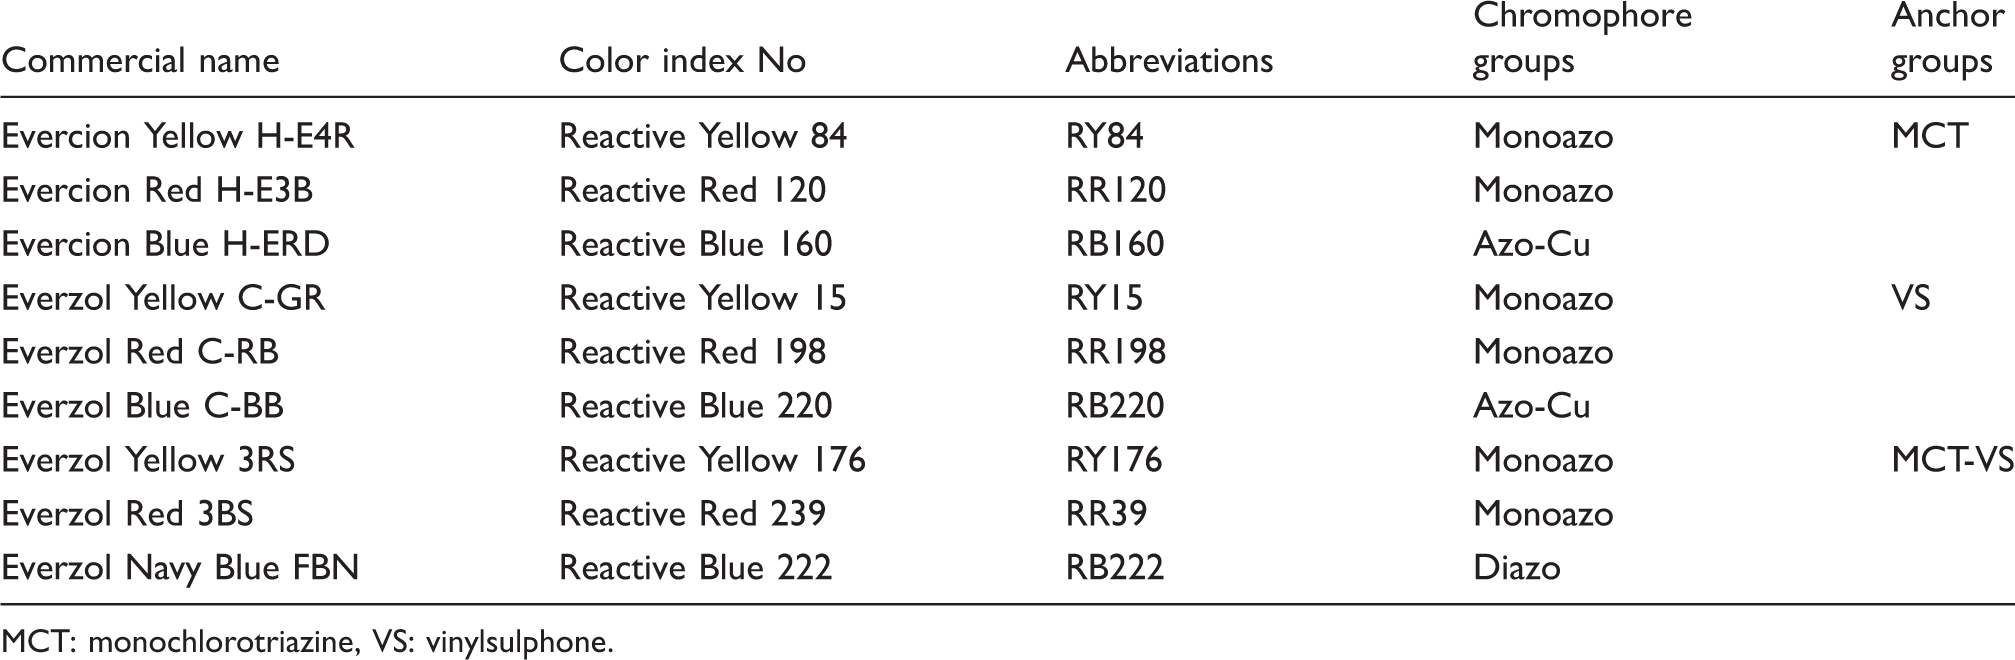
In this study, while preparing dyeing effluents, nine reactive dyes (supplied by EliteDye), with different anchor and chromophore groups, and some auxiliaries were used as follows: C.I. Reactive Yellow 84, C.I. Reactive Red 120, C.I. Reactive Blue 160, C.I. Reactive Yellow 15, C.I. Reactive Red 198, C.I. Reactive Blue 220, C.I. Reactive Yellow 176, C.I. Reactive Red 239 and C.I. Reactive Blue 222. The chromophore and anchor groups of these dyes and general structures of the dye chromophores are given in Table 1 and Figure 1. The known chemical structures of some of these dyes are given in Figures 2–7.
General structures of dye chromophores used in the study. The chemical structure of C.I. Reactive Yellow 84. The chemical structure of C.I. Reactive Red 120. The chemical structure of C.I. Reactive Blue 160. The chemical structure of C.I. Reactive Yellow 15. The chemical structure of C.I. Reactive Red 198. The chemical structure of C.I. Reactive Red 239. The important properties of dyes used in the study MCT: monochlorotriazine, VS: vinylsulphone.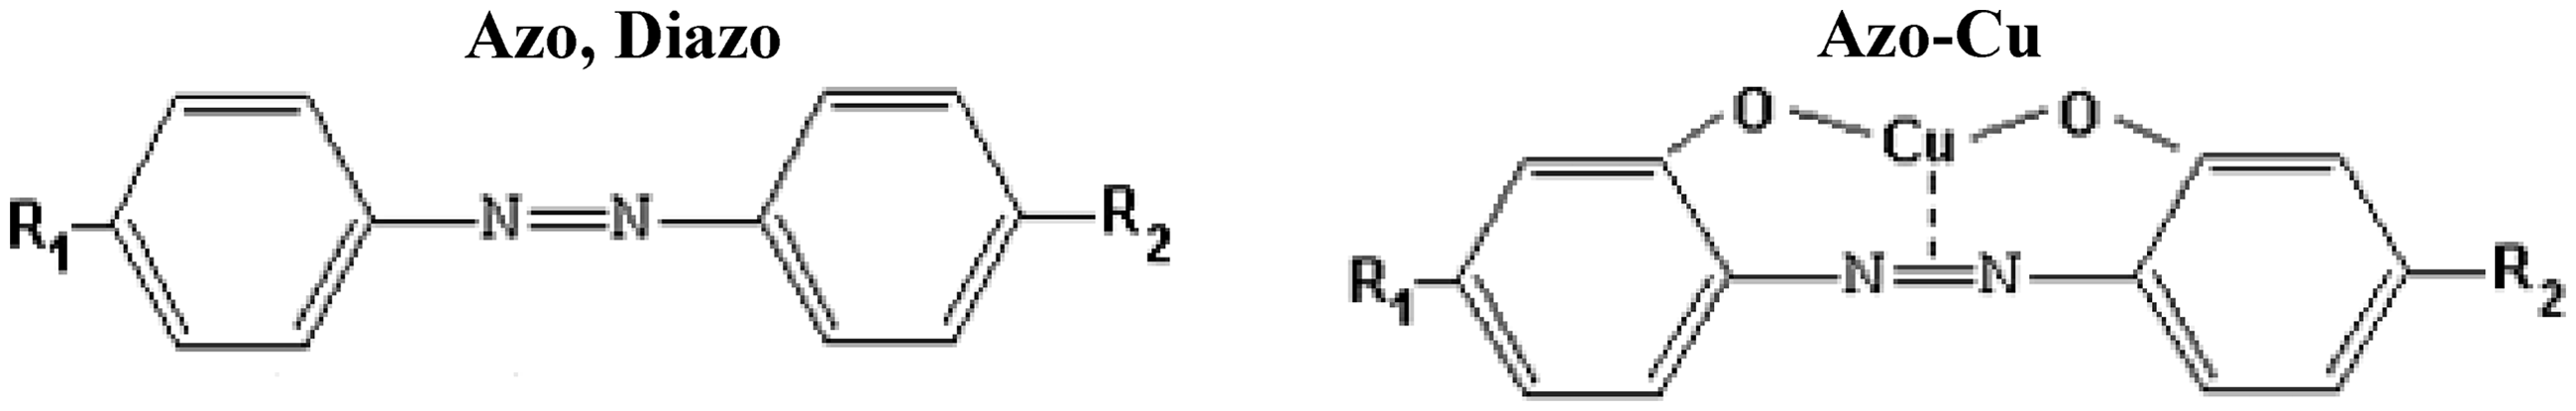
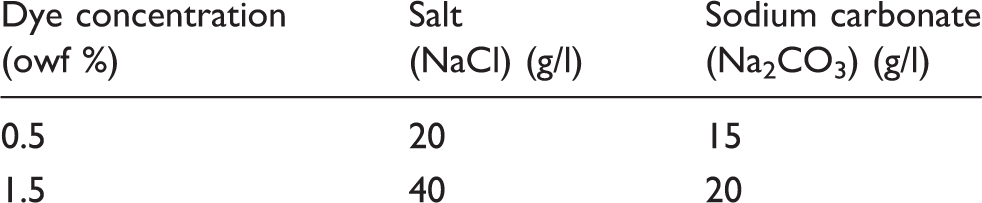
The auxiliaries used in the artificial wastewater were wetting agent, defoamers, a sequestering agent and an anti-creasing agent. In addition, for all reactive dyeing solutions, salt (NaCl) and sodium carbonate (Na2CO3) were used in order to simulate real reactive dye effluent.
Apparatus
In the study, the corona discharge type ozone generator (Teknozone TKZ-L12G), which had a capacity of 12 g/h, was used. It takes the oxygen from the air and transforms this oxygen from a purity of 21% to a purity of 90–95%. The double bond of the oxygen atom breaks off with an electrical current (generated using a plate generator) and it combines with the other oxygen atom, then the ozone is formed. The generated ozone gas was directly applied into wastewater through an appropriate diffuser placed at the bottom of the reactor. All ozone applications were applied in a laboratory reactor, which was made from stainless steel material, and was 40 cm in length with a 2 l capacity; however, it had a 1.2 l effective volume at 23 cm working length (Figure 8).
Experimental setup (the reactor).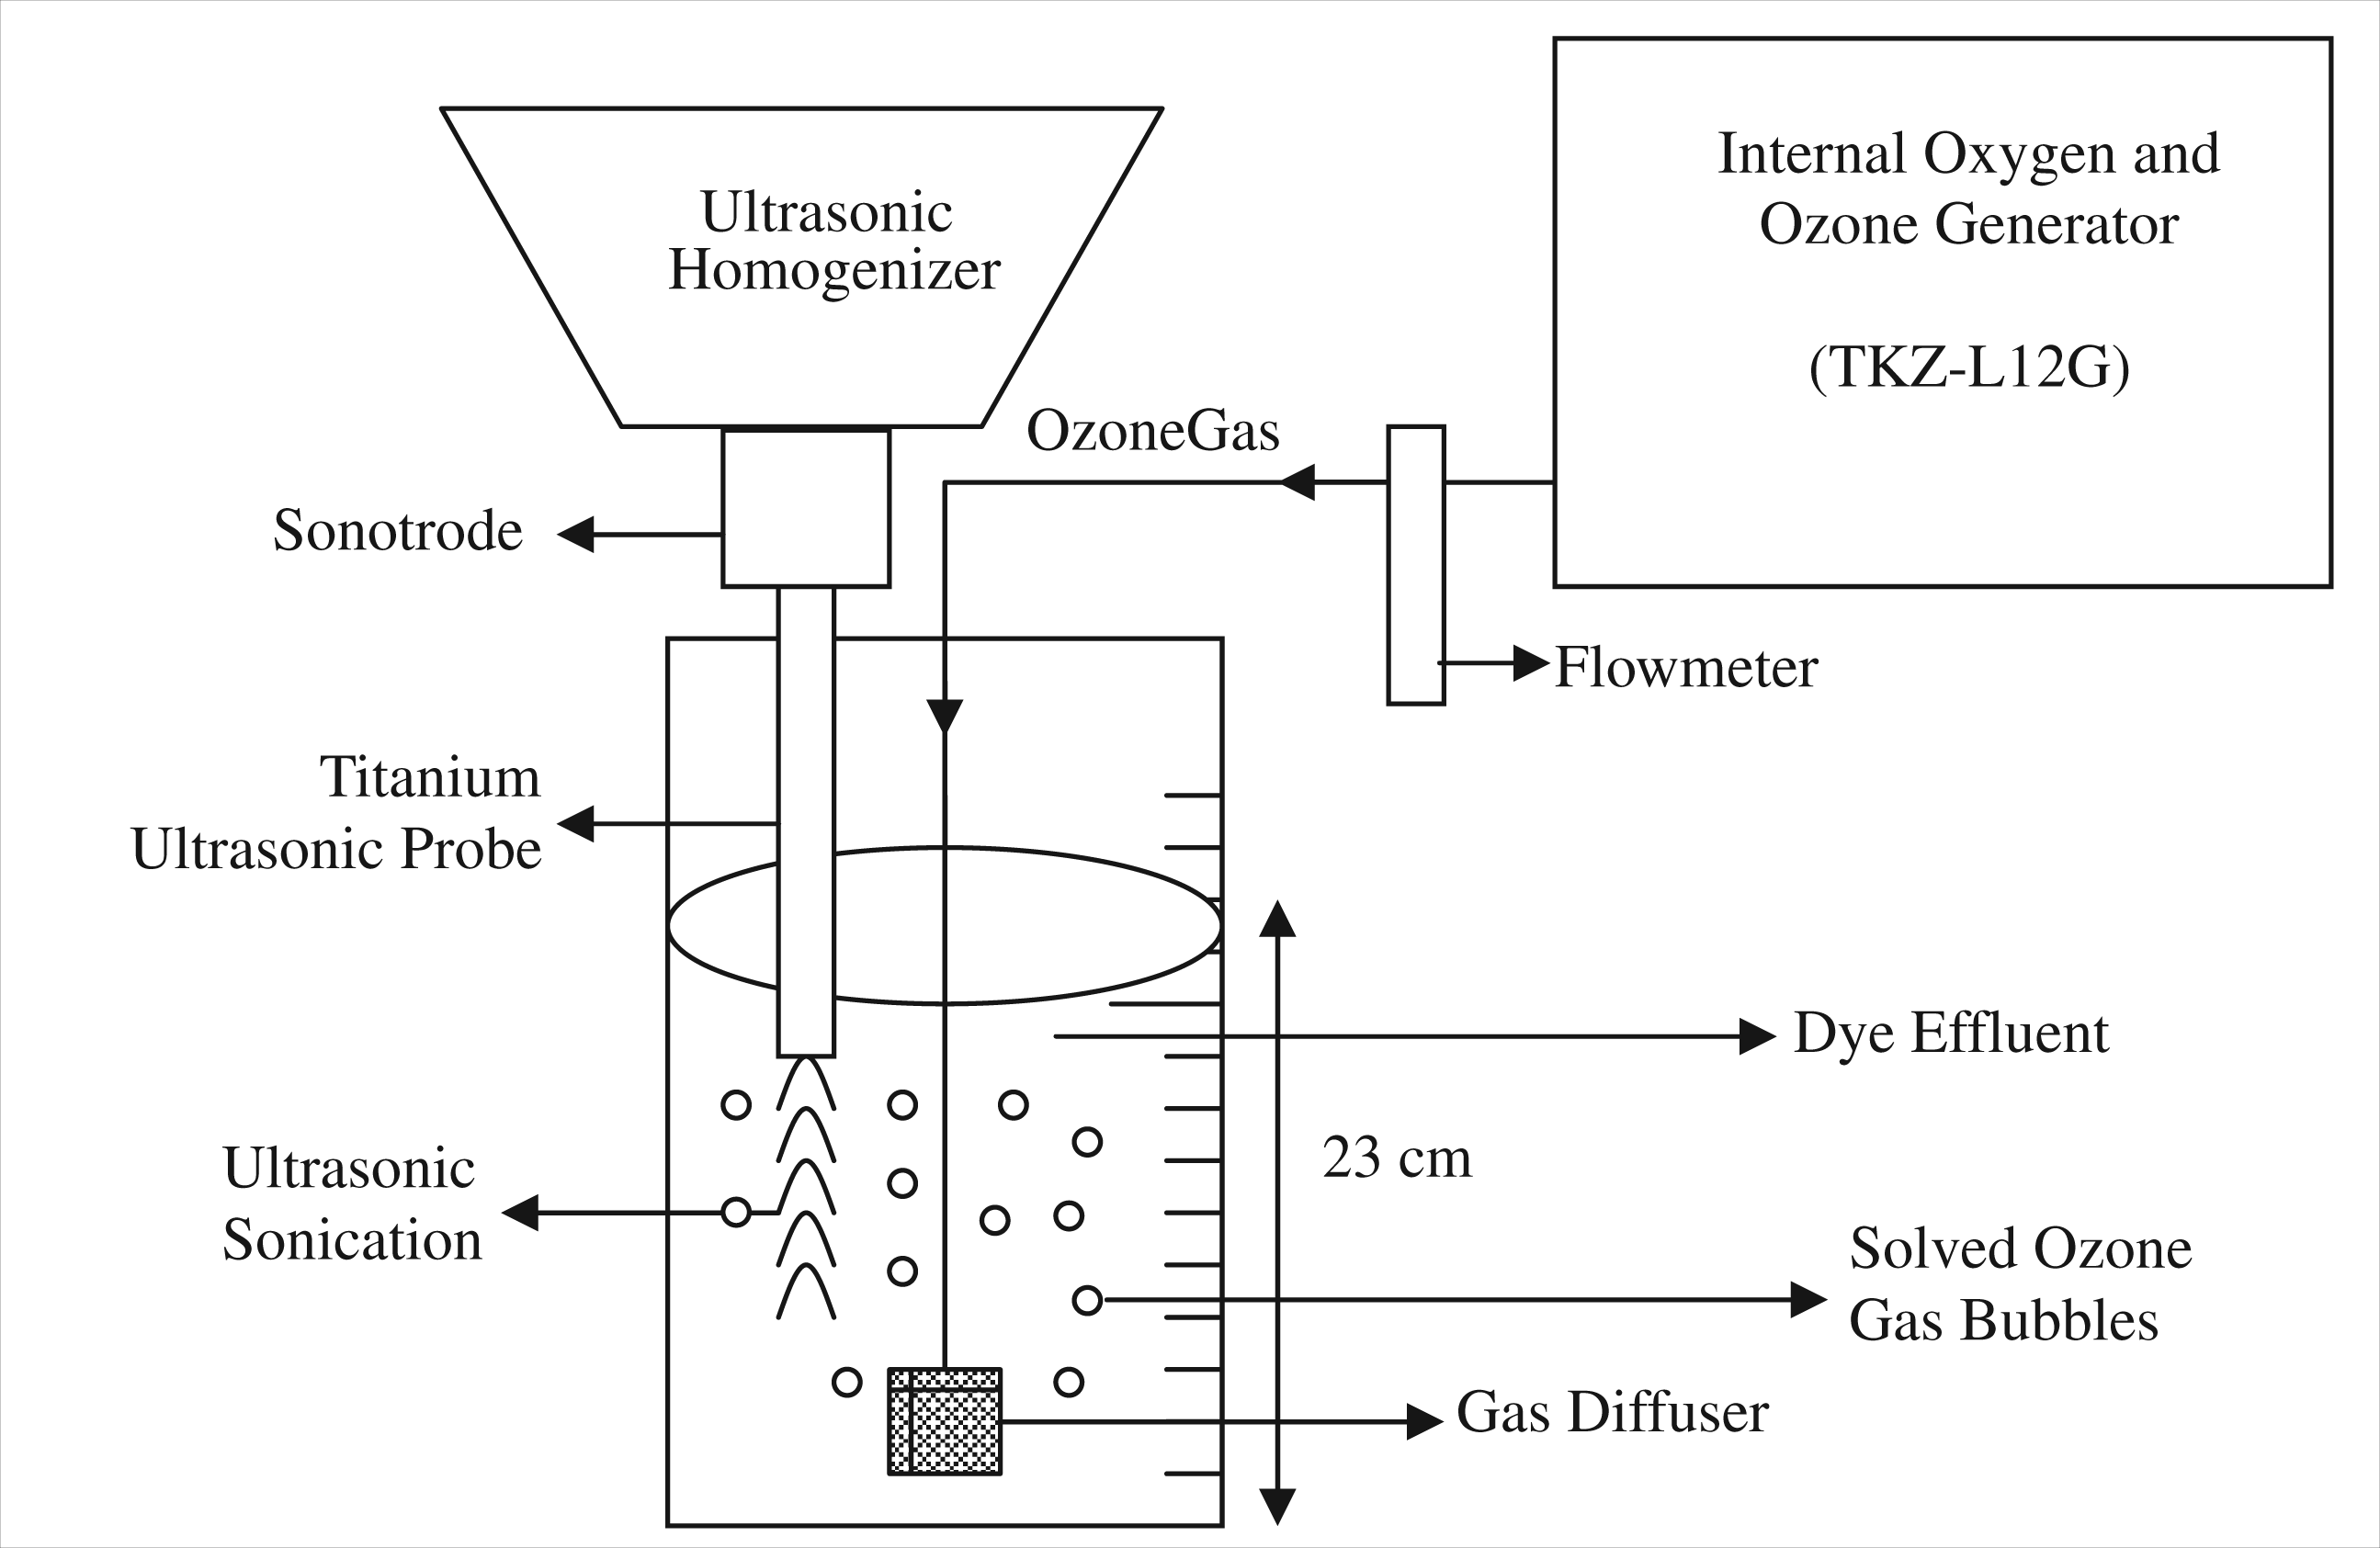
In order to investigate the effect of ultrasound on the ozone in the decolorization process, a high-frequency ultrasonic homogenizer was used (Hielscher UP 200 S Model). This equipment had the power of 200 W (24 kHz). It was used in the “cycle 1” mode, which guided continuous working and used the setting “amplitude 100% (maximum power)”. While it was working at this condition, the generator pulled power of 50 W.
After treatments, the absorbance values of wastewater were measured at a single wavelength. The measurements were taken through a special UV-Visible spectrophotometer (Hach LANGE DR 2800 Model) on a wavelength (436 nm) that was determined according to the Turkish Government Legal Wastemater Guides for Textile (Guide No: 27914) and EN ISO 7887 standards. While measuring, we did not dilute the wastewater. According to the EN ISO 7887 standard, the absorbance measurement can be applied at four different wavelength points. The measurements made at 525 and 620 nm wavelengths are selective ones, while the measurement at 436 nm is obligatory for all kinds of dye. Therefore, we preferred to measure the absorbance of waste waters at this single wavelength. The absorbance results were recorded with a platinum-cobalt (pt-co) scale unit.
Method
The dyeing recipe
In order to prepare the artificial dyeing solutions, three types of dyeing auxiliaries were chosen. The wetting, sequestering and anti-crease agents were used in the concentration of 1 g/l. In addition, to prevent foam forming in the dyeing solution, 0.2 g/l defoamer was used in the solutions.
The ozonation process was applied in the reactor at the volume of 1.2 l (at 23 cm) (Figure 8). This volume was optimum to reduce the amount of dissolved ozone gas. The ozone flow from the generator to the reactor was adjusted and fixed to 5l/minute. The constant flow rate of the ozone gas was continuously measured using a flowmeter.
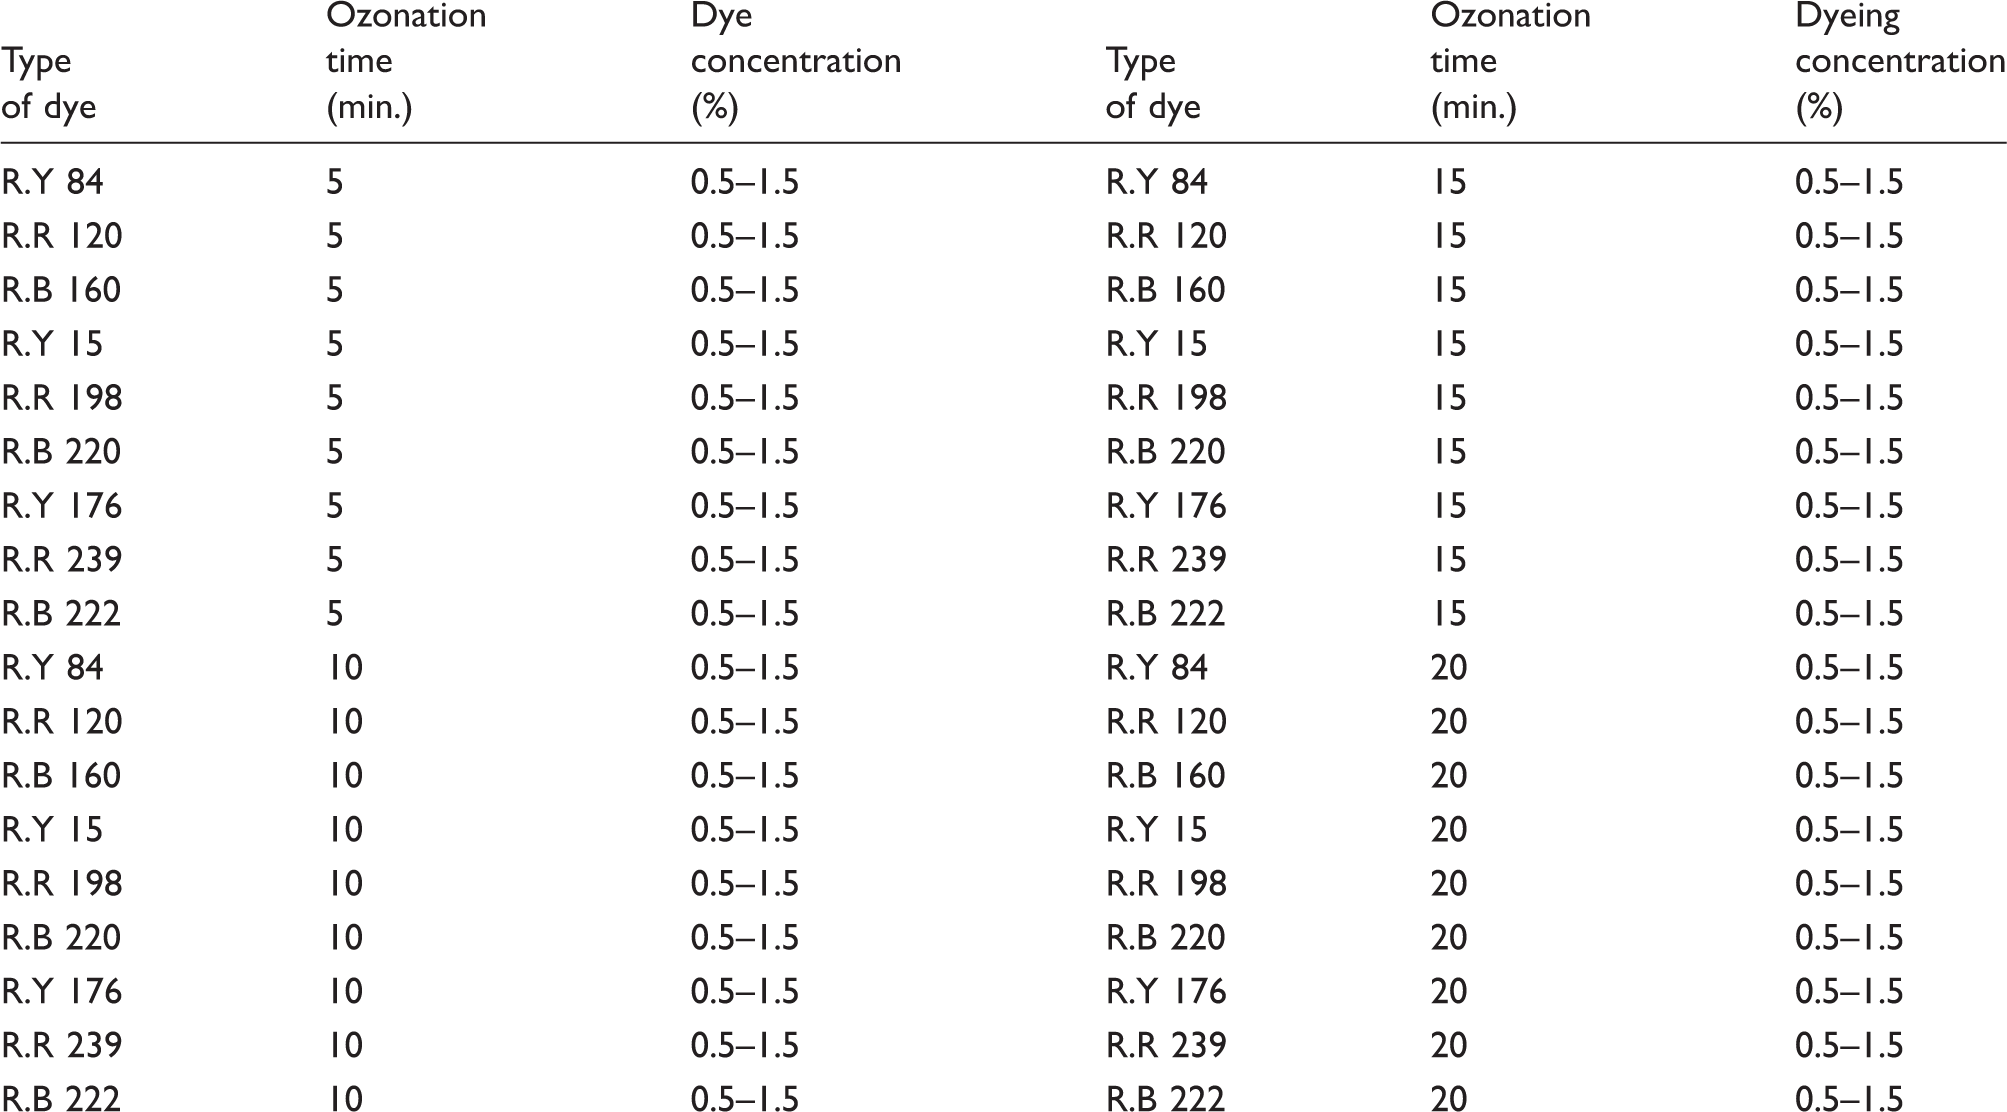
The effect of ozone on the decolorization efficiency depending on ozonation time and dye concentration of dyes having different chromophore and anchor groups (Design I)
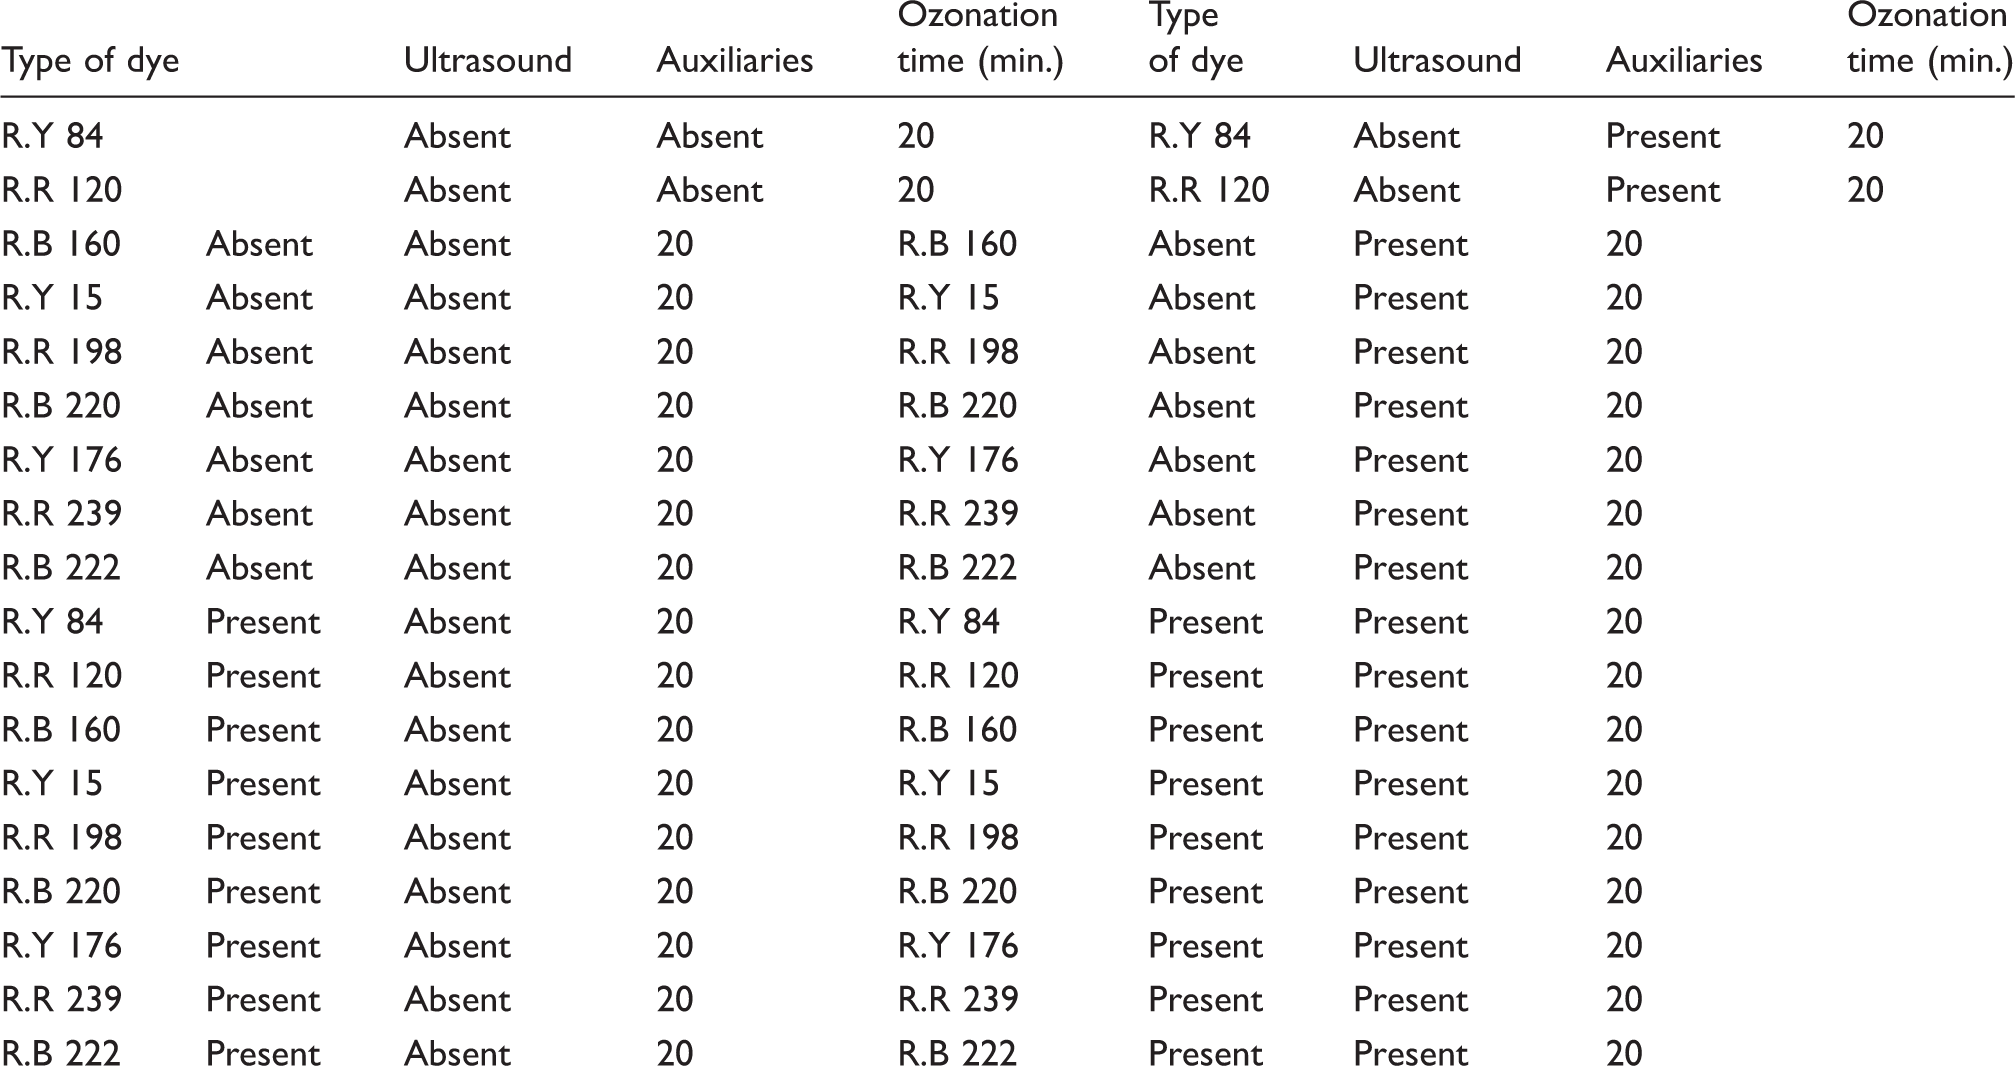
The effect of ozone on the decolorization efficiency depending on ultrasound, dyeing auxiliaries, ultrasound and dyeing auxiliaries (Design II)

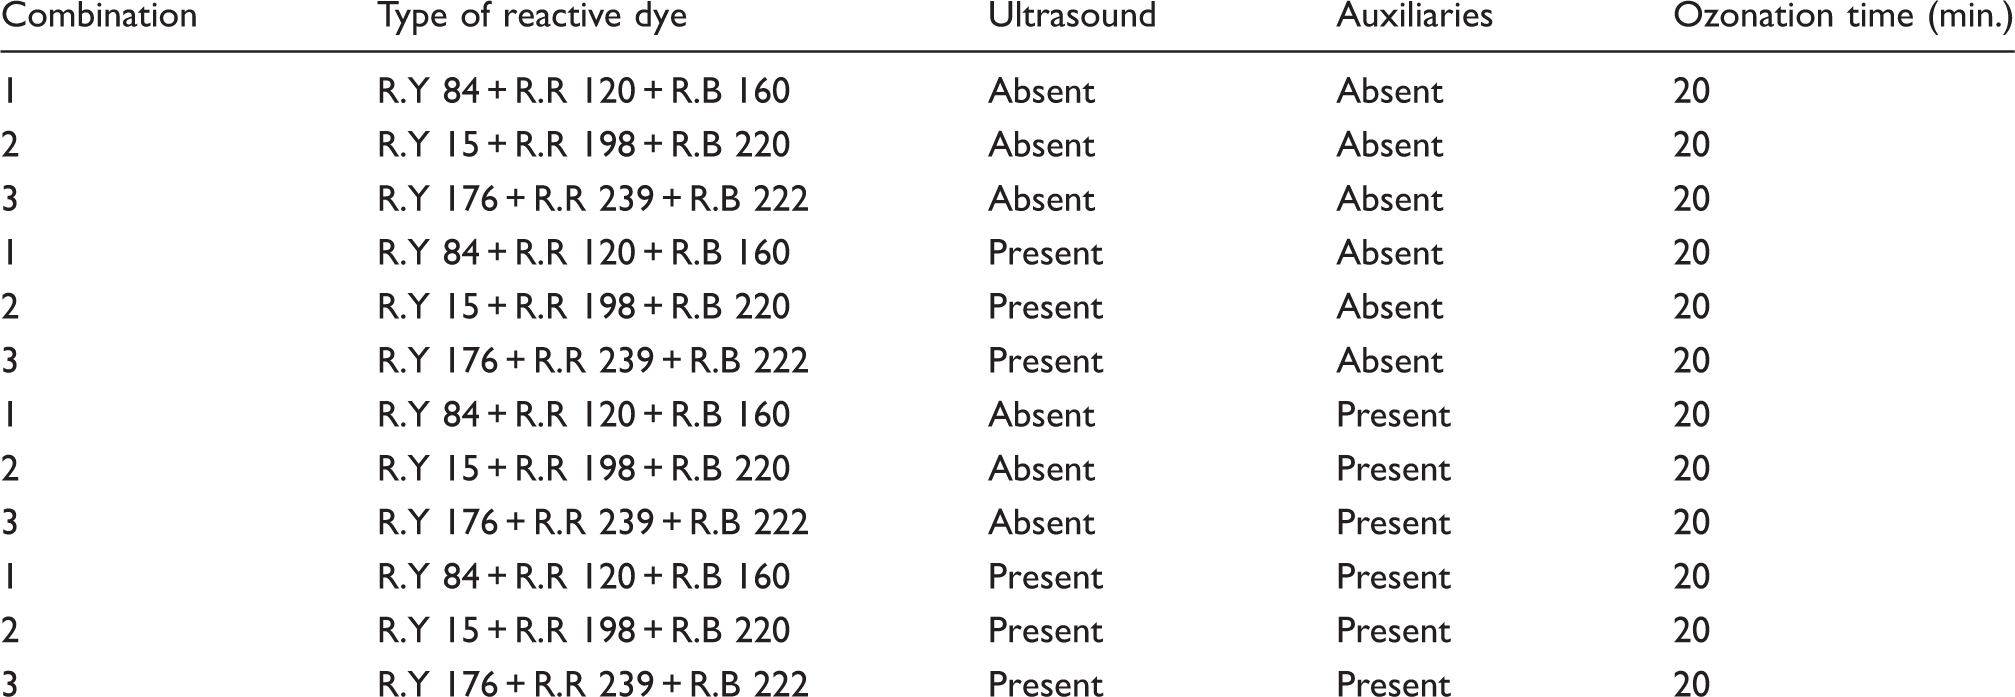
The effect of ozone on the decolorization efficiency depending on the dye combinations (Design III)
The measured absorbance values after treatments are shown in Tables 3–5; the absorbance values were converted into percentage of color removal according to Equation (8).
In addition, at the end of the study, the statistical analysis was carried out using all experimental results (individually for Designs I–III) in order to determine the effect of the investigated working parameters (input) on the decolorization (output) efficiency by one-way analysis of variance (ANOVA).
Results and discussion
The experimental design was divided into three parts, Designs I–III.
The results of Design I (Table 3)
The details of Design I are shown in Table 3. The measured absorbance value of the treated wastewaters and calculated decolorization efficiency (%) for Design I are shown in Figures 9–16.
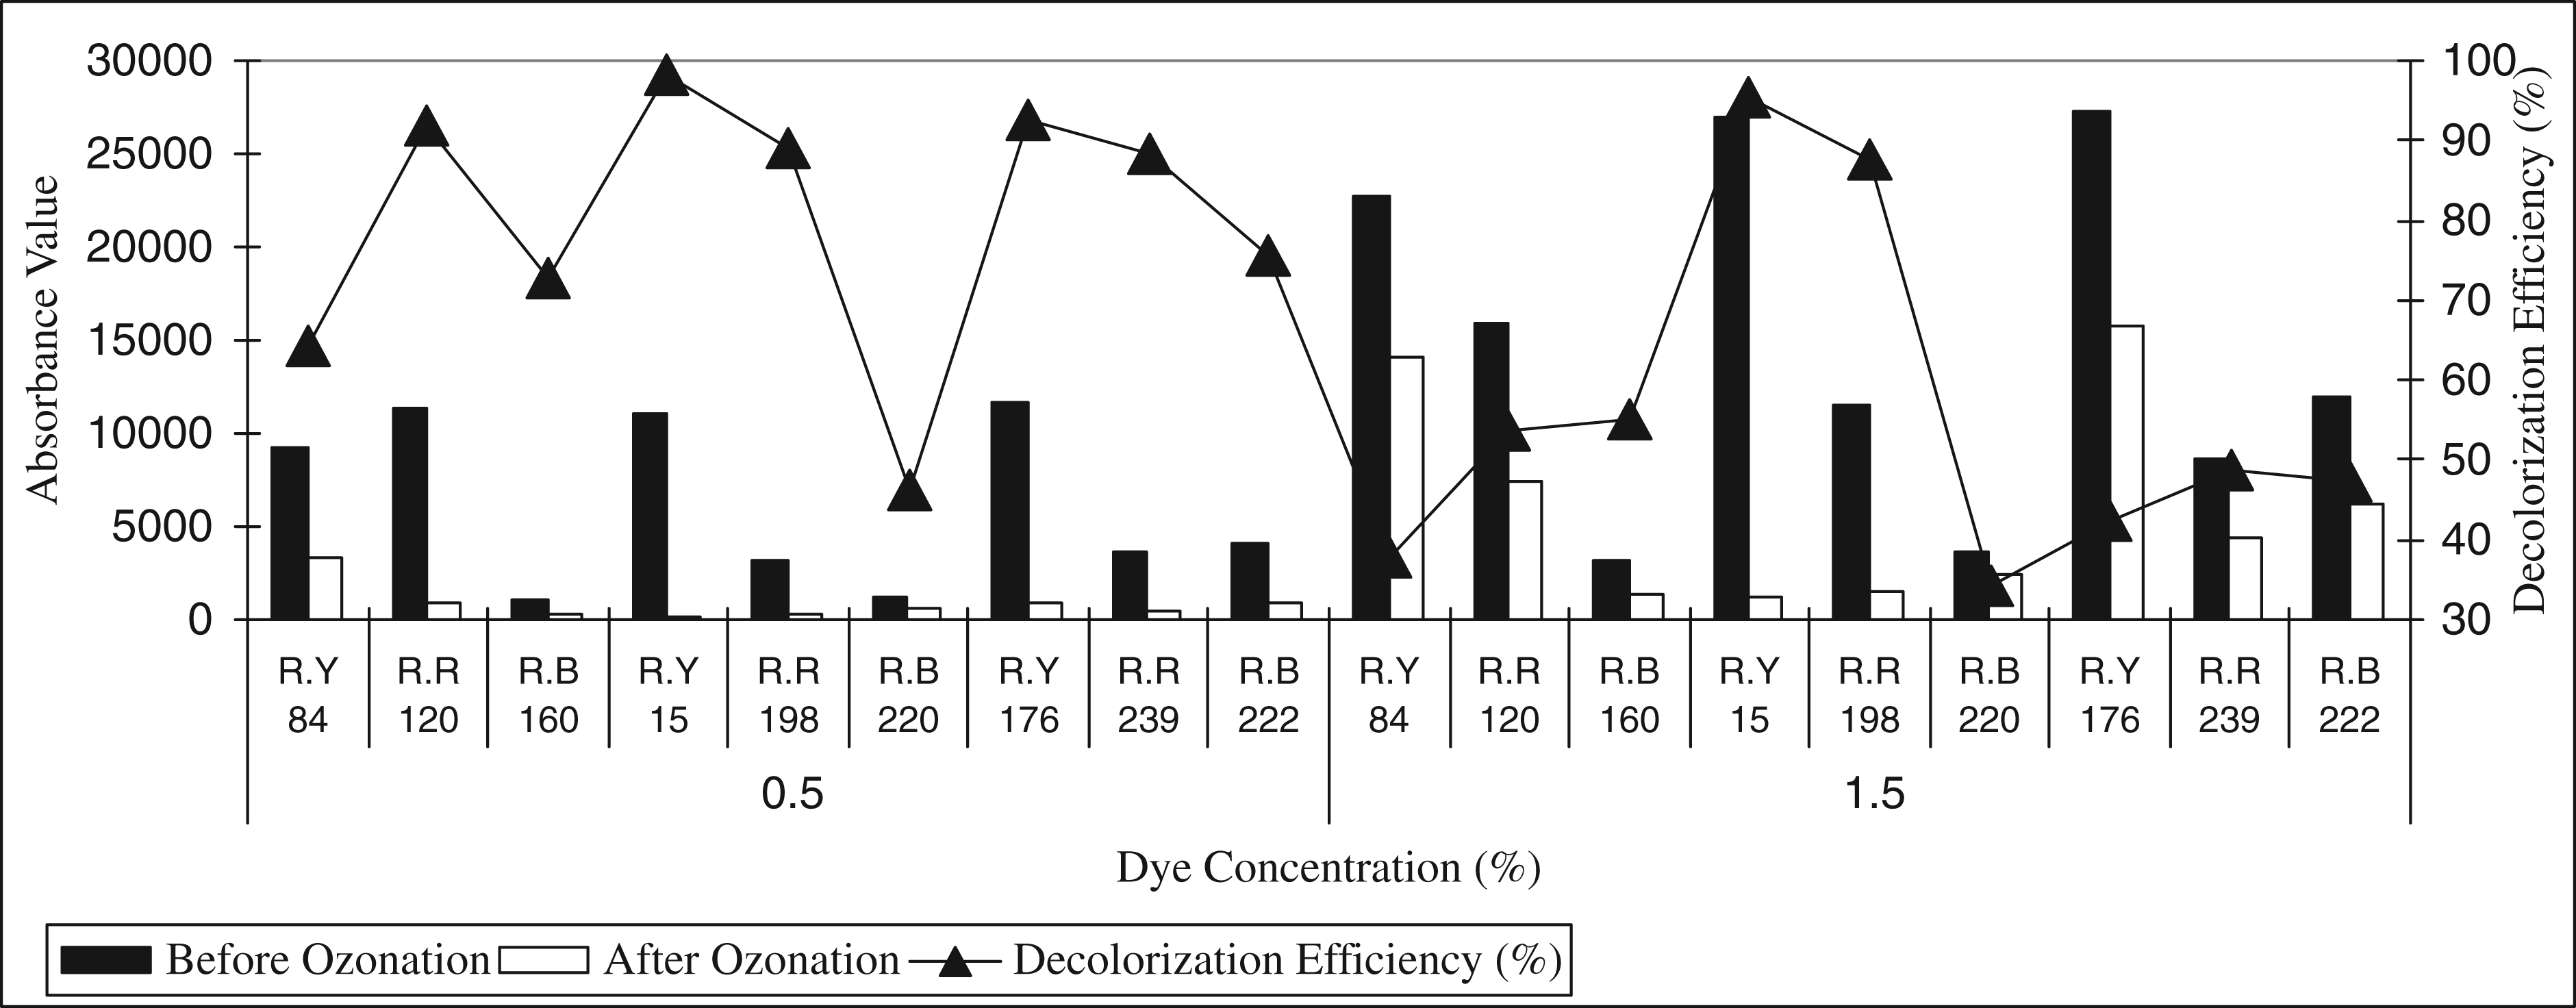
The effect of ozone on decolorization efficiency, depending on ozonation time of dyes having different chromophore and anchor groups (for dye concentration of 0.5%).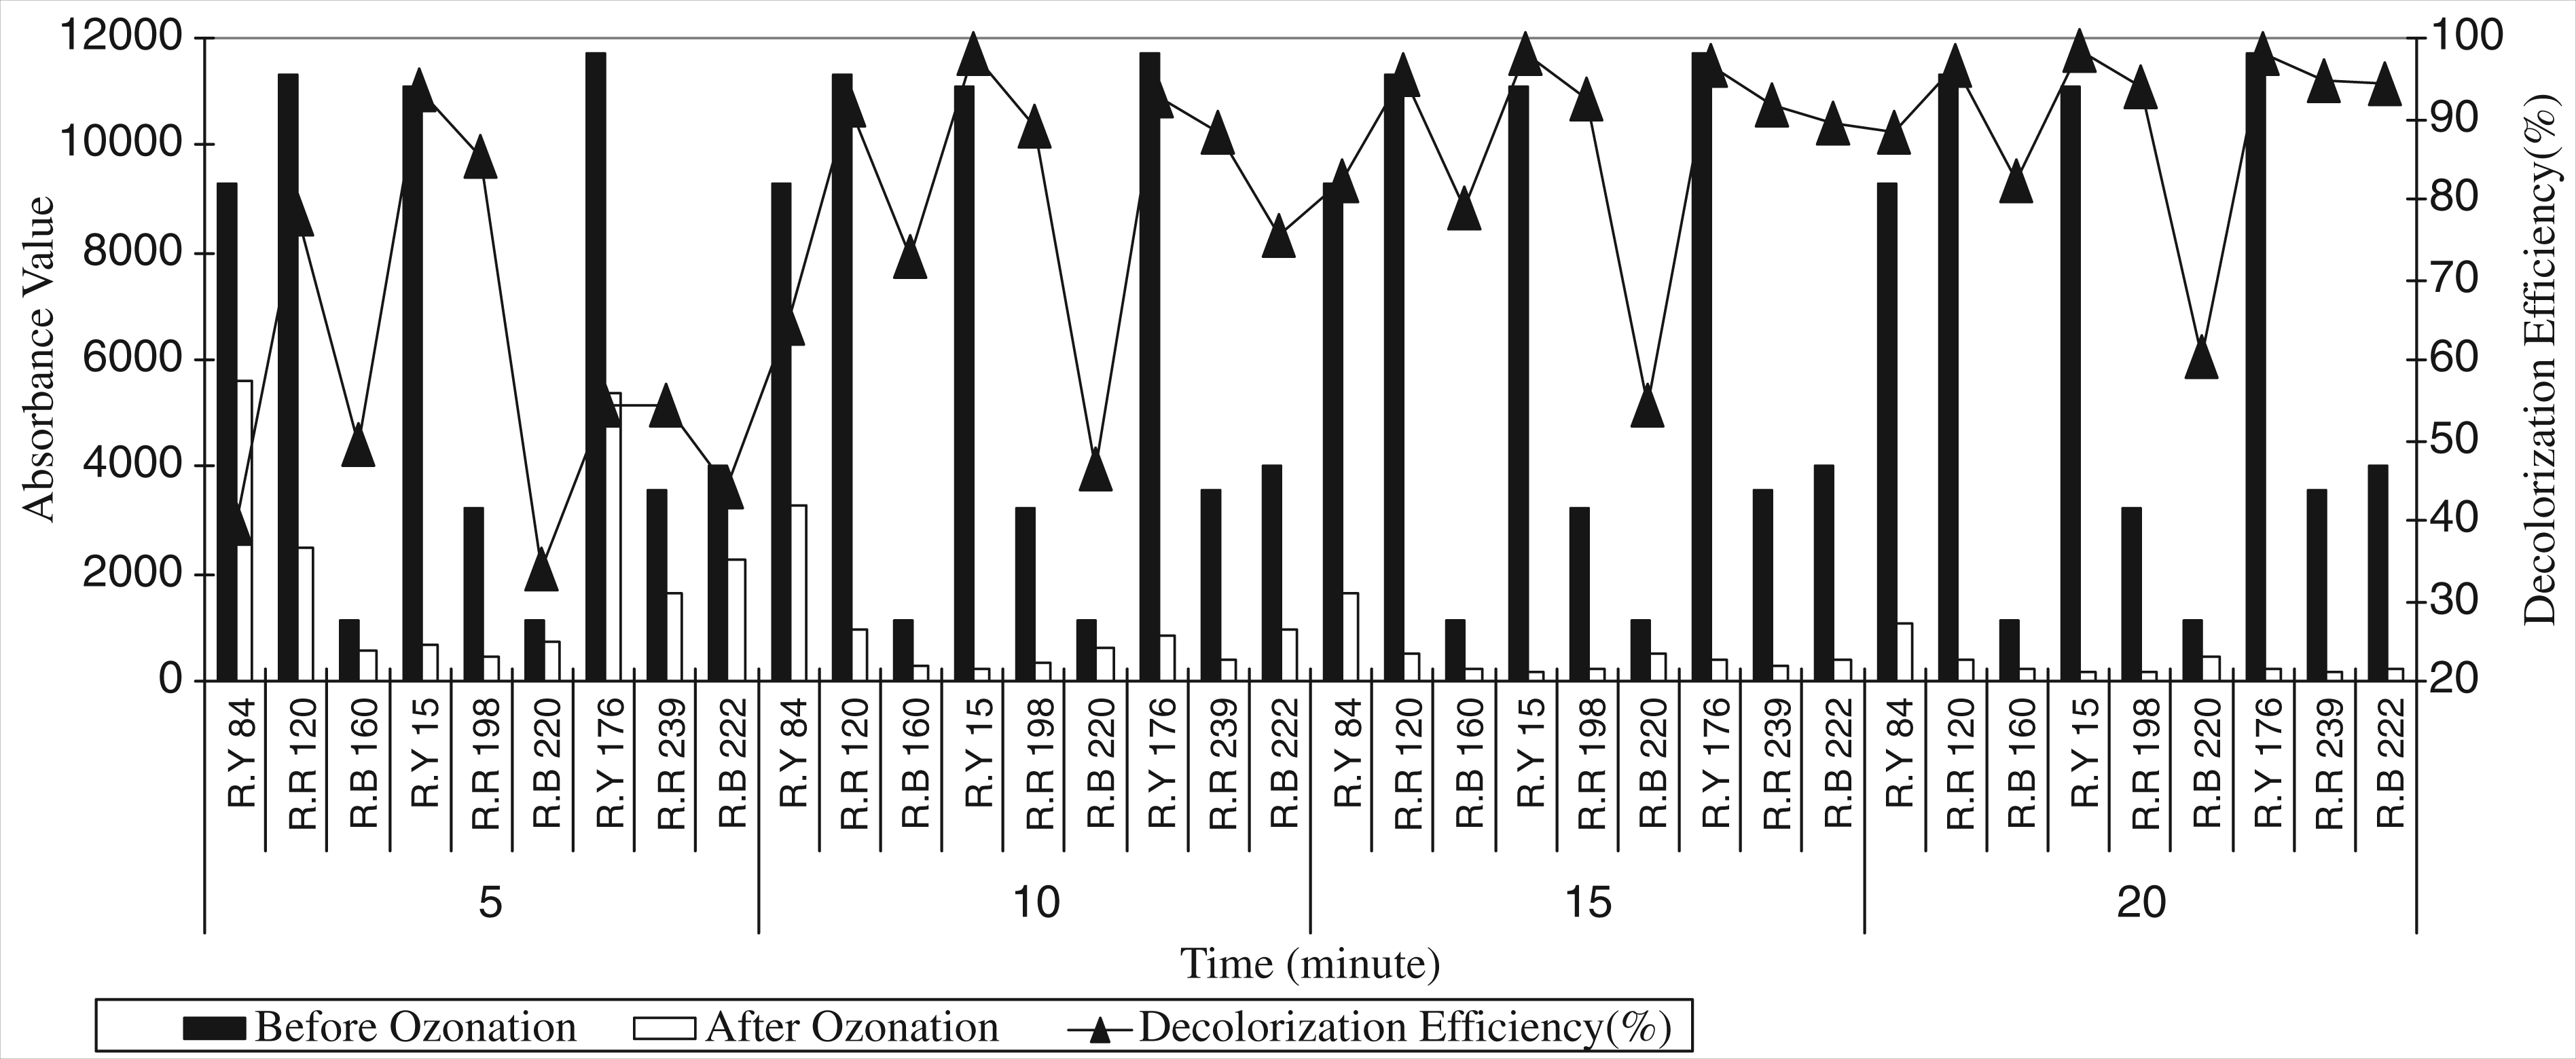
When Figures 9 and 10 were analyzed, it could be said that color removal efficiencies, depending on the dye concentrations (0.5% and 1.5%), varied from 34 to 98% and 13 to 97%, respectively. In addition, Figures 9 and 10 show that as long as ozonation time increased, decolorization efficiency improved. The best decolorization efficiency was obtained at 20 minutes of ozonation time (Figure 11).
The effect of ozone on decolorization efficiency depending on ozonation time of dyes having different chromophore and anchor groups (for dye concentration of 1.5%). The comparison of ozonation efficiency, depending on dye concentration (owf %).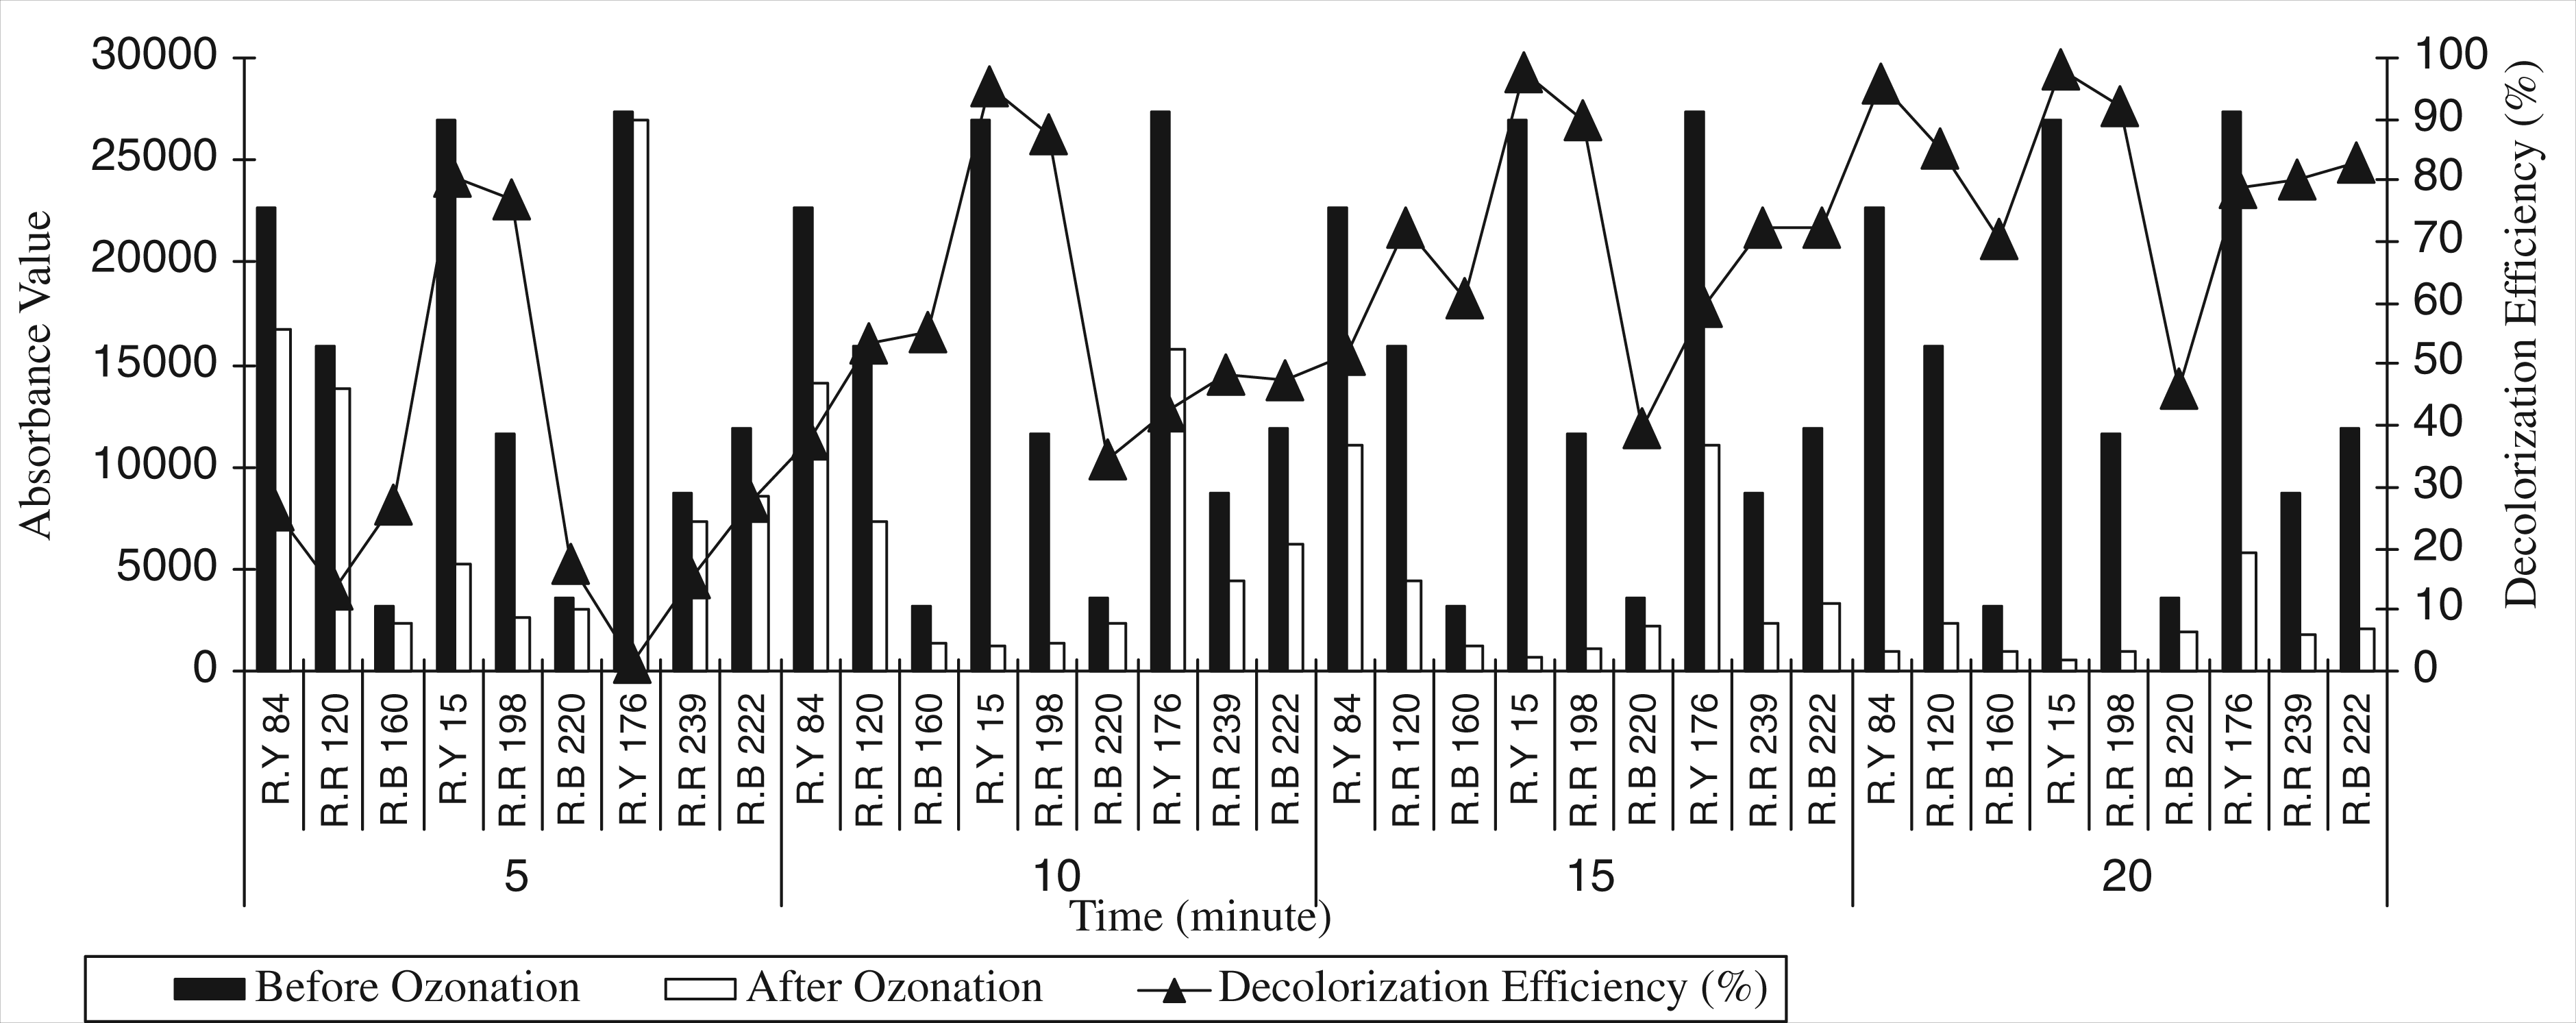
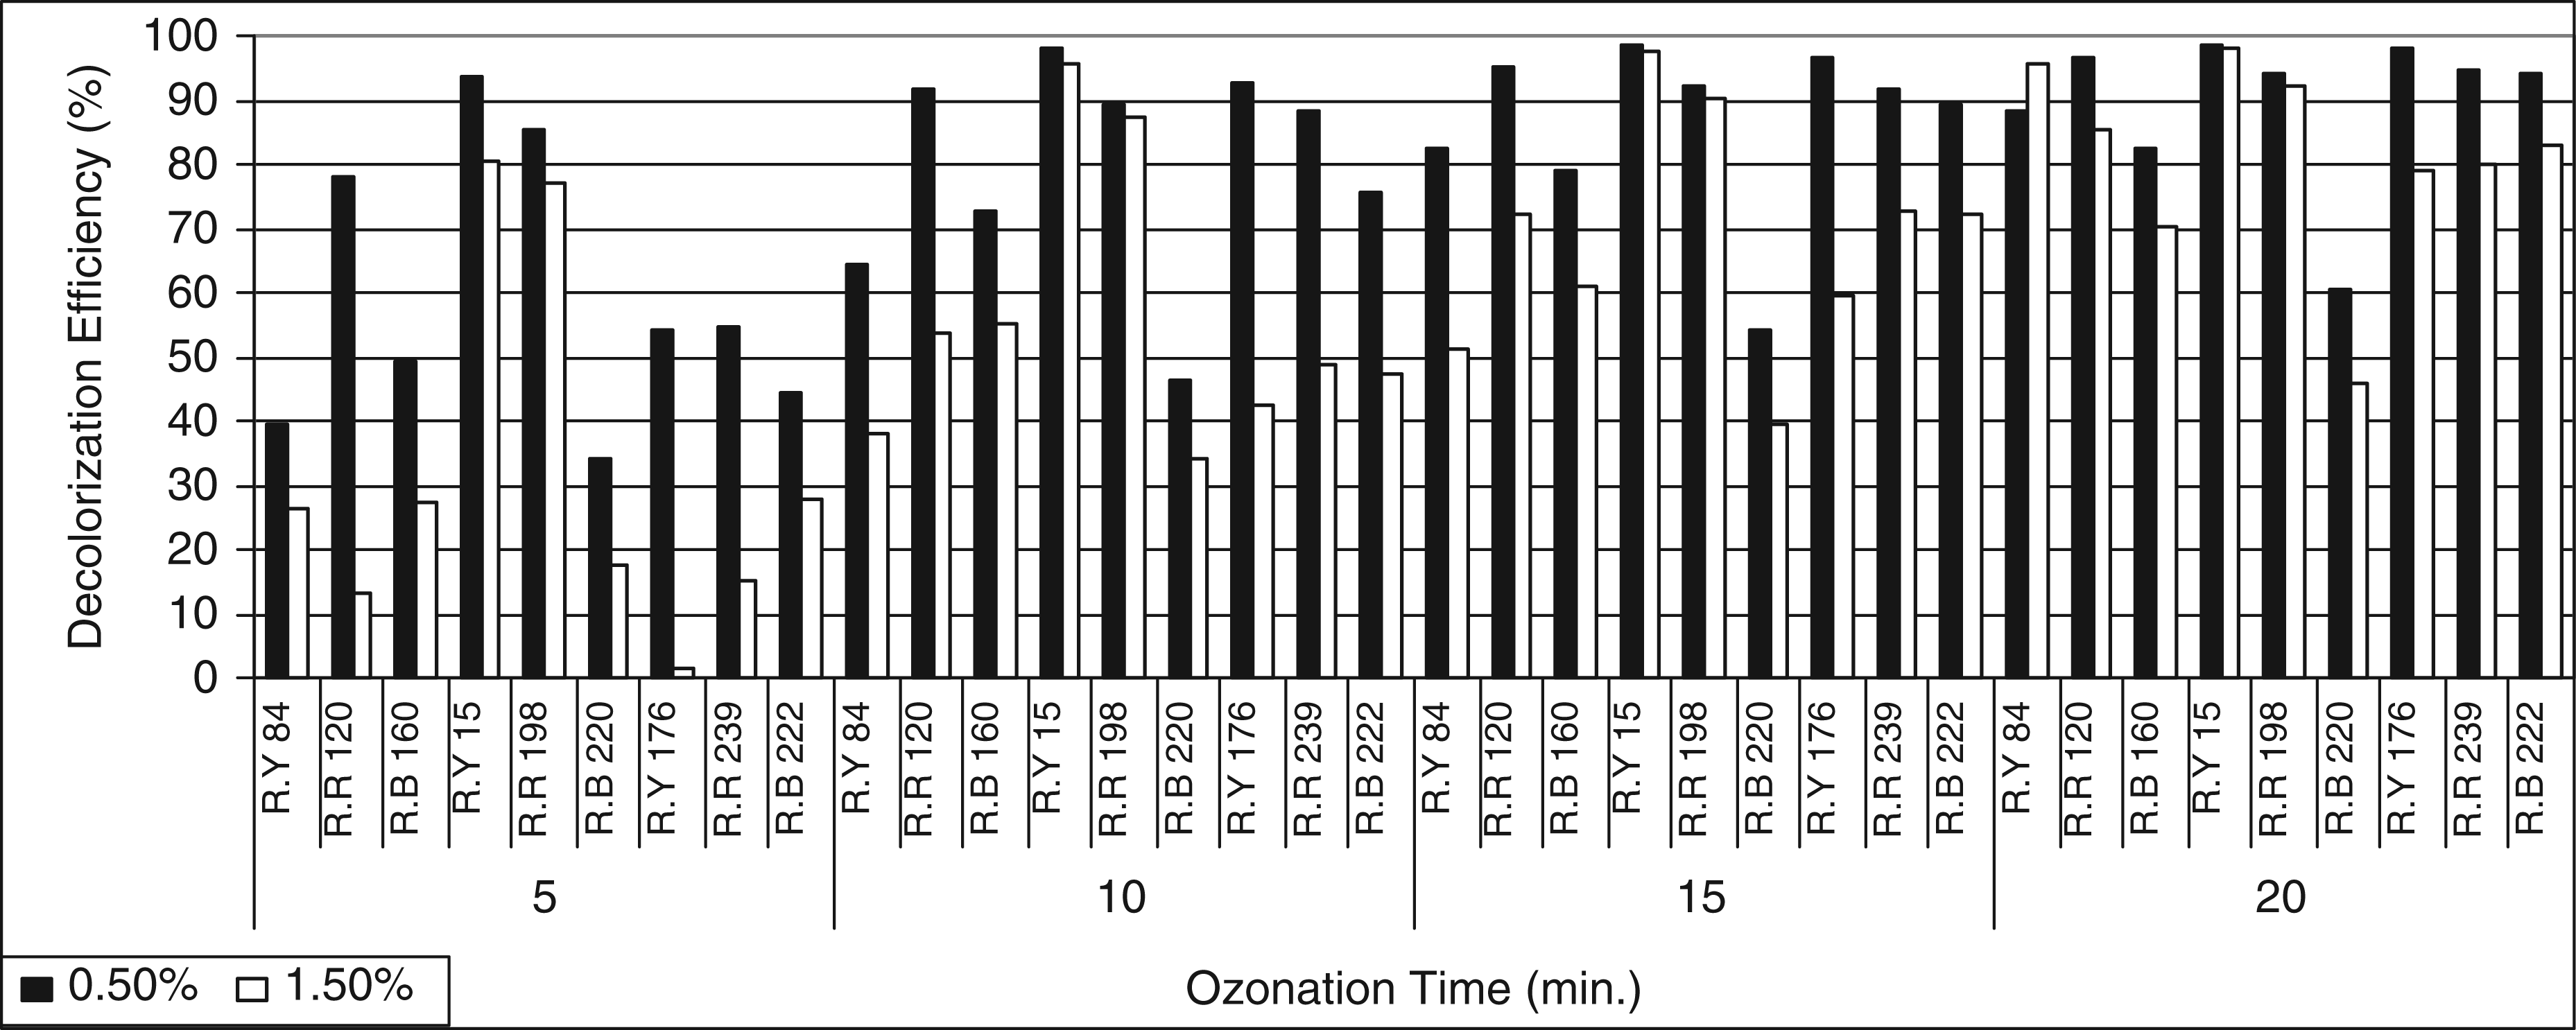
In Figures 13–16, the results of Design I are analyzed in terms of ozonation time, depending on dye concentrations and the chemical structure of dyes.
The comparison of ozonation efficiency, depending on process time and type of dye (owf %). The effect of ozone on decolorization efficiency, depending on dye concentration of dyes having different chromophore and anchor groups (for 5 minutes ozonation time). The effect of ozone on decolorization efficiency, depending on dye concentration of dyes having different chromophore and anchor groups (for 10 minutes ozonation time). The effect of ozone on decolorization efficiency, depending on dye concentration of dyes having different chromophore and anchor groups (for 15 minutes ozonation time).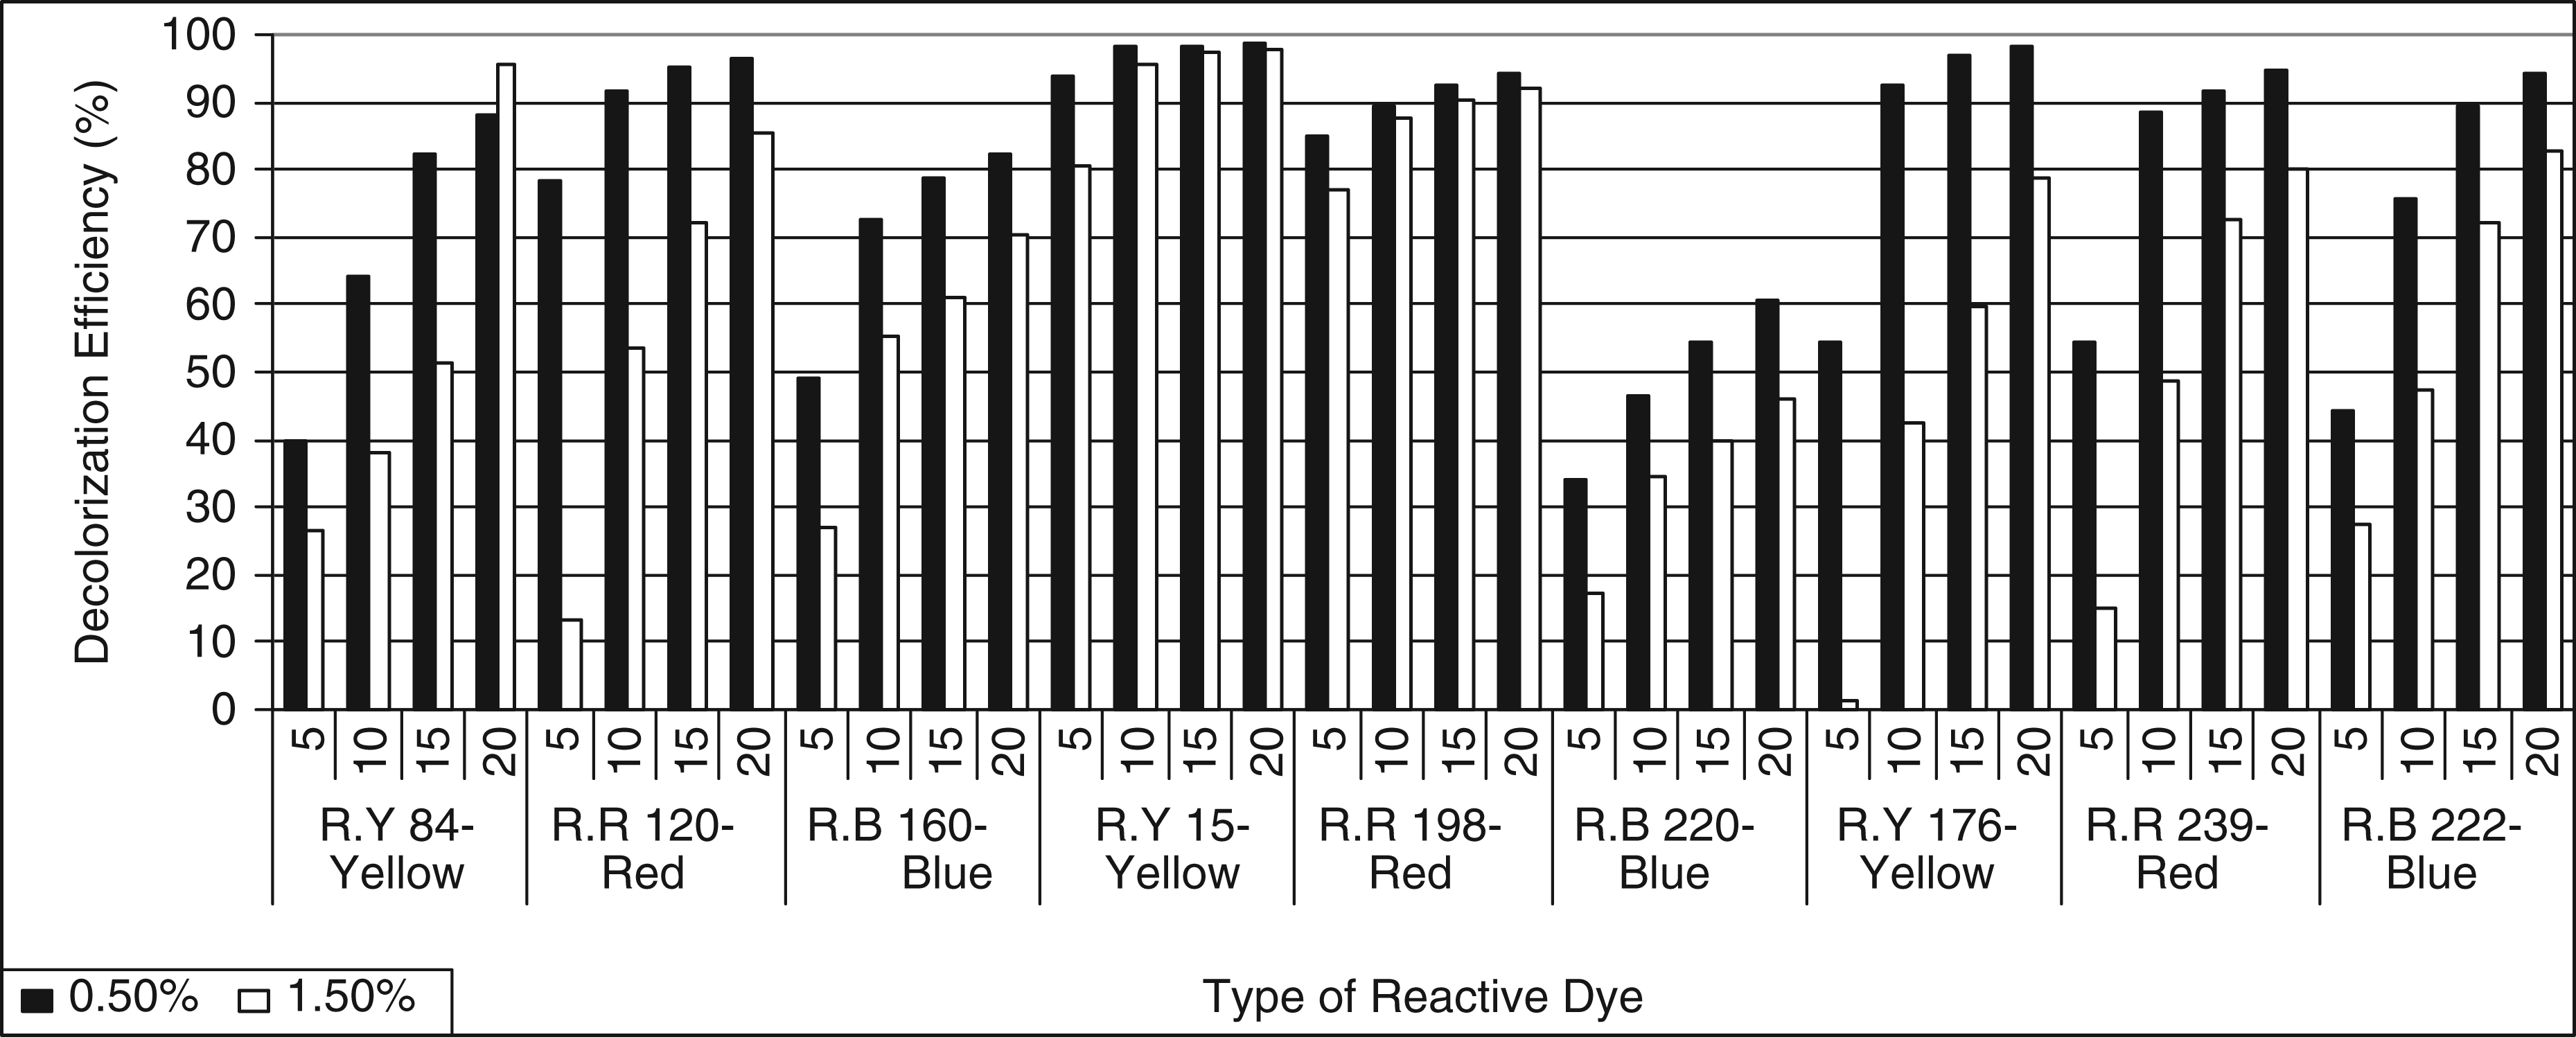
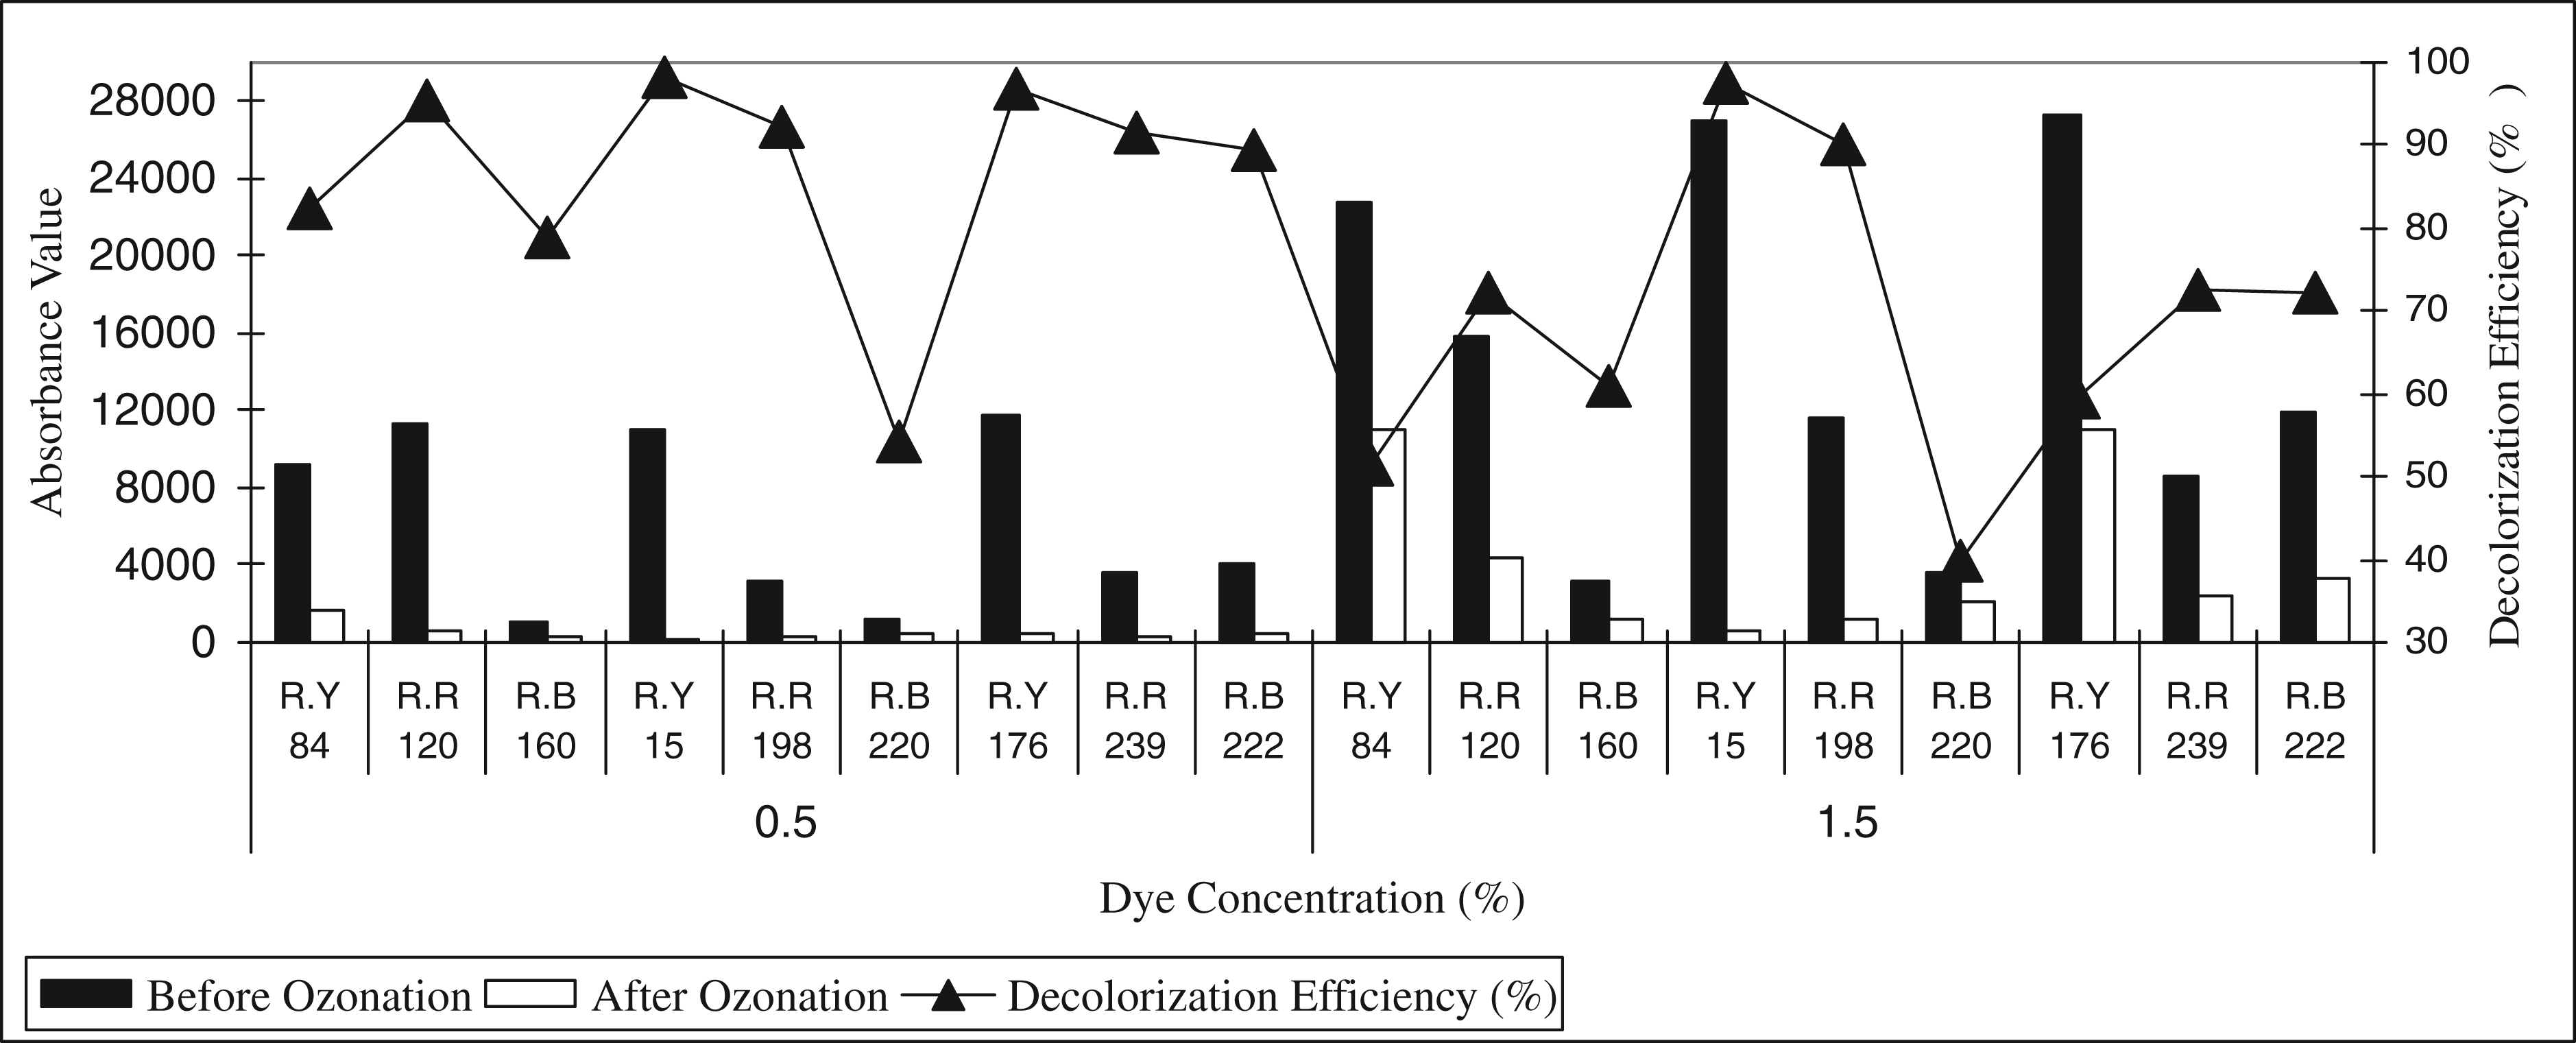
When these figures were investigated in detail, it could be said that color removal values were changed depending on the dye concentration (0.5–1.5%) between 13 and 93%, 37 and 98%, 51 and 98% and 46 and 98% for 5, 10, 15 and 20 minutes ozonation, respectively, for all kinds of reactive dye.
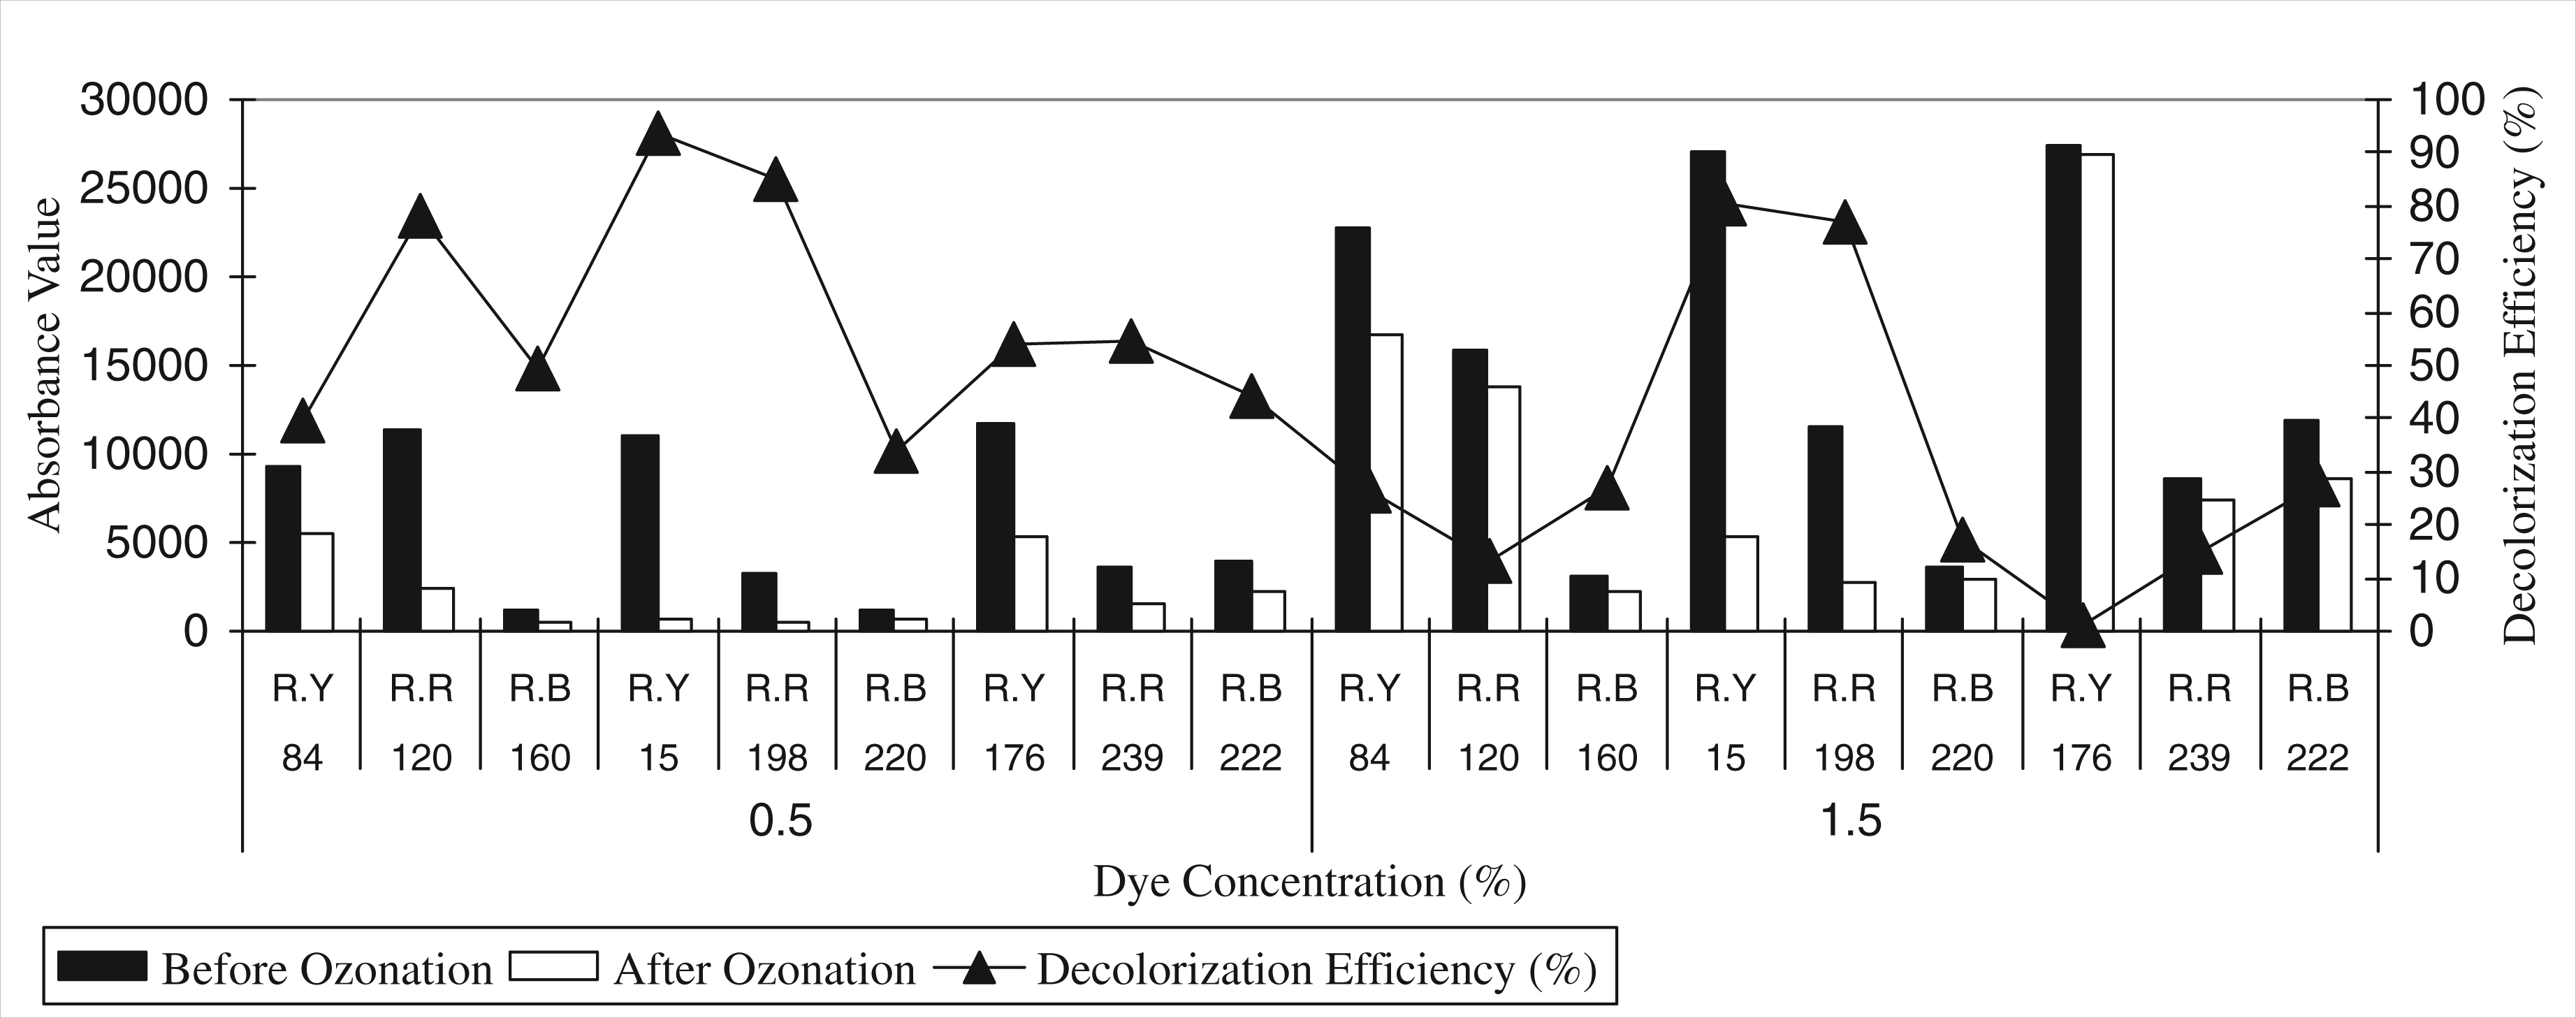
Figure 11 showed that the owf % value of the reactive dye was another effective factor for decolorization efficiency. The efficiency of ozone gas decreased by increasing the owf (%) of the dye in the artificial effluent solutions. In addition, it was found out that the improvement of the efficiency of the decolorization process was related to the increase of the process time, which occurred more clearly for solutions with 1.5% dye concentration (Figure 12).
According to Figure 12, it could be said that the decrease in the decolorization efficiency with the increase of the dye concentration was also related to the anchor group of the reactive dye. Both the chromophore and anchor group of a reactive dye were effective factors for the oxidation capability of reactive dye. In the study, we found that the change on the anchor group of the dye affected the decolorization efficiency directly, because the method of decolorization used in the study was one of advanced oxidation.
According to Figure 12, the decolorization of reactive dye having a vinylsulphone (VS) anchor group occurred more easily than in others. The difficulty level of the dye in terms of decolorization ability could be ordered as monochlorotriazine (MCT) > MCT/VS > VS. The dye with the VS anchor group is more sensitive to the oxidation process than dyes having MCT or MCT/VS groups. 32 This meant that while decoloring reactive dyes using the ozonation method, the anchor group should be observed as a crucial factor.
In the study, we also aimed to compare the effect of the chromophor groups of reactive dyes on the decolorization efficiency. When the results from Figures 9 and 10 were analyzed, it clearly could be said that the effect of the chromophor group on the decolorization showed a difference, depending on the anchor of the dyes. For two dye concentrations (0.5% and 1.5%), the best and the worst decolorization efficiencies were obtained for RY 15 and RB 220 dyes, respectively. When Figures 9–16 were examined, it was seen that the dyes with monoazo chromophore groups had better decolorization efficiency than the rest. The reactive dyes that had “azo-cu” chromophore groups had the worst decolorization efficiency. As is known, ozone gas shows its real oxidative activity on the chromophore group of dye; therefore, this kind of search is useful for process optimization.
4
The effect of ozone on decolorization efficiency, depending on dye concentration of dyes having different chromophore and anchor groups (for 20 minutes ozonation time).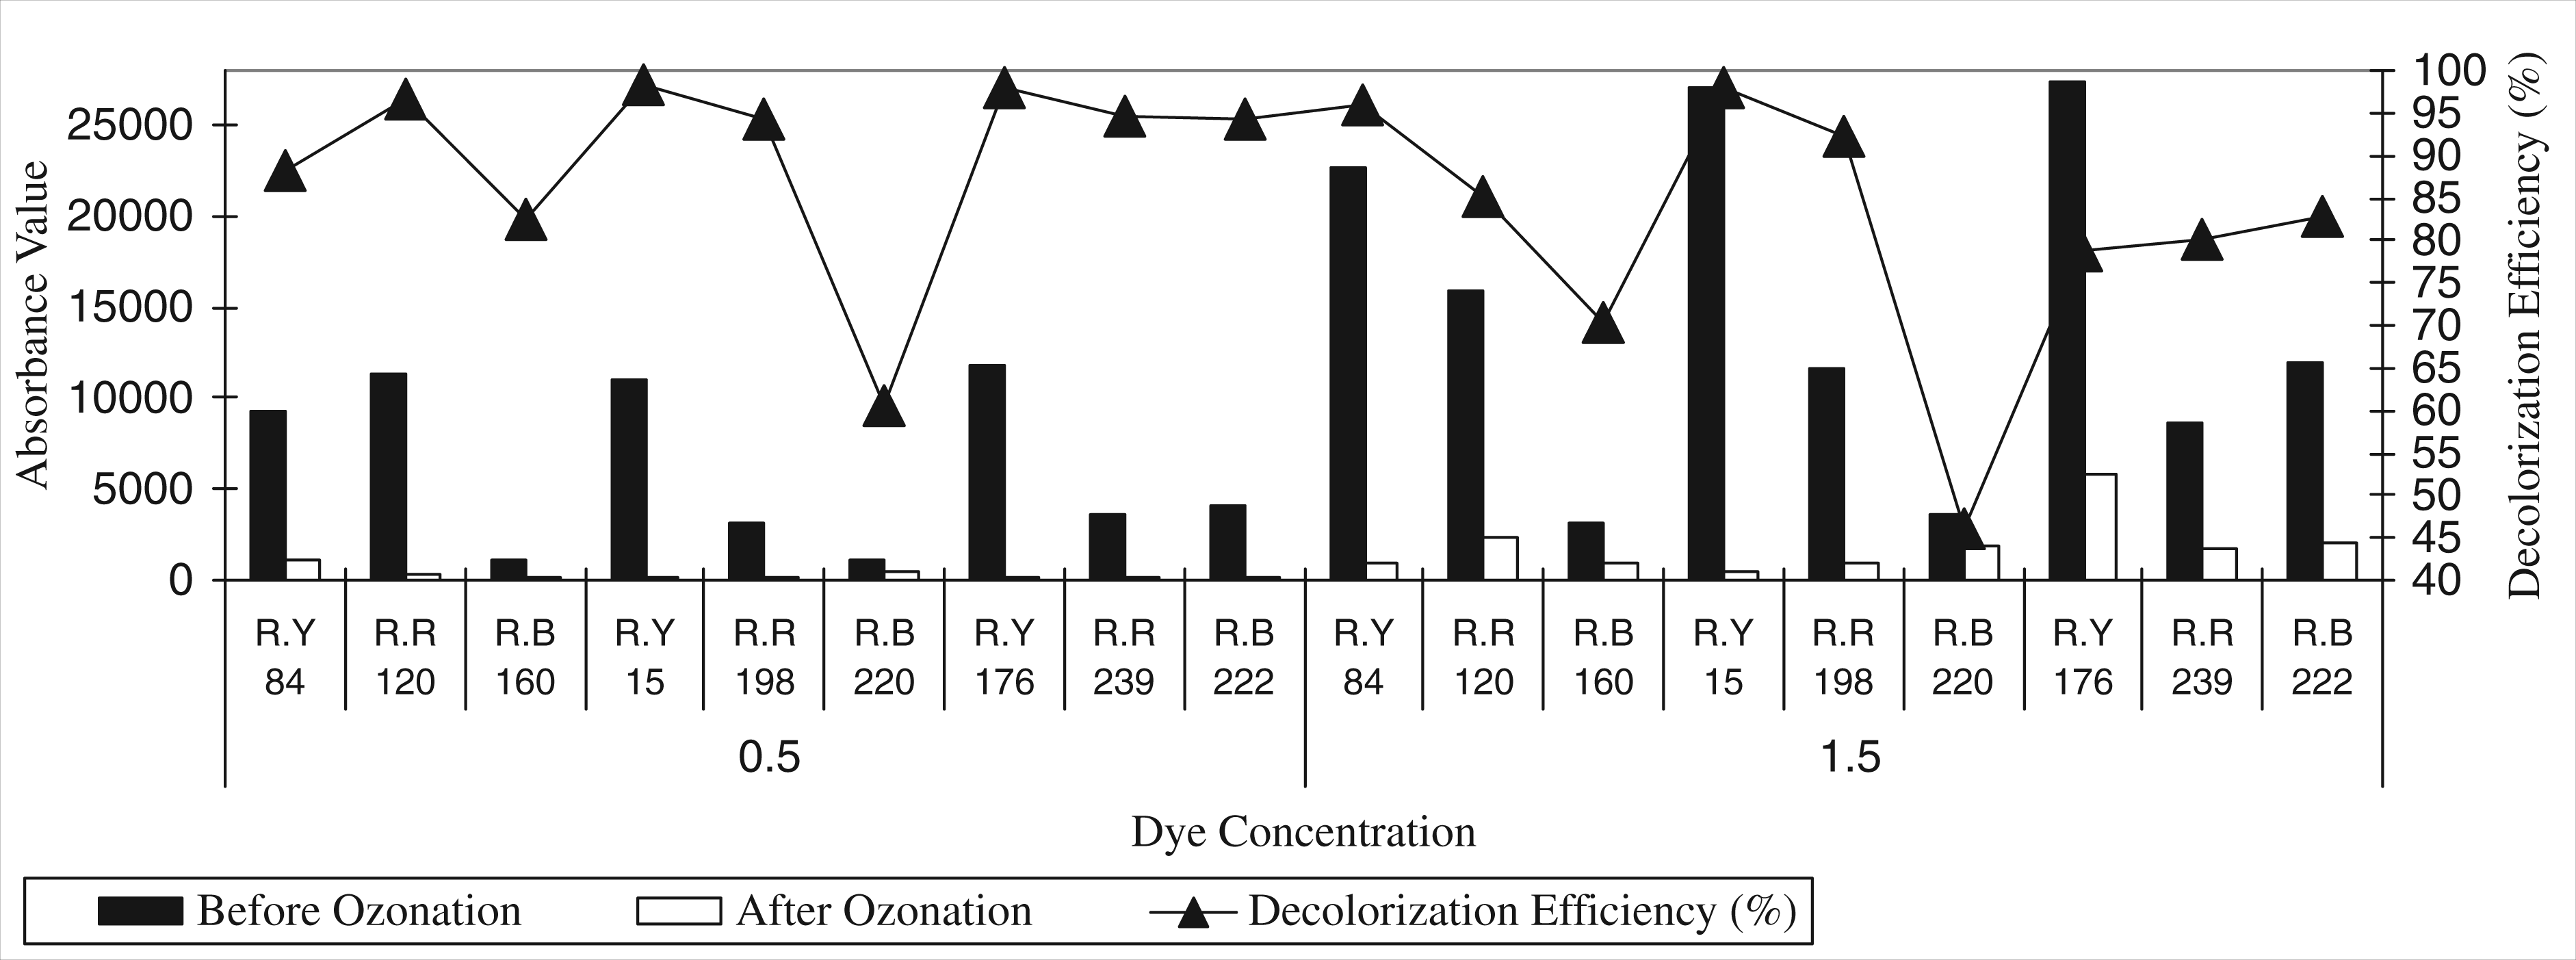
Contrary to some results given in the literature, ozone gas that was dissolved in the water had a tendency to react with heavy metal in the water before other materials. After the reaction, ozone gas was consumed and changed to oxygen easily. This case decreased the efficiency and solubility of ozone gas. Therefore, it was thought that the ozone gas showed less efficiency on the dye with the “azo-cu” chromophore group.
The results of Design II
In order to investigate the effect of ozone on the decolorization efficiency, depending on the presence of ultrasound energy and dyeing auxiliaries, Design II was established (Table 4). In this design, the dye concentration and the ozonation time were chosen as 0.5% and 20 minutes, respectively. The measured absorbance values of these wastewaters and calculated decolorization efficiency can be seen in Figures 17–19.
The effect of ozone on decolorization efficiency, depending on the presence of ultrasound energy. The effect of ozone on decolorization efficiency, depending on the presence of dyeing auxiliaries. The effect of ozone on decolorization efficiency, depending on the presence of ultrasound energy and dyeing auxiliaries together.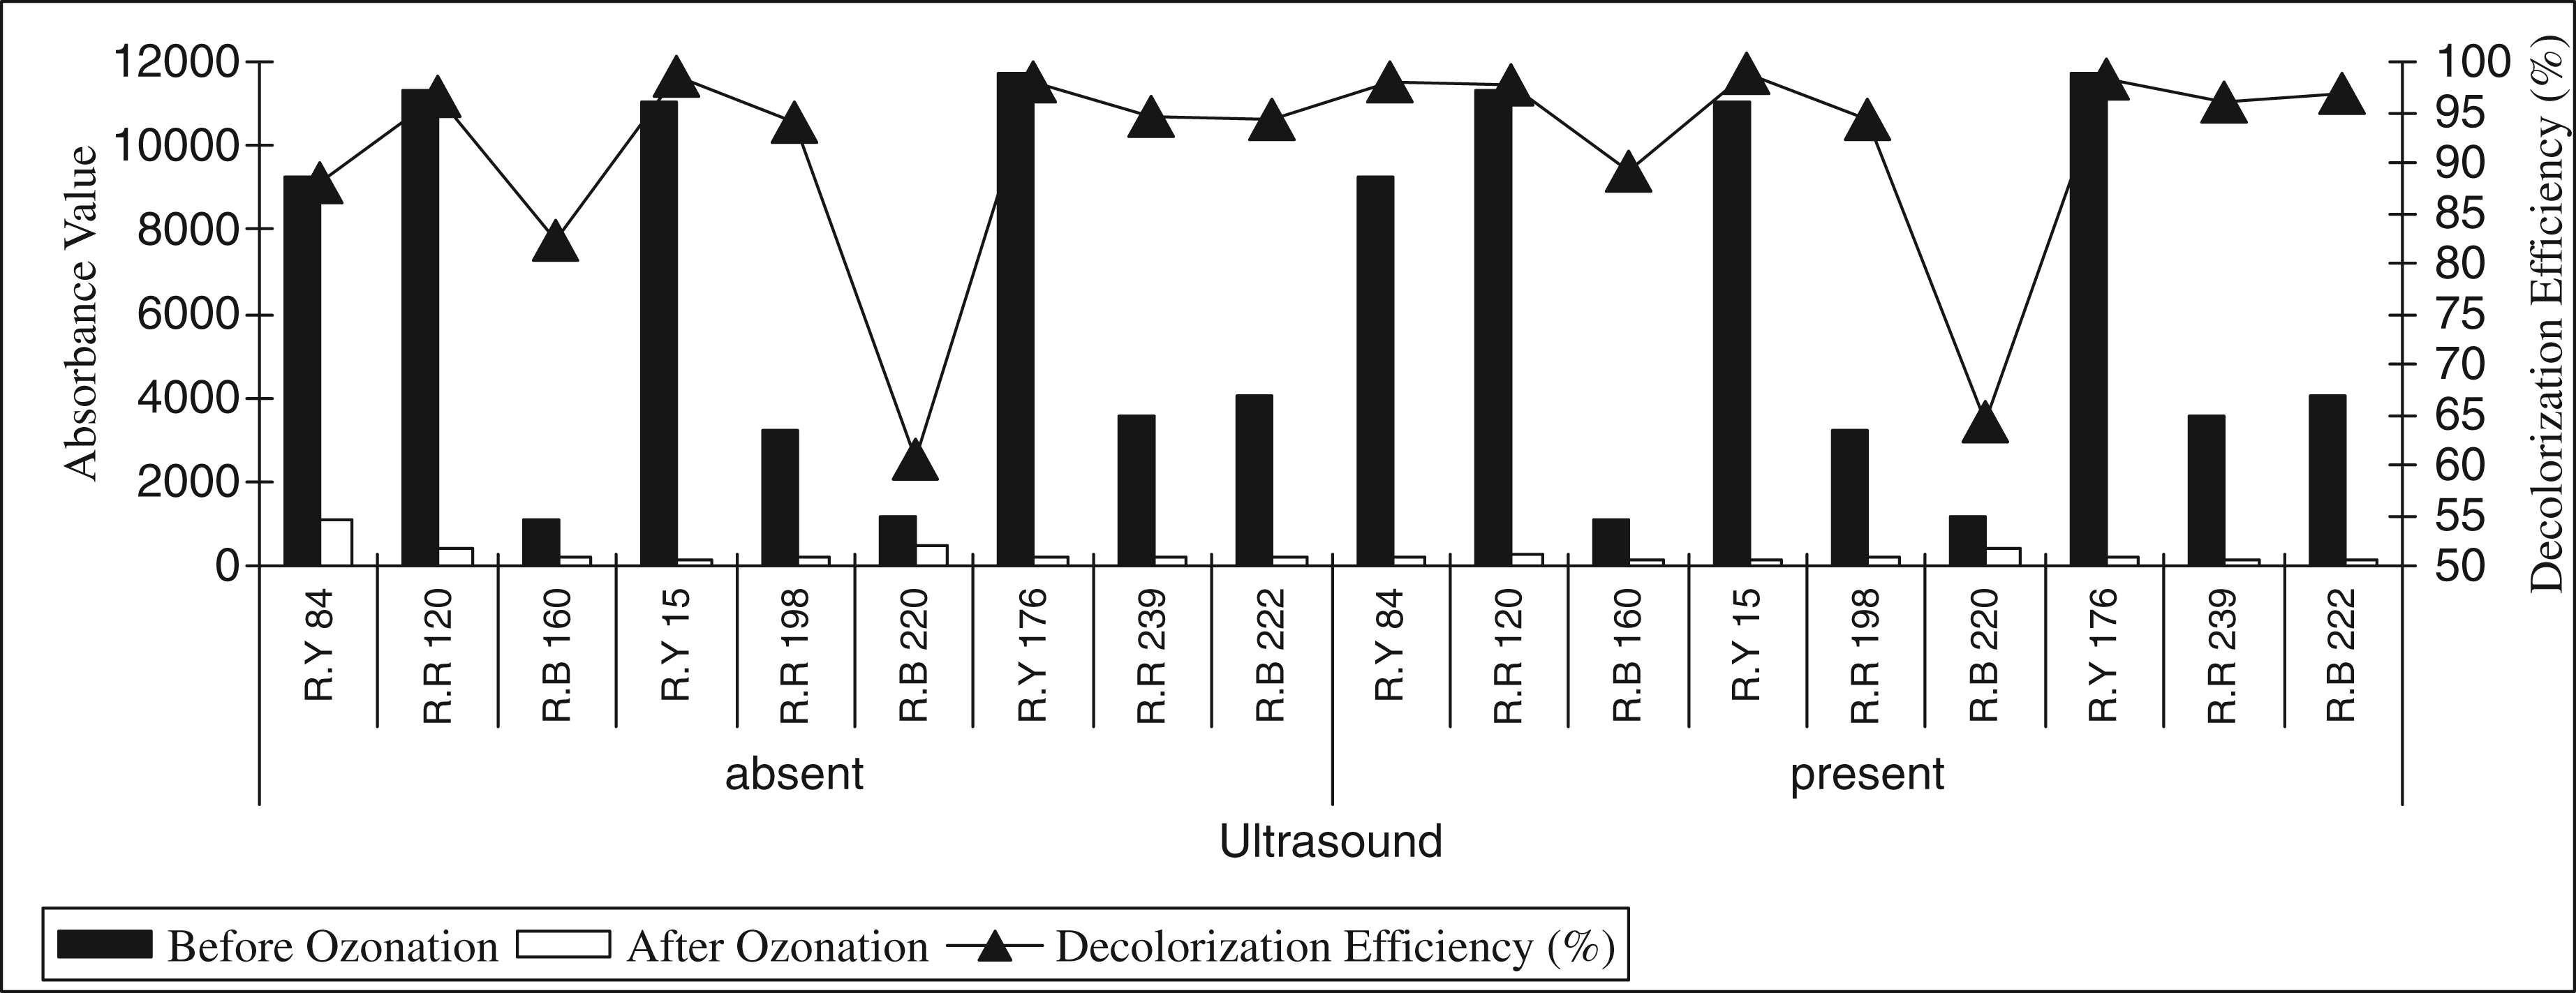
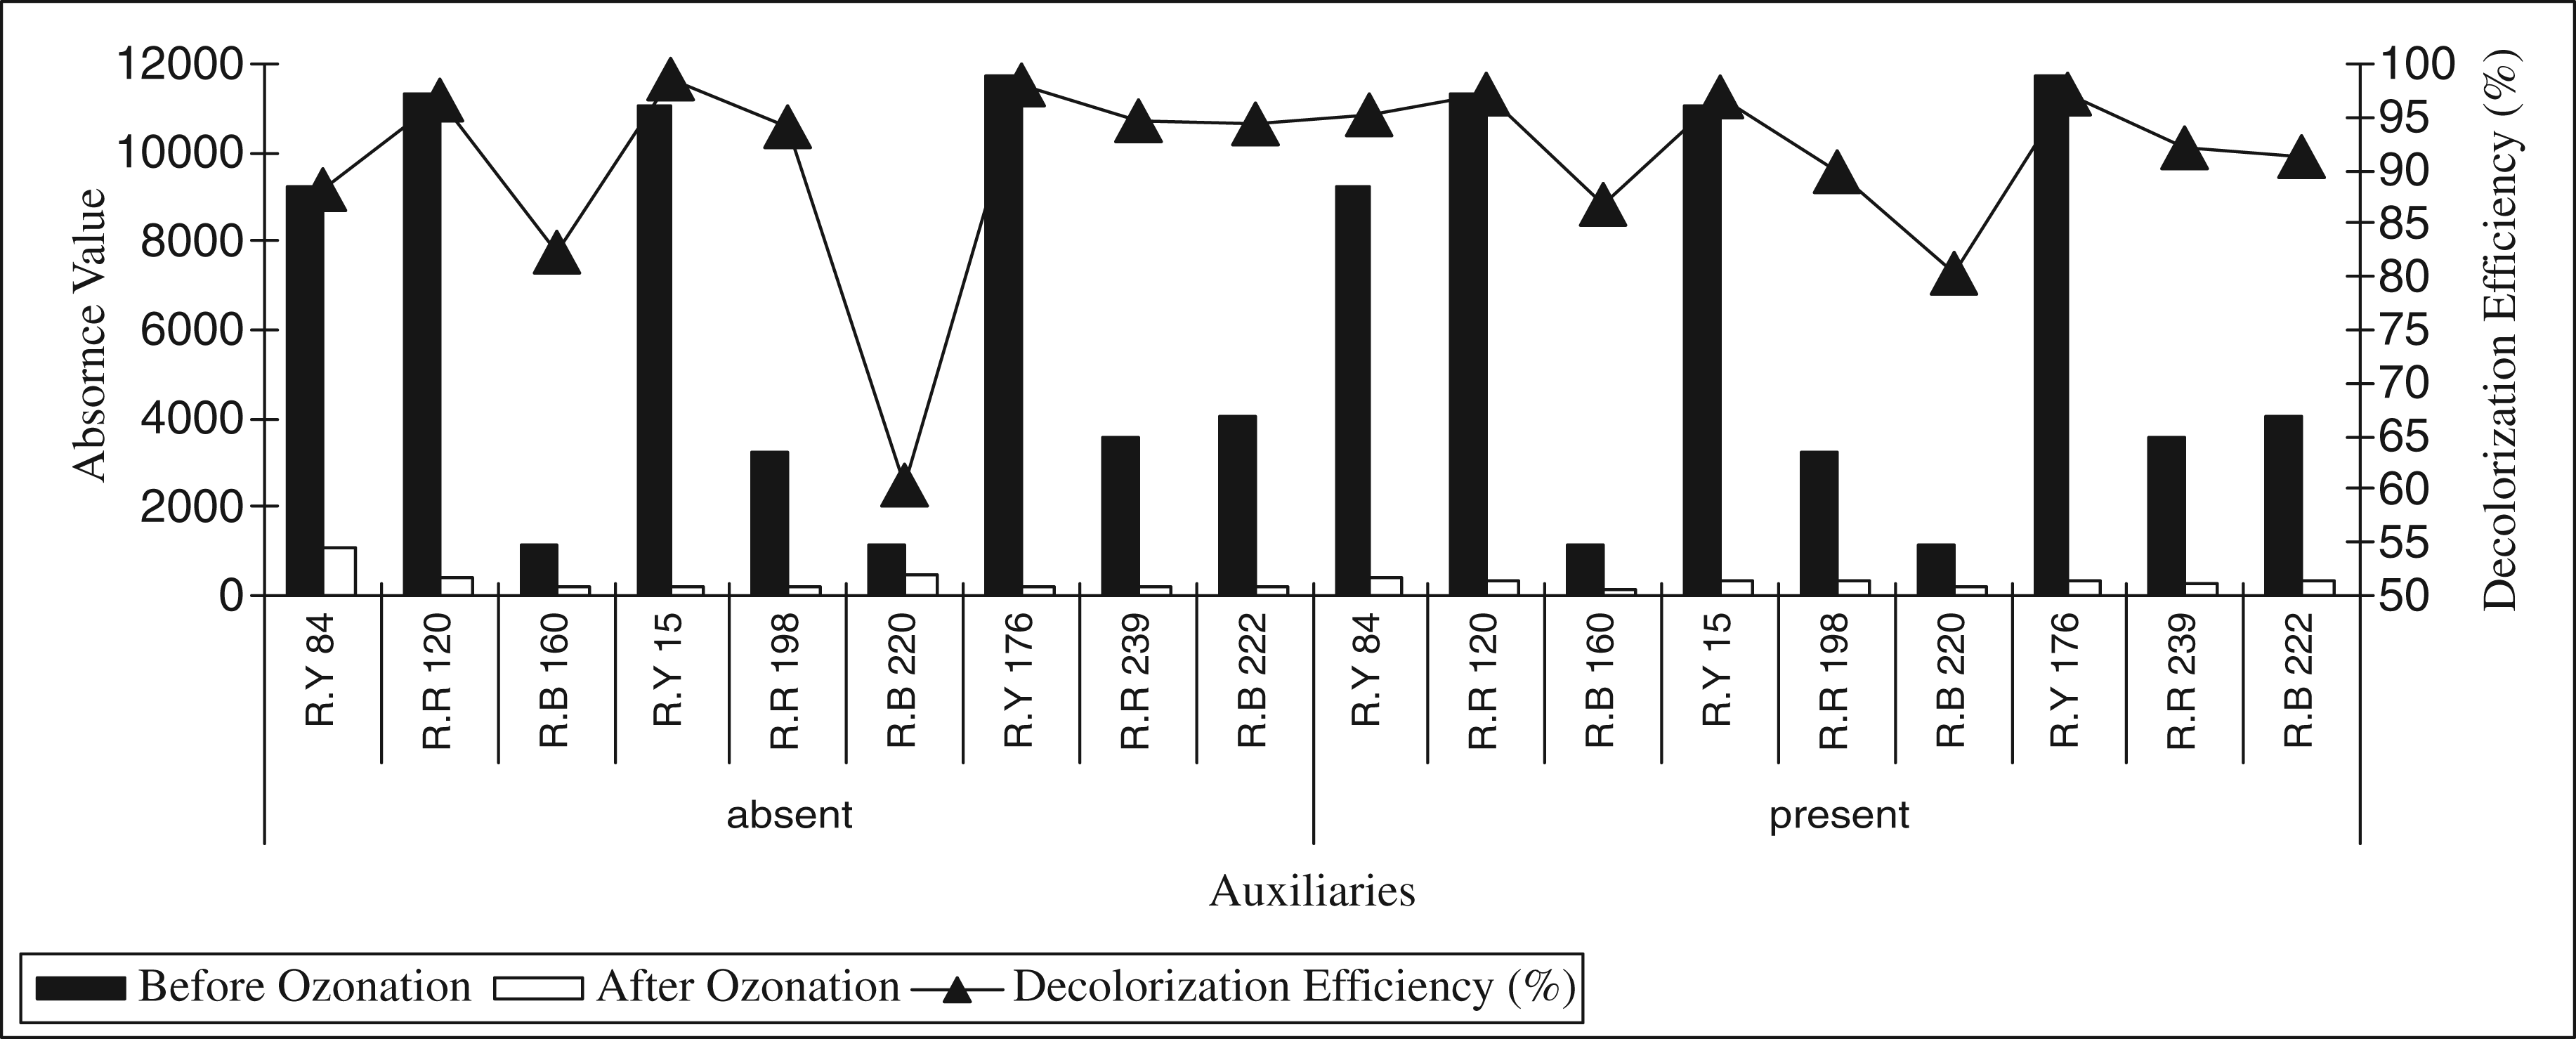
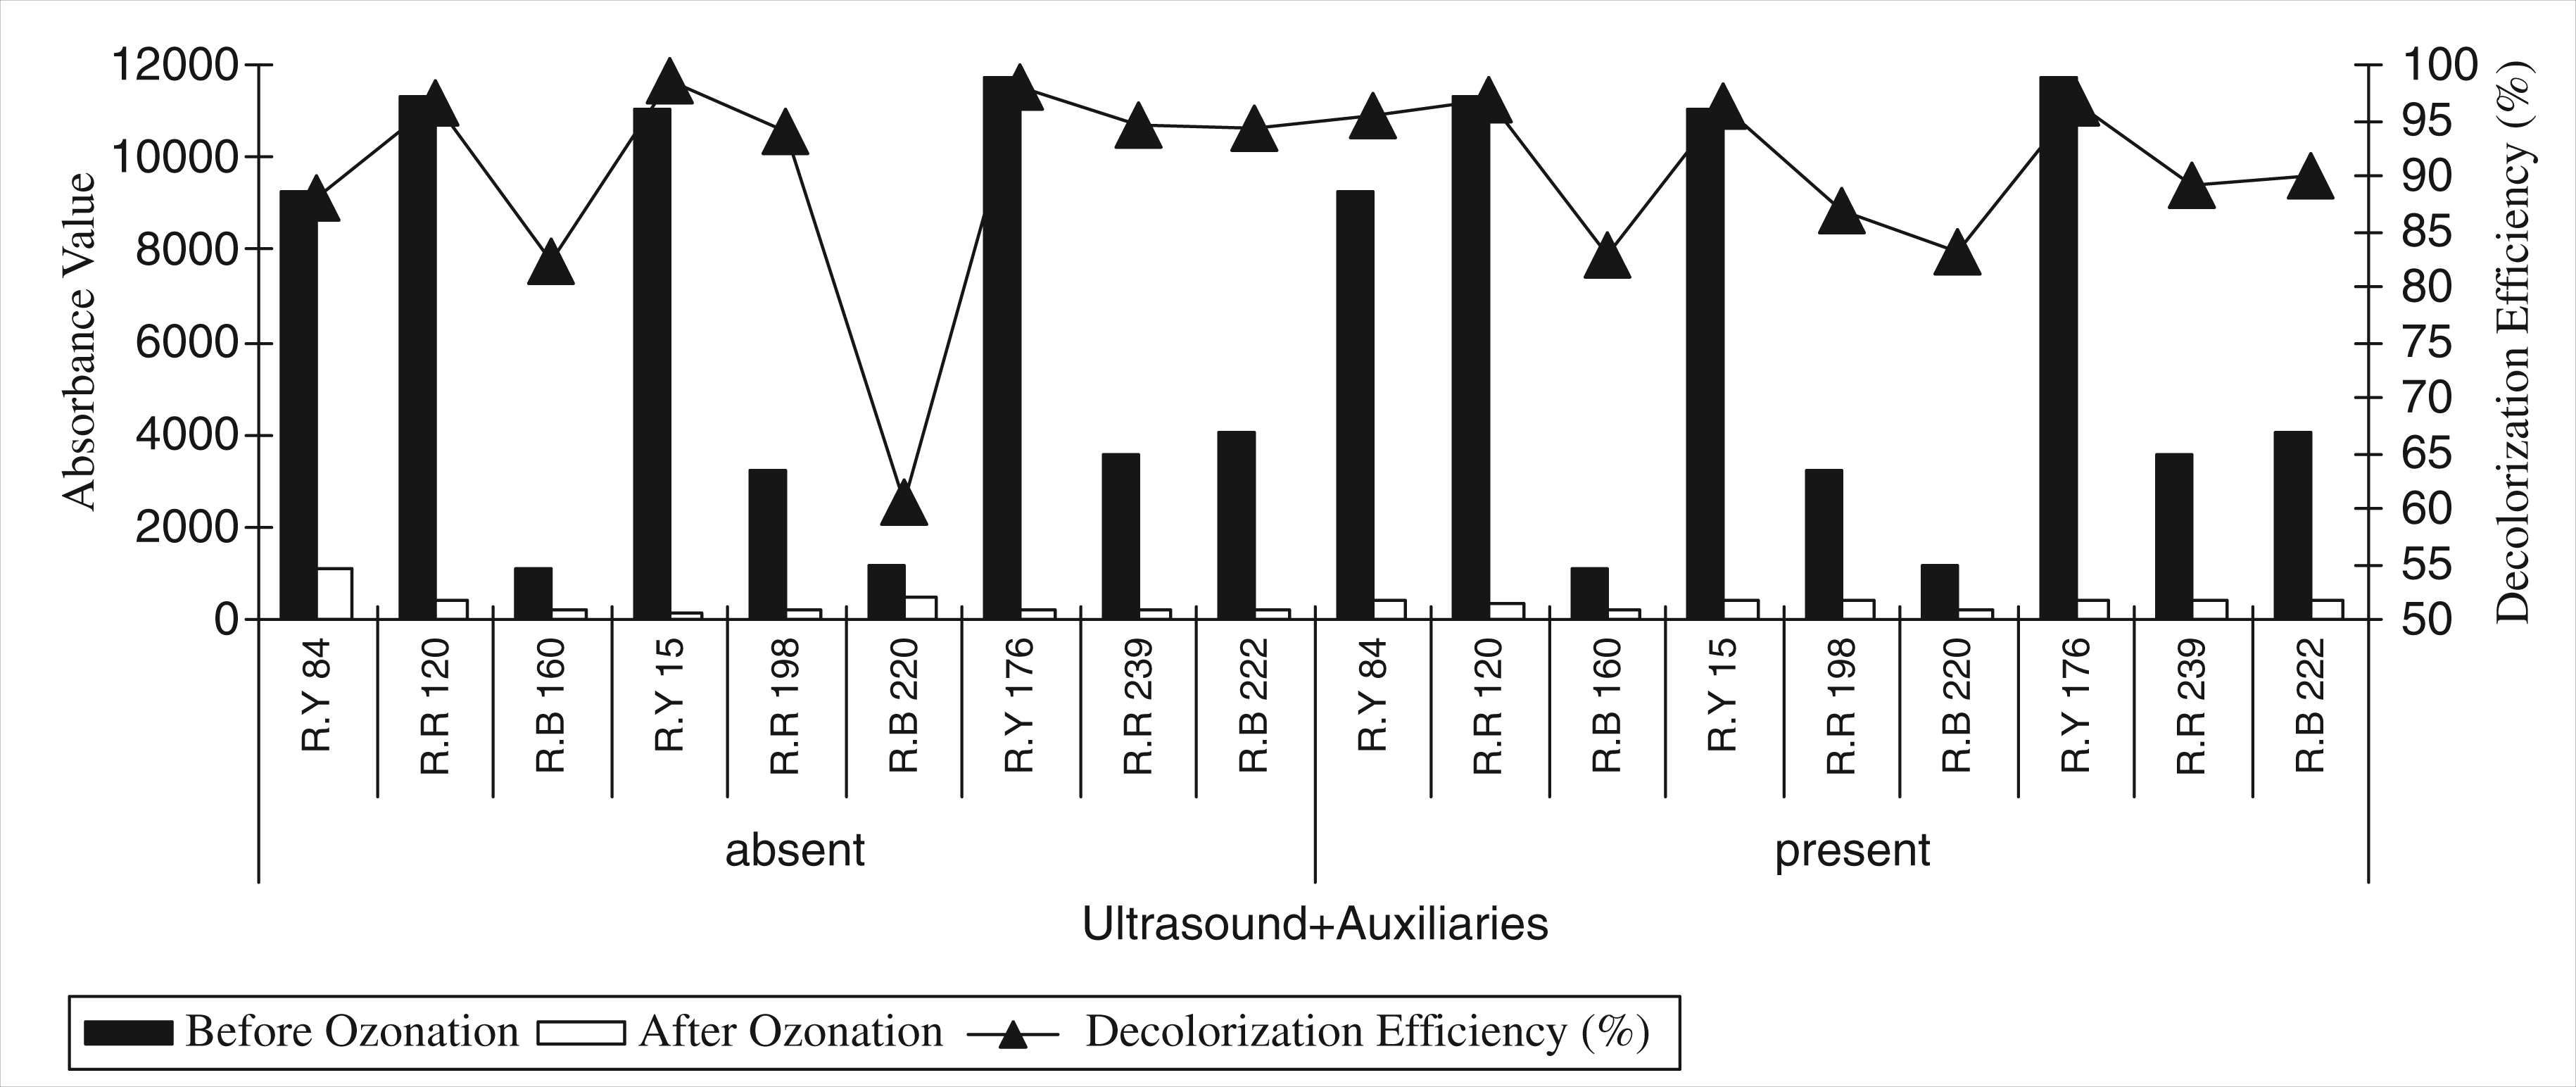
Figure 17 shows that the presence of ultrasound energy increased decolorization efficiency for all types of reactive dyes. The best effect of ultrasound on the decolorization efficiency was determined for RY 84 (from 88 to 98% – the degree of the change was about 11%). The crucial effect of ultrasound was determined for reactive dye that had MCT as the anchor group. In a combined O3/ultrasound system, when the ozone gas was injected into effluent simultaneously from a diffuser with an ultrasonic irradiation, an additional pathway of hydroxyl radical (OH•) generation arose upon the decomposition of ozone in the gaseous bubbles during implosive collapse, particularly at high pH values, such as 11.24,25 As is known, the working pH for this study is 10.5–11. In addition, ultrasonic radiation has been demonstrated to increase the mass transfer of ozone to solution by means of increasing the volumetric mass transfer coefficient, which is a critical factor in determining the overall efficiency of the process in the design of large-scale reactors for a coupled gas–liquid reaction, such as an ultrasound/O3 system. 25 Because of these two reasons, it was possible to determine the positive effect of ultrasound on the ozone efficiency in our study.
In Design II, we also tried to determine the effect of the some auxiliaries on the color removal efficiency. According to the Figure 18, we determined some decreases on the color removal efficiency after adding on the auxiliaries to the dyeing solutions, except RB 220, which had a different chromophor group (azo-cu) from the rest. There could be two reasons for this decrease. The slowing down of mass transfer in the effluents due to adding dyeing auxiliaries could be the first reason. This could cause decreases on the ozone efficiency and solubility in the wastewater. The second reason was a possible chemical reaction between auxiliaries and ozone gas, and solubility decreased due to this undesired chemical reactions.
After obtaining the results shown in Figure 18, the treatments that were established using auxiliaries were replicated with the presence of ultrasound in order to increase mass transfer and ozone solubility in the solutions. Figure 19 shows that the presence of both ultrasonic energy and dyeing auxiliaries in the dyeing effluents had a similar effect to that obtained by the individual ones shown in Figures 17 and 18.
The results of Design III
As is known, in general, reactive dyes are not used individually in the dyeing recipe. In order to obtain the desired color and shade, the colorist needs to combine suitable dyes. While preparing this combination, the first notable thing is the anchor group of the dye. Therefore, in the study, to both prepare a truthful recipe and investigate the effect of ozone on the decolorization efficiency of reactive dye combinations, the dyes with the same anchor groups were mixed in the same dyeing solution at the same owf % (0.33%). In Design III, the reactive dye concentration and ozonation time were chosen as 0.5% and 20 minutes, respectively. We also researched the effect of both ultrasonic energy and the presence of dyeing auxiliaries in the combined dyeing solutions on the color removal efficiency.
The measured absorbance values of these wastewaters and calculated decolorization efficiency values can be seen in Figure 20.
The effect of ozone on decolorization efficiency, depending on ultrasound, dyeing auxiliaries, ultrasound and dyeing auxiliaries of dye combinations.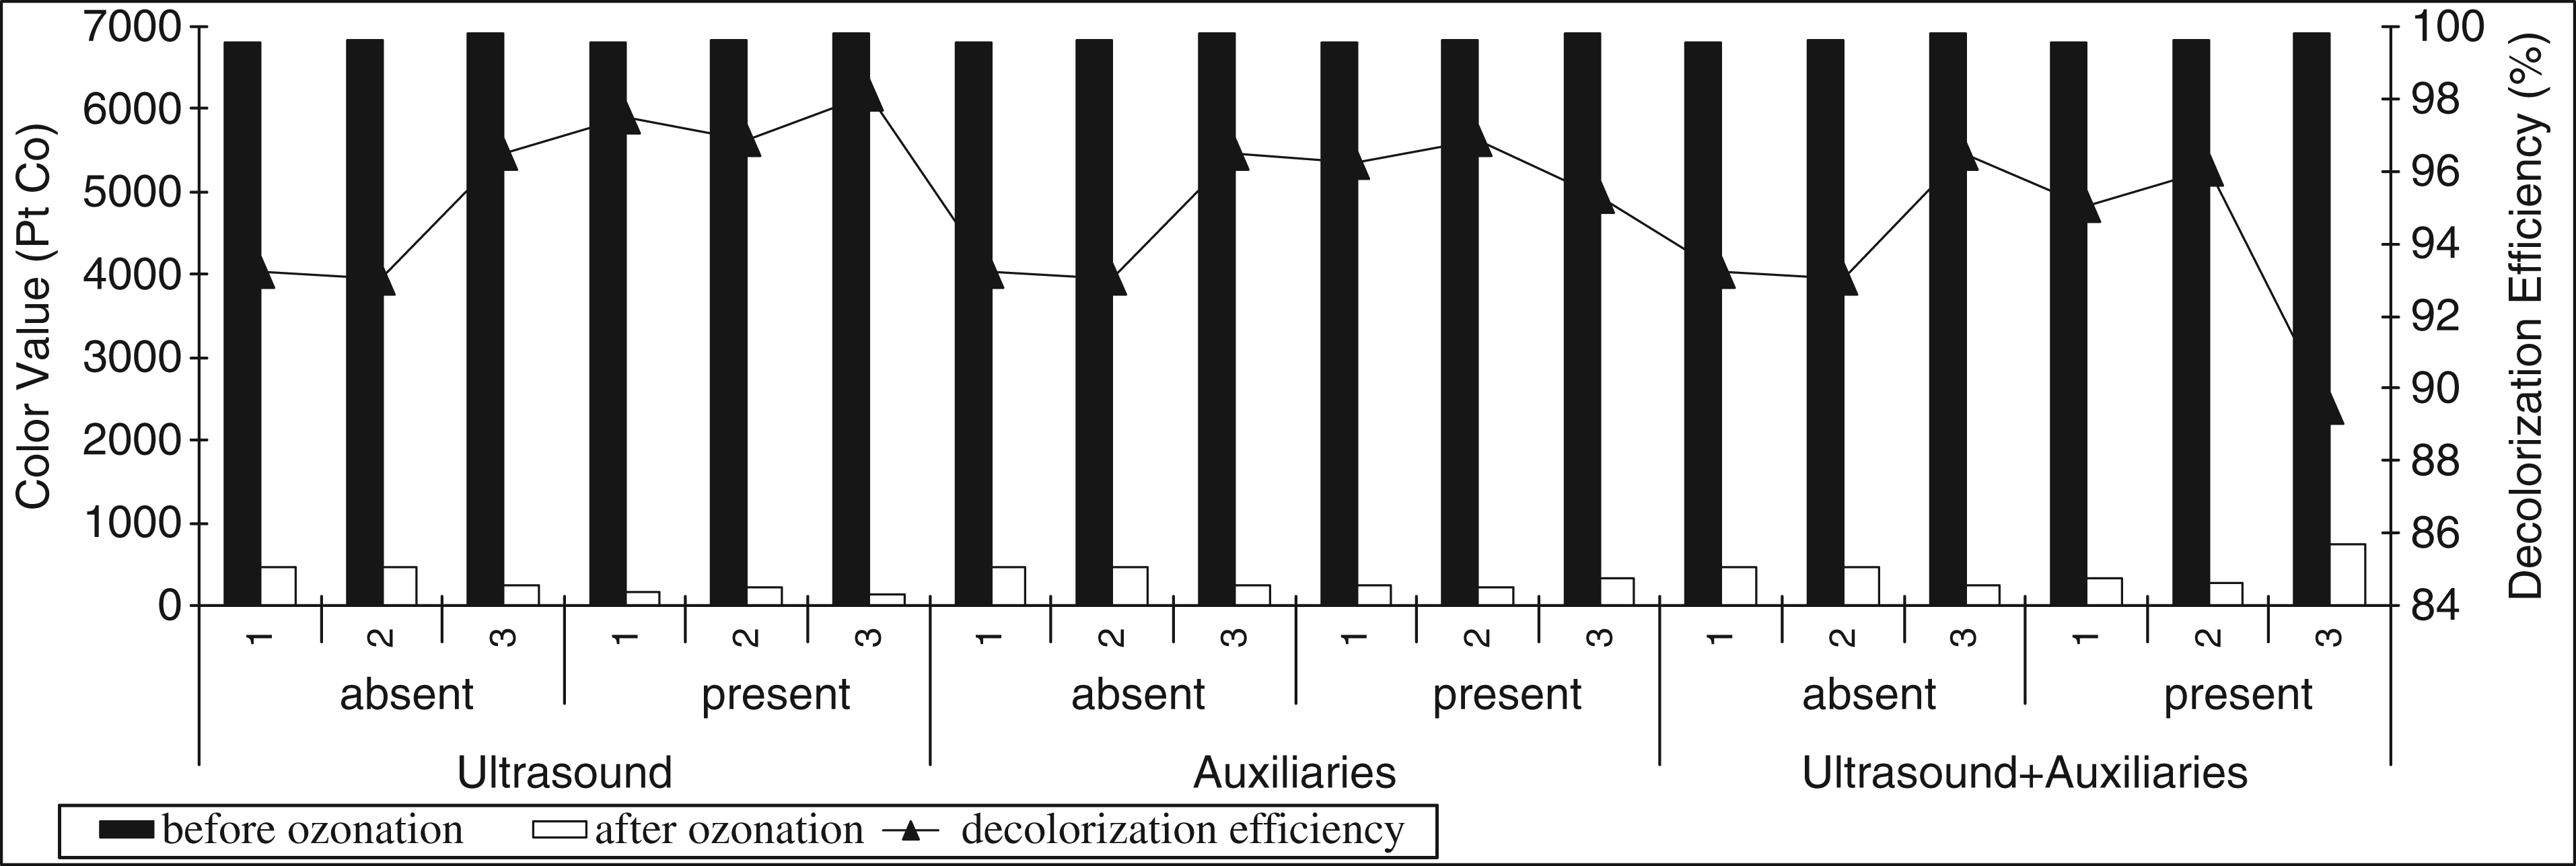
According to Figure 20, when the reactive dyes with the same anchor group were combined, the decolorization efficiencies were not affected negatively. As in Design II, the presence of ultrasonic energy in the experimental set increased the decolorization efficiency.
Statistical analysis
Besides the experimental study and the results, experimental design, methods and the statistical contribution of each factor to these investigated parameters were researched using the ANOVA. The results were evaluated at 5% significance level by the Design-Expert Trial version. 33
While the ANOVA results were being made, we focused on F and p values. F and p values increase and decrease, respectively, while the significance contribution of the investigated factors on the variance increases. In particular, the p values must be less than 0.05 in order to define the factor as statistically significant.
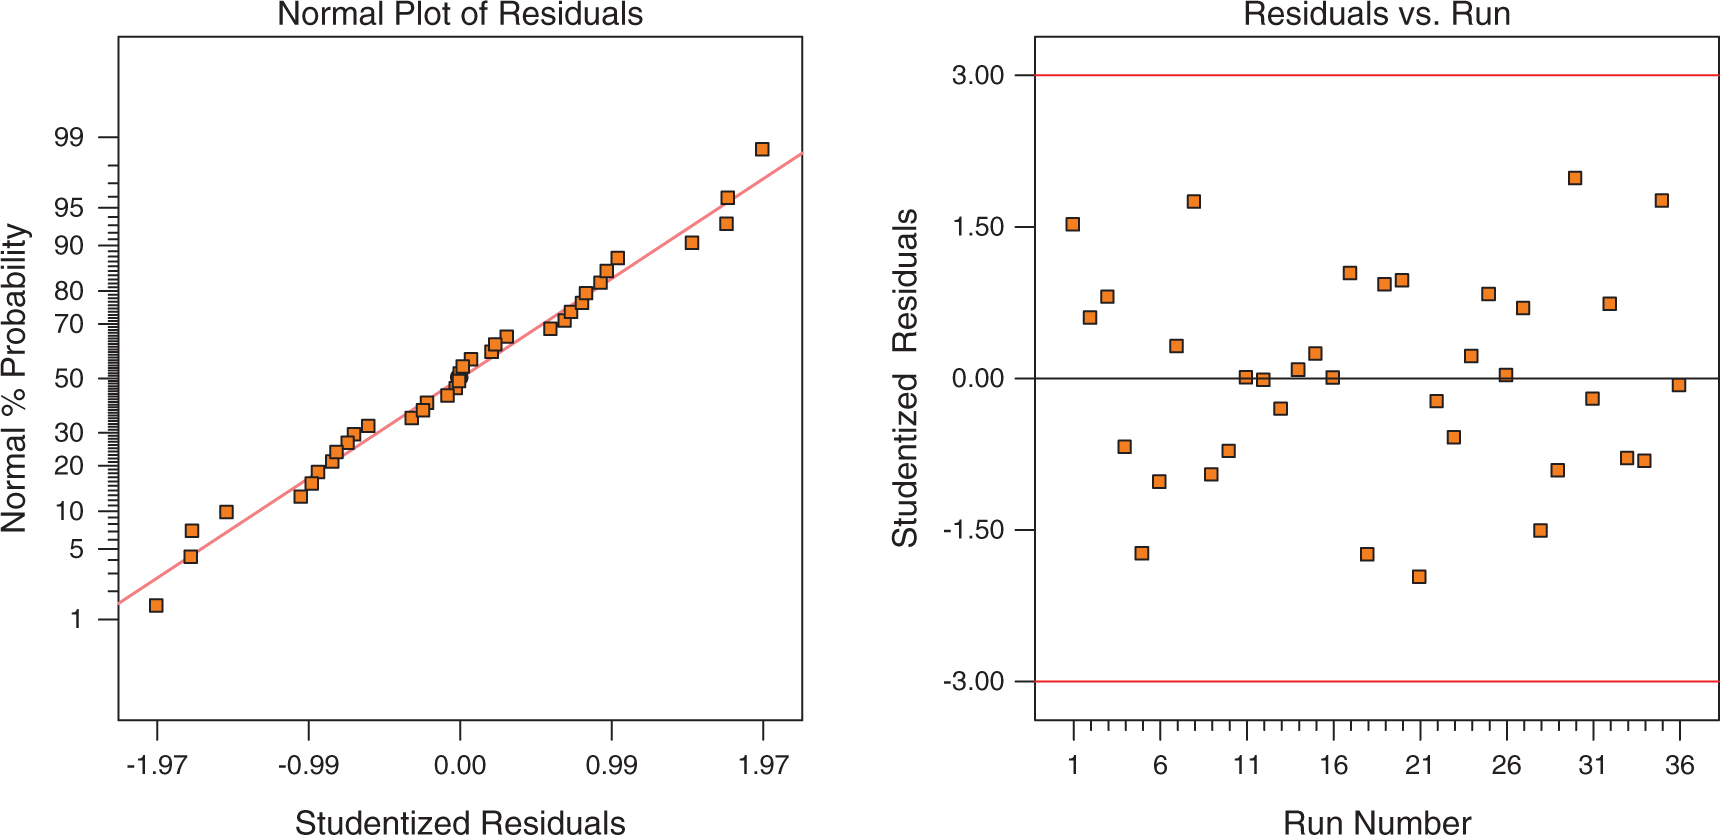
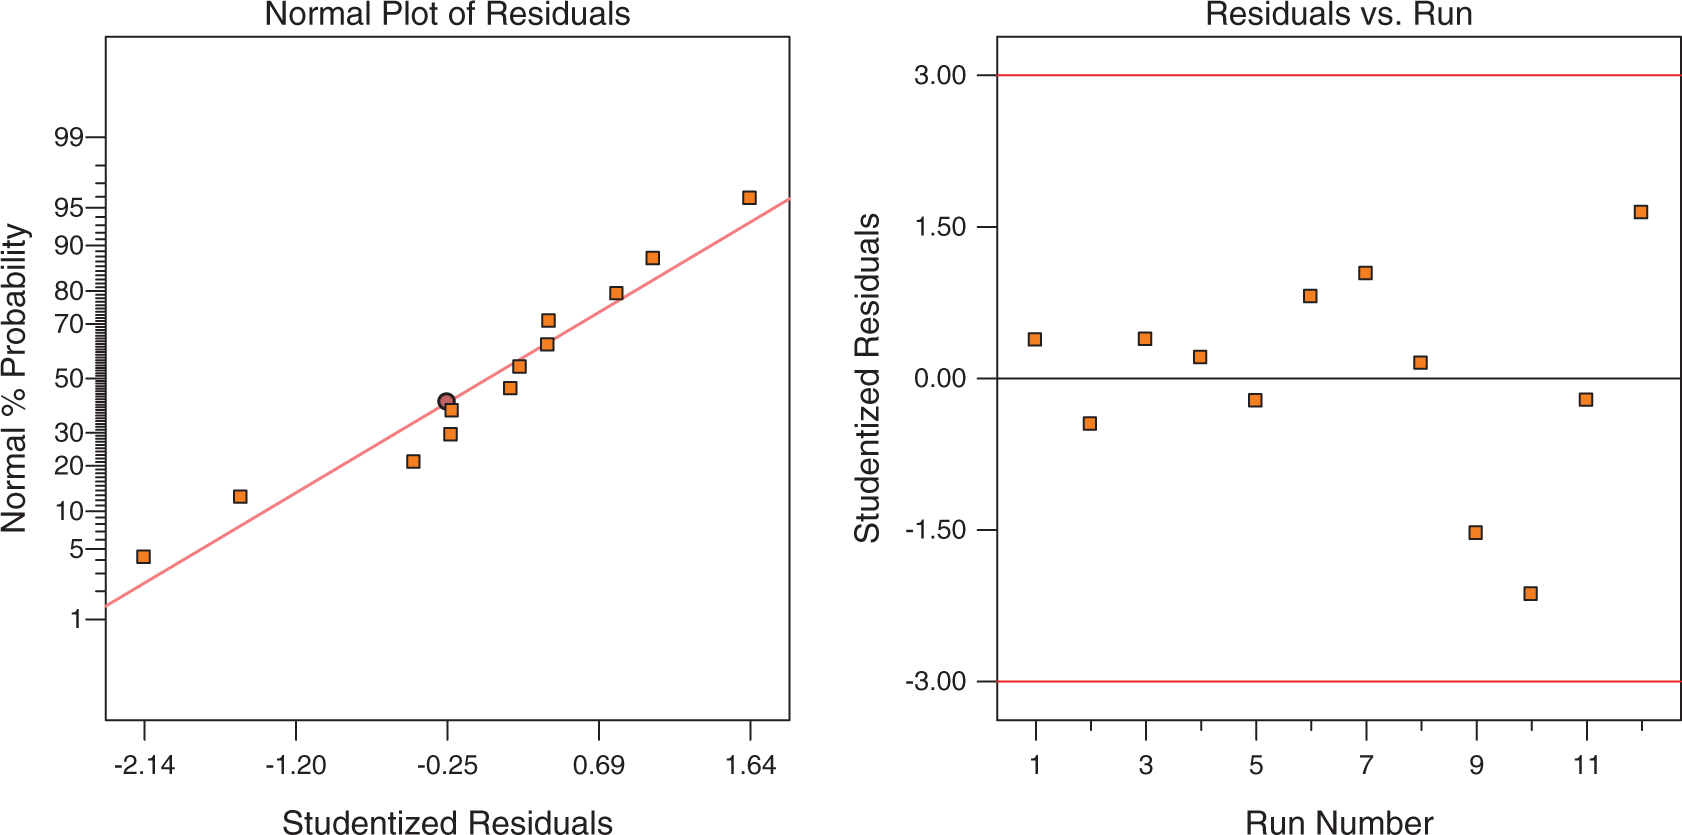
After the ANOVA results, the reliability of the established models were discussed. The percentage normal probability versus residuals and residuals versus run number diagrams, which are used in order to check the reliability and accuracy of the ANOVA results, can be seen in Figures 21–23 for Designs I–III, respectively.
Normal percentage probability plot and control plots of the model for Design I. Normal percentage probability plot and control plots of the model for Design II. Normal percentage probability plot and control plots of the model for Design III.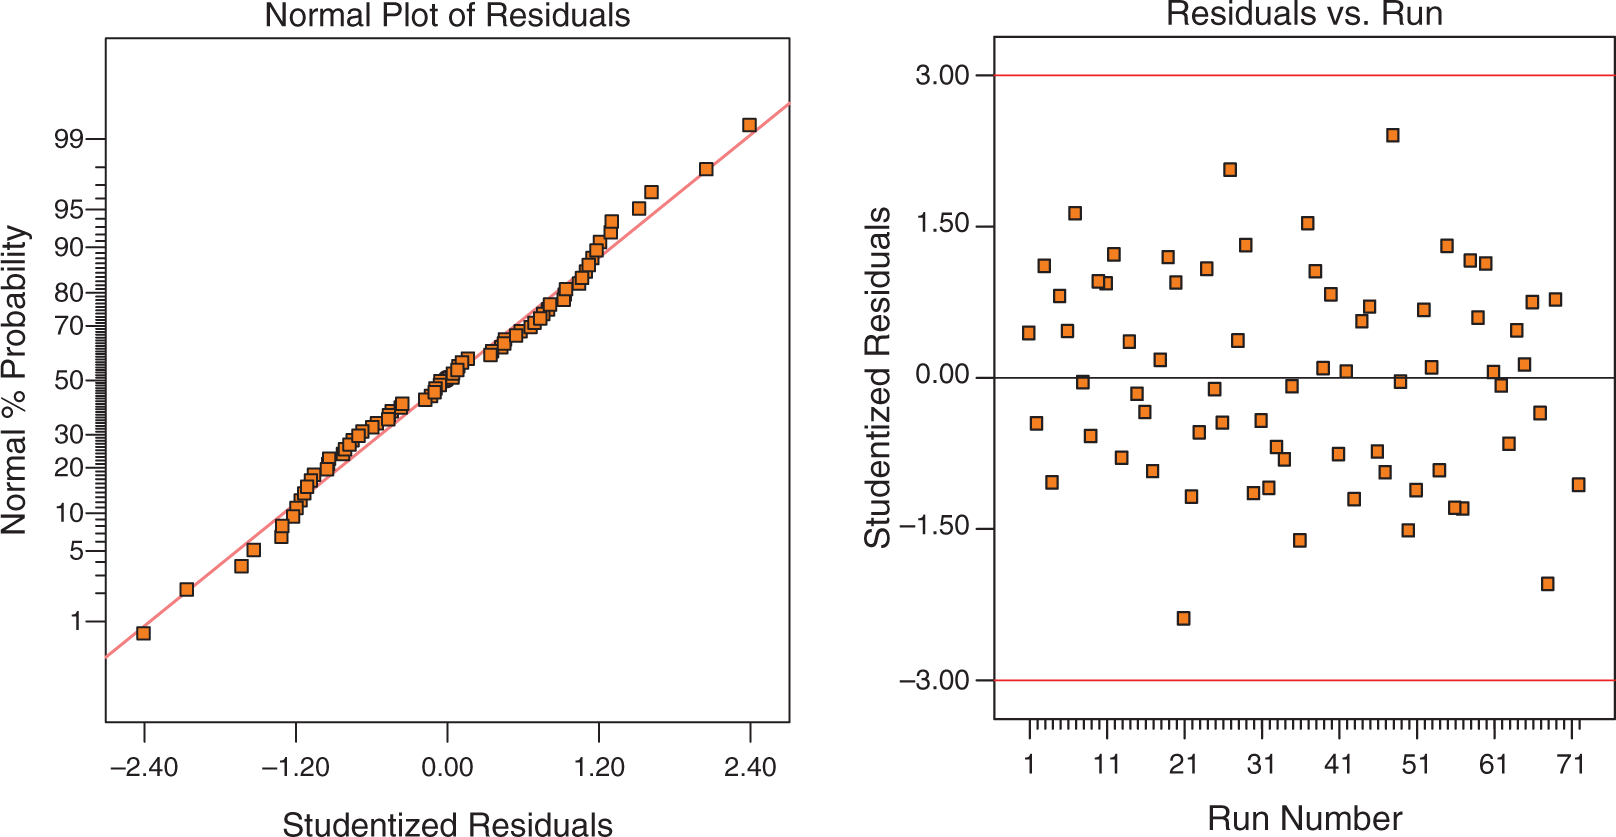
The analysis of variance results of Design I
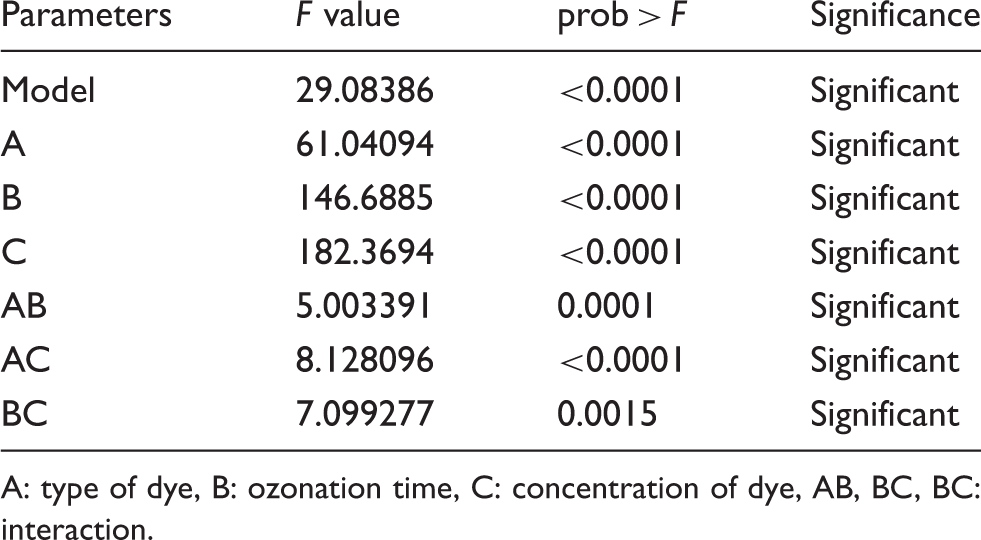
A: type of dye, B: ozonation time, C: concentration of dye, AB, BC, BC: interaction.
According to Table 6, the established model was significant, and the R2 value of the established model was 98.31%. All investigated main factors had a statistically significant effect on the decolorization efficiency; therefore, while the decolorization processes were optimizing for reactive dye effluents, these factors should be realized carefully. The most effective factor was the concentration of reactive dye (Factor C) in the solutions. In addition, the ozonation time (Factor B) changed the color removal efficiency. The other important results obtained from this analysis, double interactions between the main factor, are significant. This means that while the ozonation time was preferred, the type of reactive dye, type of chromophor and anchor group or dye concentration (%) in the effluent should be considered.
The analysis of variance results of Design II
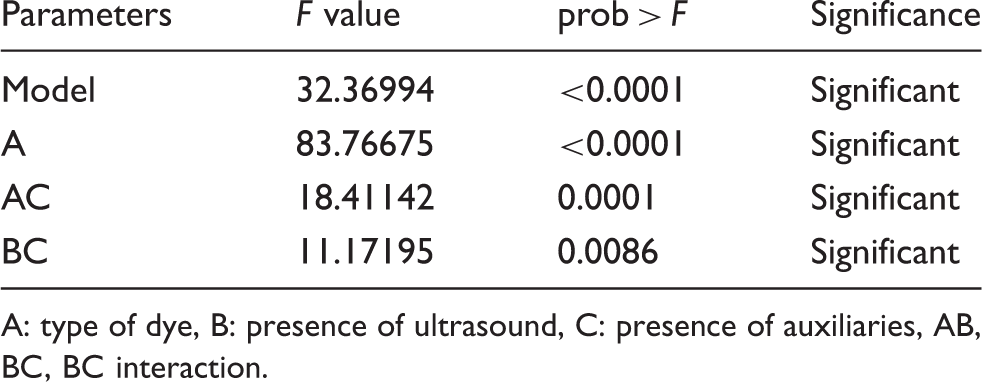
A: type of dye, B: presence of ultrasound, C: presence of auxiliaries, AB, BC, BC interaction.
According to Table 7, the established model for Design II was significant, and the R2 value of the established model was 98.31%. Between the main factors, only A (the type of the reactive dye) was the significant on the decolorization effect. Interaction between C and AB factors was determined. The ultrasonic application and the type of the reactive dye were effective on the decolorization efficiency, depending on the presence of auxiliaries in the dyeing solutions (AC and BC interactions).
The analysis of variance results of Design III
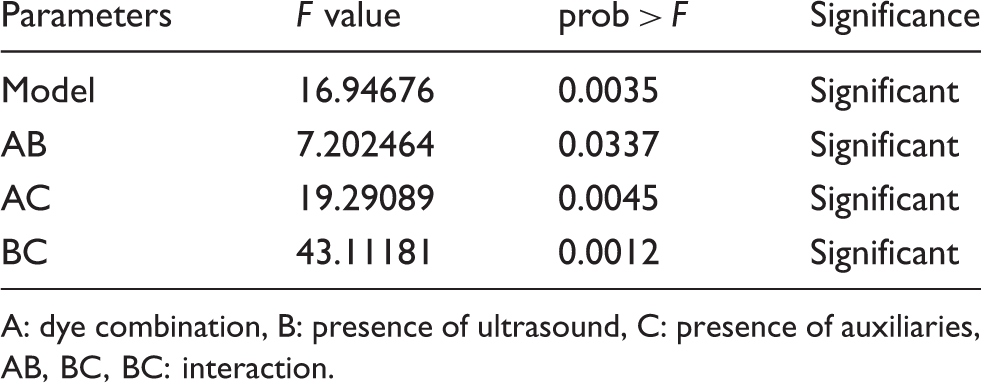
A: dye combination, B: presence of ultrasound, C: presence of auxiliaries, AB, BC, BC: interaction.
According to Table 8, the established model for Design III was significant, and the R2 value of the established model was 95.31%. There was no significant main factor: only double interactions were statistically effective on the color removal efficiency from effluent. The BC interaction was the most important one for decolorization efficiency. According to the analysis results, it could be easily said that presence of ultrasound was a very important factor, depending on the tricromy and added auxiliaries. The increase in the color removal effect could be determined with the presence of ultrasound via model graphics of the established model.
The crucial data is the diagnostics for checking the accuracy of the statistical analysis. The normal probability indicates whether the residuals follow a normal distribution, in which the points will follow a straight line. This plot consists of the number of standard deviations of the actual values from their respective predicted values. Ideally, it should be straight line, indicating no abnormalities. Therefore, when the results from Figures 21–23 are analyzed, it can be seen that there are no problems on any plots, which are formed for each output. 33
The diagnostics shown in Figures 21–23 are plots of the residuals versus the experimental run order. The diagnostics check for lurking variables that may have influenced the response during the experiment. The plot shows a random scatter. The size of the residual should be independent of its run number. In other words, the spread of the residuals should be approximately the same across all levels of the run numbers. In this case, the plots do not have any problem, because the distribution of the residuals is random. According to the diagnostics, there is no problem with the model that it is established for outputs. 33
Conclusions
This research was intended to be carried out with effluent character as close to real as possible. In order to simulate the closest effluent character, the artificial dyeing solution was prepared using salt, Na2CO3 and some auxiliaries. According to the results obtained from the experimental study, it could be easily said that ozonation was a very suitable way to decolorize the reactive dyeing effluent. When the working parameters were investigated, ozonation time was one of the most effective factors investigated in the study. The color removal efficiencies and rates could be ordered as 20 minutes >15 minutes >10 minutes >5 minutes in terms of ozonation time. However, in general, 10 minutes was sufficient for the decolorization process, depending on type of the dye and owf % of the dye. The crucial point was that the color removal efficiency showed differences according to the chromophore and anchor group of the reactive dye and dye amount (%) in the effluent. As is well known, the reaction between ozone and reactive dye occurred on the chromophore group of the dye. This case made the color of dye and content of the effluent in terms of reactive dye more important. With increasing dye amount in the effluent, the removal of color became harder. In addition, some supporter apparatus, such as the ultrasonic homogenizer, made the decolorization easier when it was combined with ozone gas, because the ultrasonic homogenizer supported the mass transfer in the effluent and solubility of the gas in the liquor. From the statistical analysis results, it could be said that, for all designs, double interactions were significant. Therefore, while the decolorization conditions were decided, some working parameters, such as type of dye, ozonation time or presence of ultrasound, should be considered together, not individually. In addition, it could be thought that the ultrasound could be a supporter for the breakage of the chromophore group from the main structure of the reactive dye.
As a conclusion, using the ozone was a very effective way to prevent pollution from color effluents that were discharged from textile mills, particularly dyeing ones. However, the other possible toxic effluents that could occur after the ozonation process, because of deconstruction of the dye chromophore, must be considered.
Footnotes
Funding
This work was supported by the University of Kahramanmaraş Sütçü İmam Scientific Research Project Department (KSÜ-BAP) (project number: 2009/4-14 M). The authors would like to thank the University for its financial support.