
Abstract
This paper focused on the effect of some constructional parameters of woven fabrics on surface roughness and on fabric-to-fabric friction coefficients. Fabrics under test differed from each other in their weft yarn counts, weft yarn properties and weft yarn density. Seven surface roughness parameters and static and kinetic coefficients of friction were assessed according to the changes in fabric constructional properties. The results showed that roughness parameters of amplitude, spacing and hybridity changed in different manners in the measurement directions of warp, weft and diagonal. Static and kinetic coefficients of friction changed with surface roughness values in opposite ways in warp and weft directions. Experimental results were also assessed with fabric thickness and fabric balance values. The anisotropic structure of textile surfaces was discussed by the changes in roughness parameters and friction coefficients. Skewness and kurtosis, being roughness parameters, were found to be important in the discussion of the relation between surface roughness and friction coefficients.
The texture of fabric surfaces is an important property because fabric performance characteristics considerably change according to the surface properties. Roughness measurements are performed on fabric surfaces to characterize their usage in some specific areas of application or to understand if they are suitable for the specified end product use (consumer goods, home textiles, technical textiles, etc.). Surfaces have the two surface texture properties of roughness and waviness. The smoothness of surfaces can be tested by considering these two texture properties.
Roughness is a measure of the texture of a surface. A surface can never be perfectly smooth and will always have two components of surface texture; namely, roughness and waviness. They may vary from fine to coarse according to the production process used. Roughness is quantified by the vertical deviations of a real surface from its ideal form. If these deviations are large, the surface is rough; if they are small the surface is smooth. Roughness is typically considered to be the high-frequency, short-wavelength component of a measured surface. Roughness plays an important role in determining how a real object will interact with its environment. Rough surfaces usually wear more quickly and have higher friction coefficients than smooth surfaces.1,2 Fabrics that yield more peaks and lower amplitude pulses are judged to be smoother than those with fewer peaks and higher amplitudes. 3
Factors that are important in the configuration of surface characteristics of fabrics are associated with the constructional parameters. Physical properties of yarns (yarn count, yarn diameter, fiber fineness and composition, yarn twist), together with their alignment and positioning in fabric structure (yarn density, yarn crimp, weave pattern, fabric balance and fabric thickness), are important in the measurement of surface roughness properties. Surface irregularities, that is, peaks and valleys, are measured in roughness measurement and the whole constructional properties affect formation and alignment of irregularities. Physical changes that have the result of increasing or decreasing gaps between fibers in yarn structure and between yarns in fabric structure determine the roughness characteristics of woven fabric surfaces. Depending on the properties of fiber, yarn and fabric production, woven fabrics have an anisotropic structure in warp, weft and diagonal directions. To make a compromise in these directions and in order to understand the properties of woven structures, surface roughness measurement could be used.
Although the most commonly used surface roughness parameter is the arithmetic average of surface irregularities (peaks and valleys) (Ra), it does not always provide enough information about the distribution of the surface characteristics. Additional surface roughness parameters of amplitude, spacing and hybrid could be used. 1
Textile fabrics are rarely balanced in terms of appearance of warp and weft yarns on their surface. For this reason, the surface of textile fabrics is not absolutely flat and smooth. Very often, even in the case of plain weave fabrics, there is a domination of one group of threads. They appear more intense on the surface, resulting in hiding the other group of threads. This introduces a certain difficulty in obtaining structural information from surface roughness data. 4
Surface irregularities and their distribution characteristics could be considered by Gaussian distribution. If a woven fabric surface has a Gaussian distribution, this means that the surface has almost equal number of peaks and valleys distributed regularly on surface. However, as already mentioned above, woven surfaces are anisotropic because of their constructional characteristics. For this reason, distribution of peaks and valleys could not be the same and regular in each direction of warp, weft and diagonal. Variation of surface characteristics from Gaussian distribution means that the surface has an asymmetric profile distribution about the mean line of roughness, which is a result of constructional characteristics.5,6
Roughness is associated with friction characteristics of surface for the determination of wear characteristics. Although there is a general consideration which expresses that rough surfaces usually wear more quickly and have higher friction coefficients, this generalization has to be tested for fabrics because of their anisotropic structure.
Studies related with surface roughness properties of polyester, cotton and wool woven fabrics revealed that fabric constructional parameters, such as yarn filament fineness, yarn properties (i.e. type, count, twist level, ply number, unevenness and crimp), yarn density, type of weave pattern and fabric constructional properties (i.e. cover, porosity, thickness and balance of fabric), affect the fabric surface texture and also surface roughness of fabrics.7–12
In tribology, the dimensionless ratio of the friction force (F) between two bodies to the normal force (N) pressing the bodies together is μ = F/N. 13 Fabric friction, which is defined as the resistance to motion, can be detected when a fabric is rubbed mechanically against itself or tactually between the finger and thumb. Friction is considered to be one property of cloth that has considerable importance in the fields of both technological and subjective assessment. Friction of a fabric on itself or on another fabric has a significant effect on fabric performance features, such as abrasion, wear and shrinkage, as well as on the user’s tactile comfort. 14 Papers were published on the relation among static and kinetic coefficients and fabric constructional properties. Also, surface characteristics were correlated and discussed with friction properties.15–25
The question about surface roughness and friction characteristics of woven fabrics is the formation occurrence and distribution of peaks and valleys upon the change of constructional properties and their relation with fabric-to-fabric friction.
This paper focused on assessing the effect of weft yarn density, yarn properties and weft yarn count on surface roughness and on fabric-to-fabric friction properties of woven fabrics. Selected amplitude (Ra, Rpm, Rvm, Rsk and Rku), spacing (Rsm) and hybrid (RΔq) surface roughness parameters were assessed depending on the changes of some constructional parameters of woven fabrics, together with the static and kinetic coefficients of friction. Amplitude, spacing and hybrid parameters were selected in order to assess the surface properties from all possible aspects. The results showed that peak and valley distribution of surfaces generally exhibited a Gaussian distribution, depending on the changes of different constructional characteristics. Roughness results and friction coefficients changed in different manners in the measurement directions. Changes in the constructional parameters affected the symmetry of the surfaces in different ways in different measurement directions. Roughness properties that reflect the distribution characteristics of woven fabric surfaces were discussed according to some constructional parameters.
Experimental details
Constructional parameters of fabric samples
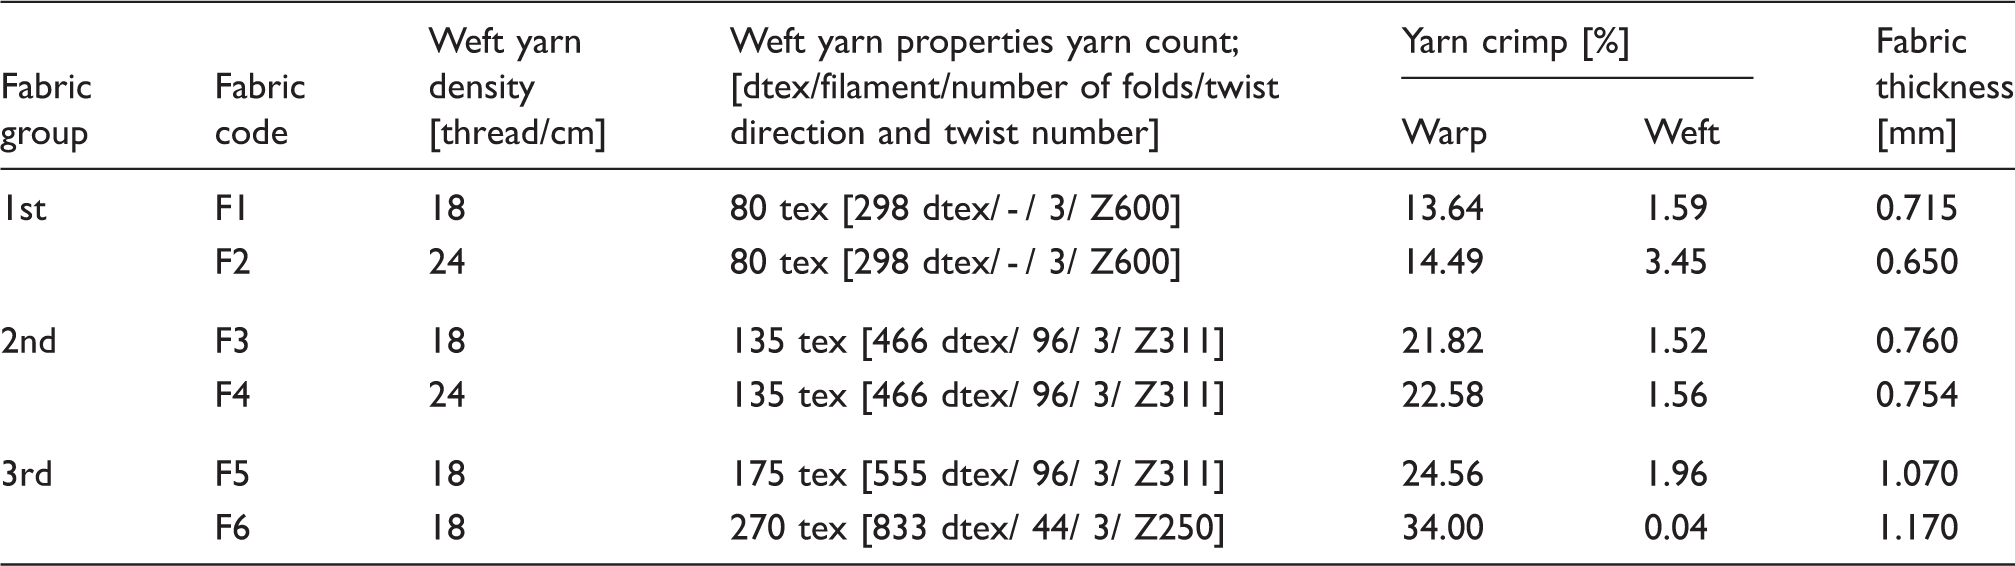
Surface roughness of samples was measured by a roughness tester (Accretech Surfcom 130A) and surface roughness values were recorded according to ISO 4287-1997. 26 Static and kinetic coefficients of the friction of fabric samples were measured by a coefficient of friction tester (Labthink Param MXD-02) and coefficients were recorded according to ASTM D 1894. 27
Surface roughness measurements were conducted on ready-to-use fabric samples at a single fabric fold. The fabric sample was cut in the dimensions of 20 cm × 20 cm and later it was mounted on a square glass sheet of 15 cm × 15 cm (surface roughness value of the glass sheet; Ra: 0.023 at 50 mm evaluation length and at 1.5 mm/s measurement speed; 1 cm thickness of glass). The sample was fastened from all sides by mounting a square metal hoop (16 cm × 16 cm; 1 cm thickness) around the glass sheet holding the fabric sample over the glass. The measurement was performed in the steady state without causing any further tension on the sample. Ten roughness measurements were made in each direction (warp, weft and diagonal (45o to the crossing axis of warp and weft)) with the selected measurement parameters of 50 mm evaluation length (0.8 mm cut-off value) and 1.5 mm/s measurement speed.
For the characterization of fabric surface roughness, amplitude (Ra, Rpm, Rvm, Rsk and Rku), spacing (RSM) and hybrid (RΔq) parameters were selected. 6
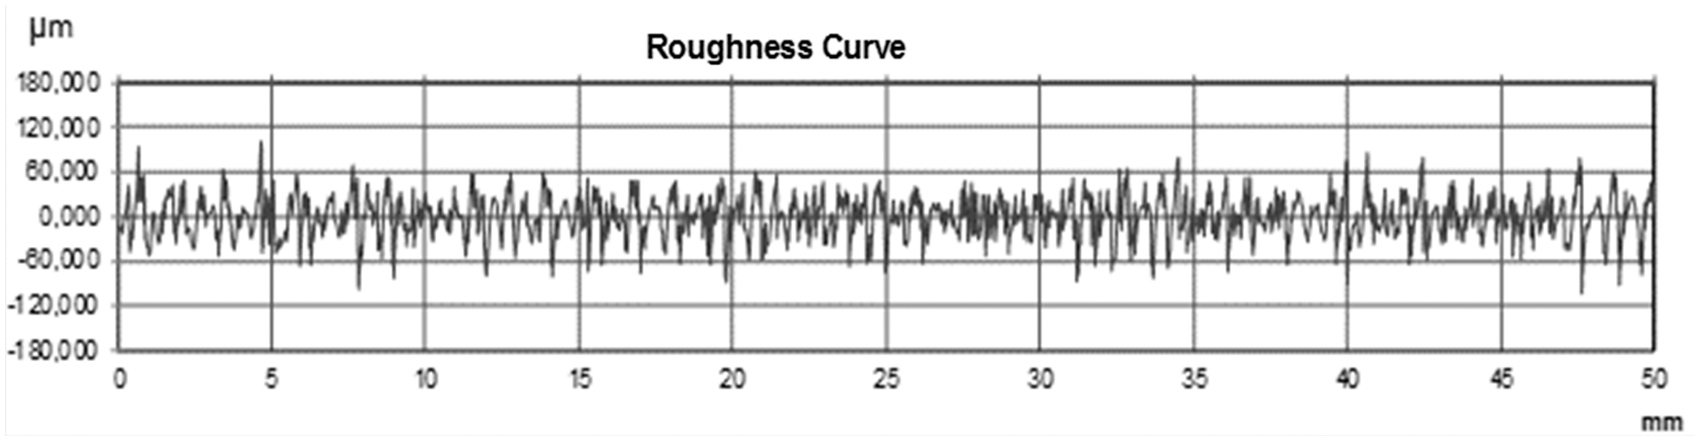
Ra is the arithmetical average of absolute values of the profile variations (peaks and valleys) from the mean line in the evaluation length (Figure 1). Although Ra is the most useful, well known and common parameter for analyzing surface structure, it does not distinguish between profiles of different shapes. Ra has the dimension of microns (µm):
6
Example of roughness profile.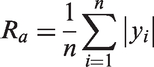
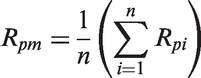
Rpm is defined as the mean of the maximum height of peaks obtained for each sampling length of the evaluation length:
6
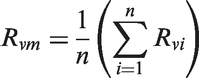
Rvm is defined as the mean of the maximum depth of valleys obtained for each sampling length of the evaluation length:
6
RΔq is a hybrid parameter and it is the root mean square of the mean slope of profile. The mean slope is calculated from local slopes and is given by the parameter Δ
a
, which is expressed as the absolute profile slope over evaluation length. Δ
a
is determined by calculating all the slopes between each two successive points of profile and then calculating the average of these slopes. Δ
a
and Δ
q
are useful in tribological applications. Many mechanical properties, such as friction, elastic contact and reflectance, are associated with these parameters. The lower the slope, the smaller the friction and wear.
6
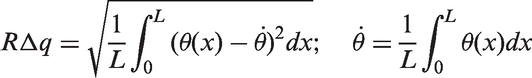
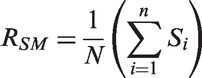
RSM is a spacing parameter and it is defined as the mean spacing between profile peaks at the mean line where the profile peak is the highest point of the profile between upwards and downwards crossing of the mean line:
6
The skewness (Rsk) parameter of a profile is the third central moment of the profile amplitude probability density function that is measured over the evaluation length. Skewness is a useful parameter in defining variables with an asymmetric spread, it represents the degree of symmetry of the distribution function and it is used to measure the symmetry of profile about the mean line. Skewness is sensitive to occasional deep valleys or high peaks. A symmetrical height distribution, that is, with as many peaks as valleys with a Gaussian distribution, has zero skewness. A surface with a high negative skewness has a larger number of local maxima (peaks) above the mean line as compared to a Gaussian distribution. Profiles with peaks removed or deep scratches have negative skewness. A surface with a high positive skewness has a smaller number of local maxima above the mean line as compared to Gaussian distribution. The value of skewness depends on whether the bulk of the material of the sample is above (negative skewness) or below (positive skewness) the mean line (Figure 2):5,6
Gaussian distribution, skewness and kurtosis.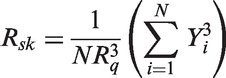
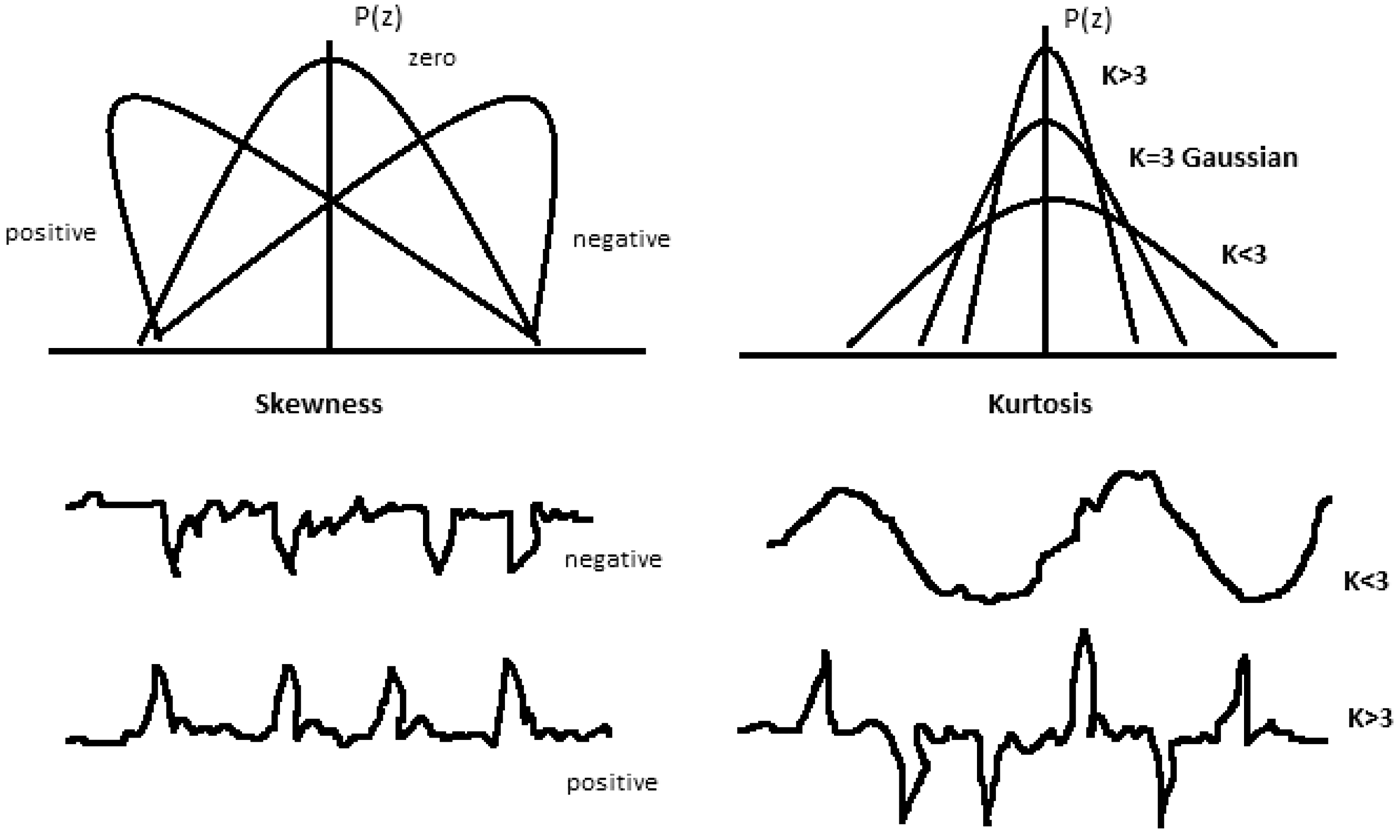
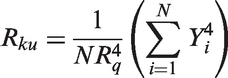
The kurtosis (Rku) parameter is the fourth central moment of the profile amplitude probability density function, which is measured over the evaluation length. It represents the sharpness of the probability density of the profile or the peakedness of the distribution and it is a measure of the degree of pointedness or bluntness of a distribution function. Symmetric Gaussian distribution has a kurtosis of 3. Distributions with Rku > 3 are called leptokurtic and the distribution curve has relatively high peaks and low valleys. Distributions with Rku < 3 are called platykurtic and the distribution curve has relatively few high peaks and low valleys. In other words, a surface with a low kurtosis has a larger number of local maxima above the mean line as compared to that of Gaussian distribution. A surface with a high kurtosis has a smaller number of local maxima above the mean line as compared to that of Gaussian distribution (Figure 2):5,6
Gaussian surfaces (symmetric surfaces) might be considered as comprising a certain number of peaks (maxima) and an equal number of valleys (minima). As a result, Gaussian distribution with zero skewness and a kurtosis value of 3 has an equal number of local peaks (maxima) and valleys (minima) at a certain height above and below the mean line (Figure 2).5,6
Static friction is the one between two or more solid objects that are not moving relative to each other. The coefficient of static friction, typically denoted as μs, is usually higher than the coefficient of kinetic friction. The static friction force must be overcome by an applied force before an object can move. Kinetic (or dynamic) friction occurs when two objects are moving relative to each other and rub together. Coefficient of kinetic friction, typically denoted as μk, is usually less than the coefficient of static friction for the same materials.
Static and kinetic friction coefficients of the samples were measured by fabric-to-fabric friction by using standard abrasive wool fabric (ASTM D 4966). 28 The fabric sample under test was mounted on the sled (mass of sled: 200 g) and standard abrasive wool fabric was mounted on the moving plate (test speed: 150 mm/min; stroke 150 mm) of the coefficient tester. Friction measurements were performed in warp and weft directions of fabric samples under test. Five measurements were recorded and the mean was calculated.
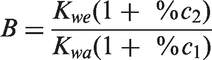
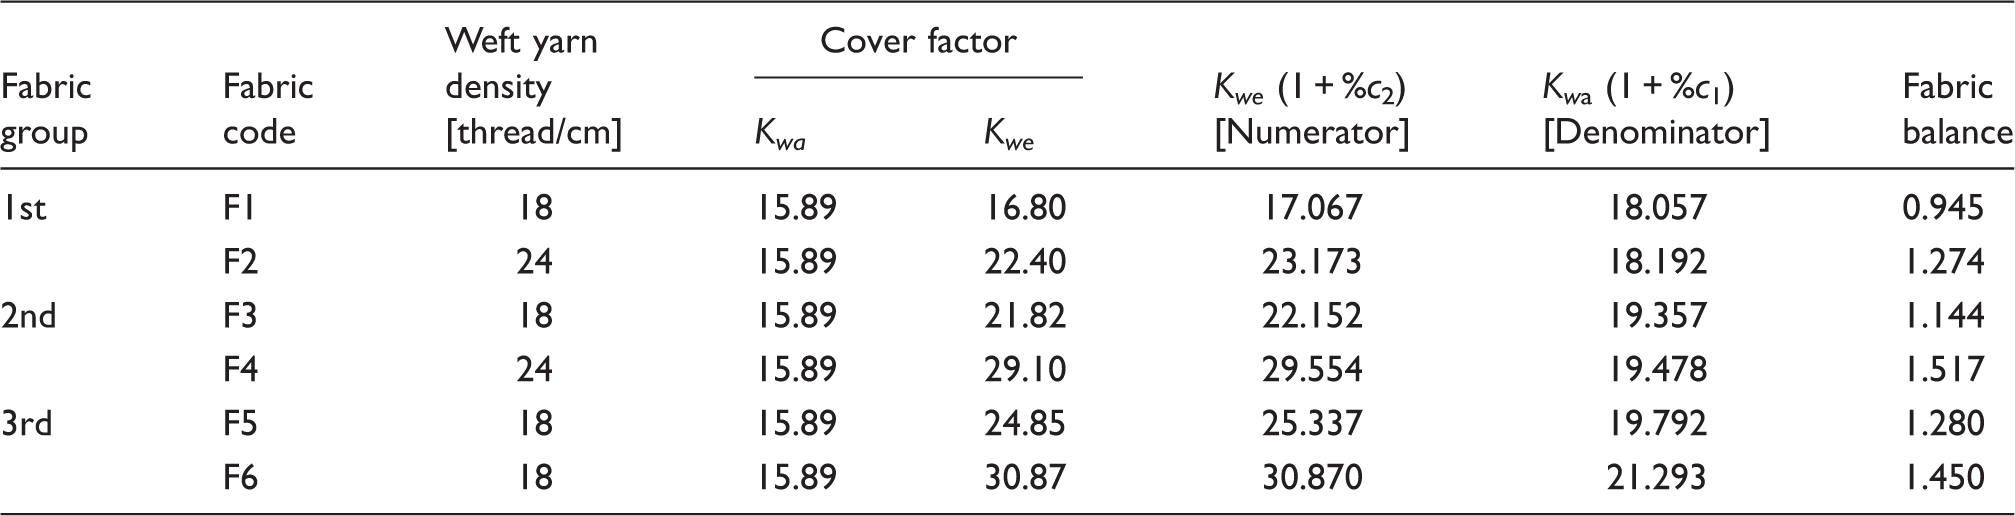
Fabric balance was calculated according to Equation (8):
29
Cover factors in warp and weft directions were calculated according to Peirce. 30 Crimp values of warp and weft yarns were calculated according to ASTM D3883-04. 31
Results and discussion
Relation between roughness and constructional parameters
Ra values of all the groups of fabric samples are presented in Figure 3. In Figure 3, where the effect of yarn density and weft yarn type on Ra were considered (F1–F2 and F3–F4), Ra values in warp, weft and diagonal directions decreased as weft yarn density increased. The reason could be explained by the higher weft density of F2 and F4, which could have formed a more regular and even fabric surface by decreasing the gaps between weft yarns. Ra values of F1 and F2 were higher than Ra values of F3 and F4 in the weft direction in Figures 4 and 5. However, Ra values of F3 and F4 were higher than Ra values of F1 and F2 in warp and diagonal directions. This could be explained by weft yarn type and warp crimp of fabric samples. Weft yarns of F1 and F2 were staple spun and relatively thin yarns when compared with weft yarns of F3 and F4, which were continuous filament spun and relatively thick yarns. During roughness measurement in the warp direction, the stylus travels along warp yarns. When the diameter of weft yarns increase, the crimp of warp yarns increases and high peaks and deep valleys probably form on the fabric surface.
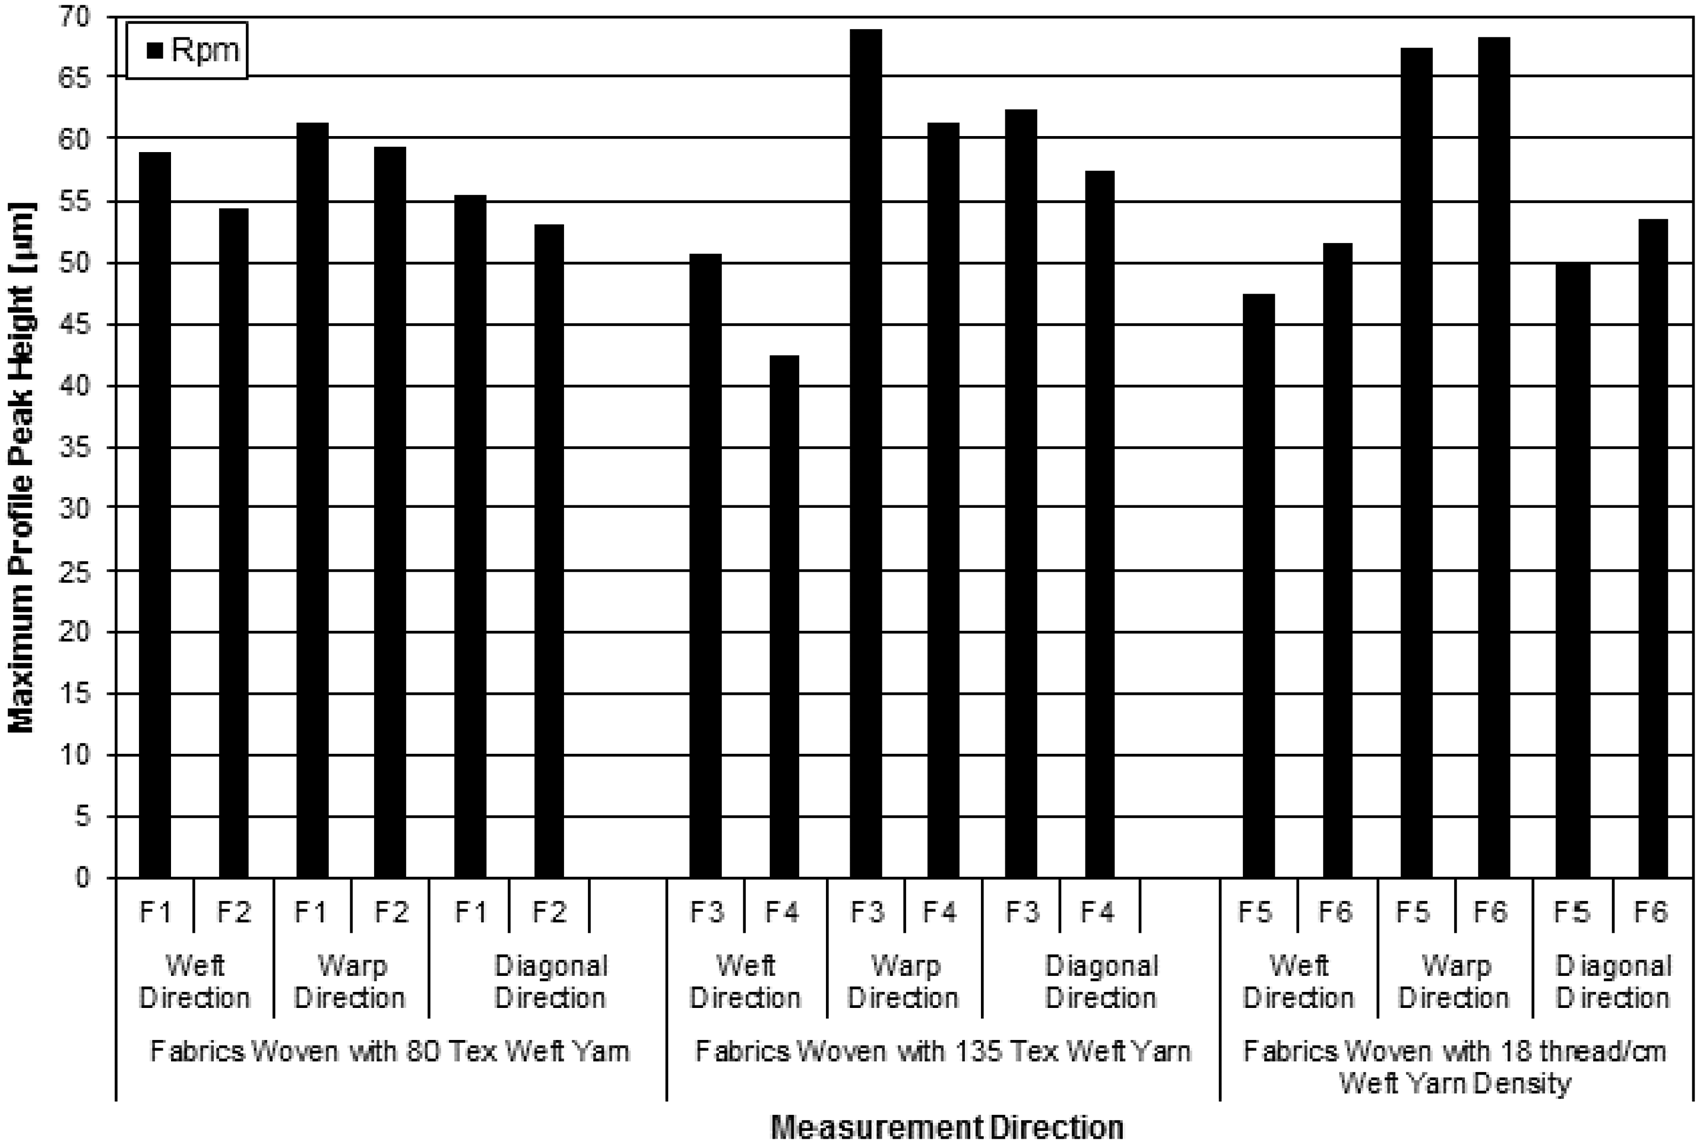
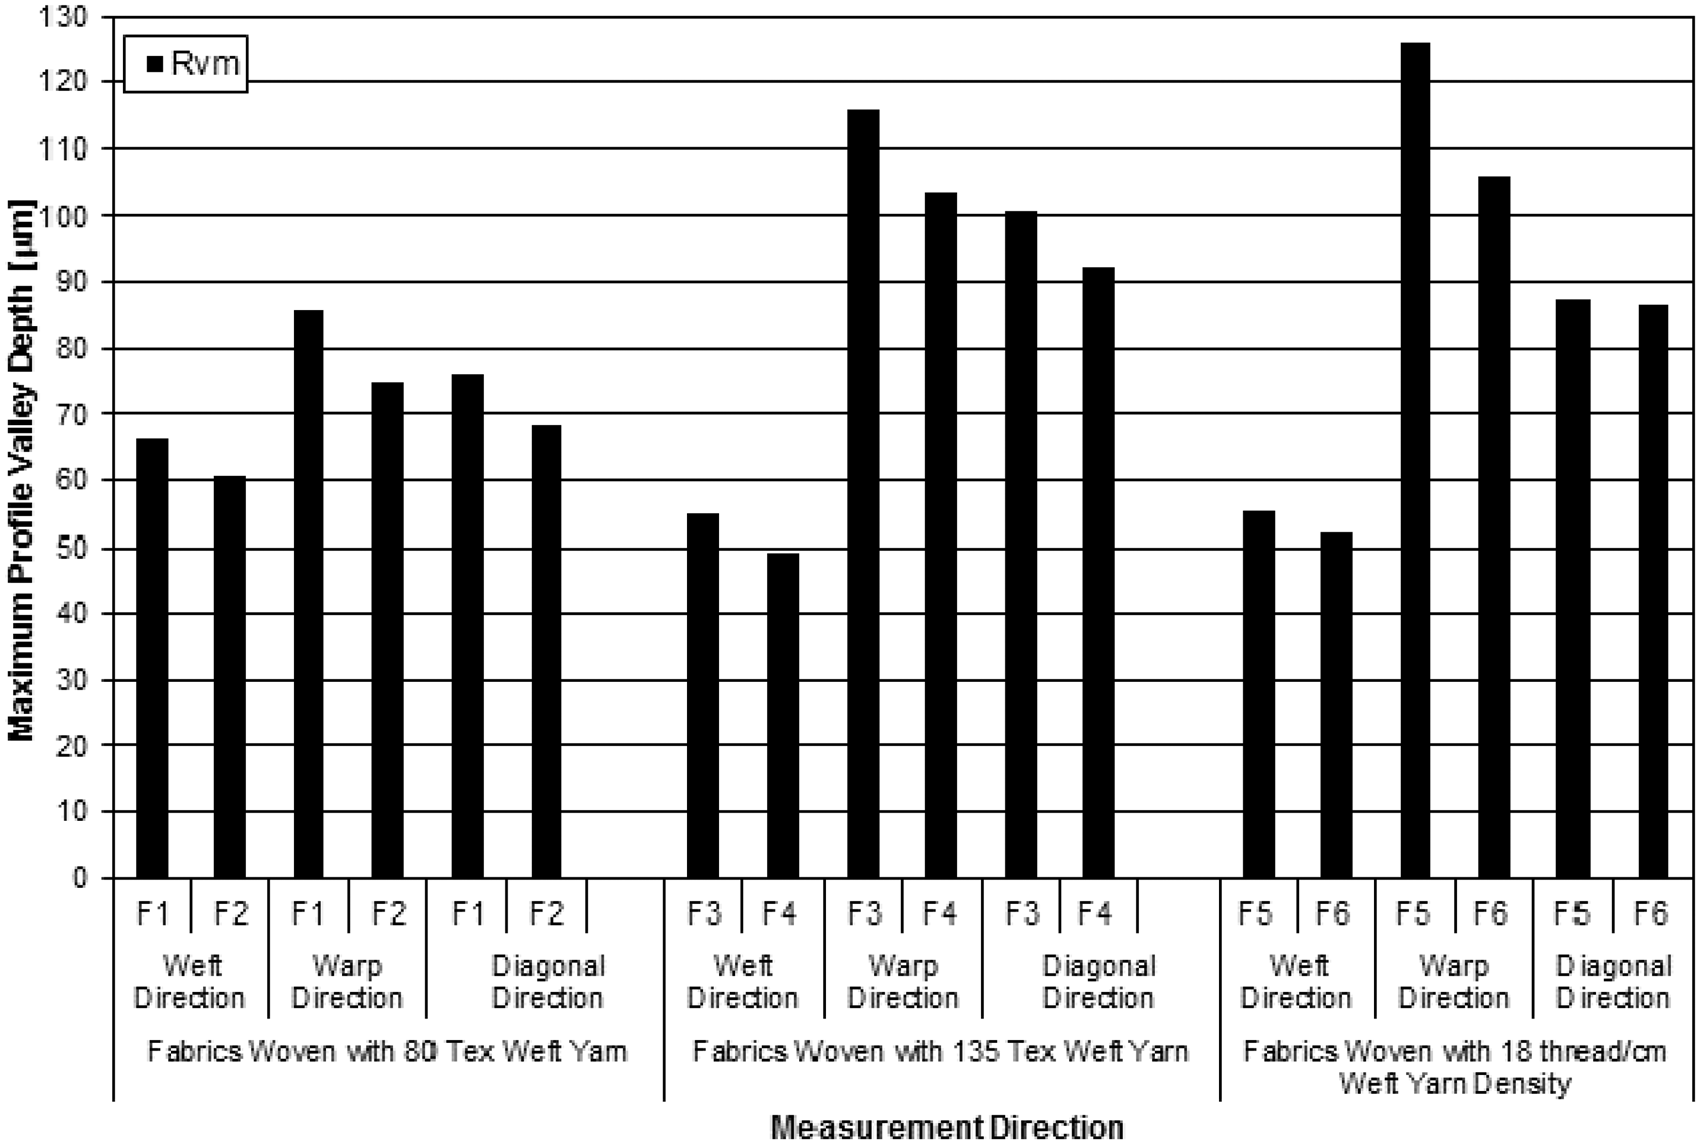
Ra values of all the groups of fabric samples. Rpm values of all groups of fabric samples. Rvm values of all the groups of fabric samples.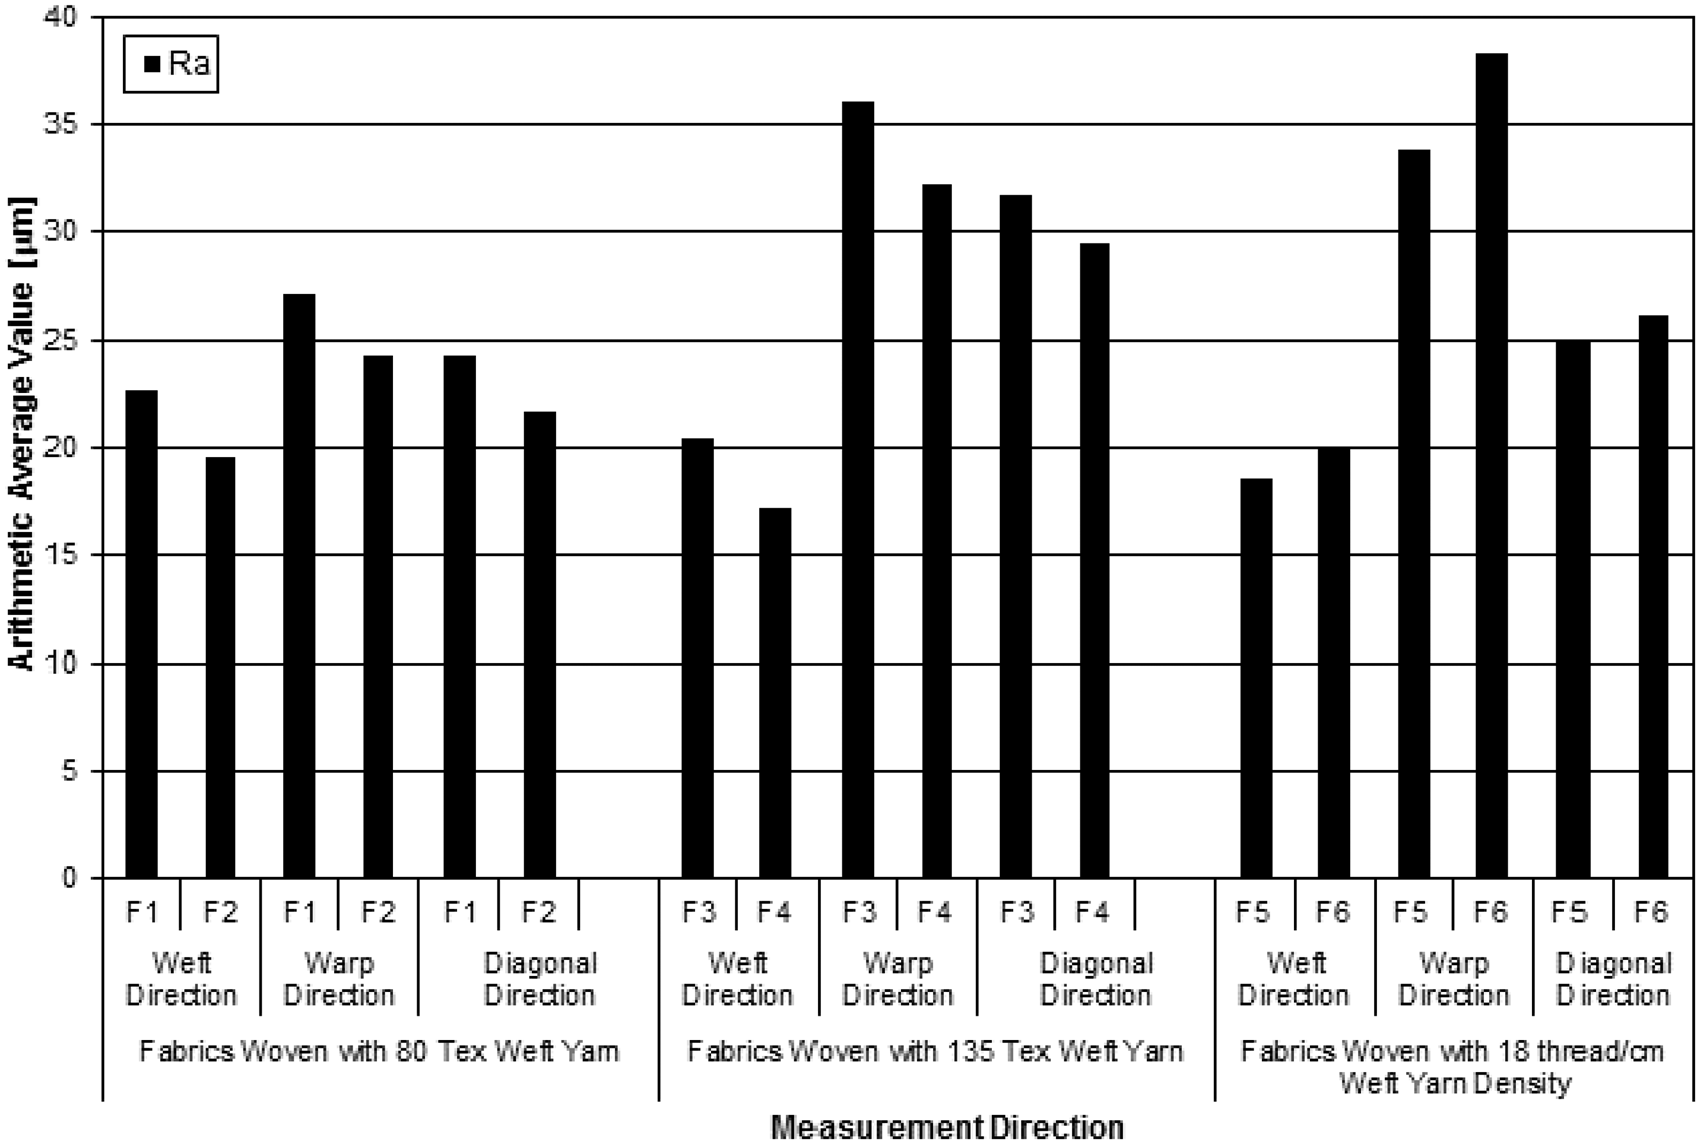
Ra values of the third group of fabric samples (F5 and F6) in weft, warp and diagonal directions are presented on the right-hand side of Figure 3. F5 and F6 had the same yarn density but their weft yarn counts (as a result their weft yarn diameters) were different from each other. Ra values increased in all directions (warp, weft and diagonal) as weft yarn count increased. This could be explained by the higher diameter of weft yarns in F6 and the higher crimp of warp yarns of F6. The two effects could have resulted in higher displacement of the stylus while it moved on the fabric surface and probably higher maxima were obtained in the vertical direction.
Rpm and Rvm values of all the groups of fabric samples are presented in Figures 4 and 5, respectively. Rpm values in Figure 4 showed corresponding behavior with Ra values in Figure 3. Rpm values decreased in the first and second groups of fabrics as weft yarn density increased (Figure 4, left-hand side and middle) and they increased in the third group of fabrics (Figure 4, right-hand side) as yarn diameter increased in the three measurement directions of warp, weft and diagonal. This could be explained similar to the explanations given for Ra in Figure 3. Higher weft yarn density of F2 and F4 could have resulted in a regular and even fabric surface. The difference of Rpm values between F1 and F2 were smaller than the difference between F3 and F4. This meant that Rpm values differed according to weft yarn count difference between the samples in each group and among each group. Rpm values decreased in the weft direction as weft yarn counts increased (F1–F3; F2–F4). However, an opposite behavior was obtained in the warp direction. Rpm values decreased in both warp and weft directions as weft density increased. The decrease of Rpm values was greater when weft density had changed in Figure 4 (middle). The reason could be the greater diameters of weft yarns of F3 and F4. Rpm values of the third group of fabric samples are presented on the right-hand side of Figure 4. It was clearly observed that Rpm values increased as weft yarn diameters increased.
The changes of Rvm values of the first and the second groups of fabrics (Figure 5, left-hand side and middle) corresponded with their Ra values (Figure 3) and Rpm values (Figure 4). Rvm values decreased in the weft direction as weft yarn counts increased (F1–F3; F2–F4). However, an opposite behavior was obtained in the warp direction. Rvm values decreased in both warp and weft directions as weft density increased. Rvm values in warp and diagonal directions of F3 and F4 (Figure 5, middle) were considerably higher than that of F1 and F2 (Figure 5, left-hand side). The reason could be the great differences between the crimps of warp yarns of the first (F1 and F2) and the second (F3 and F4) groups of fabric samples. Such a great difference was not obtained in Rvm values in weft directions between the two groups of fabrics, probably because their weft yarn crimps were close to each other.
Despite the increase obtained in Ra and Rpm values, Rvm values of the third group of fabrics (F5 and F6) decreased as weft yarn diameter increased in Figure 5 (right-hand side). The higher weft yarn diameter could have decreased the gaps between the yarns.
RΔq values of all the groups of fabrics are presented in Figure 6. RΔq values decreased when roughness measurements were conducted on the weft direction in Figure 6 (left-hand side and middle). On all the other measurements, RΔq values increased in Figure 6. The decrease obtained in measurements in weft directions could be associated with the decreases obtained in Rpm (Figure 4) and in Rvm (Figure 5). Decreases in the amplitude of peaks and valleys could have resulted in a decrease in RΔq values. Also, it must be stated that crimp values of weft yarns were considerably small (Table 1). However, the same statement could not be presented for the RΔq results in warp and diagonal directions. RΔq values showed small increases in Figure 6 (left-hand side and middle). The reason could be the high warp crimps and higher weft yarn density of F2 and F4. RΔq values obtained in the three measurement directions increased in Figure 6 (right-hand side) where crimps of warp yarns were very high and crimps of weft yarns were very low. Also, higher weft yarn diameter in F6 could have caused RΔq values to increase, probably because of the increase in Rpm values.
R Δ_q values of all the groups of fabric samples.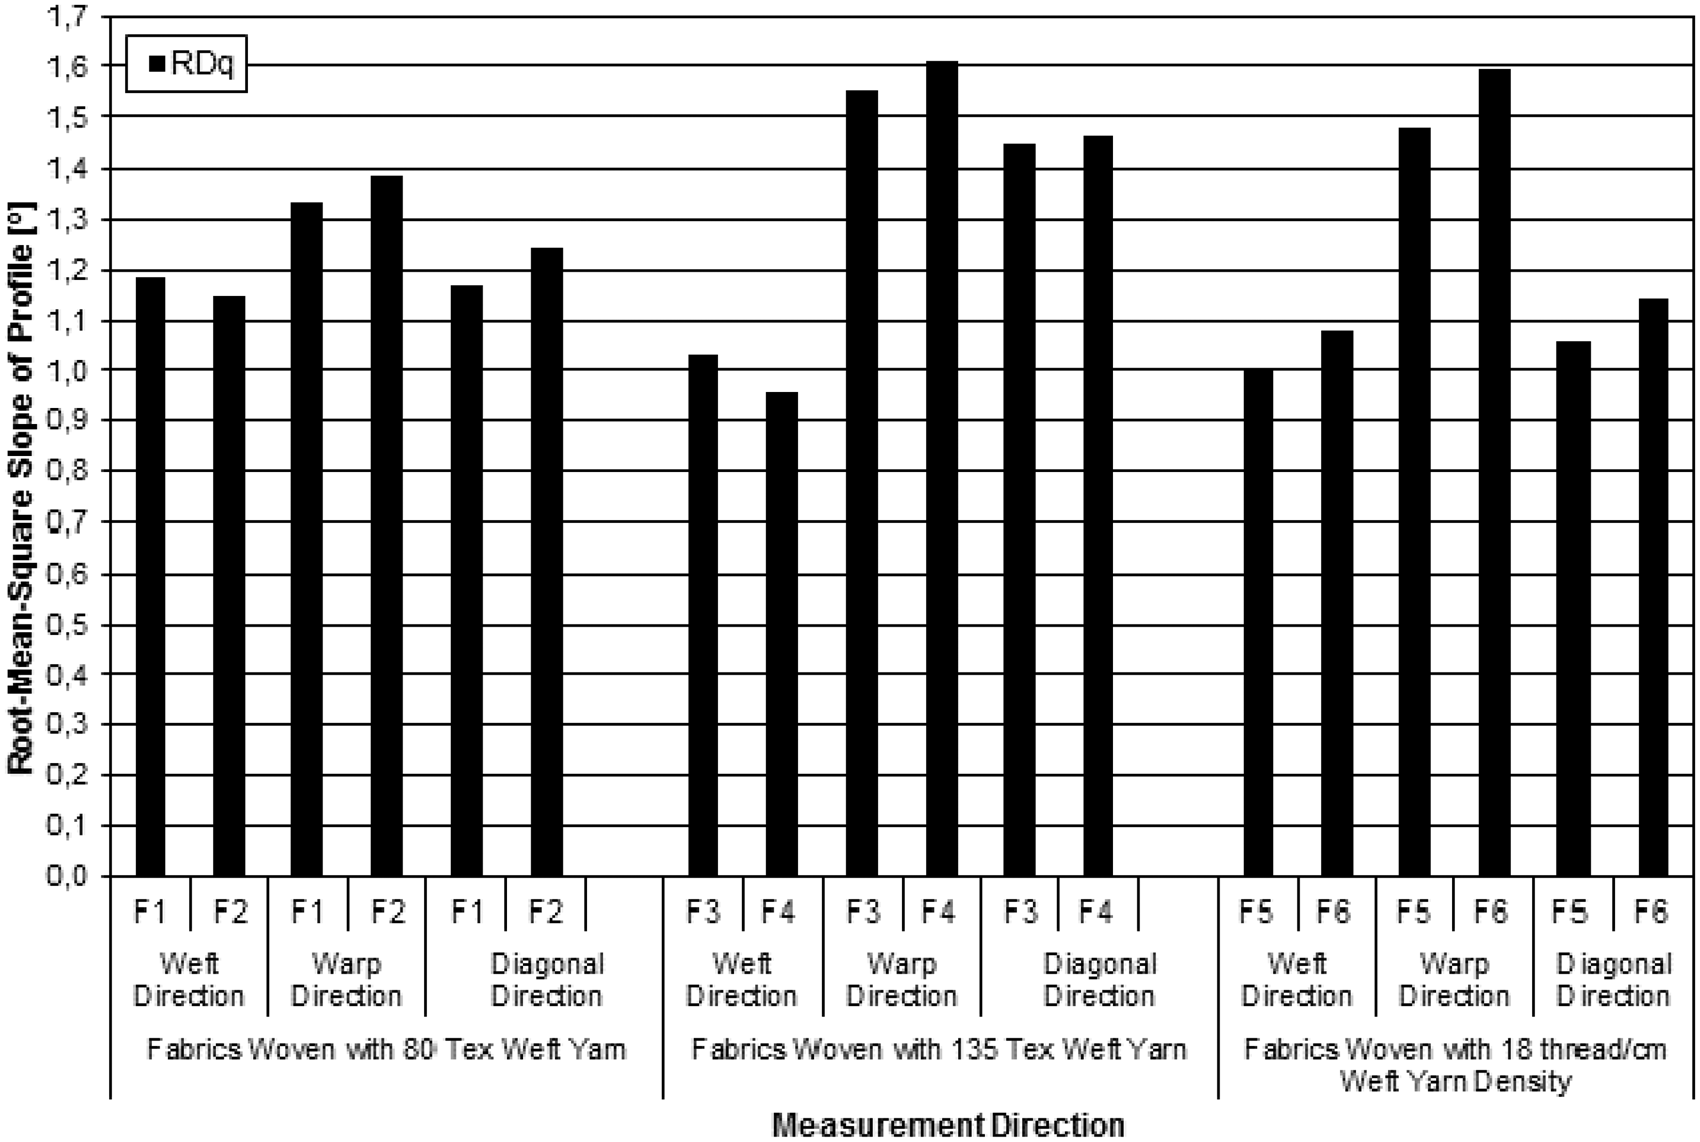
Rsm values of all the groups of fabric samples are presented in Figure 7. Rsm values gradually decreased in all the measurement directions when weft yarn density and weft yarn diameter increased. The decrease in Rsm values was the smallest in the weft direction. The decrease of Rsm values in Figure 7 (left-hand side and middle) could be explained by the increase in weft yarn density, but it was observed from Figure 7 (right-hand side) that the increase of weft yarn diameter also caused Rsm values to decrease. It could be stated that the increase in weft yarn diameter shortens the gaps on the fabric surface, which led Rsm values to decrease.
Rsm values of all the groups of fabric samples.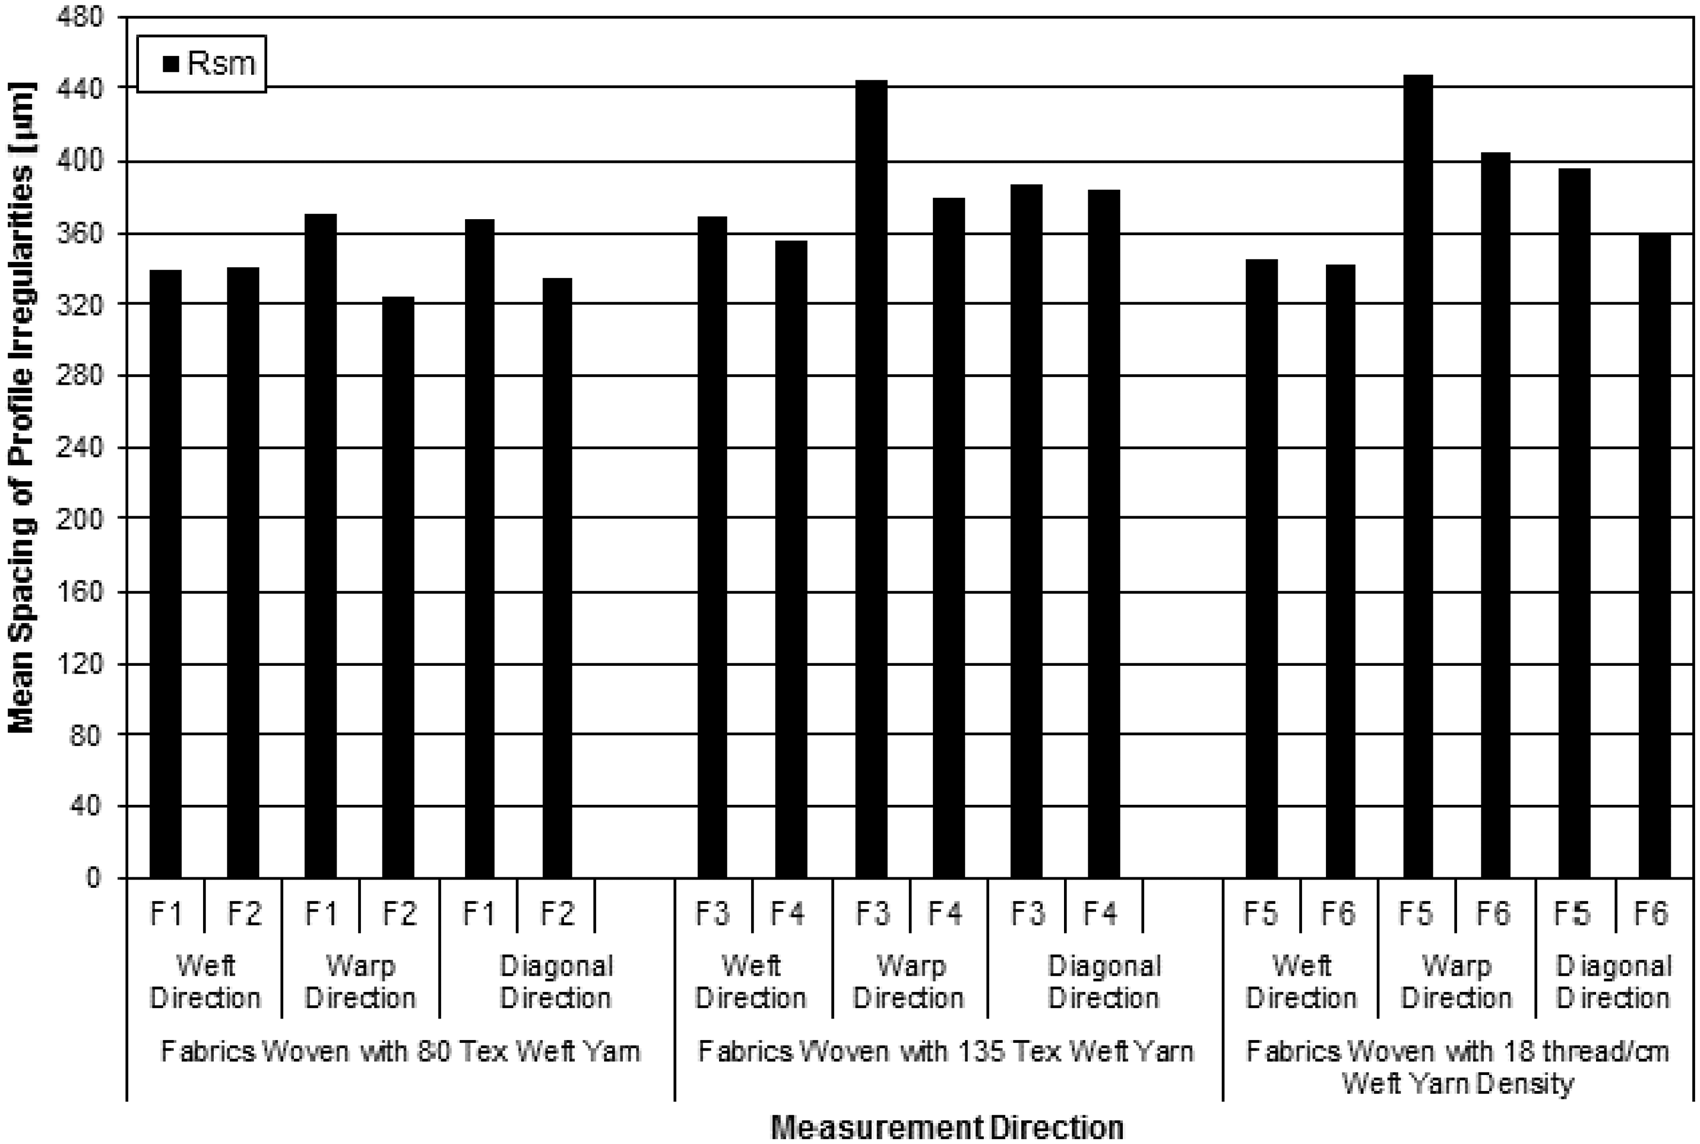
Skewness (Rsk) values of all the groups of fabrics are presented in Figure 8. All fabric samples had negative skewness values, which meant that they had a larger number of local peaks (maxima) above the mean line. However, Rsk values measured in weft directions were considerably smaller than the ones measured in warp and diagonal directions, which meant that a larger number of local peak distributions was observed in warp and diagonal directions than in the weft direction because of the increase in weft density and high warp yarn crimps. When fabric balance values (Table 2) were considered, it was observed that the value of the multiplication in the warp direction (denominator in the balance equation (Equation 8)) was almost the same in the first and in the second group of fabrics where weft yarn densities changed. The increase in weft density (18–24 thread/cm) did not affect the multiplication value in the warp direction. However, the value of multiplication in the warp direction changed more considerably in the third group of fabrics where yarn diameter considerably changed. When values of multiplication in the weft direction (numerator in the balance equation (Equation 8)) was considered, it was observed that values changed considerably when weft yarn density (F1–F2; F3–F4) and weft yarn diameter (F5–F6) changed. The differences in weft density (F1–F2; F3–F4) caused a greater difference between the values (numerator) than the difference in weft yarn diameter (F5–F6) (Table 2).
Skewness values of all the groups of fabric samples. Fabric balance and cover factor values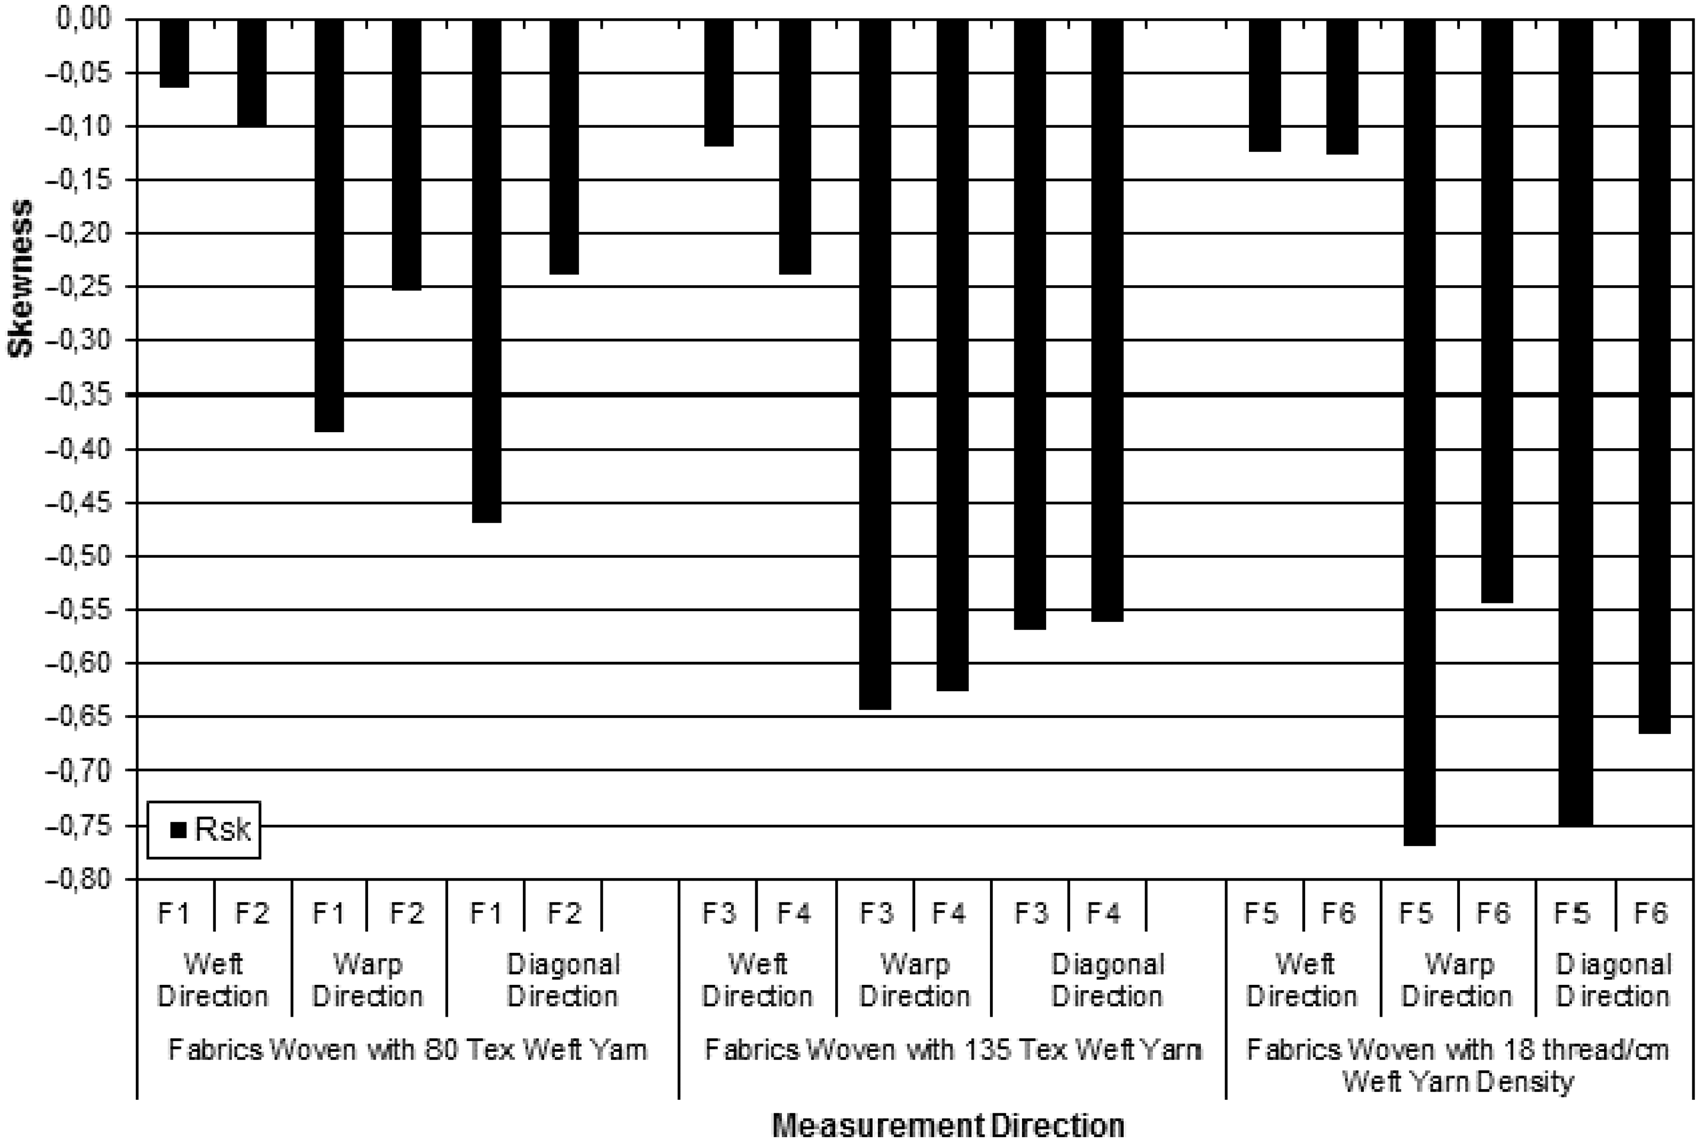
Skewness values increased to negative (departed from 0) when measurements were made along the weft direction but they decreased to positive (approached to 0) when measurements were made along warp and diagonal directions. The increase in weft yarn density rather distorted the symmetry of fabric surfaces along the weft direction, while it rather improved the symmetry of fabric surfaces along warp and diagonal directions. The two findings could be explained by increases in crimp values of warp yarns. Weft yarn diameter also affected the symmetry of fabric surfaces. Six fabric samples (F1– F6) showed greater symmetry along the weft direction than along warp and diagonal directions because they had low skewness values in the weft direction. This meant that fabric surfaces were similar to Gaussian distribution in the weft direction for the constructional properties of fabrics in this research. Properties of the fabrics were primarily changed for the weft yarn properties and the changes produced different effects in three measurement directions. Very high warp crimps were obtained while weft yarn crimps were low, which probably resulted in the skewness values being close to 0 in the weft direction.
Kurtosis (Rku) values of all the groups of fabric samples are presented in Figure 9. All fabric samples had kurtosis values near 3, which meant that they almost had symmetric peak and valley distributions that were similar to Gaussian distribution. Kurtosis values obtained in the weft direction slightly increased and kurtosis values obtained in the warp direction slightly decreased in Figure 9 (left-hand side and middle) when weft yarn densities changed from 18 to 24 threads/cm. Also, the same behavior was obtained in Figure 9 (right-hand side) when weft yarn diameter increased. These findings were in good relation with the changes in fabric thickness
32
and skewness values. Kurtosis values obtained in the diagonal direction slightly increased in F1–F2 and slightly decreased in F3–F4 and F5–F6. This was probably related with Rpm (Figure 4) and Rvm (Figure 5) values. Peaks and valleys could have made a compensation of results in each fabric group. Only the kurtosis values measured in diagonal directions were slightly above 3 in F5–F6. These results in diagonal directions could be matched by the high warp crimps.
Kurtosis values of all the groups of fabric samples.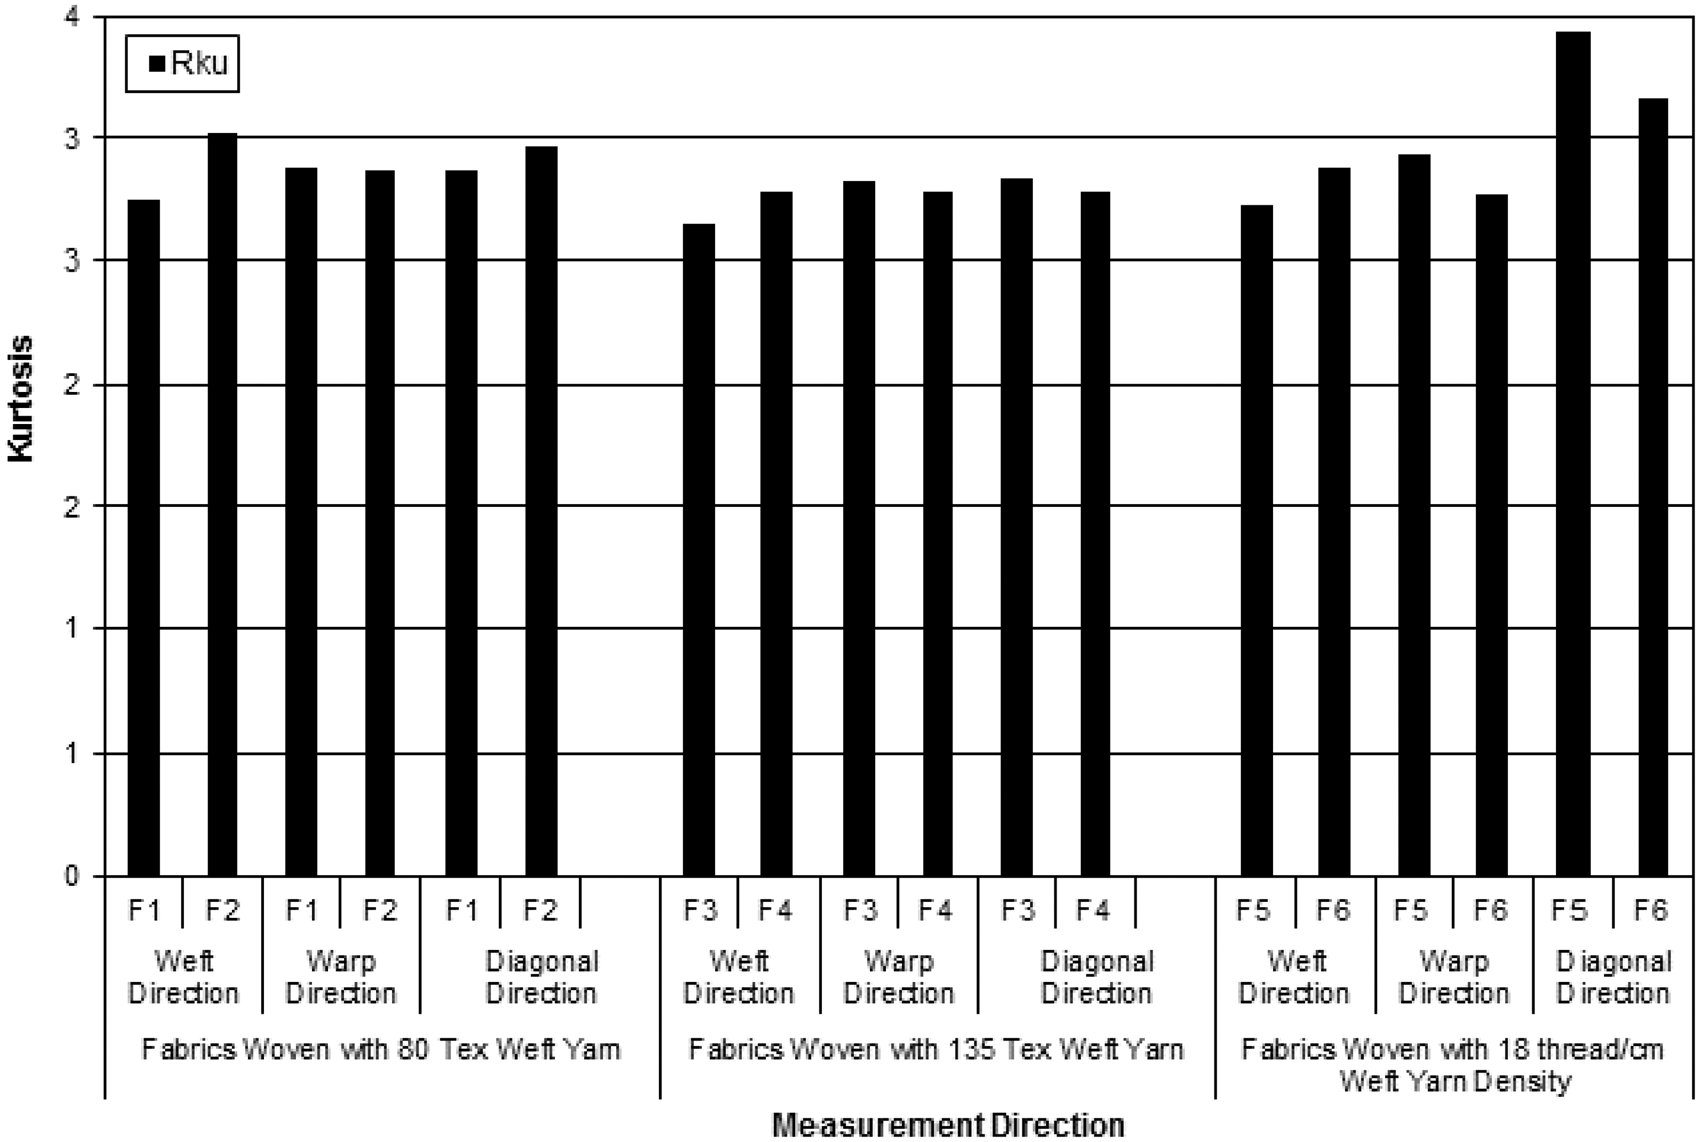
In order to make an overall discussion of the figures, the distribution of profile variations could be considered according to their similarity to Gaussian distribution. Skewness (Rsk) and kurtosis (Rku) values are directly associated with Gaussian distribution and a Gaussian distribution has a skewness value of 0 and a kurtosis value of 3. Skewness values showed that fabric samples had low Rsk values in the weft direction but they had high Rsk values in warp and diagonal directions, which meant a relatively asymmetric distribution, especially in warp and diagonal directions (depending on the constructional properties of the fabric samples in this experimental procedure). However, kurtosis values that were very close to 3 showed that fabric samples had regular surfaces without sharp peaks, but with regularly distributed peaks and valleys. Negative skewness values were in good correlation with kurtosis values of near or smaller than 3.
Changes in skewness and kurtosis values, together with changes in the other roughness parameters, showed that fabric surfaces changed their surface distribution character in different ways in warp, weft and diagonal directions when weft yarn density and weft yarn count changed. It could be stated that increase in weft yarn density and weft yarn diameter generally improved the fabric surfaces to Gaussian distribution (kurtosis values moved to 3) when these two effects were discussed independently from each other. However, the drawback is that the same effect (yarn diameter or yarn density or both at the same time) could not lead the surfaces to Gaussian distribution in the three measurement directions at the same time.
Fabric thickness values are presented in Table 1. Fabric thickness values increased as weft yarn diameter increased (the third group of fabrics) but they slightly decreased as weft yarn density increased (first and second groups of fabrics). Roughness (Ra) values (Figure 3) changed in good relation with fabric thickness values. However, skewness (Figure 8) and kurtosis (Figure 9) values changed in different manners with fabric thickness. The decrease in fabric thickness due to the increase in weft yarn density affected skewness and kurtosis values differently from each other in warp and weft directions. Being related with the other constructional properties, it was very difficult to present an exact discussion about the effect of fabric thickness with roughness parameters on measured properties due to the anisotropic structure of woven fabrics. Distribution of surfaces (skewness) increased to negative in the weft direction, probably due to increase in weft density and due to decrease in fabric thickness, which meant that yarn diameters were compressed away from their nearly round shapes to more elliptic shapes (kurtosis values approached 3). However, distribution of surfaces (skewness) decreased to positive in warp and diagonal directions due to an increase in warp crimps because of the increase in weft density (kurtosis values slightly departed from 3).
Relation between roughness and friction coefficients
Kinetic coefficients of friction decreased in the weft direction but they increased in the warp direction when weft yarn density increased. With the increase in weft density, fabric thickness decreased and both weft and warp yarn crimps increased. Also, surface roughness (Ra) decreased with the increase in weft density. Together with increase of skewness in the weft direction and decrease of skewness in the warp direction and the changes in kurtosis values, it could be stated that the increase in weft yarn density decreased fabric thickness by causing a closer settlement of weft yarns on which the probe of the roughness tester moved more regularly. As a result, the kinetic coefficient decreased in the weft direction but it slightly increased in the warp direction. The increase of the kinetic coefficient in the warp direction could stem from the increase of warp crimps.
The kinetic coefficient of friction decreased in warp and weft directions when yarn diameters increased (F1–F3; F2–F4). This could be explained by the high skewness results (in warp and weft directions) that were in the negative direction and it could be stated that peak and valley distribution about the mean line changed in a way that the bulk of the material was placed more evenly over the mean line, which caused kinetic friction coefficients to decrease. However, the same conclusion could not be presented for the third group of fabrics (F5–F6). Skewness results in the weft direction were almost the same. However, skewness in the warp direction of F6 was considerably smaller than that of F5. This was probably due to the difference of fiber fineness of the two weft yarns. The F5 sample, having weft yarn with finer fibers, would have increased skewness.
An overall consideration among yarn diameter, surface roughness, skewness and kinetic coefficients showed that these had changed in different manners in the measurement directions of warp and weft. The roughness values in the weft direction changed very close to each other (Figure 3) so that it is difficult to make sharp clusters between the samples. However, roughness values in the warp direction changed considerably differently from each other, which enabled one to make a discussion between the parameters. When weft yarn diameters increased, it was observed that roughness in the warp direction increased but kinetic coefficients decreased. However, it could be expected that friction coefficients would increase with the increase in roughness for fabric structures. The opposite results obtained in this experimental procedure could stem from the skewness values of the fabric samples. Skewness values moved to negative values as yarn diameters increased (F1–F3; F2–F4), which meant that the bulk of the material was placed more evenly over the mean line. The even distribution could have led kinetic coefficients to decrease.
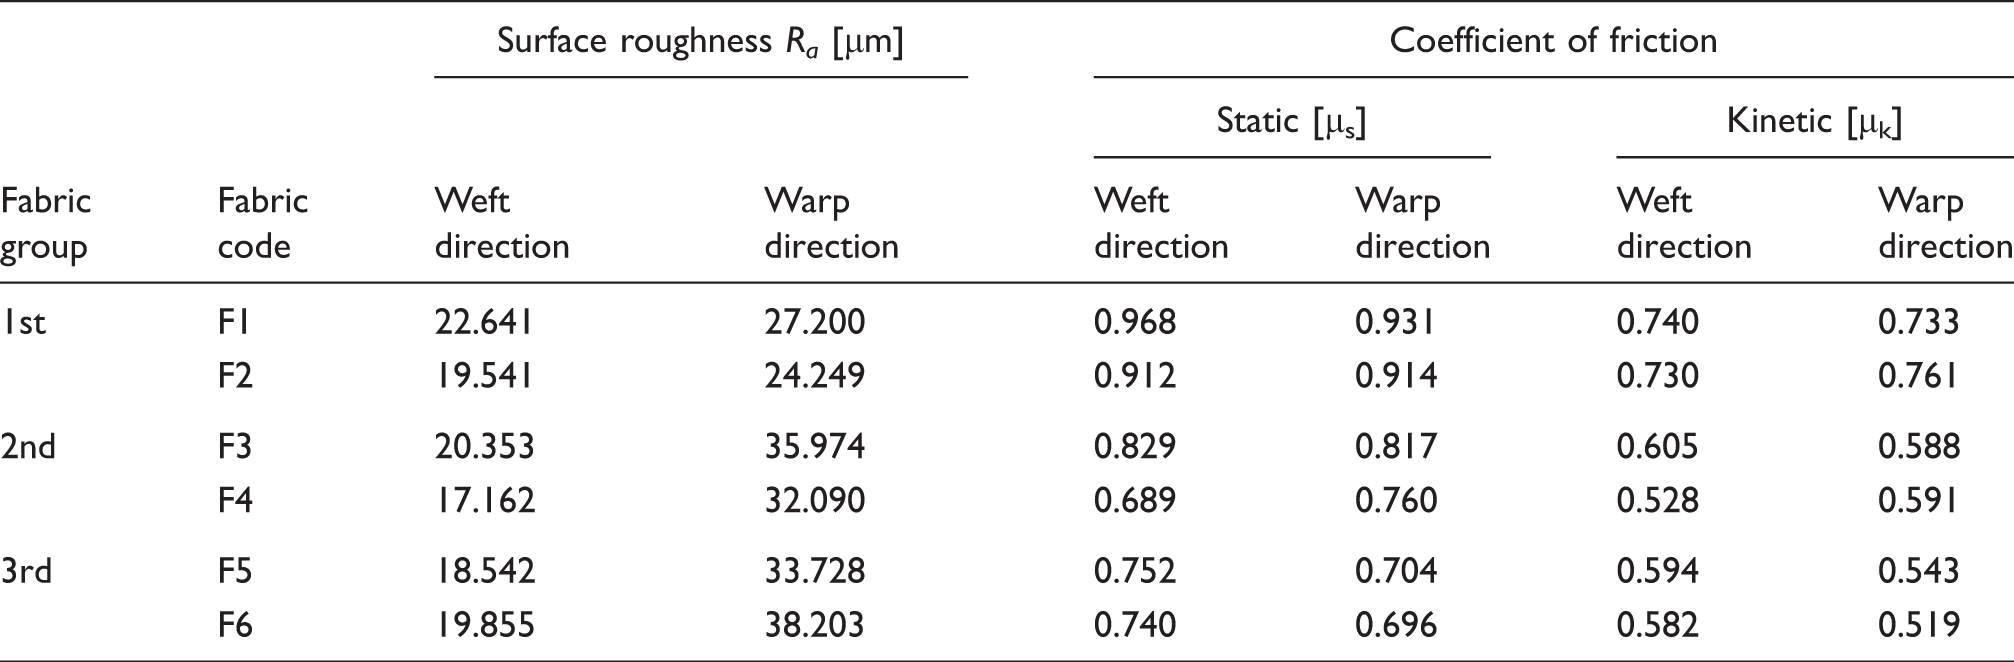
When static and kinetic coefficients of friction were considered, it was observed that static coefficients were higher than the kinetic ones in the measurement of each fabric sample, as would be expected.
Static coefficients were in good relation with the kinetic coefficients. Static coefficients decreased in both warp and weft directions as weft yarn density and weft yarn diameter increased. This could be explained as was given in the discussion made for kinetic coefficient results and also with skewness results, which moved to 0 and with kurtosis results, which were near 3.
Surface roughness and coefficients of friction values
Queue of friction coefficients, roughness values and skewness values

When Ra, coefficients of friction (static and kinetic) and skewness (Rsk) were considered together (Table 4), distinctly different matches were obtained in warp and weft directions. In the weft direction, static and kinetic coefficients of friction changed parallel to each other when a queue was made (F6 > F7 > F4 > F8 > F9 > F5) and Ra values changed from the highest value to the lowest one in the same queue.
In the warp direction, static (F6 > F7 > F4 > F5 > F8 > F9) and kinetic (F7 > F6 > F5 > F4 > F8 > F9) coefficients of friction changed almost parallel to each other. Ra values changed from the lowest value to the highest one in the queue of F7 < F6 < F5 < F4 < F8 < F9.
The queues changed in opposite ways in warp and weft directions when friction coefficients and Ra values were correlated (Table 4). The reason could be explained by Rsk values (Figure 8). Rsk values decreased to positive (approaching to 0) in the weft direction, while Ra values and friction coefficients increased. However, Rsk values in the warp direction increased to negative (departed from 0), while Ra values increased and friction coefficients decreased. Departure of Rsk values from 0 to negative values meant that the bulk of the material was more distributed over the mean line. The correlation of Ra, Rsk values and friction coefficients showed that the surface symmetry of textile fabrics would change differently from each other in the measurement directions, depending on not only one property but on a combination of properties (yarn density, yarn count, weave pattern, etc.). The independent material properties could make clusters between each other so that a change in a material property could change the surface characteristics in an unexpected way because of their relation with the other properties within the cluster.
Digital photographs of first group of fabric samples (F1–F6) are presented in Figure 10 to discuss the constructional parameters and surface look.
Digital photographs of the all groups of fabric samples (45 × magnification).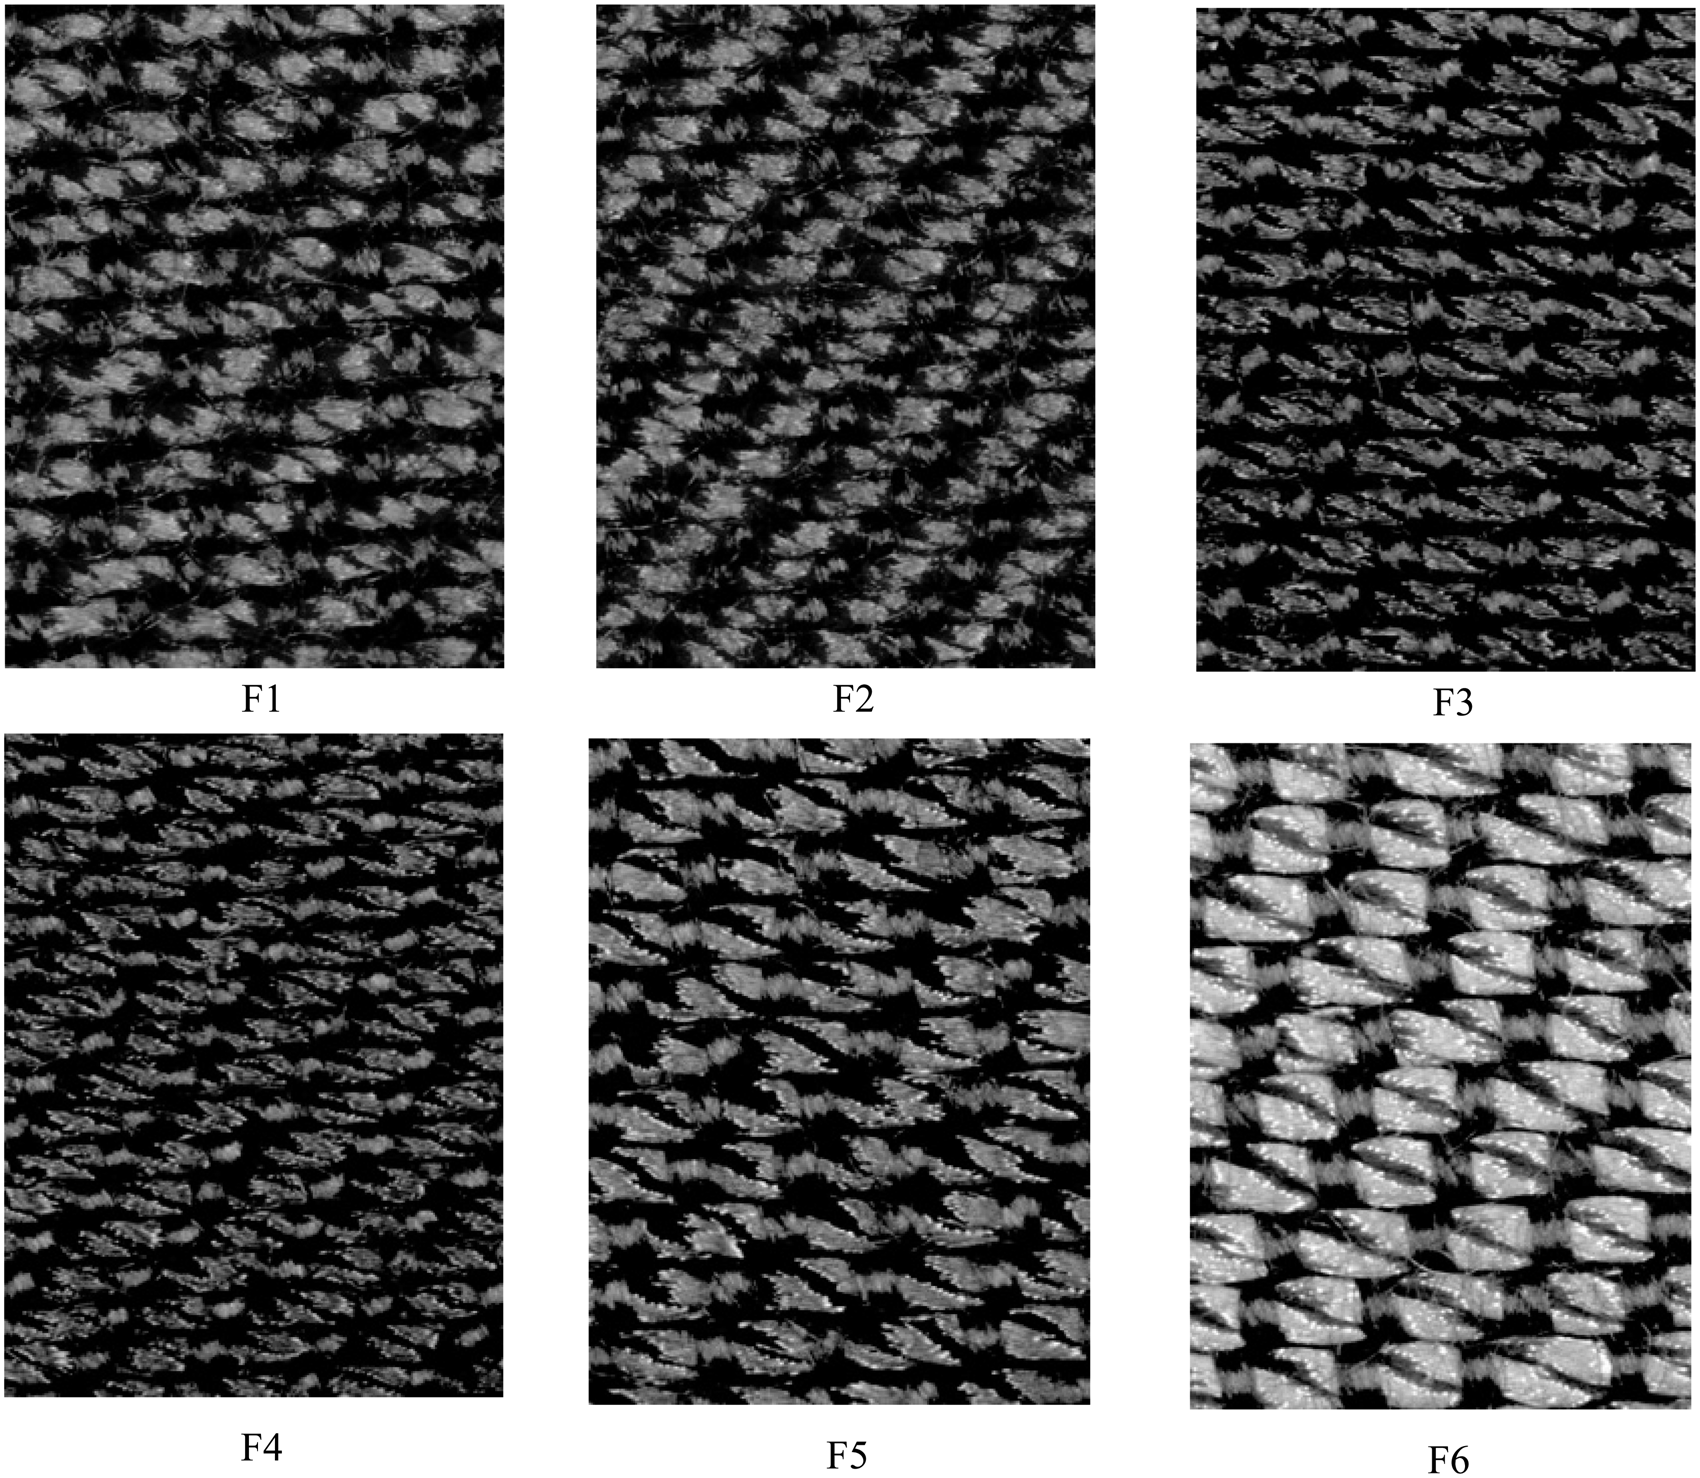
Conclusions
Surface roughness parameters and friction coefficients of six woven fabrics in three experimental groups were researched in relation with their weft yarn densities and weft yarn counts. Roughness parameters changed in different manners in weft, warp and diagonal directions according to the changes in weft yarn properties. It was observed that skewness and kurtosis results of woven fabric surfaces were the most important ones to interpret the results with the other selected parameters. Changes in roughness and friction coefficients were discussed with changes in skewness and kurtosis. Depending on this experimental design, it was concluded that changes (increase) in weft yarn density drove the surface distribution to negative skewness, producing even peak distribution with a small number of scratches above the mean line (gaps between yarns), especially in the weft direction. Changes in weft yarn count (increase in yarn diameter) drove the surface distribution to a kurtosis value of 3, producing almost equal number of peaks and valleys above the mean line. Increase in weft density increased skewness in the weft direction, while it improved kurtosis in the same direction as well. Roughness parameters were influenced primarily from fabric constructional parameters and from the related yarn crimps. However, a generalization could not be made that combines directly the magnitudes of roughness and friction coefficients. Higher roughness may result in different behaviors of static and kinetic friction coefficients, depending on the characteristics of fabric surface. Skewness and kurtosis parameters were considered to be important in the discussion of roughness properties, because high roughness values do not always mean high friction coefficients. Changes in weft yarn properties affected the peak and valley distribution of fabric surfaces and their correspondence with Gaussian distribution.
Footnotes
Declaration of Conflicting Interests
The authors declared no potential conflicts of interest with respect to the research, authorship and/or publication of this article.
Funding
The authors disclosed receipt of the following financial support for the research, authorship, and/or publication of this article: This work was supported by Uludag University Scientific Research Projects Division (Project No. OUAP(M) - 2013/17 and Project No. OUAP(MH) - 2014/26).