
Abstract
Wet fabric bothers everyone as it sticks to the skin, hinders body movement and brings discomfort and awkwardness on many occasions. Much has to be done to evaluate this adhesion of a wet fabric to human skin for minimizing the discomfort resulting from this phenomenon. In this study, an improved measurement is developed to test and distinguish the adhesion forces of different materials under controlled conditions. A new and improved theoretical model is proposed to estimate the adhesion force based on the gravity of the liquid bridge that formed beneath the fabric. The theoretical values are reasonably consistent with the experimental results. A potential solution is also proposed for reducing the volume of the liquid bridge in designing a less adhesive fabric by constructing hydrophobic protrusions to the fabric surface.
It is well known that wet fabrics adhere to the skin, hindering body movement, causing discomfort and influencing appearance. In industrial applications, however, this adhesion could also be useful or harmful, depending on the end uses. Examples of wet fabrics on different occasions are shown in Figure 1. As it is unrealistic to avoid these wet situations, we must find a way to reduce the adherence of wet fabric to human skin or other surfaces.
Wet fabrics adhering to human skin on different occasions: (a) shirt (TC, woven); (b) sportswear (polyester, knitted); (c) leisurewear (silk, woven); (d) dress (cotton, knitted).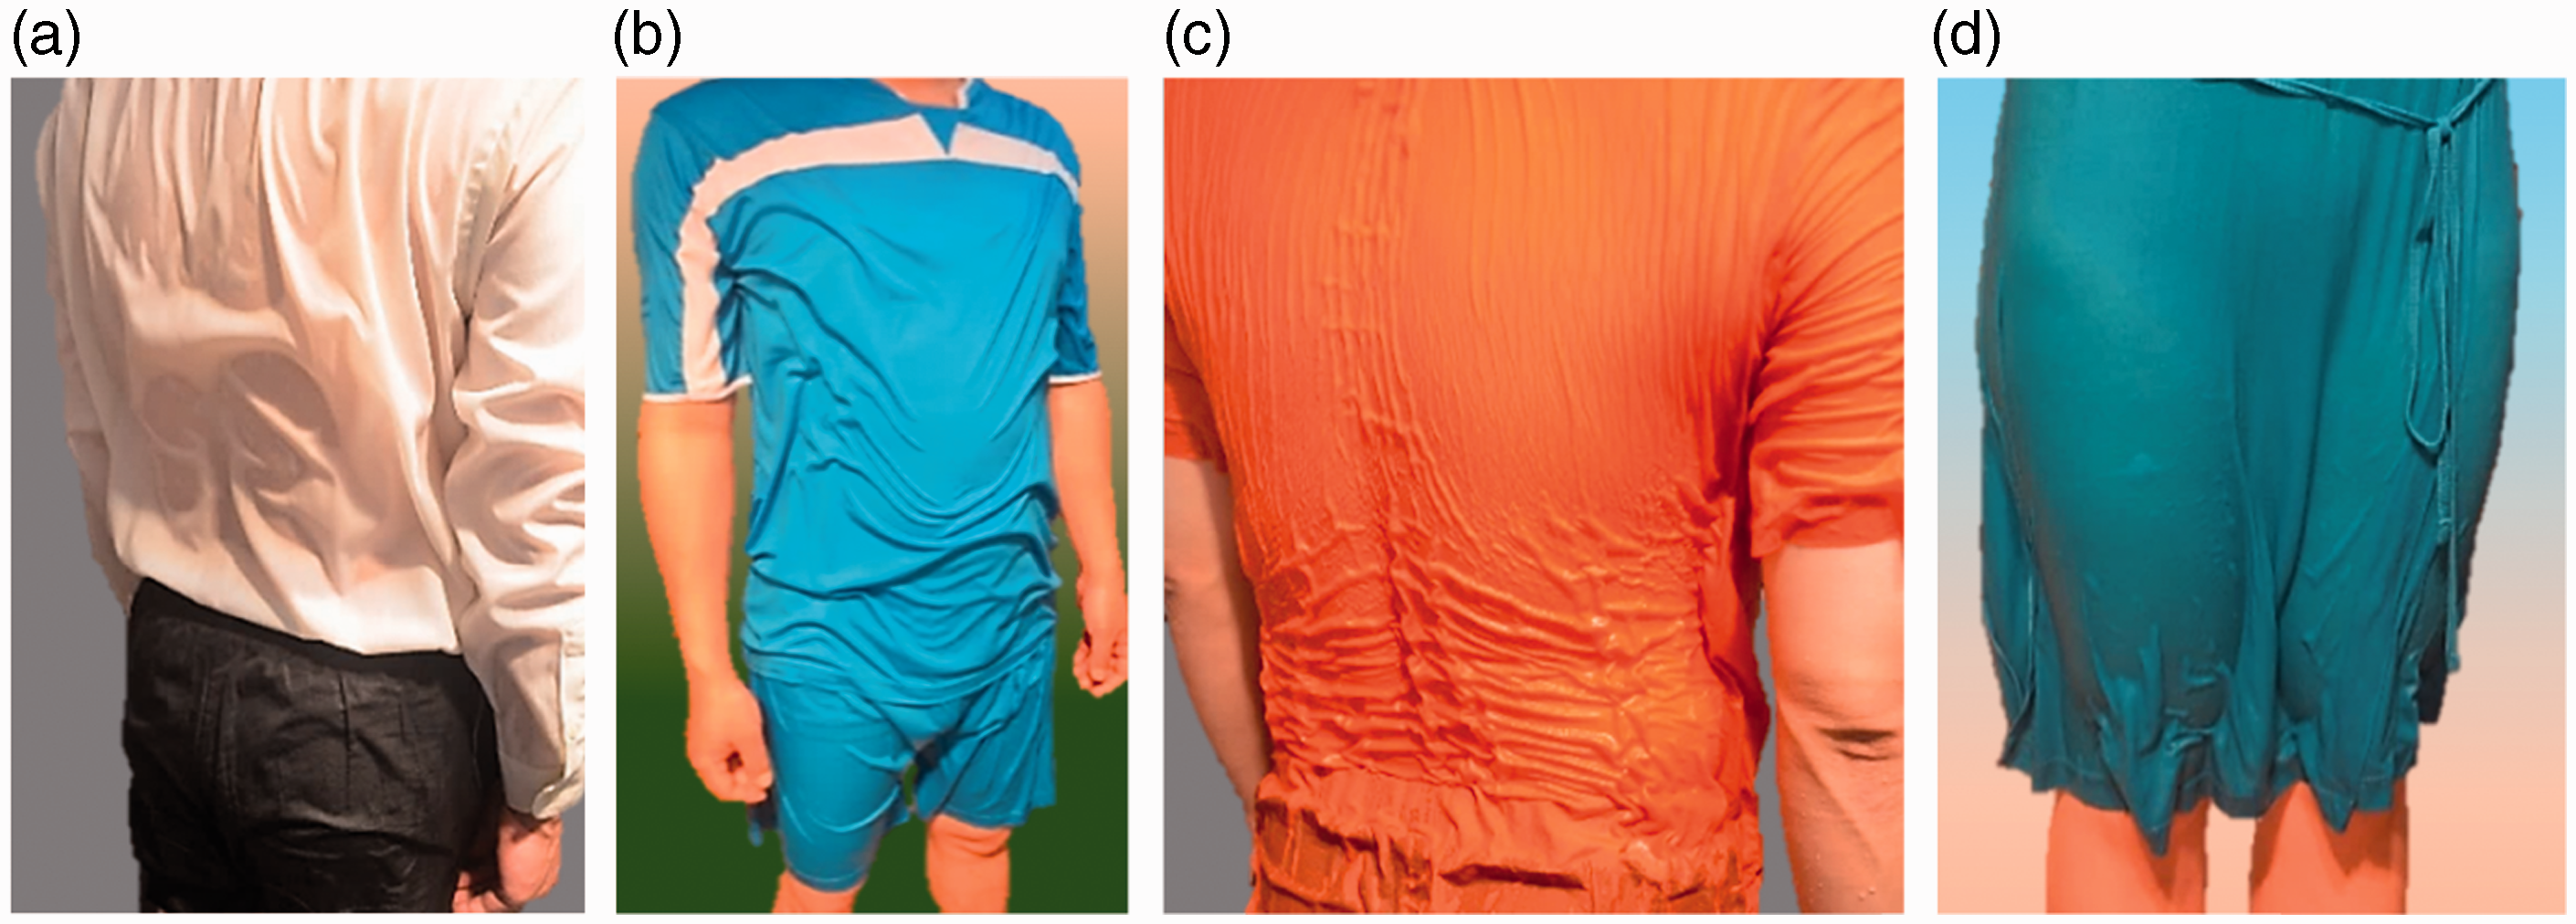
Performances related to wet fabrics are reported, such as friction,1–5 water vapor permeability,6,7 liquid transfer,8–10 thermal resistance, 11 electrical resistance, 12 drying time, 13 wetness sensation, 14 etc. When it comes to adhesion performance of a wet fabric, little has been reported. Yamada et al. 15 simulated a wet fabric being pulled up from a plane through the center by a mass spring model, assuming that the pressure difference between trapped air and the open air caused the sticking force, without considering friction. Ke and Cong 16 established a model between the existing instrumental measurements and the sensory evaluation indices for prediction of comfort, including sticky feeling based on the back-propagation neural network. However, neither study proposed the cause or estimation of the sticky feeling, nor did they develop an instrumental measurement method for the sticky feeling. Ji et al.17,18 developed a testing method to evaluate the adhesion force, adhesion distance and adhesion work of a vertically mounted wet fabric during its separation from an artificial skin. Sun et al. 19 tested 10 different fabrics using Ji et al.’s equipment and found that the adhesion properties were related to fabric tensile and bending properties, tested by the Kawabata evaluation system (KES).
The wet adhesion force can be defined as the force that perpendicularly sticks one material with another when one or both materials get wet. In our previous study, 20 a theoretical model based on surface tension of the liquid bridge was developed to explain the cause of the adhesion. The model focused on the force over the fabric–liquid interface, which pulled down the fabric and held the liquid and fabric together from falling apart. The process of separating the fabric from the liquid was divided into three stages: pulling up (before the border of the liquid bridge left the edge of the fabric), separating (after the border of the liquid bridge left the edge of the fabric) and detaching (breakdown of the liquid bridge). During the process, the fabric deformed as being pulled by the adhesion force and the fabric–liquid interface could be assumed as a horizontal round. In Stage 2, the theoretical model could match the experimental results tested by a newly developed device measuring horizontal-type adhesion force, which was proved to have rather good repeatability.20,21 However, for the first stage, that model could not come up with a theoretical match. Therefore, in this study, a new and improved theoretical model is developed based on the gravity of the liquid bridge that could be regarded as the counter-force of the adhesion force applied by the fabric to the liquid bridge. The new model can estimate the adhesion force for the whole separation process, including both Stage 1 (pulling up) and Stage 2 (separating). The adhesion force measurement in this study was also improved with more visual information.
Nomenclature
Adhesion force on the fabric. Gravity or volume of the liquid bridge. Contact angle at the top or bottom of the liquid bridge. Radius of the top or bottom of the liquid bridge. Radius of the fabric edge that is clamped by the fabric holder. Radius of Circle Q, which is on the profile of liquid–vapor interface. Density of the liquid. X-coordinate and also radius of a differential cross-section at a certain height of the liquid bridge. Height of the liquid bridge. Height of the fabric edge that is clamped by the fabric holder. Difference of Ze and Zl.
Materials
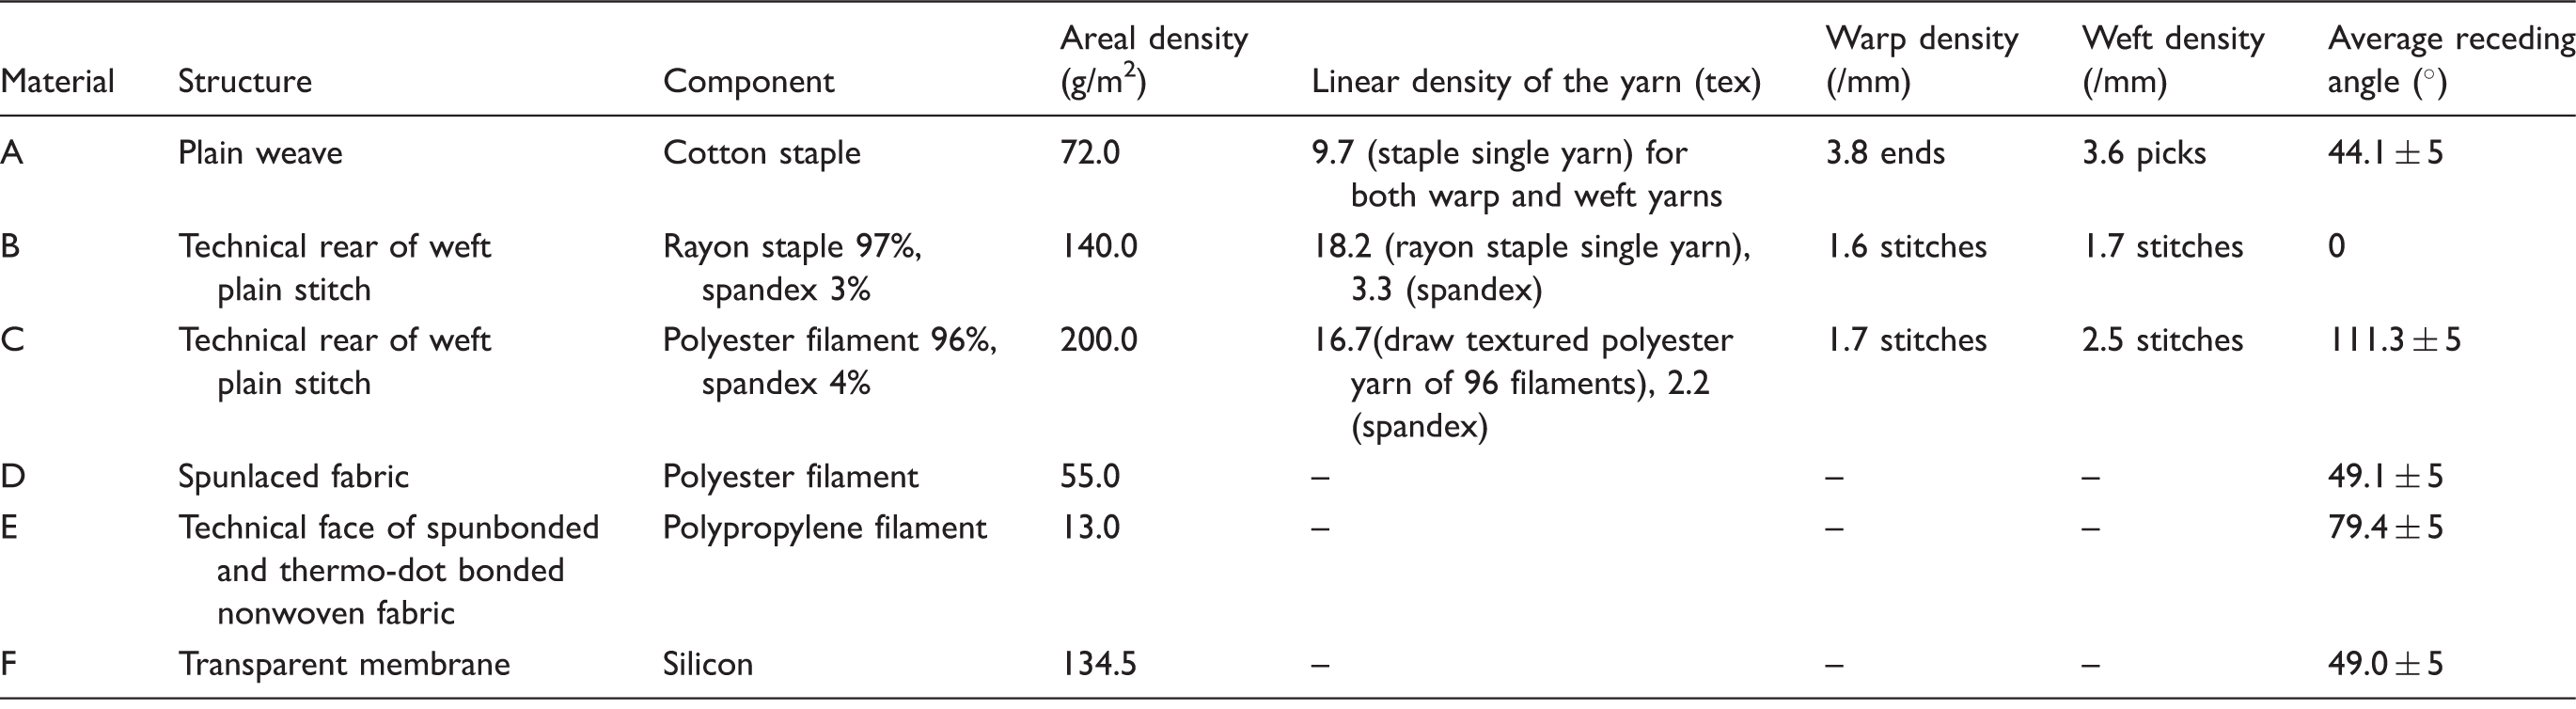
The parameters and pictures of the materials are shown in Table 1 and Figure 2, respectively. The size of the samples was 120 mm × 120 mm. No special finishing was applied to the samples.
Samples under the same magnification: tested face. Parameters of the fabrics and membranes Note: as the material surface was not ideally smooth, the average receding angles were measured and used for further calculation. The average receding angles here were the average of visible contact angles of the liquid bridge and a fabric sample in each frame of the video after the liquid border had left the edge of the fabric.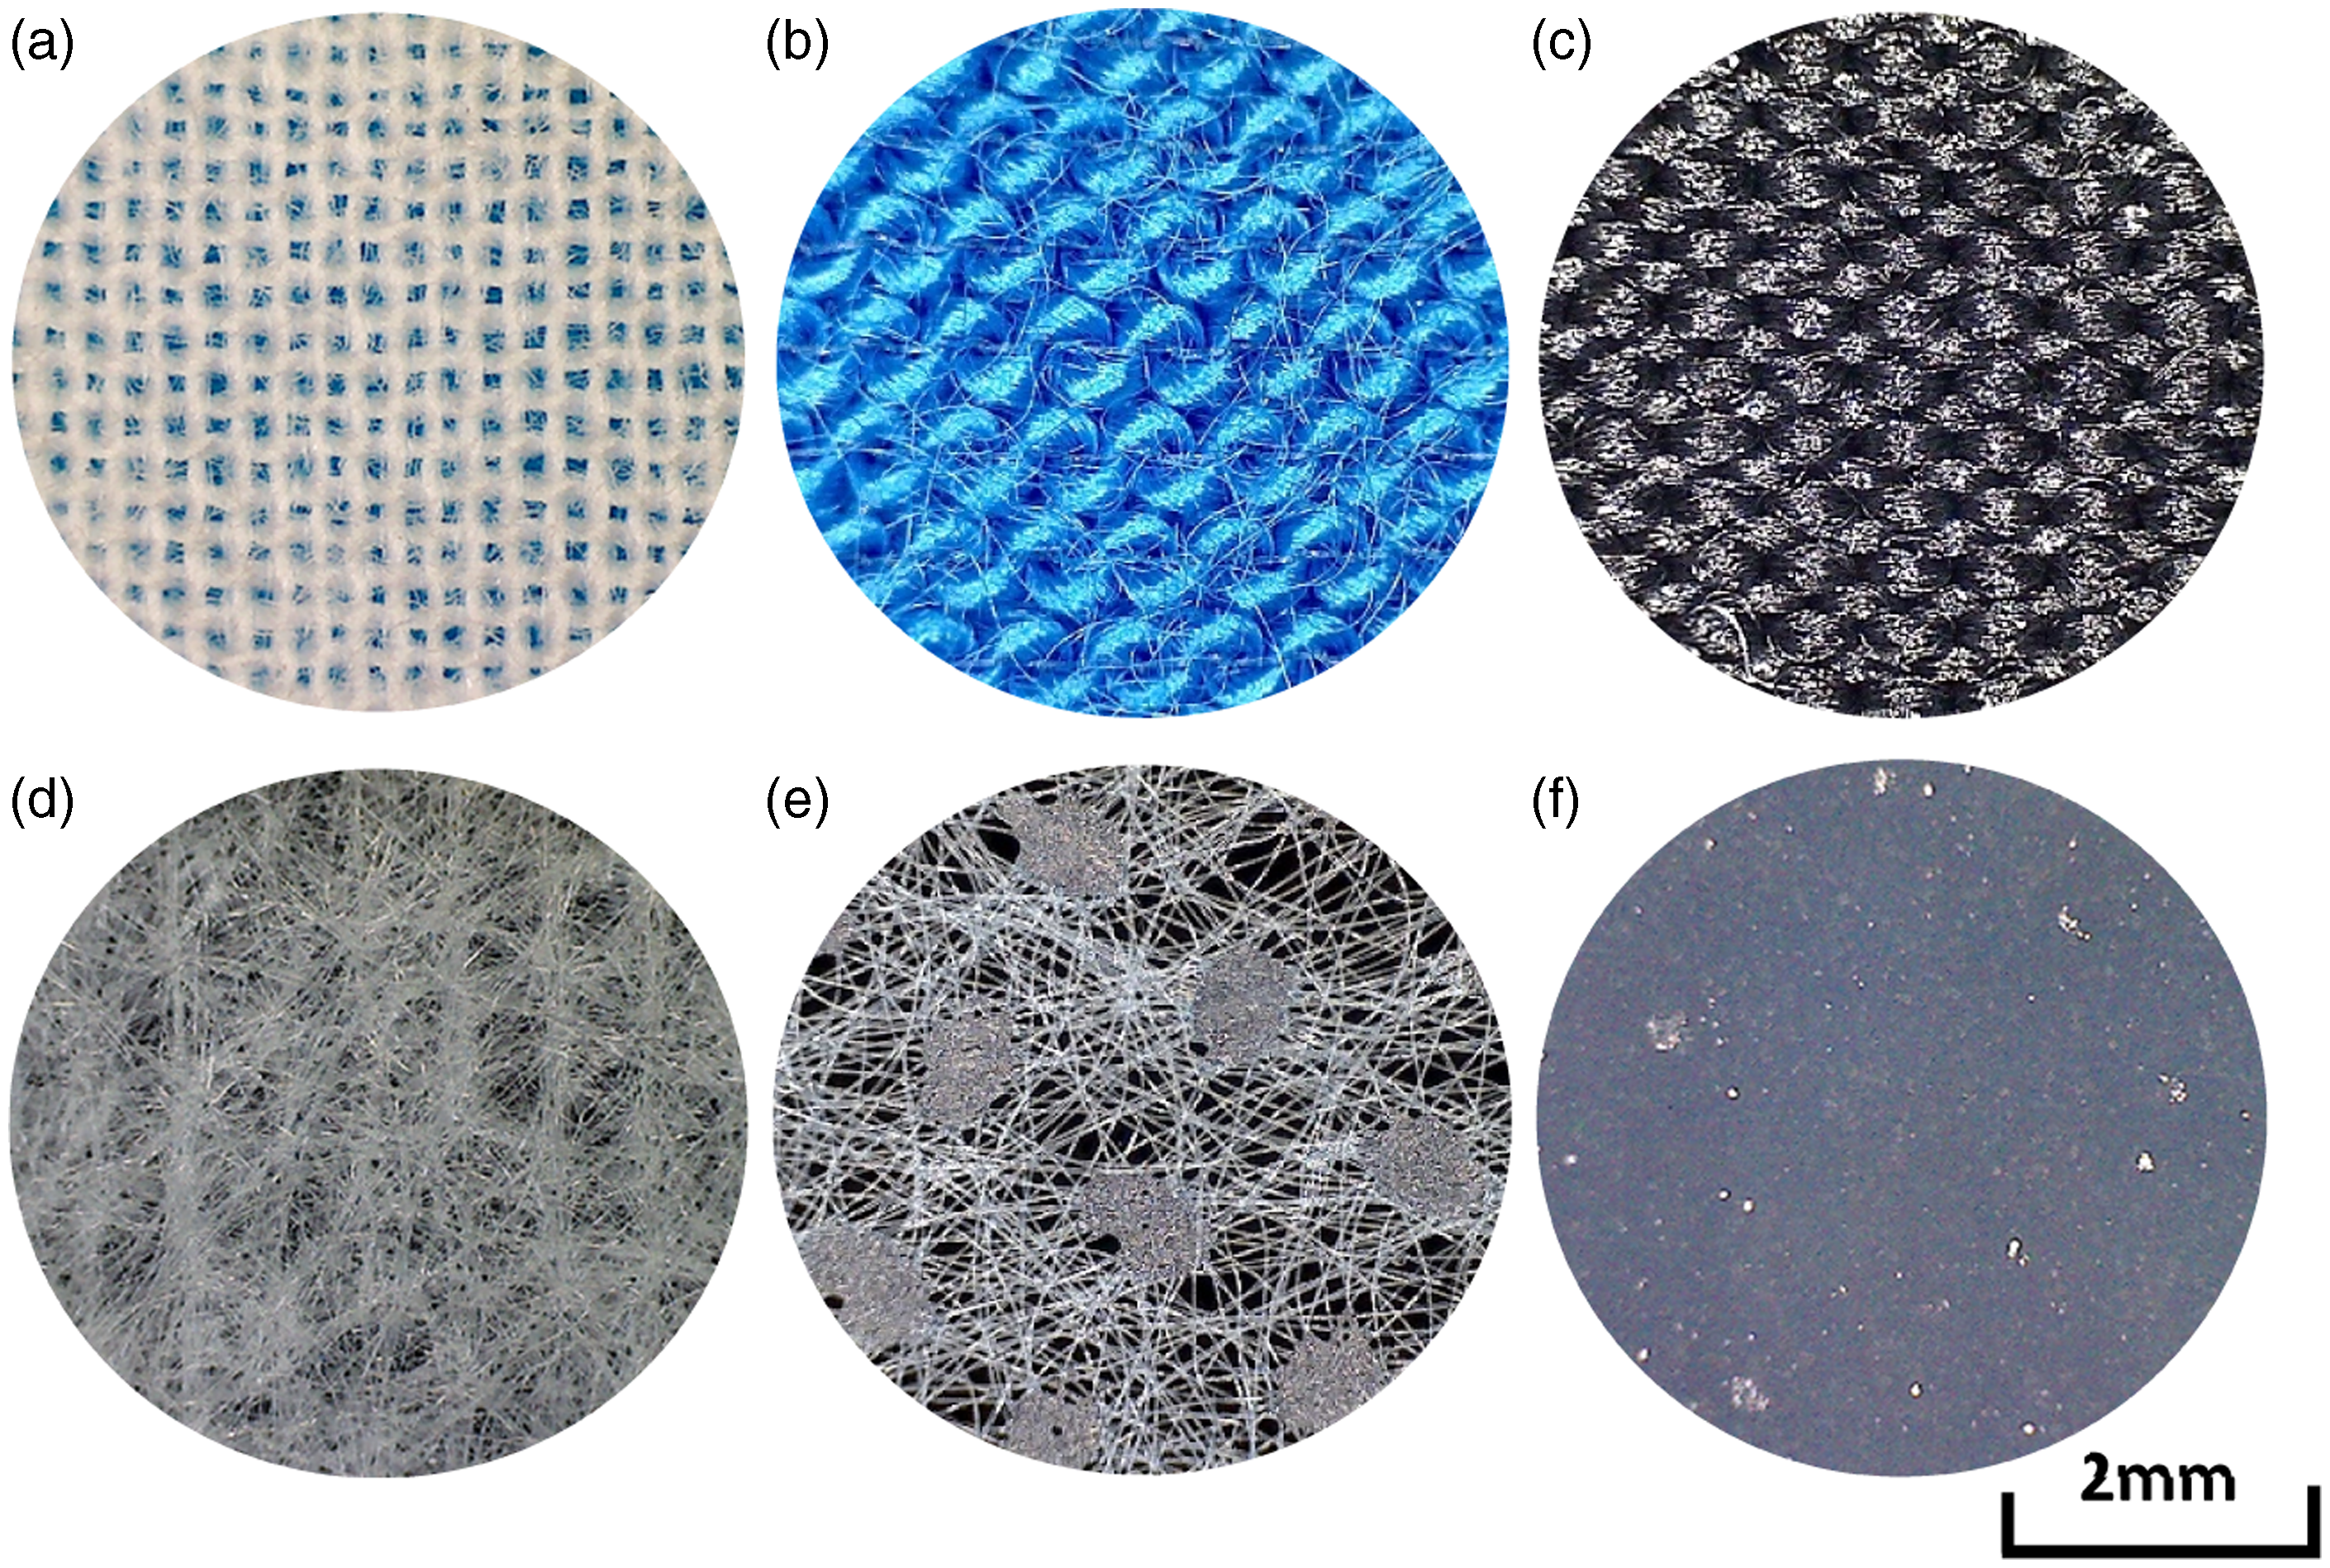
Testing method
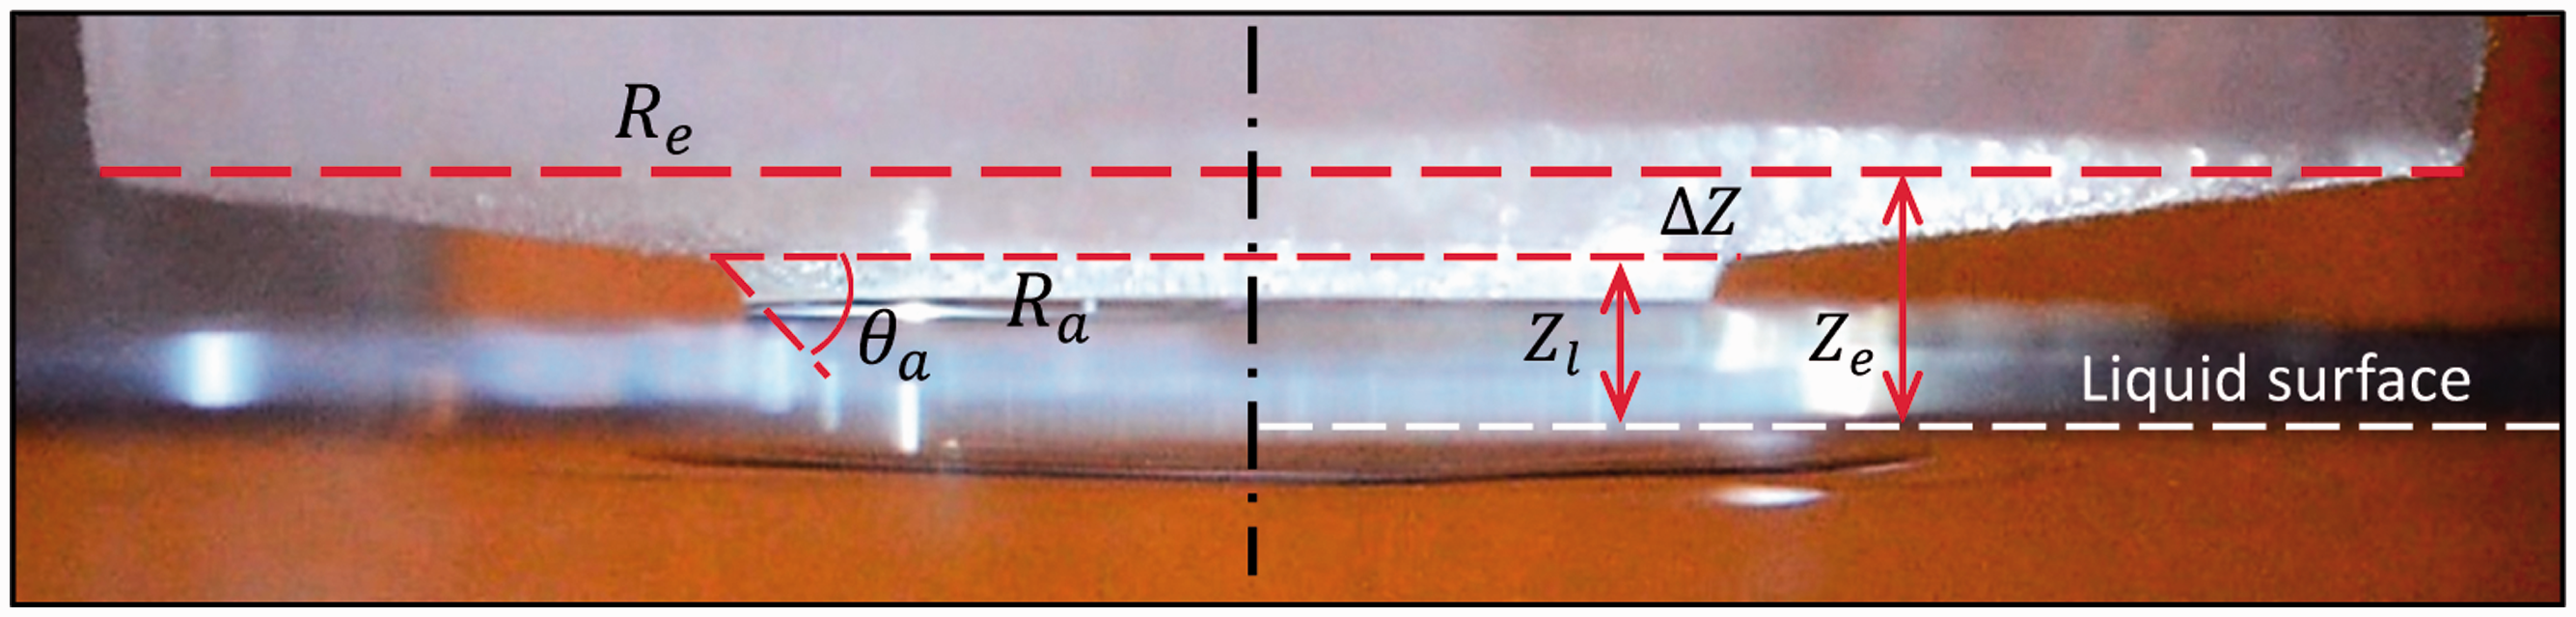
In order to test the adhesion force and evaluate the configurations of the liquid bridge and the fabric, an improved prototype (see Figure 3) was developed based on the method proposed in our previous study,20–22 with more visual information. In this testing method, the fabric was circumferentially clamped by a fabric holder and then tilted with an angle of 5° and immersed into the liquid at 3 mm below the liquid level. Afterwards, the fabric was adjusted to the horizontal position and started to ascend at a constant speed. The descending and ascending speed could be regulated as needed. As the fabric emerged from the liquid surface, a liquid bridge formed between the fabric sample and the liquid. The configuration changes of the liquid bridge and the fabric were monitored and recorded simultaneously by Camera I on the side with the frame rate of 25 fps and a resolution of 1280 × 720 ppi. From the image of each frame (see Figure 4), the average receding angle Testing system for adhesion force measurement. One of the frames from the video of Material A recorded by Camera I.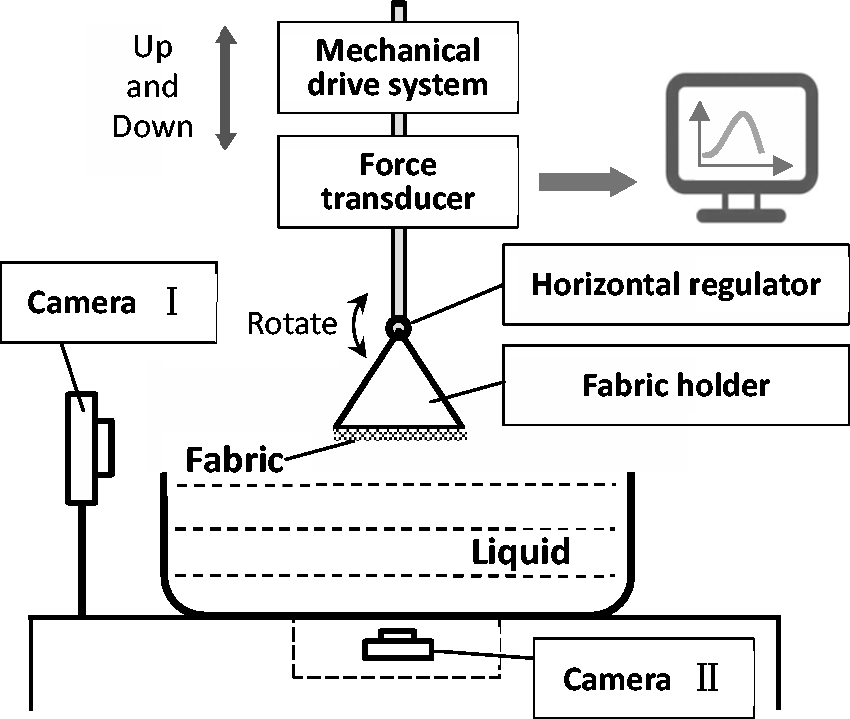
Testing conditions, such as separating speed, pre-tension, wetting duration and liquid temperature, had effects on the results 21 and therefore were carefully controlled during the test. A fabric holder of 70 mm diameter was adopted. Circumferential pre-tension of 1372 mN was applied to the fabric. Descending and ascending speeds were both 50 mm/min and wetting duration was 3 min. The temperatures of the air and the liquid (purified water) were 20 ± 2℃ and the relative humidity was 65 ± 5%.
With this testing method, a typical peak-shaped curve of the adhesion force F versus time (see the solid lines in Figure 5) could be generated, if the ascending speed of the fabric holder remained small and constant. If the ascending was paused randomly, the liquid bridge under the fabric would hold still, with an almost stable volume V and hence an almost stable gravity G, until the ascending continued. As a result, a plateau would occur upon each pause on the curve (see the bubbles in Figure 5). The adhesion forces at a certain ascending height with or without random pauses were found with no significant difference. Based on this phenomenon, it is reasonable to assume that the adhesion force F applied to the liquid bridge over the fabric–liquid interface could be approximately equal to the weight G of the liquid bridge under the fabric. If the velocity of the fabric is low and constant, the separation of the fabric from the liquid can be regarded as a quasi-static process and the influence of the viscosity of the liquid could be negligible.
The experimental curves of a fabric (Material B) and a membrane (Material F) tested with a constant ascending speed or with random pauses during the separating process.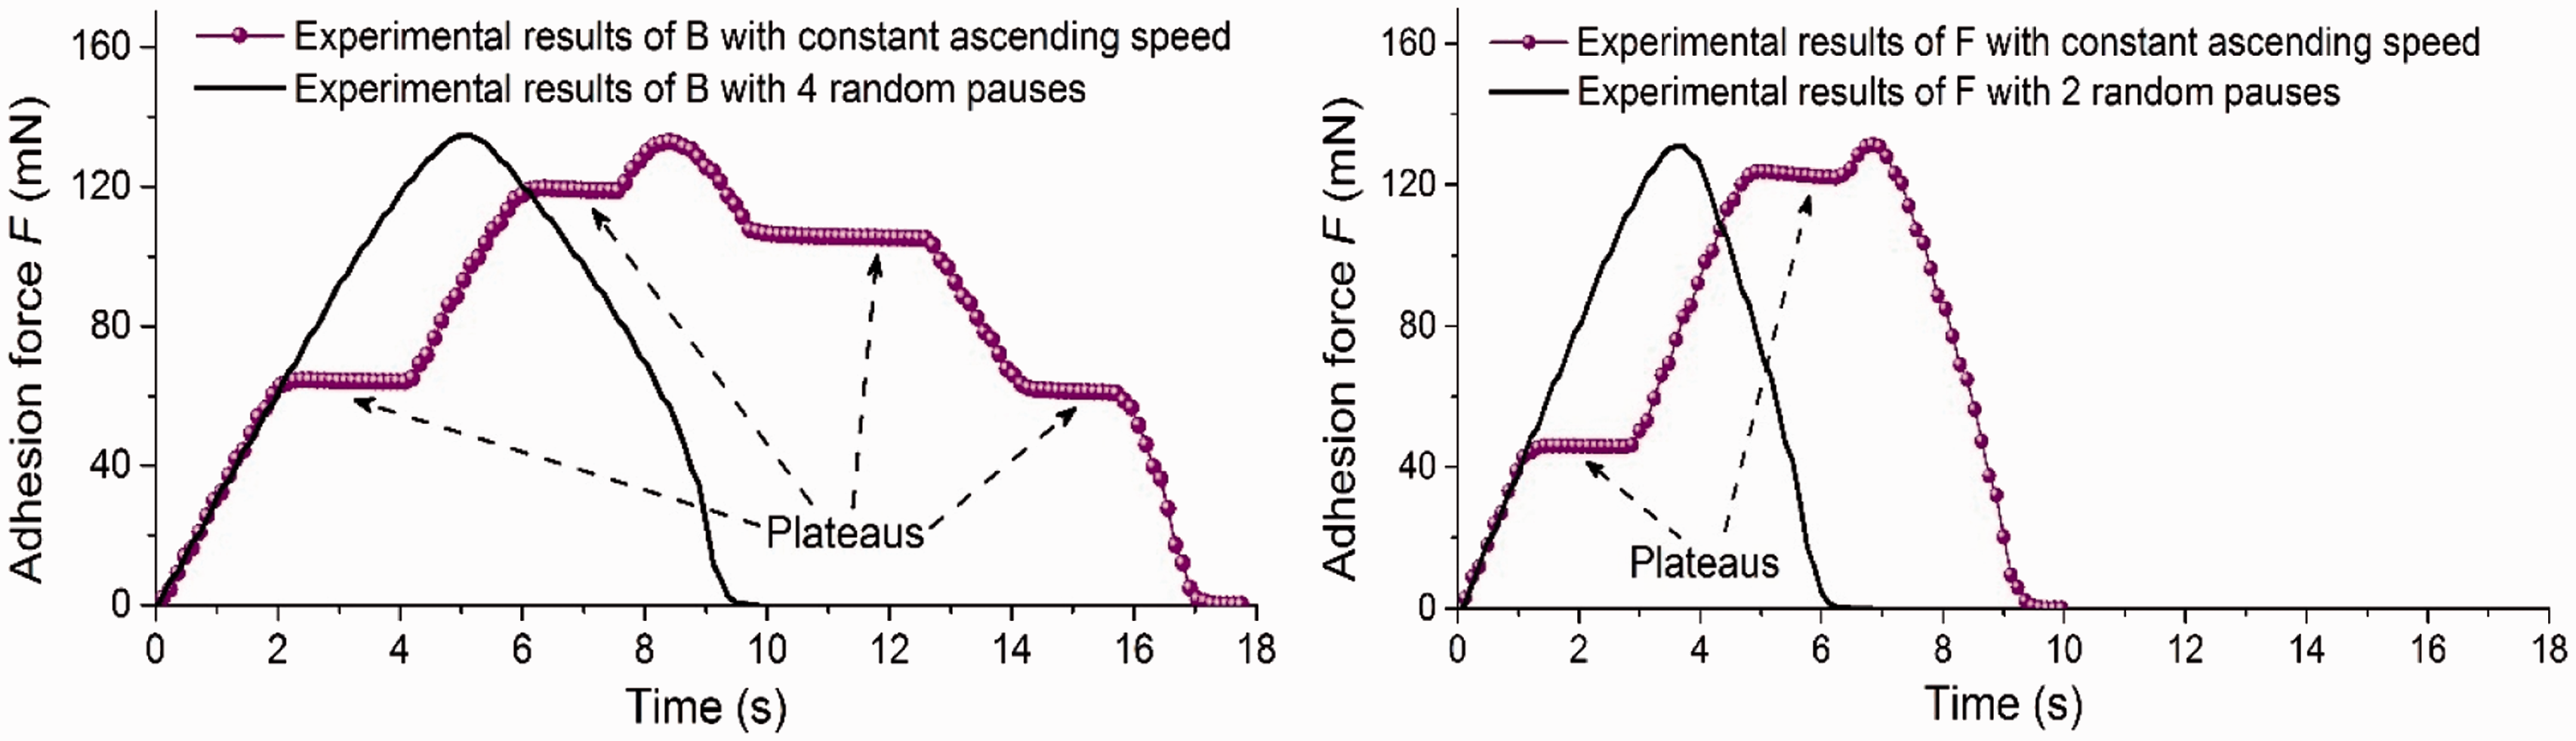
Theoretical modeling
A fabric–liquid system (see Figure 6) consists of a piece of fabric, a large volume of low-viscosity liquid beneath and a liquid bridge between them. In this system, as derived above, the weight G of the liquid that has been pulled up in the liquid bridge applies to the fabric through the adhesion over the fabric–liquid interface
The geometric relationships in the fabric–liquid system.
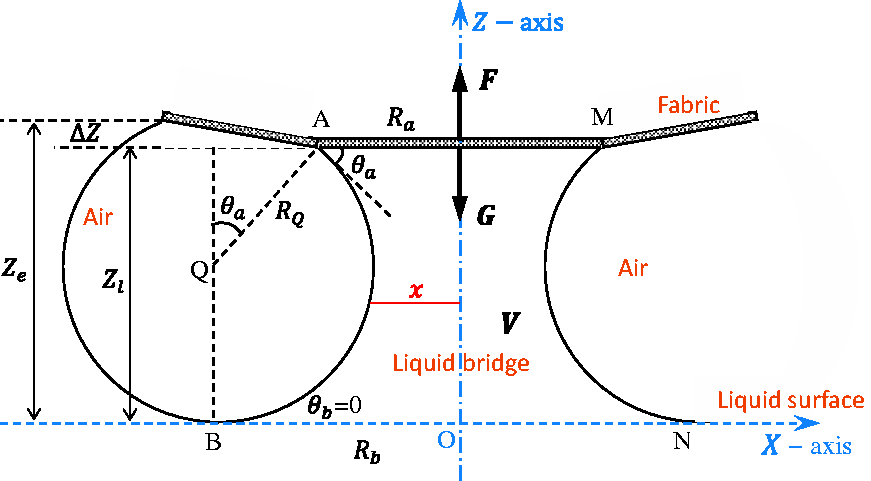
In the literature the meridional profile of the liquid–vapor interface is often modeled by an arc of a circle,20,23–28 which has uniform meridional curvature. In Figure 6, the profile is projected on the coordinate plane XOZ. The expression of circular Q is 

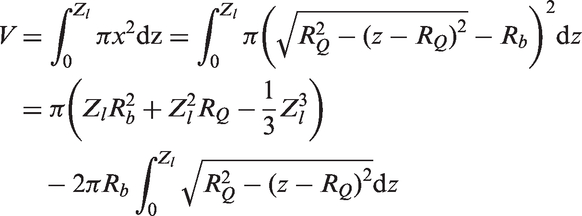
The volume V of the liquid bridge can be regarded as the volume of a solid revolution generated by rotating AMBN about the Z-axis
Set 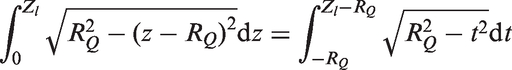
Set 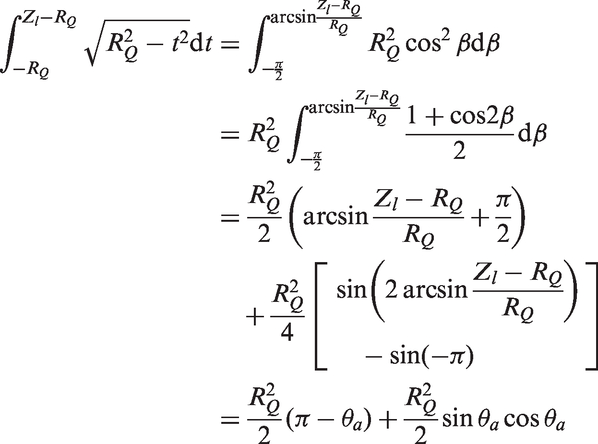
Hence
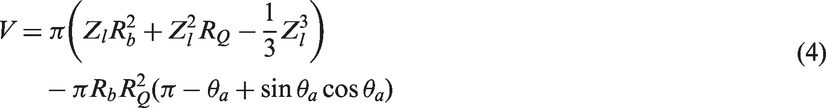
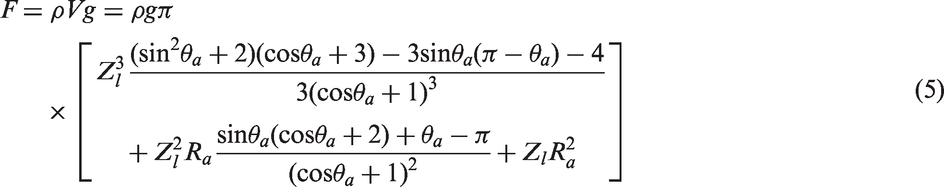
Putting equations (2)–(4) into equation (1), the expression of the adhesion force F is derived as follows
Results and discussion
The average receding angle The theoretical and experimental curves of the adhesion force F versus time for different Materials A–F.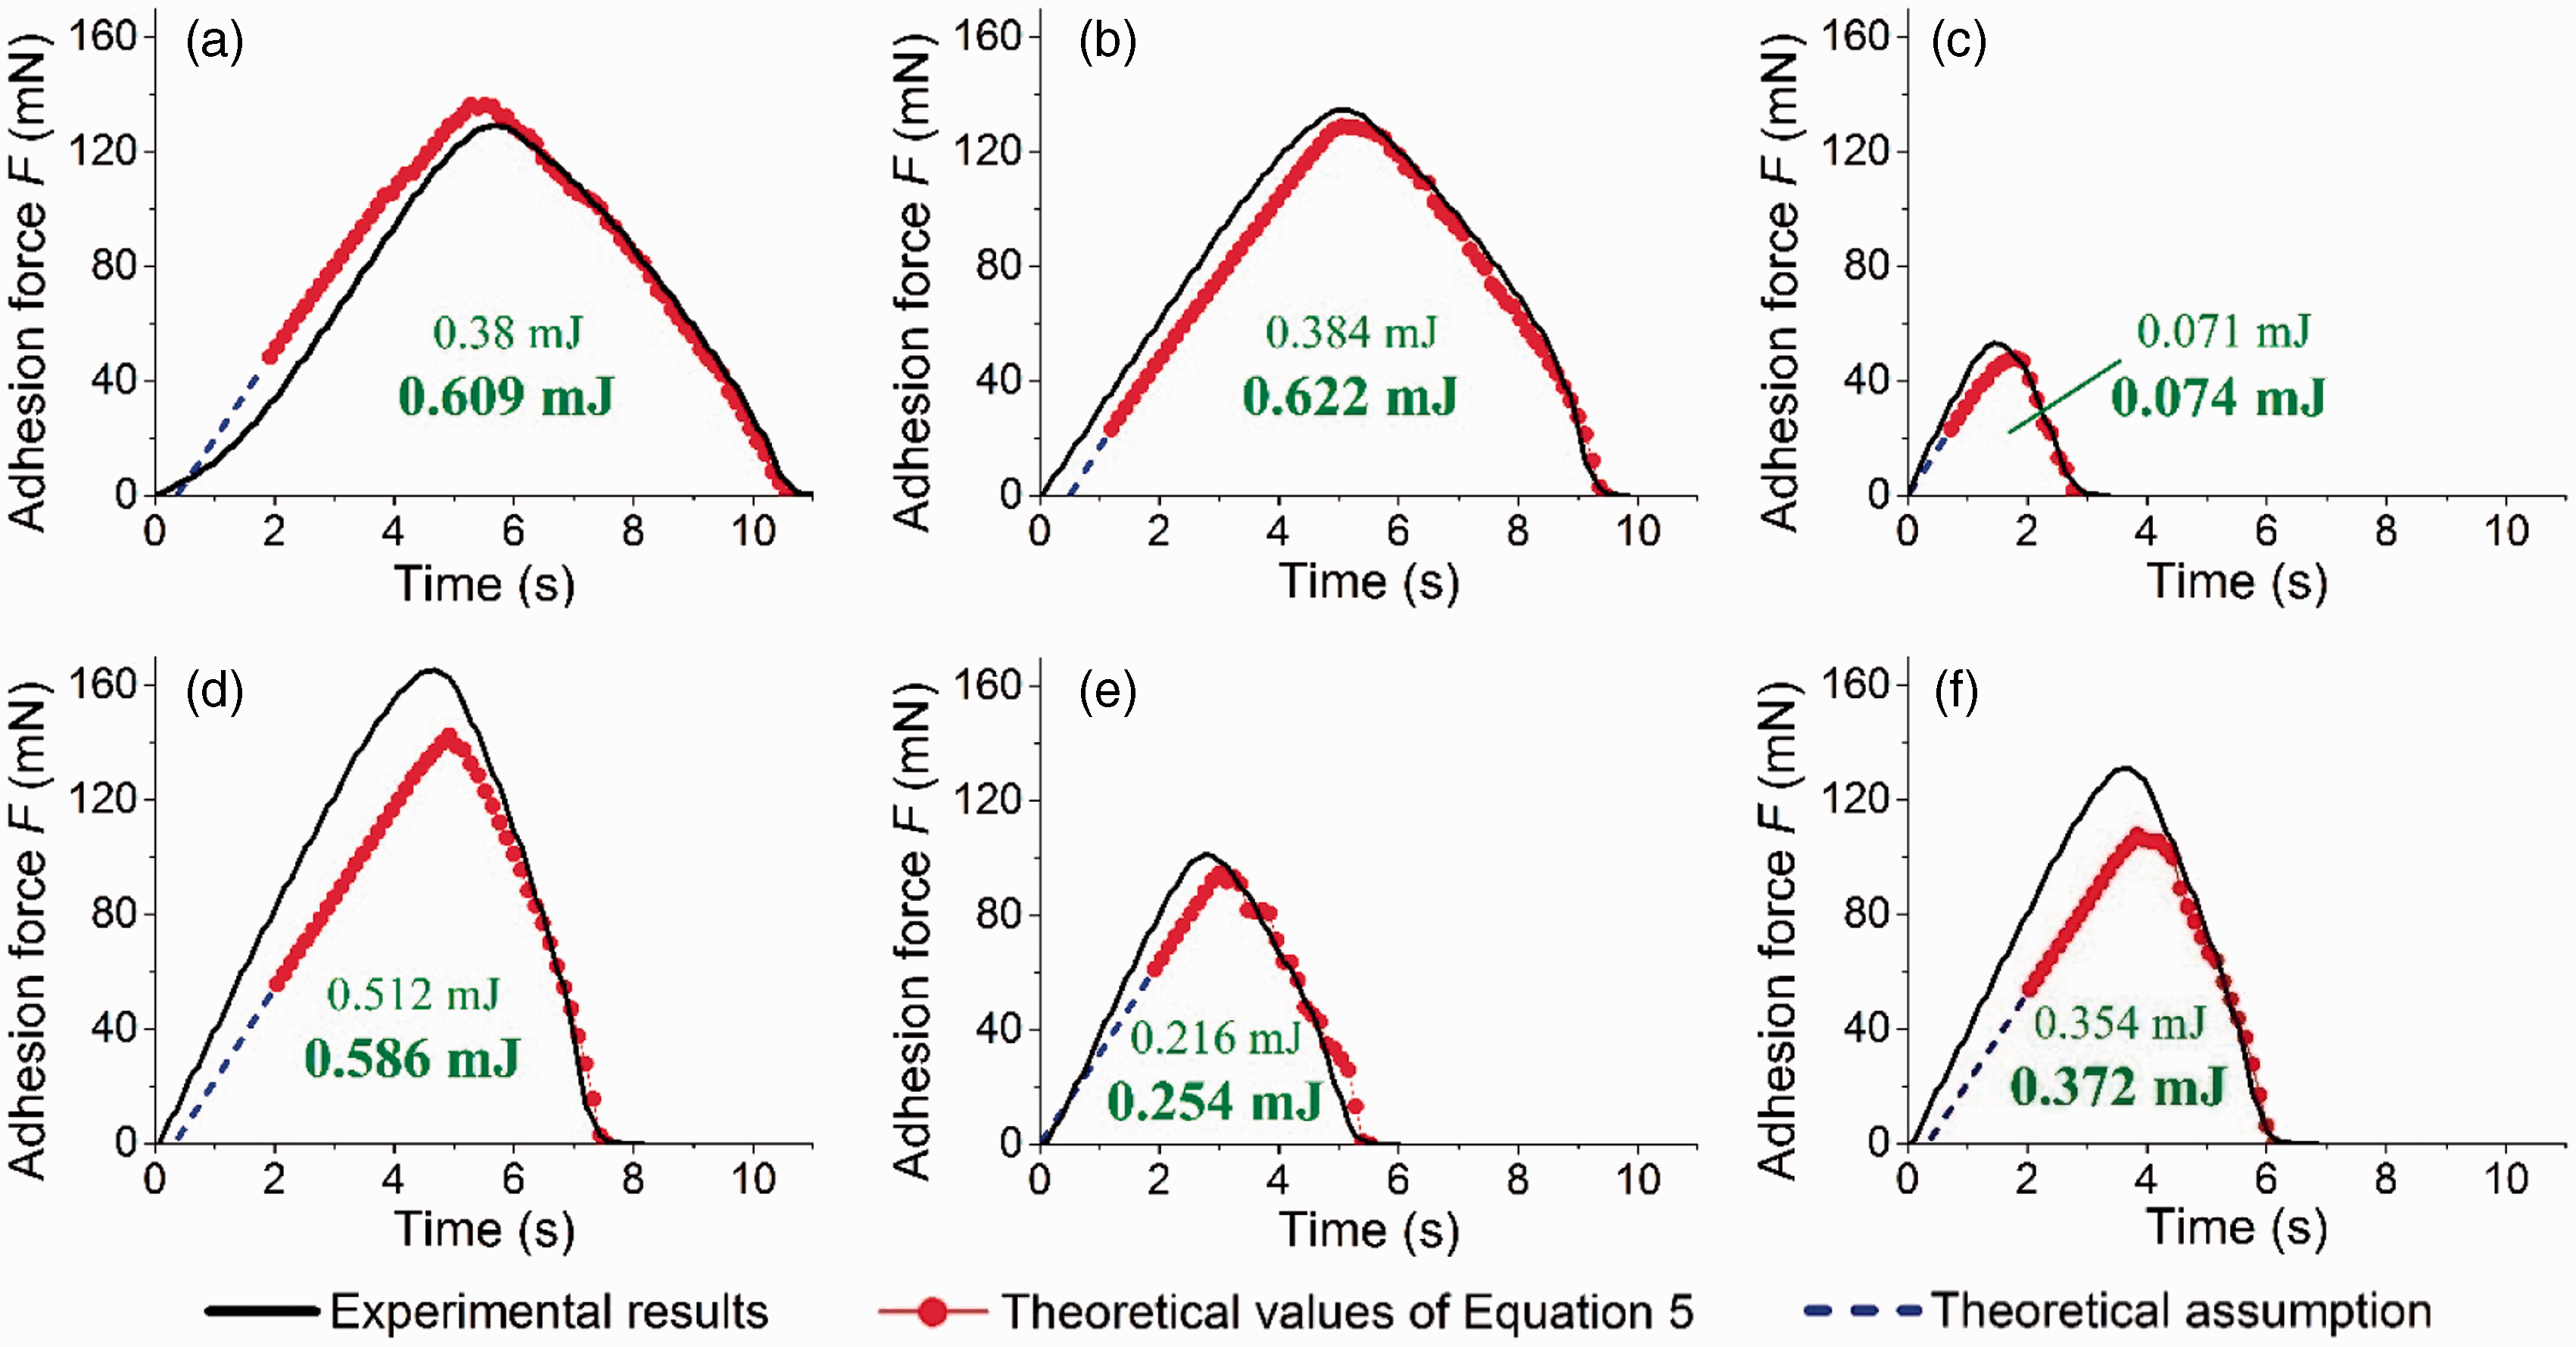
Comparison between the curves derived from different materials
The curves of woven, knitted and non-woven fabrics and the silicon membrane in Figure 7 differ from one another. The more hydrophobic (with larger receding angles) Materials C and E could only lift up liquid bridges with smaller volumes such that their curves had smaller maximum values of adhesion force and also shorter durations. As a result, the work needed to pull the liquid bridge and to separate the material from water was small. Among the more hydrophilic materials, stiffer Material D had a larger maximum adhesion force (165.41 mN), while more flexible Material B had a longer duration of adhesion (9.84 s). As small as the adhesion force might seem to be, the skin can certainly feel the adhesion force and other relevant sensations as it is our largest sensory organ, transmitting pain, temperature, itch and touch information to the central nervous system 29 and is sensitive to mechanical stimuli with von Frey thresholds as low as 0.07 mN. 30 In terms of energy consumption, Material B also had the largest total work of 0.622 mJ, including 0.384 mJ for lifting the liquid bridge and 0.238 mJ for deformation of the material itself. The work carried out by the adhesion force was calculated as a summation of all the products of instant experimental adhesion forces and the small distances travelled within every 3/25 s by the fabric holder (total work) and by the top of the liquid bridge (the work for lifting the liquid bridge). The difference of the total work and the work for lifting the liquid bridge was consumed in stretching the fabric. Less deformable materials usually absorb less energy during their deformation in the separation process. Material D only absorbed 0.074 mJ during its deformation so that the total work of separation (0.586 mJ) was still smaller than that of Material B, even with a much larger work (0.512 mJ) for lifting a larger volume of the liquid bridge.
Some materials behave very differently when wet compared with their dry state. Material A swelled and yielded easily with plastic deformation after immersed into water. It became rigid and arch-shaped and had to spend more time before the lowest spot of the material was fully detached from the water (see Figure 8). In addition, the maximum adhesion force for Material A was also large. As a result, fabrics made of cotton, viscose rayon and silk in their usual structures are normally sticky and uncomfortable when they get wet. Material B, also constructed from hydrophilic cellulose fibers, did not arch much with the existence of elastomeric spandex fibers.
Images of fabric surfaces that have just emerged and detached from water. Arch-shaped (a) cotton, (b) rayon, (c) silk fabric surface and non-arch-shaped (d) Material B.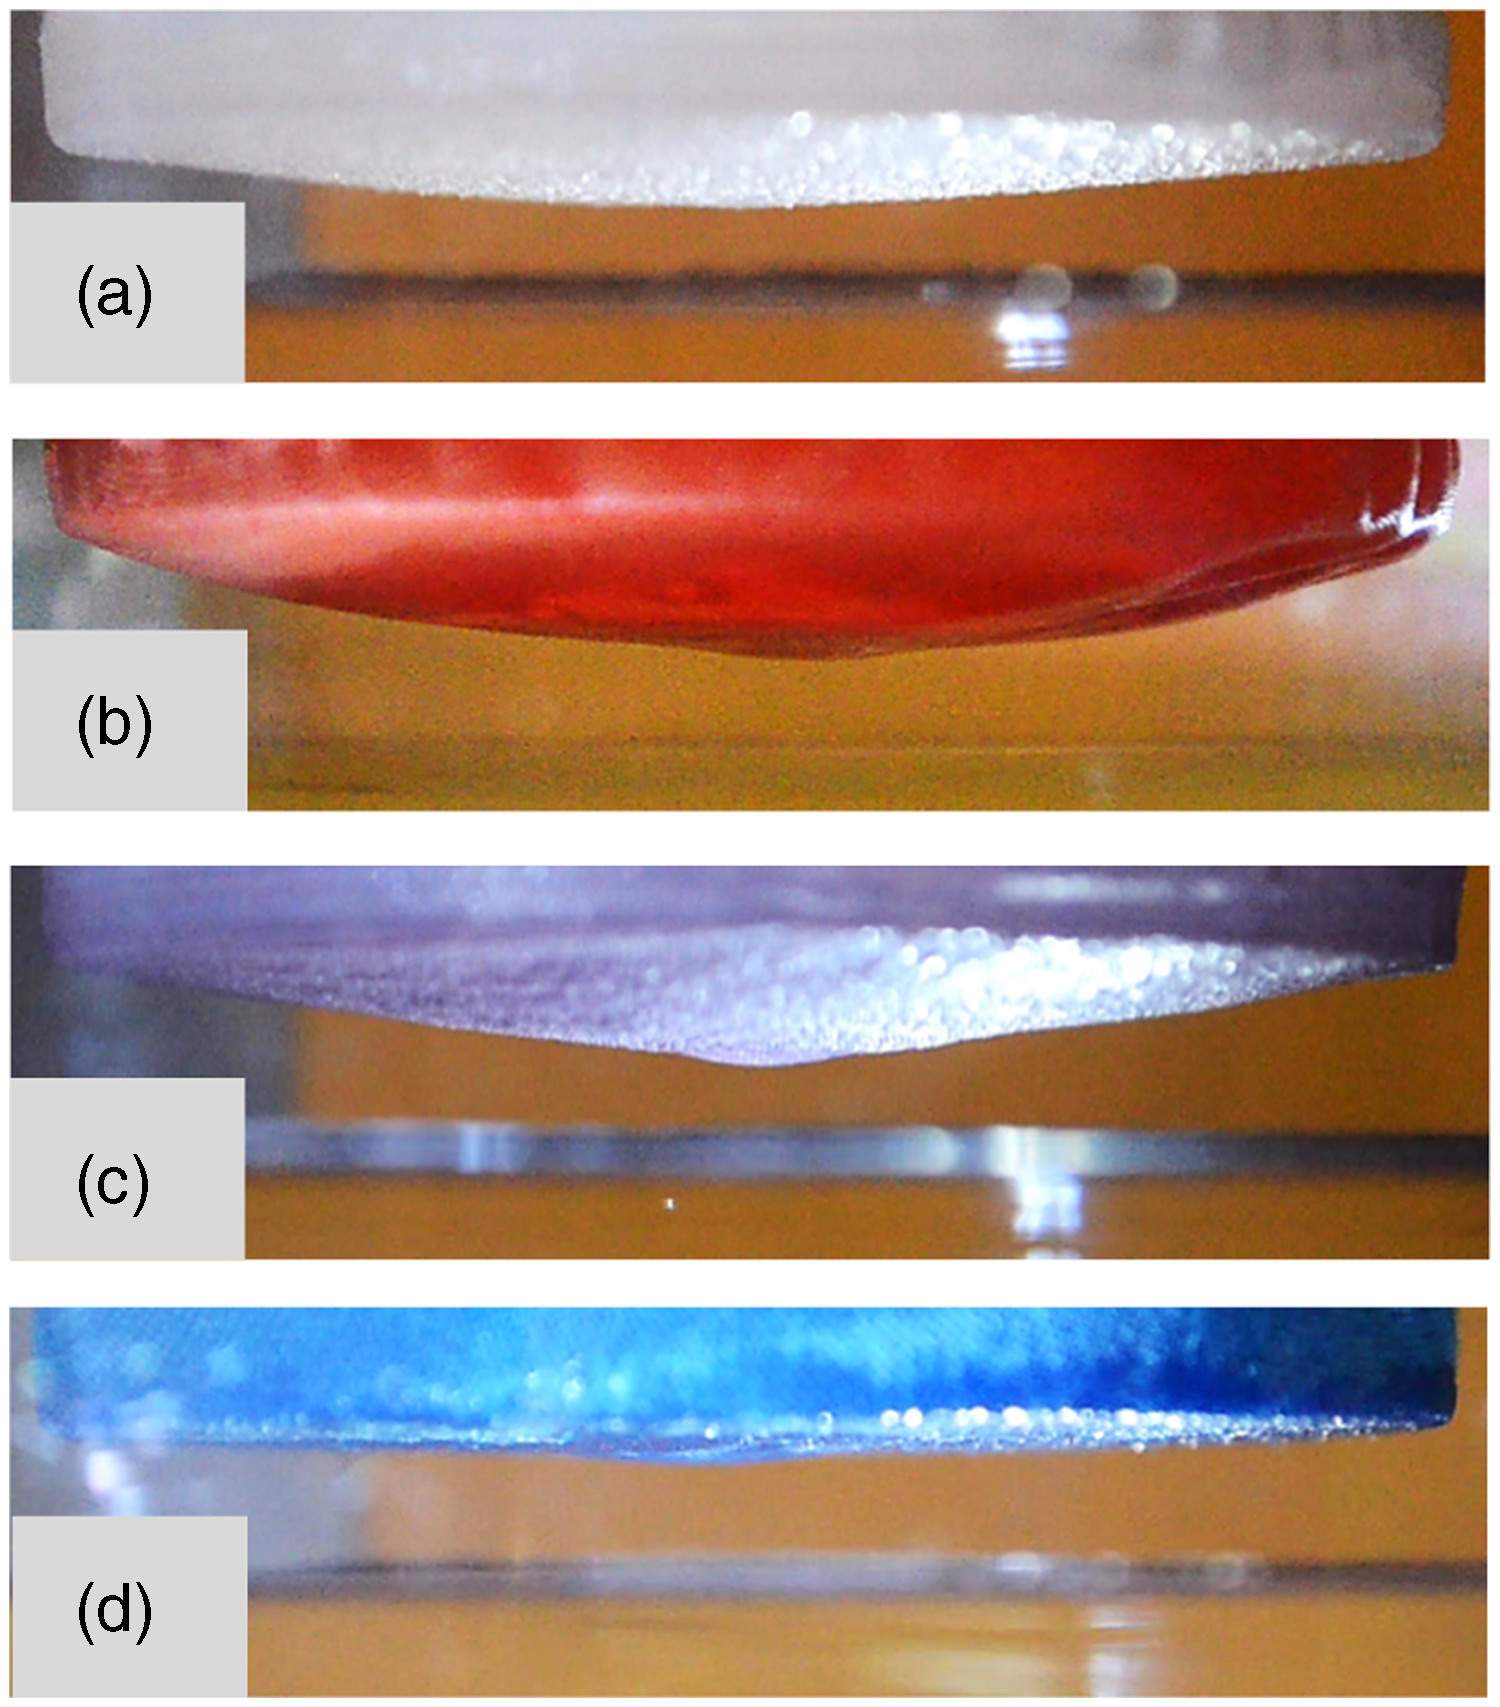
From the way that the curves of various materials differ from one another, we could see that this testing method is capable of showing the outcome of many factors that affect the adhesion property of a material to water. By comparing the maximum adhesion forces, the durations of adhesion and the work of separation, it is possible to tell which material is less adhesive to the liquid, resulting in less adhesiveness to the skin regardless of varied skin conditions, and hence is more comfortable when it gets wet.
Comparison between the theoretical and the experimental curves
The theoretical curves calculated from the weight of the liquid bridge are in reasonably good agreement with the experimental ones in both stages: Stage 1 (pulling up) and Stage 2 (separating). The descending parts of the curves fit even better. In Stage 1, there could be a meniscus edge effect of a small amount of water, which was not included in the liquid bridge described by equation (5), climbing up the sidewall of the material when the border of the fabric–liquid interface was near the edge of the clamped fabric. During Stage 2, the receding angle (a) A meniscus edge effect of a small amount of water climbing up the sidewall of the material. (b) The apparent receding angle 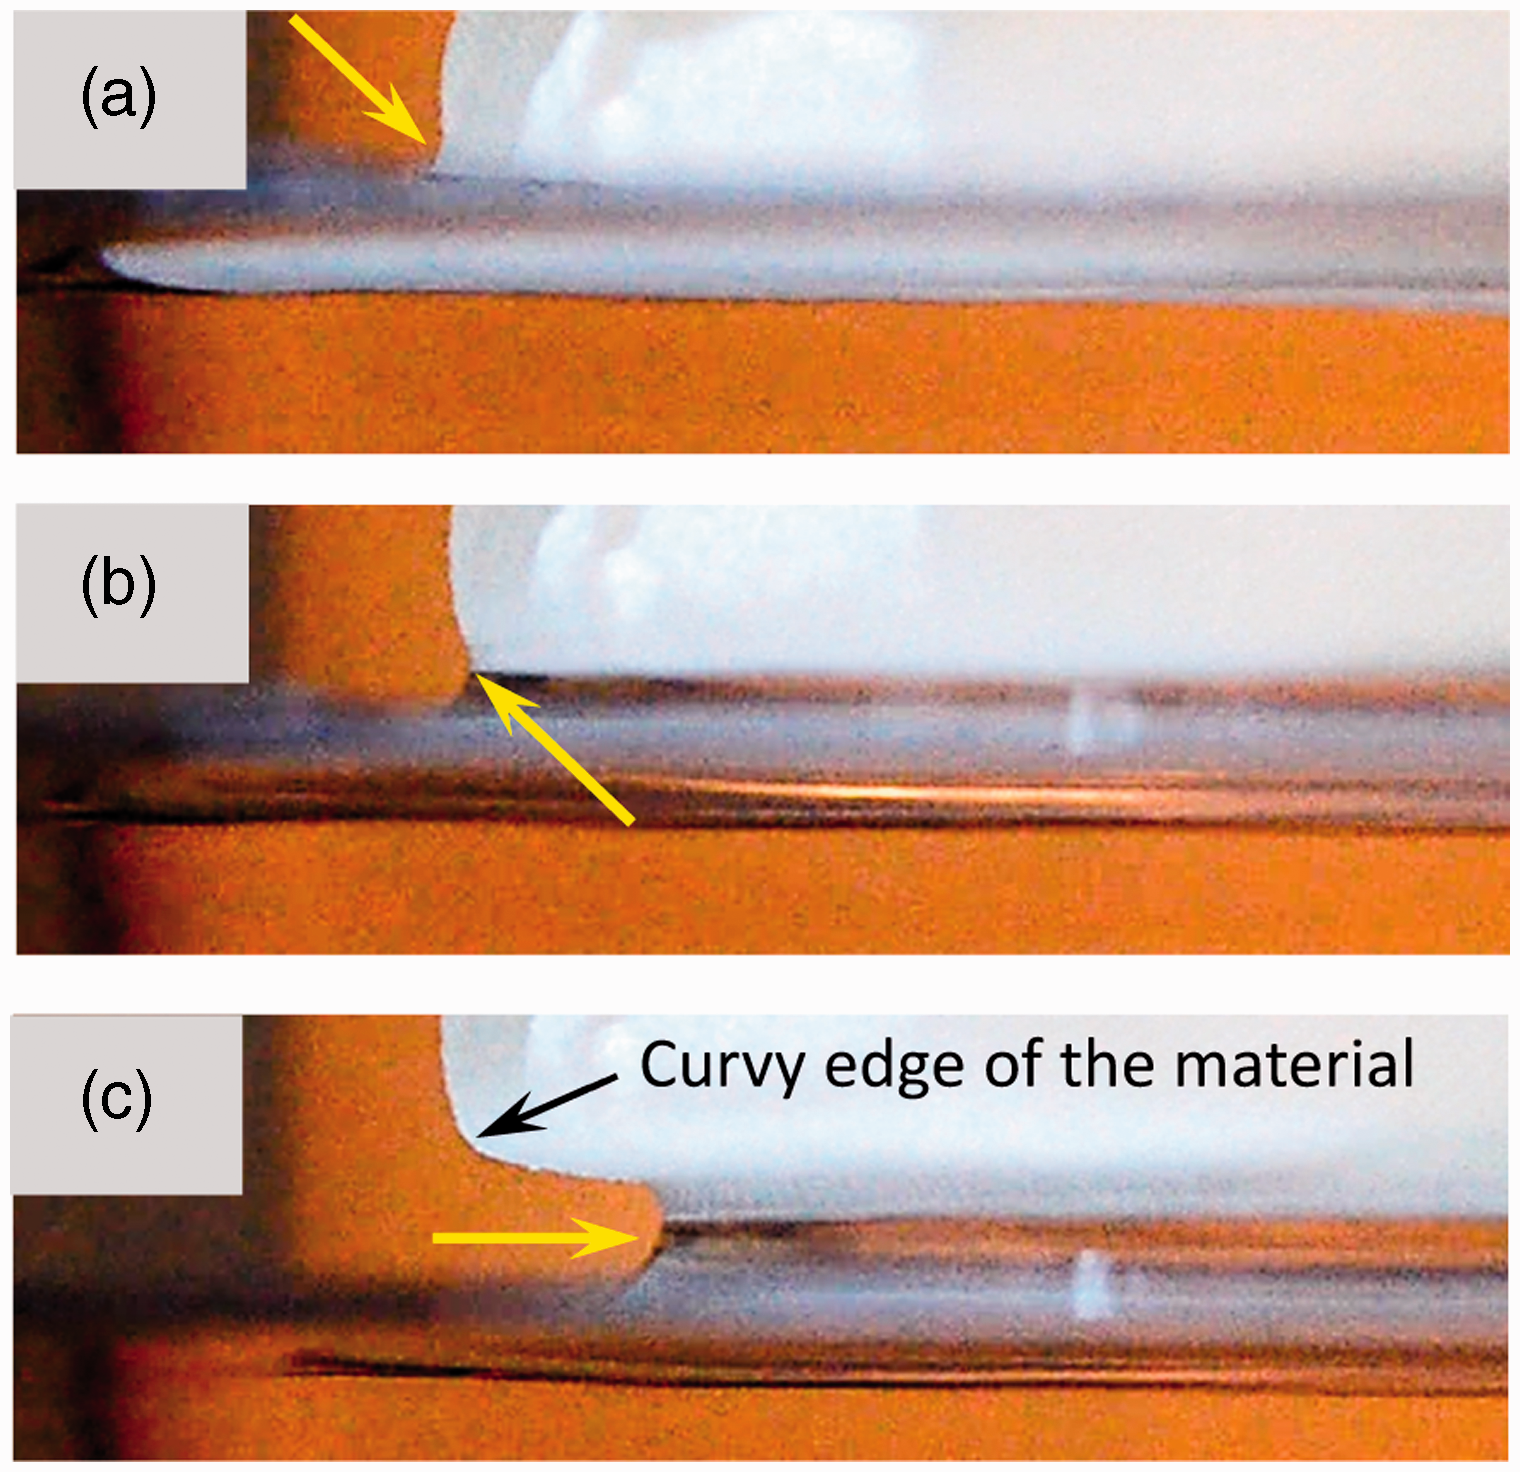
The initial sections of the theoretical curves were drawn using hypothetic values and were marked with dashed lines as it was difficult to decide the exact measurements at the beginning of the test when the material had just emerged from the water and the newly formed liquid bridge was blocked from the camera by the image of the water surface (see Figure 9). The experimental curves began from the origin of the coordinates as soon as the adhesion forces were detected. For hydrophilic materials, this started slightly before they entirely emerged from the water surface when the buoyancy was counteracted by the amount of water climbing up around the edge of the materials. That is why theoretical curves of hydrophilic materials deviate slightly from the origin of the coordinates.
For many ordinary materials, the circular top of the liquid bridge remained intact and its area narrowed smoothly during the separating process. However, for some materials, such as Materials C and E, with large fabric–liquid contact angles and rough surfaces, the top of the liquid bridge had zigzag and irregular borders (see Figure 10). The lower surfaces of the materials were not fully wetted. The border of the top of the liquid bridge shrank and jumped unsmoothly at places during the separation process, as not enough hydrophilic spots existed on the lower surface for the liquid to cling to. As a result, the theoretical curves of Materials C and E were also a little zigzag as the shape of the top border of the liquid bridge did not remain as a regular circle. With this type of surface, the volume of the liquid bridge pulled up by the material should be small, leading to a small adhesion force.
Images captured by Camera II from underneath: (a) circular and smooth top border of the liquid bridge of Material B; (b) zigzag and irregular top border of the liquid bridge of Material E.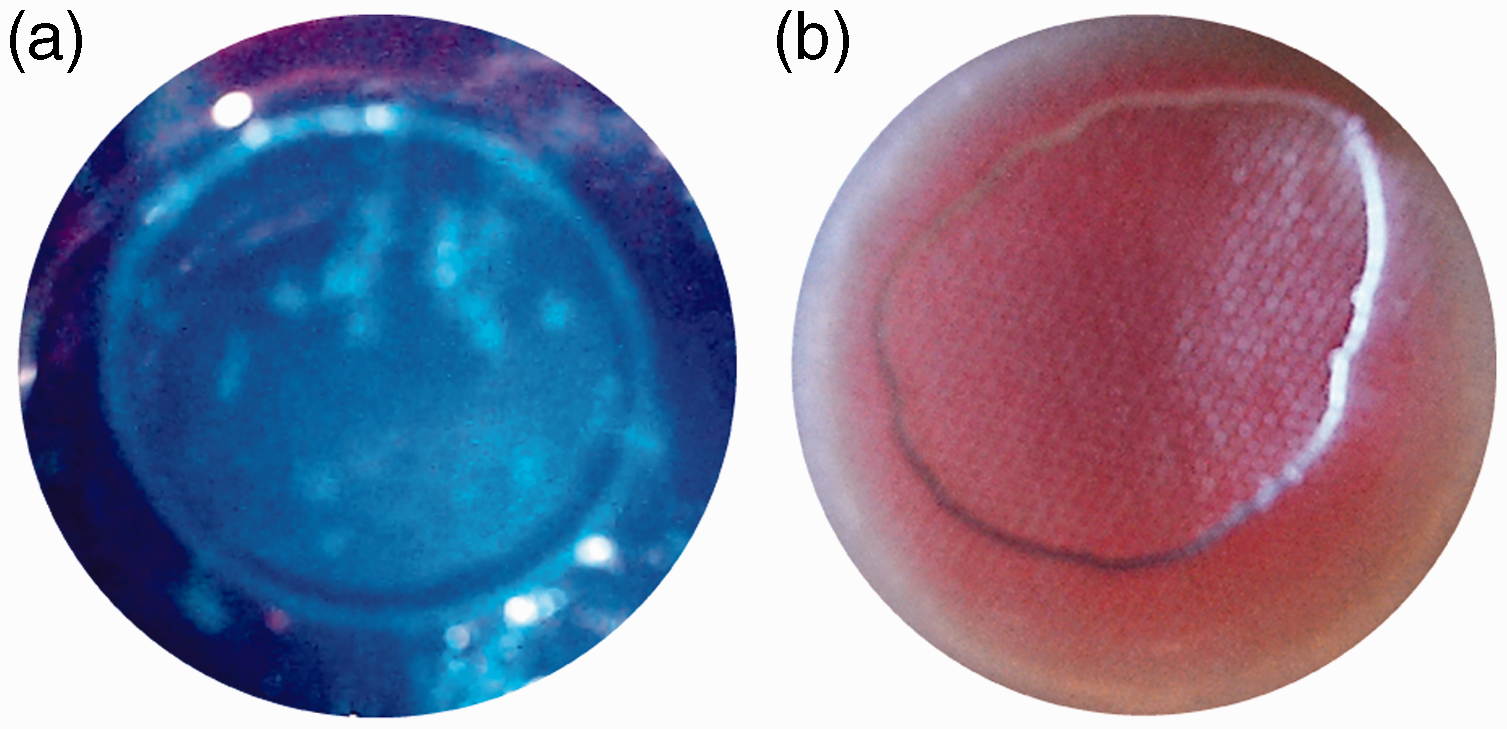
As can be seen from equation (5), any approach capable of reducing the volume of the liquid bridge is beneficial for minimizing the adhesion force. The reduction of radius Ra and height Zl of the liquid bridge leads to a smaller adhesion force. In other words, the factors playing important roles are the area of the fabric–liquid interface, the surface energy and the deformability of the fabric. As a result, the possible approaches for a fabric to reduce its adhesion force in the wet state may include altering surface morphology to a smaller fabric–liquid contact area, improving hydrophobicity and increasing deformability.
Improving the hydrophobicity of the material seems to be an easy way to reduce both the adhesion force and the duration of adhesion, such as in Materials C and E. However, it could also sacrifice the comfort of the material during the dry state and some of the hydrophobicity treatments are not so durable. Without changing the hydrophilicity of a material, increasing the deformability may reduce the maximum adhesion force as well. However, along with it comes a prolonged duration, which is even more uncomfortable since it makes the sticky material linger and hard to get rid of. Another approach is to alter the surface morphology by creating a special rough surface through constructing protrusions to a smooth material, which could reduce the area for the liquid to cling without changing the major characters of the original material. This could be fulfilled for textiles, for example, by altering yarn types (such as fancy yarns with abrupt changes in diameter) or fabric structures (such as fabric weaves with sculptured surface) or applying finishes (such as embossed finish, plastic dotting and tufted flocking) to the fabric.
Comparison between ordinary material and special material with protrusions
An example of a material with attached protrusions is presented in Figure 11.
(a) Material F with one silicon button stuck to the center of the surface. (b) Material F with seven stuck silicon buttons scattered evenly with central distances of 23.3 mm. (c) The illustration of the solid–liquid border of (b) in different separating periods. (1)–(3) The experimental images of three different border shapes of (c) taken from Camera II.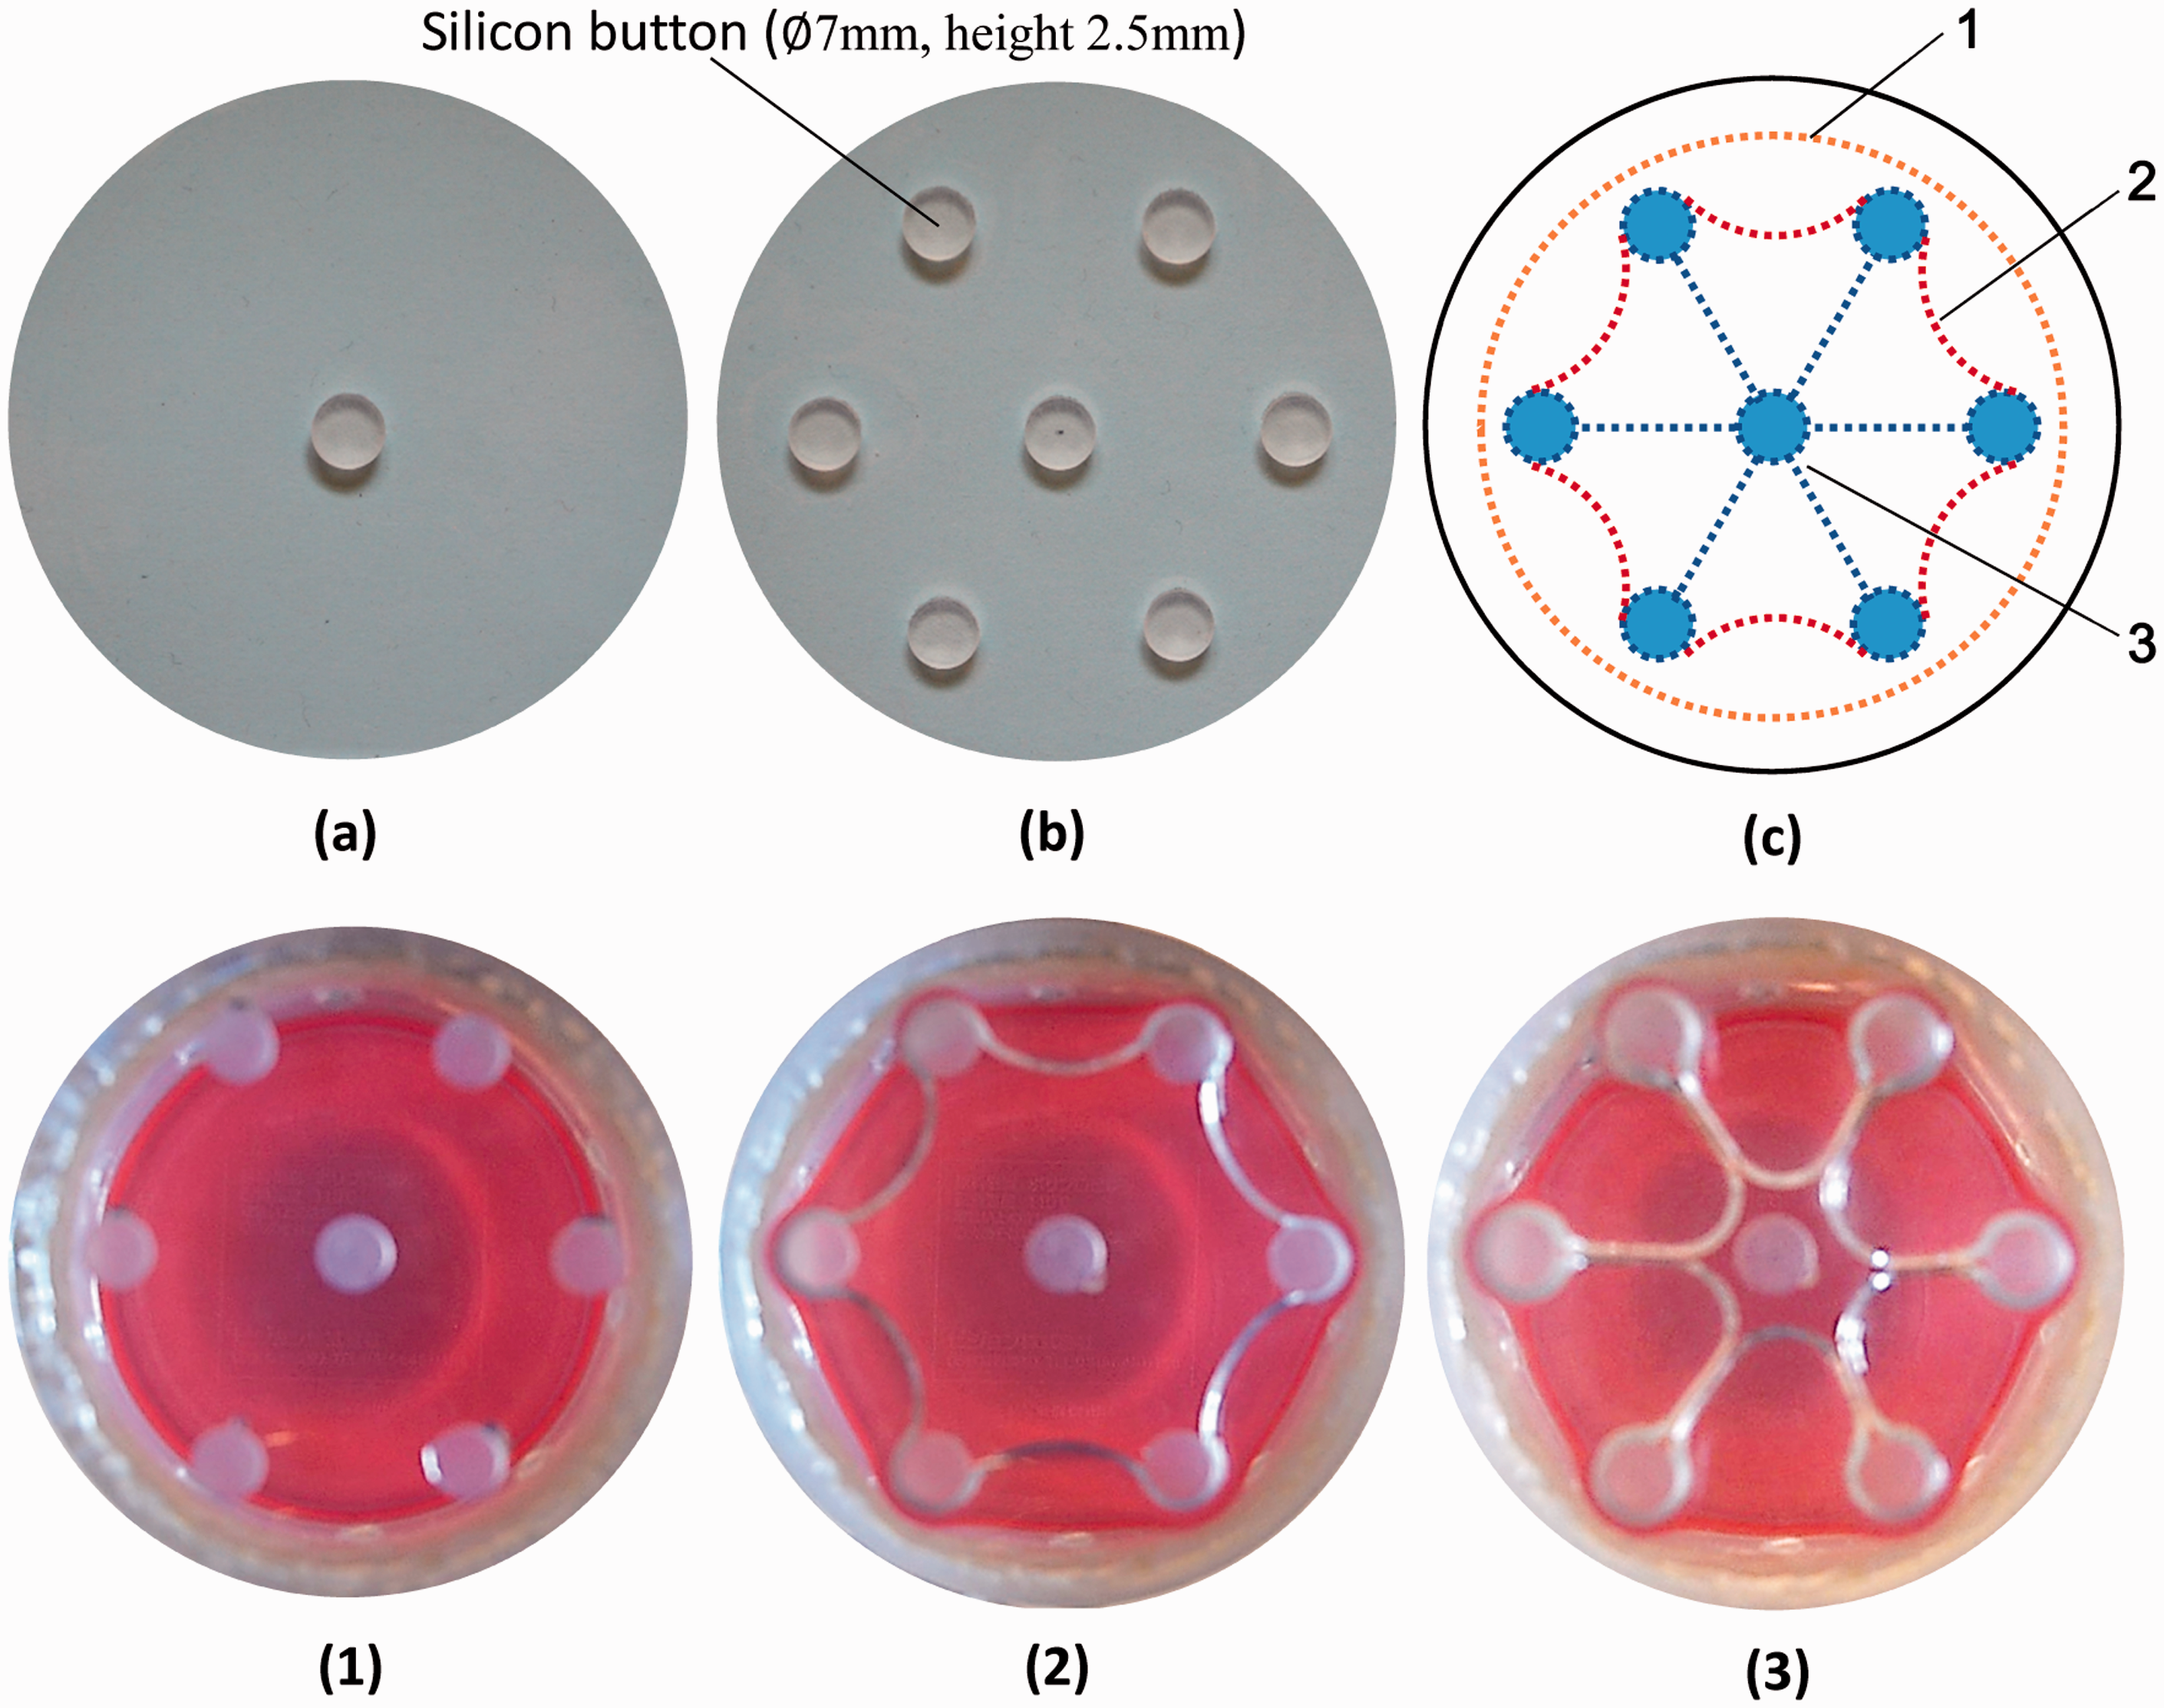
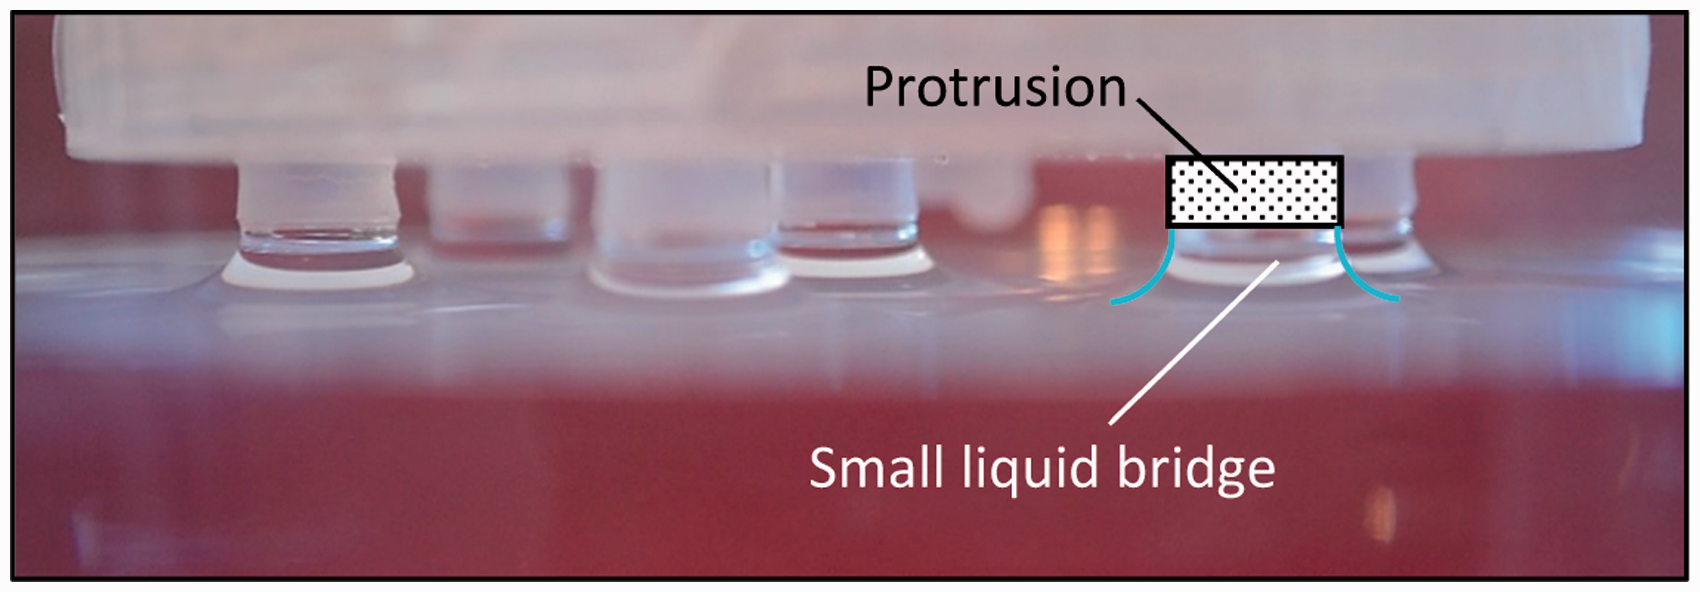
Compared with the experimental results for Material F in Figure 7, the curves in Figure 12 show different features. The maximum adhesion force reduced a little as the cylinder-shaped silicon button(s) occupied the room for water and diminished the total volume of the liquid bridge. For the silicon membrane with one button (Figure 12(a)), the adhesion force reached a plateau of about 2.3 mN after the departure of water from the planar surface of the membrane. As the ascending of the material continued, the boundary of the water bridge passed by the wall and the edge of the button and reached the lower planar surface of the button, the adhesion force started to decrease again until the breakdown of the small liquid bridge under the button (see the illustration in Figure 13). With an attached button, the theoretical values (see the stars in Figure 12, with the volume of the button excluded from the large liquid bridge before the button emerged from water, and Adhesion forces of Material F with (a) one silicon button and (b) seven silicon buttons. Image of several protrusions and small liquid bridges instead of one large liquid bridge under Material F with seven silicon buttons.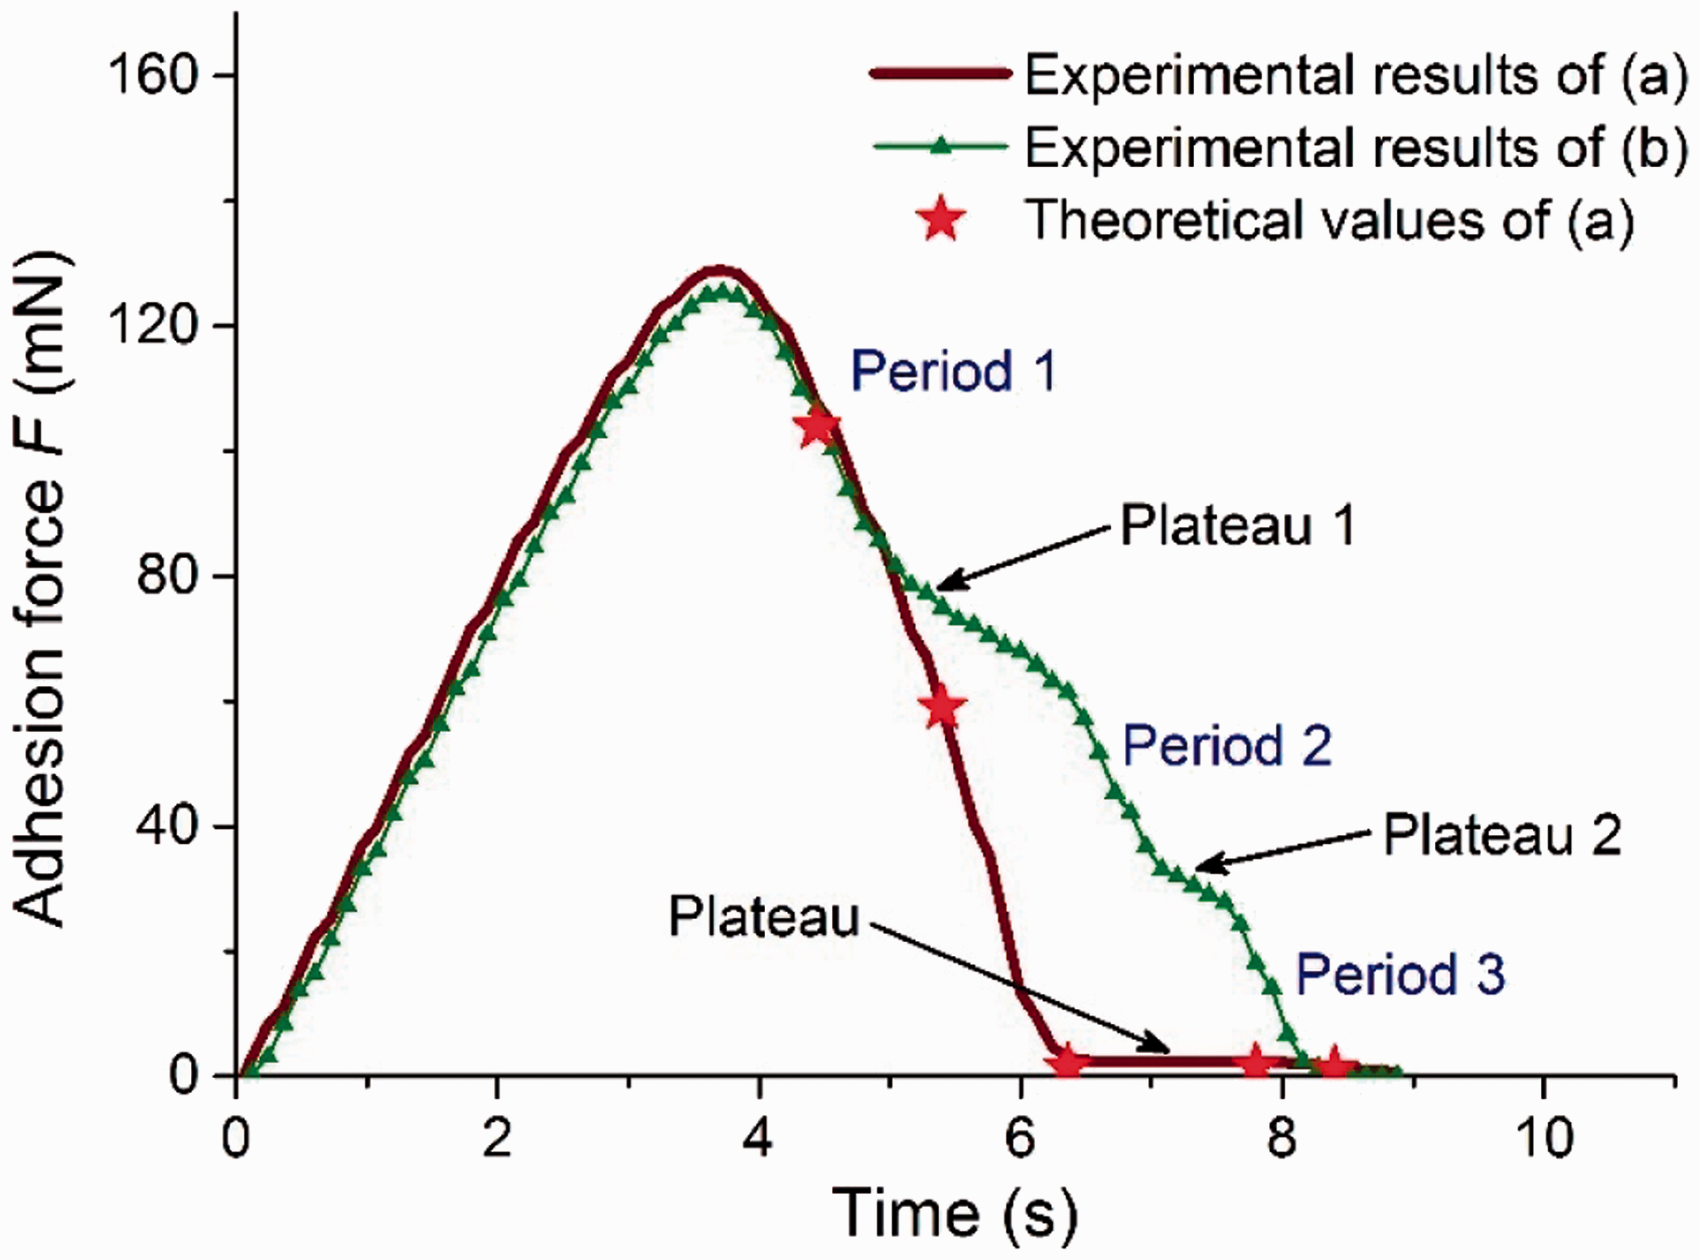
For the silicon membrane with seven buttons (Figure 12(b)), the descending part of the curve has two plateaus, dividing the stage of separation into three periods. The border of the solid–liquid interface in Period 1 was a circle (see the dashed line 1 in Figure 11(c)), similar to that of any other ordinary material. The curve of the experimental results in Figure 12(b) in this period was also similar to ordinary materials. When the border reached the six buttons in a circle, Period 2 began and Plateau 1 formed on the curve in Figure 12. Afterwards, the circular border turned into the shape of a flower with part of it surrounding the buttons and part of it continuing to narrow (see dashed line 2 in Figure 11(c)). At the end of Period 2, the adhesion force reached Plateau 2 at around 30.4 mN. Then Period 3 began with the border turned into seven separate small liquid bridges under the buttons and six water membranes formed between the button in the center and every other button (see dashed line 3 in Figure 11(c)). The weight of the small liquid bridges and the surface tension of the water membranes added together (2.3 mN × 7 + (23.3 mm – 7 mm) × 6 × 2 × 72.75 mN/m) were almost the exact value of 30.4 mN in Plateau 2. In Period 3, the small liquid bridges and the water membranes were stretched upwards and ruptured finally.
If similar structures with protrusions are applied on fabrics that adhere to human skin, the integrity of the liquid bridge could be broken and small liquid bridges under the protrusions would be generated (see Figure 13) as long as the protrusions in proper size and span can keep apart the rest of the inner surface of the fabric and the liquid surface on the skin. In this way, the water membranes mentioned above will not form either. In this case, without the existence of water membranes, only Period 3 could occur during the whole process. The volume of the liquid bridge and the maximum adhesion force will be reduced dramatically (e.g. maximum adhesion force of 2.3 mN for (a) and 16.1 mN for (b), much smaller than that of the hydrophobic Material C). Using hydrophobic materials as protrusions will reduce the maximum adhesion force even more and make it harder for the liquid surface to reach the fabric. Similarly, protrusion structures constructed on the fabric through other approaches may also have such a function in reducing the adhesion force without jeopardizing other good properties of the original fabric.
Conclusions
A theoretical model for predicting the adhesion force between a wet fabric and human skin was proposed based on the gravity of the liquid bridge under the fabric. The configuration and volume of the liquid bridge during the separation of the fabric from the liquid were studied. For both stages of pulling up and separating, the theoretical values fit the experimental results reasonably well using a testing system for adhesion force measurement. An underestimation in the first stage might occur due to the meniscus edge effect of a small amount of liquid climbing up the sidewall of the material, the instability of receding angles around the edge of the material and also the deviation of liquid bridge surface curvature. An overestimation could occur to the materials that yield easily with plastic deformation when they get wet. The testing results can distinguish the adhesion performance of different materials in the wet state. Constructing hydrophobic protrusions of proper size and span on the surface of the material can be a practical solution to largely diminishing the adhesion force while maintaining other properties of the original material.
Footnotes
Declaration of conflicting interests
The authors declared no potential conflicts of interest with respect to the research, authorship and/or publication of this article.
Funding
The authors disclosed receipt of the following financial support for the research, authorship, and/or publication of this article: This work was supported by the Scientific Research Fund of Zhejiang Provincial Education Department (grant number Y201432037); the Zhejiang Top Priority Discipline of Textile Science and Engineering & Engineering Research Center of Clothing Technology of Zhejiang Province (grant number 2013KF11); the Science and Technology Project of the Administration of Quality and Technology Supervision of Guangzhou Municipality (grant number 2014KJ29); and the Science and Technology Guidance Project of China National Textile And Apparel Council (grant number 2015066).