
Abstract
Today many different natural materials are being effectively used in the acoustics and noise control domain. In this study, the acoustical characterization of three different types of natural jute felt material is performed by an experimental method and by using the Dunn and Davern model, along with an inverse characterization method. There are many empirical models available in the literature which describes the acoustical behavior of specific material accurately, as they are specially developed for that material. In this study, the possibility of using only the air flow resistivity based Delany–Bazley model and the Dunn–Davern model for acoustical performance prediction of jute material is tested. However, these two models do not show good matching with the experimental data throughout the frequency range of interest. Particularly in the low frequency region, the level of mismatch between experimental and model data is high. Therefore the inverse prediction of the coefficients
Fibrous materials are widely used for noise control treatments in various fields such as automotive and architectural applications. There is a growing trend for the use of natural materials to serve this purpose. Jute is one of the natural materials abundantly available in India and has a lot of potential applications in the field of noise control treatments.1,2 Natural materials offer many advantages over synthetic materials like glass wool, rock wool, polyurethane foam, and the like, which are not environment-friendly and are also difficult to produce. Hence the use of jute for noise control applications makes a positive impact on the environment and also has a lot of scope in engineering noise control applications.
To discover the acoustical properties of jute, its acoustic characterization is necessary. Once these acoustical properties are known, the acoustic performance of a system can be simulated with various commercial software packages for acoustic applications. These software packages may be helpful in the early design stage of a new product development.
Noise control using natural materials is a key research area, and many researchers are putting their efforts into it. Acoustical properties such as the sound absorption coefficients for natural materials like kneaf, wood, hemp, coconut, sheep wool, cork, cane, tea leaf, and bio luffa fibers have been evaluated experimentally using the impedance tube.3–6
There are different empirical models developed for specific porous and fibrous materials. The Delany–Bazley model 7 is a popular model developed for glass fibers, and needs only the air flow resistivity value as input. The model is developed based on the simple power law relations obtained from best fitting a large amount of experimental data. Dunn and Davern 8 used the same structure as the standard Delany–Bazley model and obtained new values for regression coefficients for recycled foam material. Similarly, Muehleisen et al. 9 developed a model for reticulated carbon foam; Qunli 10 modeled for porous plastic open cell foam, and Voronina11,12 modeled for fibrous and elastic porous materials. These models can better predict the acoustic behavior of these particular materials as they are developed based on a large number of impedance tube measurement data and a curve fitting approach. However, when these models are used for the acoustic performance prediction of jute material, the results deviated considerably from the experimental data. These empirical models give best estimations above 250 Hz, but in the lower frequency region there is a noticeable error in prediction. 13 Bies and Hansen 14 tried to broaden the lower and upper-frequency limits of the Delany–Bazley model, and Miki15,16 and Mechel 17 made further improvements in this regard. Fibrous materials are good for low frequency sound absorption. Low frequency sound absorption becomes an issue, particularly when there is a limited space available for placement of sound absorbing material. Similar to fibrous materials, an acoustic metasurface can also provide a good solution for this problem. Li and Assouar 20 and Ma et al. 21 designed a metasurface-based structure which can totally absorb the incident acoustic energy in an extremely low frequency range.
In most of the research work described above the main approach is to best-fit on a large number of experimental sound absorption data. In this connection, Garai and Pompli 18 found the optimum value of eight coefficients for polyester fiber using the best fitting technique. Cummings and Beadle 19 obtained the value of eight coefficients of the Delany–Bazley model using regression lines by plotting the real and imaginary parts of the characteristic impedance and propagation constant of fully reticulated polyurethane foams. The existing literature lacks a model which can specifically describe the acoustical properties of jute material. Inverse acoustical characterization can be effectively used where direct measurement of non-acoustical parameters is not easily possible. Pelegrinis et al. 22 estimated the flow resistivity alone of polyester fiber from the Kozeny–Carman flow resistivity model. In their work, they used the Nelder–Mead simplex optimization method to solve the minimization problem.
Particle swarm optimization (PSO) is one of the techniques used for inverse characterization problems. It was introduced by Eberhart and Kennedy 23 in 1995, and it is based on the social behavior reflected in the flocking of birds, fish, and bees that adjust their movements to find the best food source. 24 The PSO offers many advantages over other optimization algorithms as it is robust, is fit for non-linear design spaces, can handle continuous, discrete, and integer variable types easily, and, as it is a population-based algorithm, it requires lower computational effort. This method is used by Perez and Behdinan, 25 Venter and Sobieszcznski-Sobieski, 26 and Fourie and Groenwold 24 in the area of structural and topological optimization. In geology problems, applicability of the PSO has been demonstrated by Singh and Biswas. 28 This technique is not yet implemented for noise control problems to the authors’ knowledge. In this work, the PSO method is utilized to find the values of the regression coefficients in the Dunn–Davern model for three types of jute felt material.
Material
Categorization of jute felts
Jute felt is manufactured from raw jute fibers. It is obtained on a scrim base by pricking into it with needles on intertwined fibrous material which is usually obtained from jute caddis or shredded fiber waste. The felt may be needled on a single side or on double sides. 32
The optical microscope images of Type 1, Type 2, and Type 3 felt are shown in the Figure 2. The fiber diameter range for jute fiber in all three types of felts is 20–40 µm.
Photographs of different types of jute felt. Optical microscope images of three types of jute felt.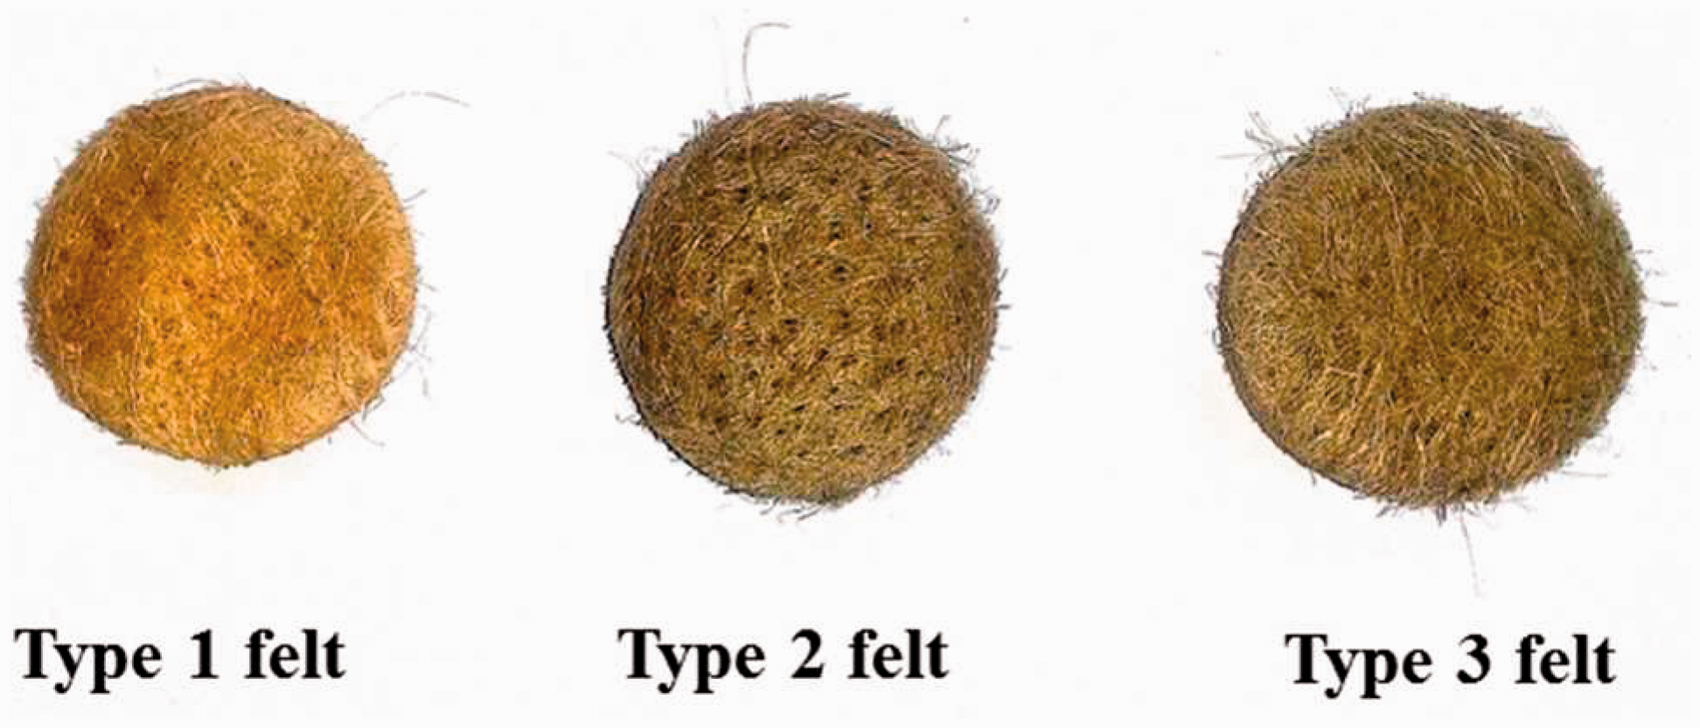

Methodology
Dunn and Davern model
Dunn and Davern used the equations in the same form as given by Delany and Bazley. The Delany and Bazley model was developed for fibrous material, whereas Dunn and Davern utilized it for modeling acoustic behavior of recycled foam material. The idea here is to find out the values of the constants 


Calculation of sound absorption coefficient
The normal incidence sound absorption coefficient is calculated by


Measurement of air flow resistivity
The air flow resistivity is an important non-acoustical parameter of fibrous material. It mainly controls the sound absorption properties of any porous material. The flow resistivity determines the resistance to the air flow through the porous material. It is measured as per the ISO 9053 standard,
30
and involves measurement of the pressure difference on the two sides of the sample of known thickness and with known air flow velocity. Then flow resistivity is calculated by equation (8) as

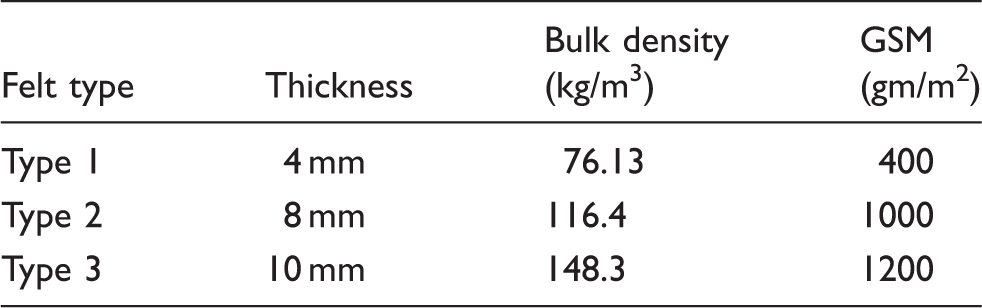
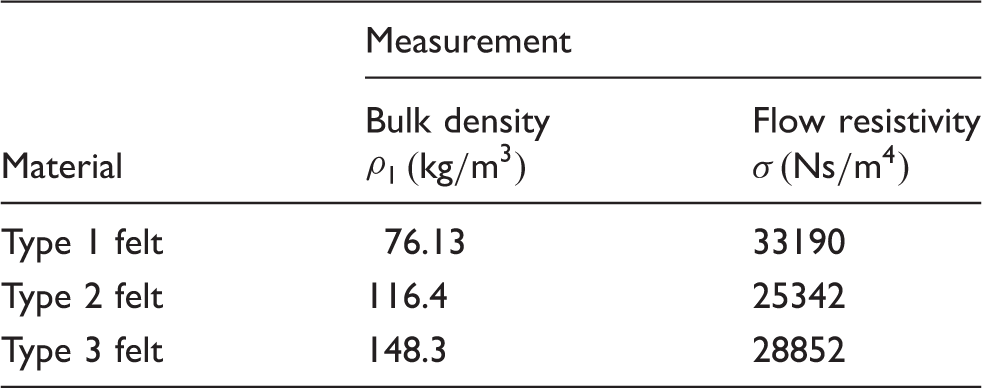
Bulk density and measured flow resistivity of jute felts
Measurement of the sound absorption of jute felts
The normal incidence sound absorption coefficient of jute felt is measured by using a B&K, Denmark 4206 impedance tube using the transfer function method. Measurement is performed as per the ASTM standard 10534-227 using the transfer function between two B&K 4187 microphones.
31
The schematic of the measurement system is as shown in Figure 3. The samples are prepared with diameters of 29 mm and 100 mm, which are the same as the internal diameter of the tube. The frequency range of interest for measurement is from 50 Hz to 6400 Hz. Measurement is done for three samples cut from different parts of the felt, and the final sound absorption result is the average of these three measurements. The test sample thickness in the tube for each type of jute felt is the same, 25 mm. This thickness is achieved for each type of felt by stacking thinner layers of felt when necessary.
Schematic of the experimental setup for normal incidence sound absorption coefficient measurement.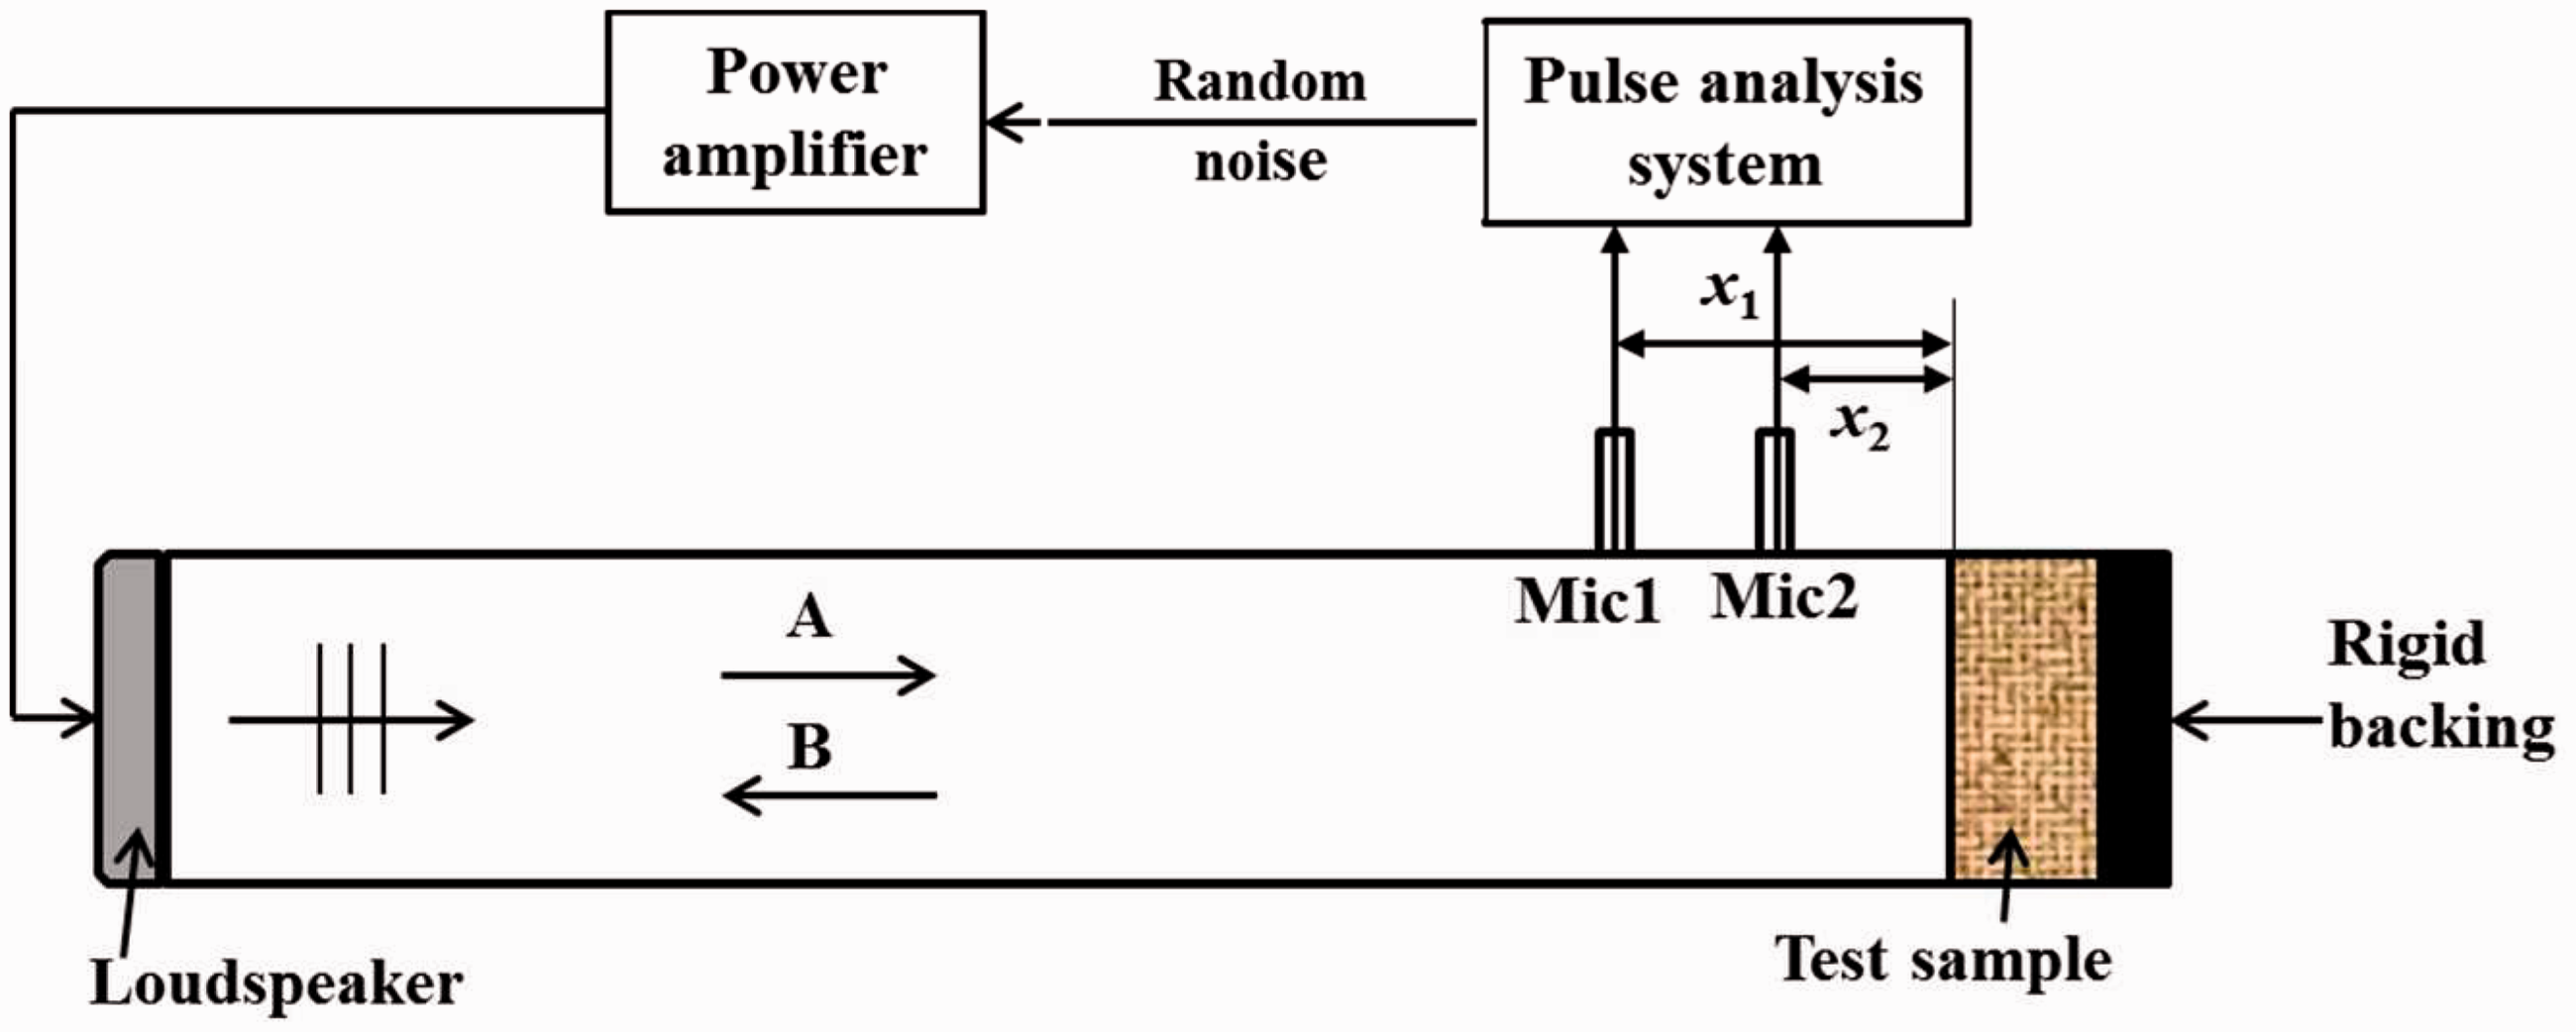
Inverse estimation of coefficients using the PSO method
The inverse method for finding the coefficients 
The PSO mimics the social behavior of birds. Birds while moving in a flock in search of their food exchange information about their position, velocity, and fitness. In the PSO algorithm, ‘bird’ and ‘particle’ are interchangeable. An individual particle keeps information about its position vector in the solution range and the associated velocity vector. All particles change position at a particular time, which is set in the algorithm. Then the velocity vector is used to calculate the new location of a particle for the next time step. The PSO algorithm stores information about the best ever individual position and the best ever global position achieved by each particle. Hence, from the knowledge of these two parameters, all particles collectively move towards the global optimum location.
The PSO process is stochastic in nature. The current position of each particle in the swarm is updated based on the velocity vector of each particle. The velocity vector is updated based on the memory gained by each particle, conceptually resembling an autobiographical memory, as well as the knowledge gained by the swarm as a whole.
20
Hence the position of each particle in the swarm is updated based on the social behavior of the swarm, which adapts to its environment by returning to promising regions of the space previously discovered and by searching for better positions over time. Numerically, the value x of an 

Different parameters governing the PSO are swarm size or number of particles, number of iterations, velocity components, acceleration coefficients, and inertia weights.
Swarm size or population size is the total number of particles in the swarm. It governs the number of generations required for optimization of the solution. If the population size is small, numbers of generations needed for the optimum result are fewer. Increase in the population size results in increased computational effort and complexity. A very few iterations of generations may stop the search process before the mature state is attained.
Three terms in equation (11) represents three velocity components which are important for updating particle velocity. The first term,
Initialization of particles is done randomly over the entire domain. This ensures that the entire domain will be searched without leaving any region unexplored. This increases the possibility of finding the global optimum, if it exists. The randomly-distributed initial position and velocity vectors throughout the design space for each particle of the swarm are given by equations (14) and (15), respectively
22


The criterion for the stability of the PSO is given by Perez and Behdinan.
25
The PSO is stable only when the following conditions are satisfied

and

The inertia term w controls the effect of the current velocity vector on the updated velocity vector. Larger inertia weights increase the magnitude of the updated velocity vector, which results in the global exploration of the solution space.
25
For the initial global search, inertia weight should be high (
Results
The basic idea of the inversion problem here is to find such values of the coefficients in equations (1)–(4) that will minimize the difference between the experimental and the theoretical model. The PSO method is used in this work to minimize the error between the experimental and the theoretical model.
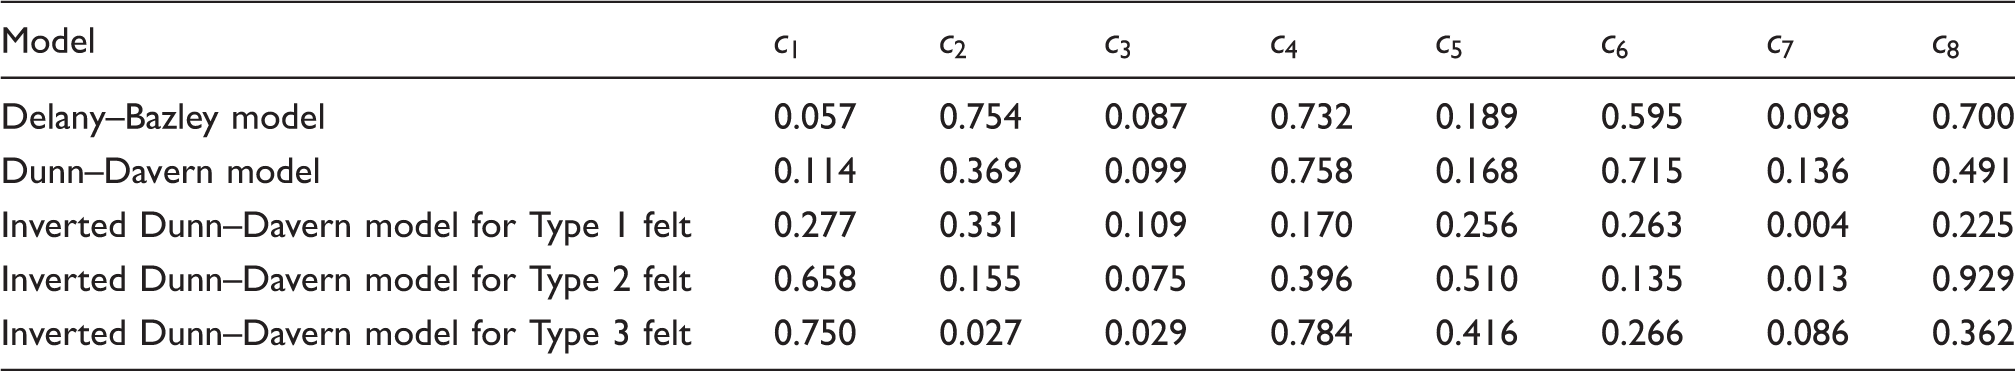
Coefficients for different models
Experimental sound absorption of three types of jute felt
The normal incidence sound absorption coefficient of all three types of jute felts are measured with the B&K impedance tube and the results are shown in Figure 4. The thickness of the test samples for each type of felt is fixed as 25 mm, with a rigid backing condition. Sound absorption performance is similar for all three types of felts below 1000 Hz, but there is considerable shift in the sound absorption curve in the frequency range of 1000–3000 Hz. In this range the sound absorption of Type 3 felt is highest, Type 1 is lowest, and Type 2 gives intermediate performance. Above 3000 Hz the sound absorption of Type 1 felt dominates, and for Type 2 and Type 3 felt it remains the same. As the acoustical behavior for all three types of felt is different, the inverse problem to discover the coefficients in the Dunn–Davern model are solved separately for each felt.
Experimental normal incidence sound absorption coefficient of three types of jute felt.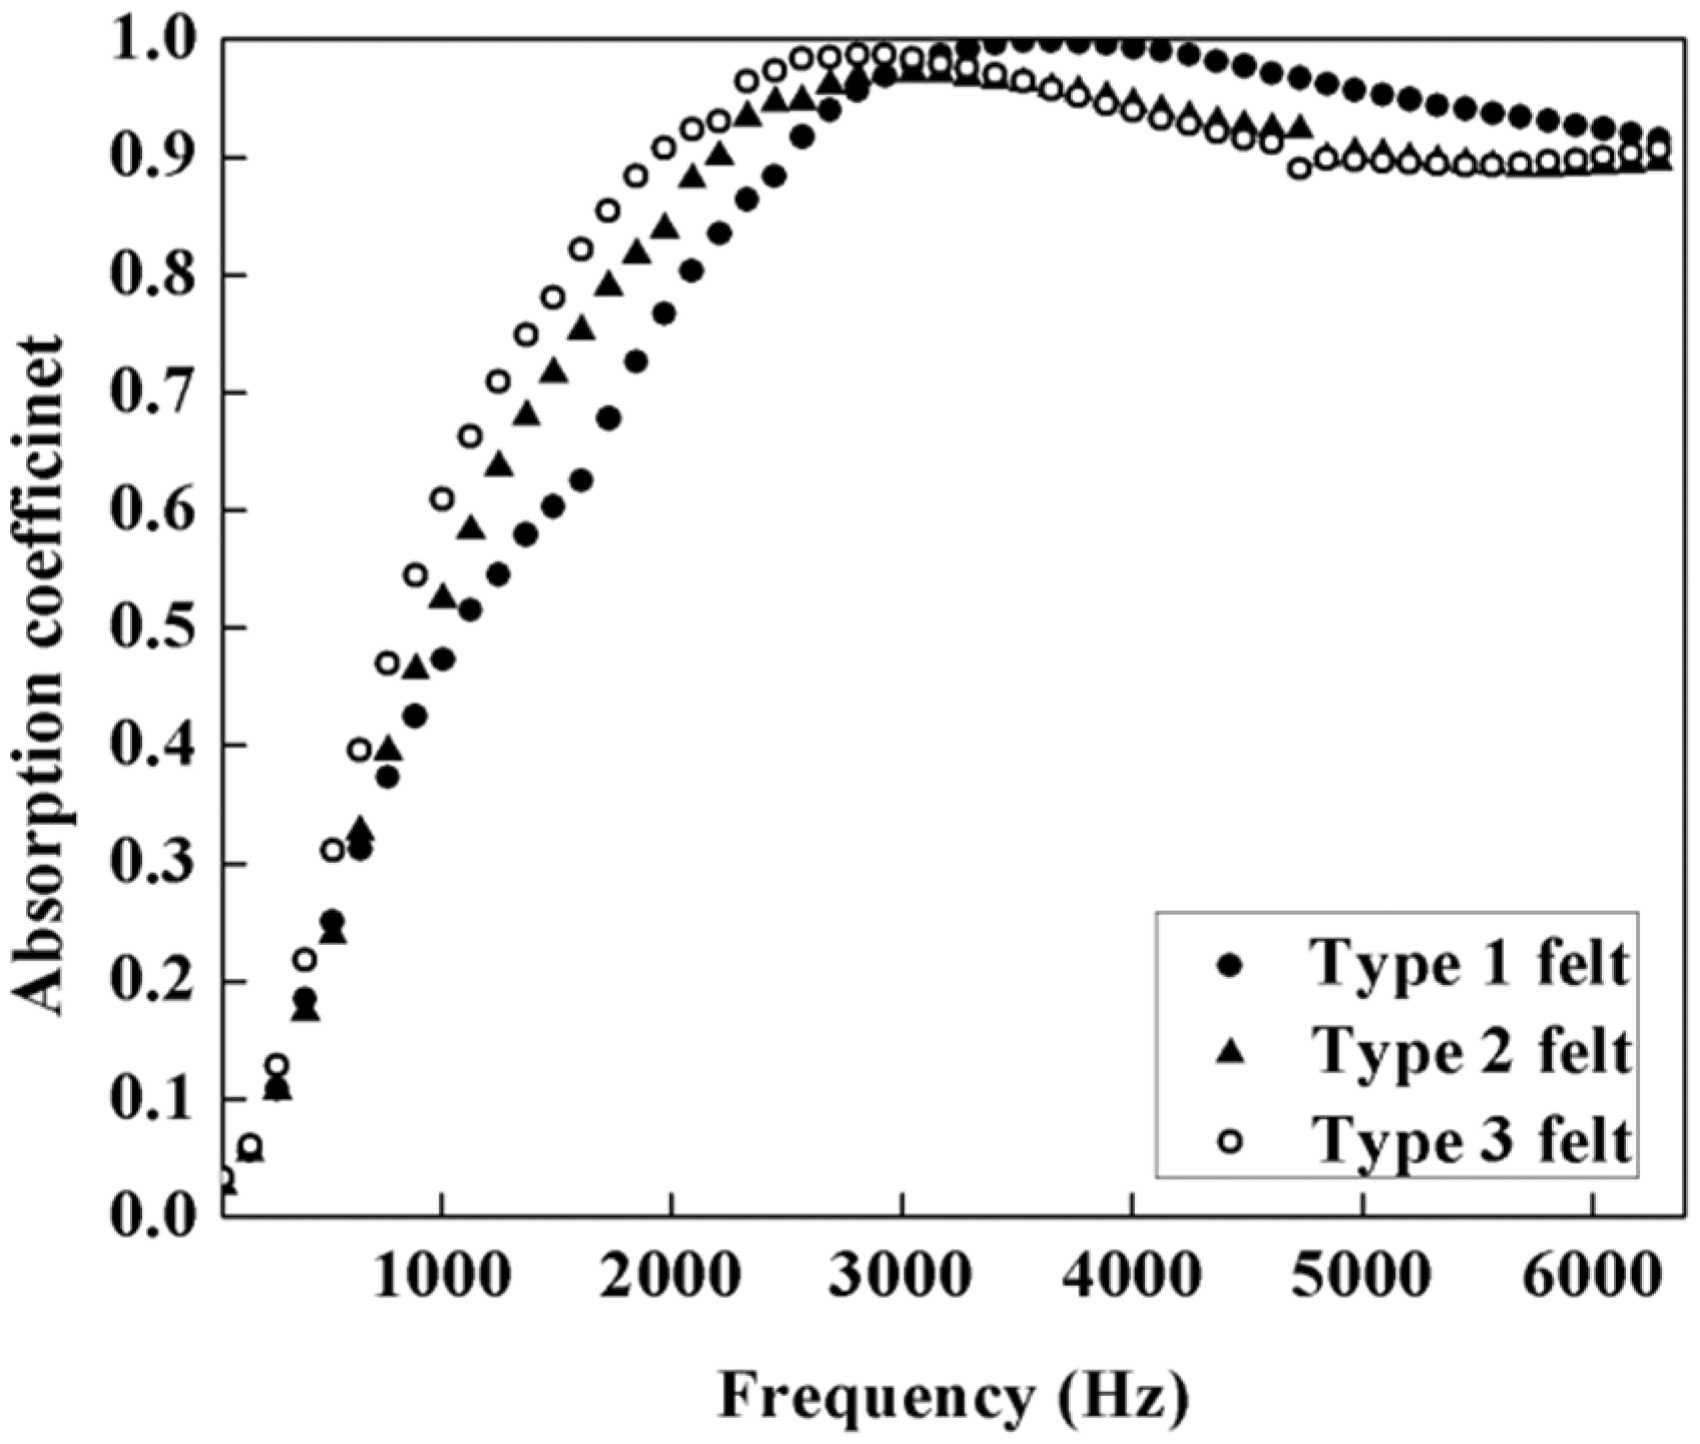
Determination of eight coefficients for Type 1, Type 2, and Type 3 felt using the PSO
Figures 5, 6, and 7 represent the results of the normal incidence sound absorption coefficient, respectively, for Type 1, Type 2, and Type 3 felt, obtained from the impedance tube experiment, the Dunn–Davern model with new coefficient values for jute material obtained from the PSO, the standard Delany–Bazley model, and the Dunn–Davern model. In the standard Delany–Bazley and Dunn–Davern models the coefficient values Comparison of normal incidence sound absorption coefficient of Type 1 felt obtained with different approaches. Comparison of normal incidence sound absorption coefficient of Type 2 felt obtained with different approaches. Comparison of normal incidence sound absorption coefficient of Type 3 felt obtained from different approaches.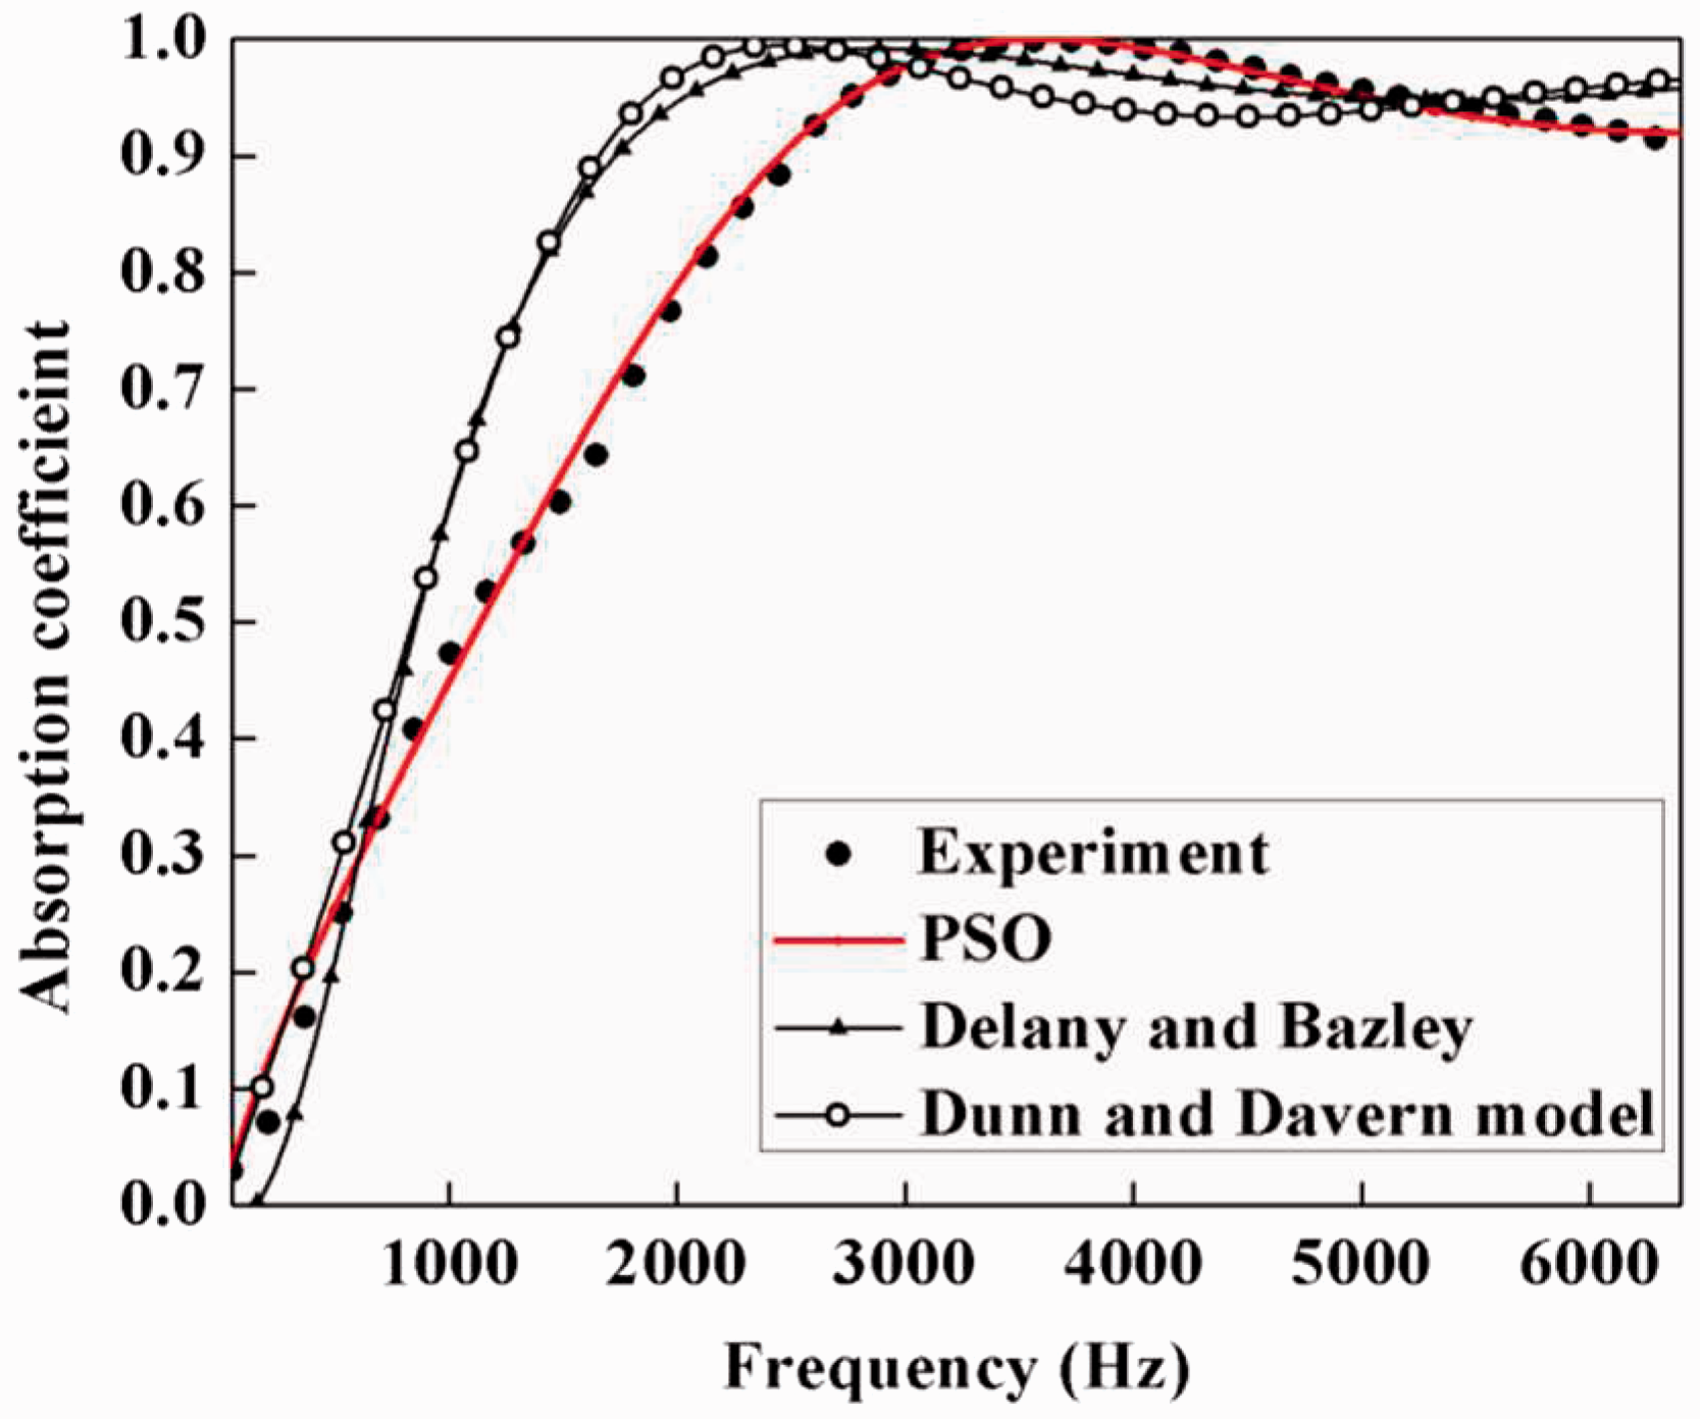
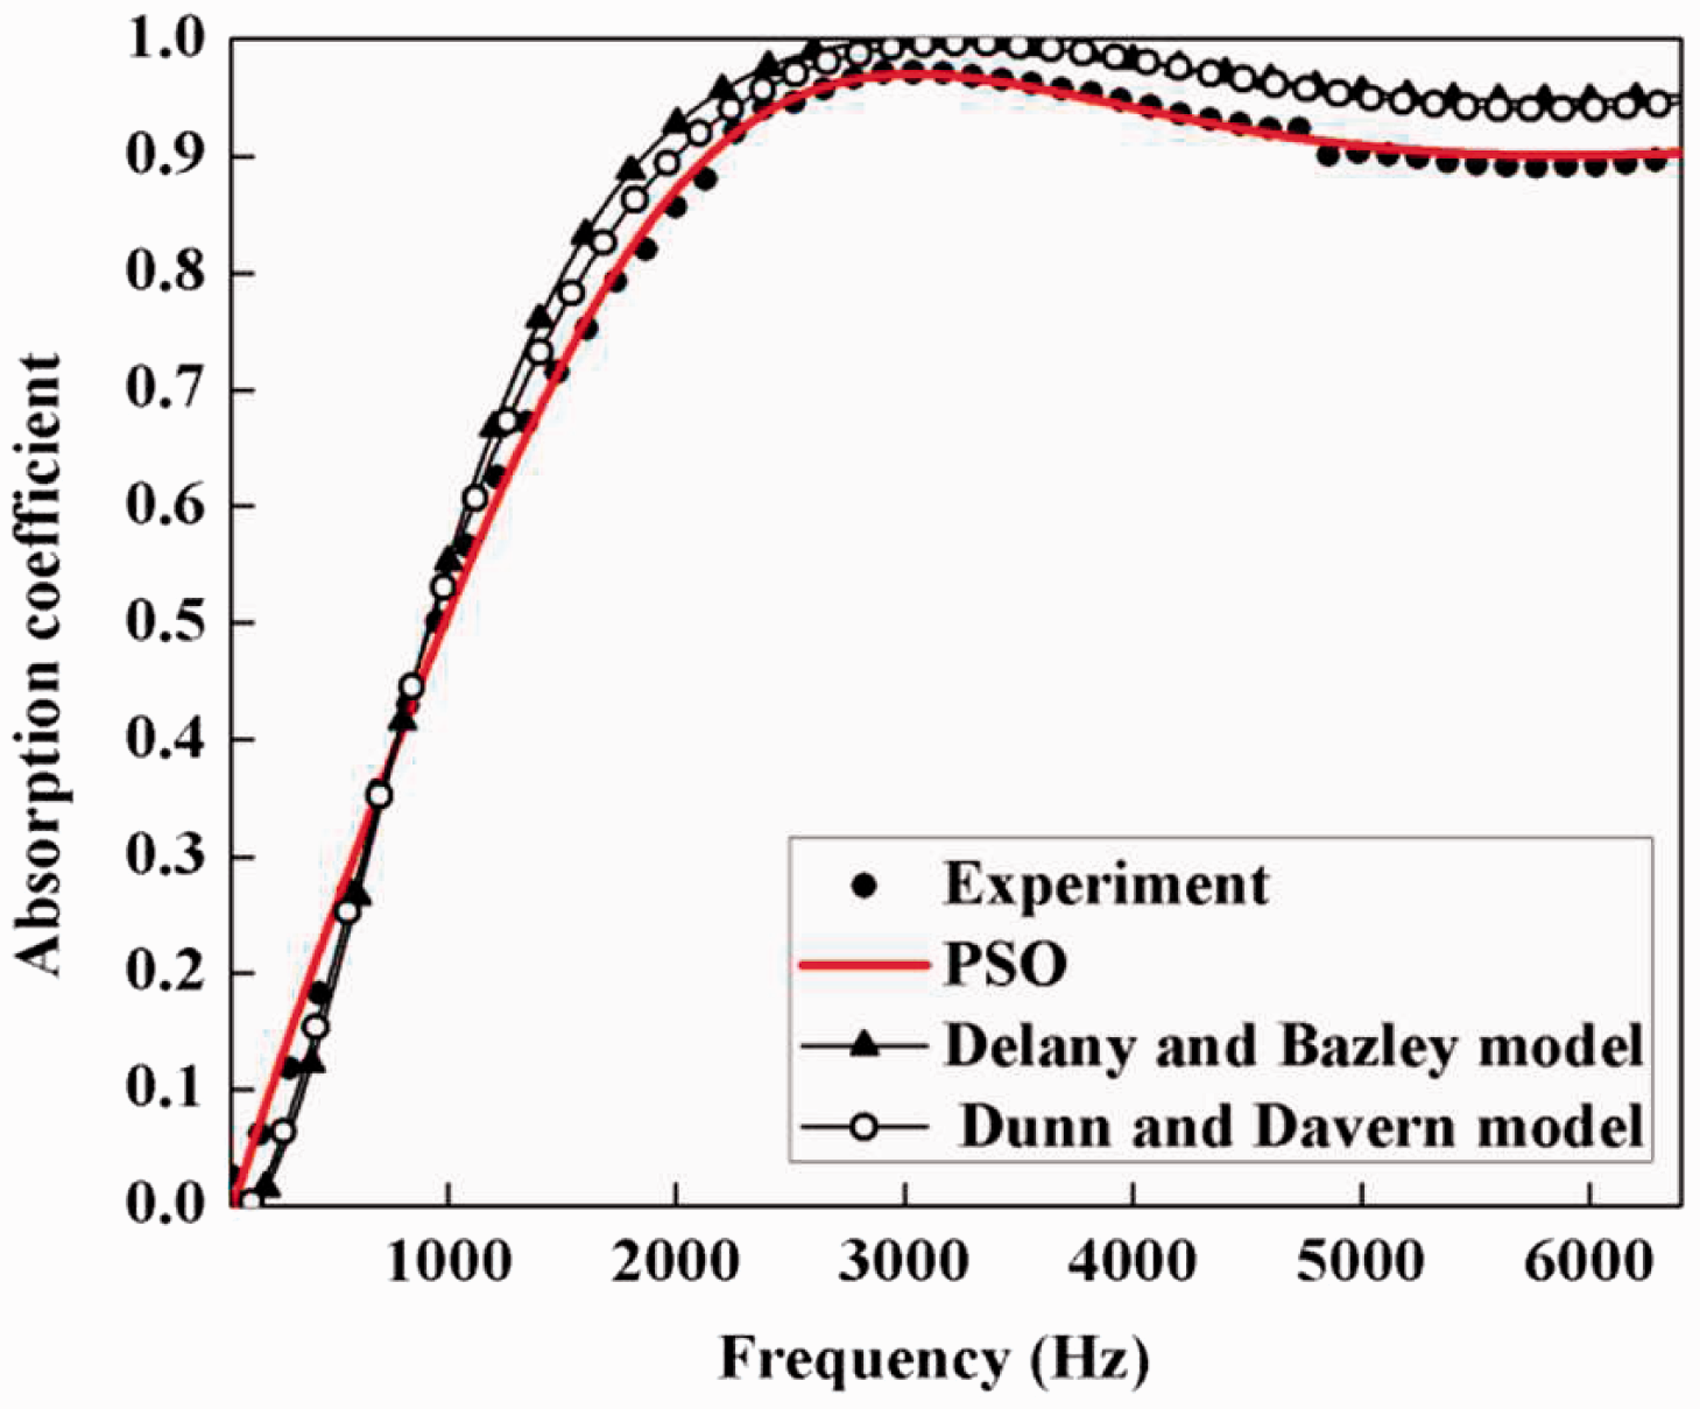
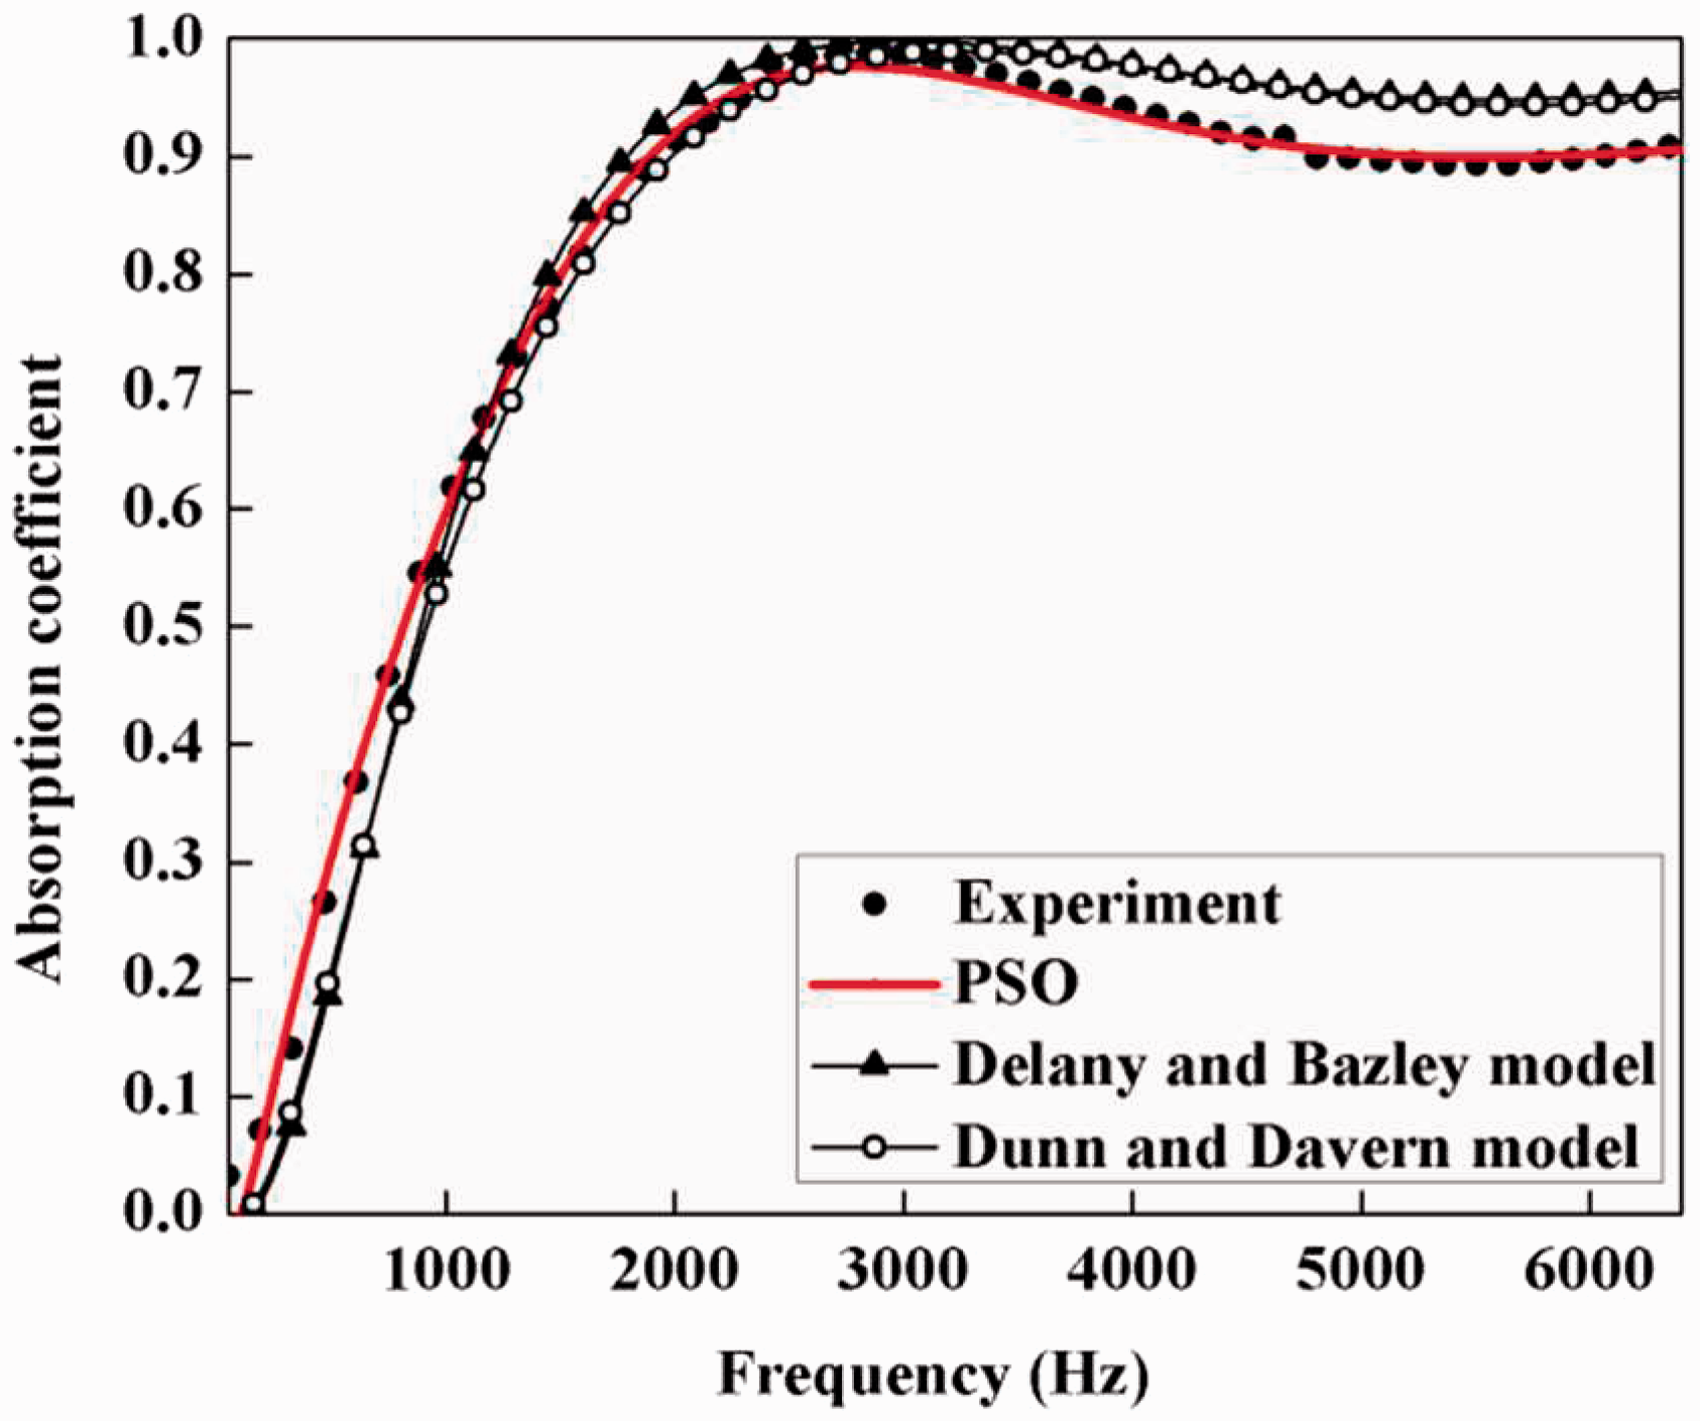
In the PSO inversed Dunn–Davern model, the values of the coefficients in Table 3 are obtained from the inverse method using the PSO for three types of felt. In the inverse method using the PSO, the objective is to minimize the error between experimental data and data predicted from the theoretical model. Values of the eight coefficients are adjusted such that there is a perfect match between the experimental and predicted data.
Delany and Bazley have obtained the eight coefficients of their model by measuring values of the characteristic impedance and the propagation coefficient for fibrous material with porosity close to one. The values were normalized as a function of frequency divided by flow resistance, and represented by simple power law relations. Then the eight coefficient values of the regression constants were obtained by plotting normalized real and imaginary parts of the characteristic impedance and propagation constant. The measured flow resistances of the test samples were used for the normalization procedure. Later on Dunn and Davern followed the same procedure, and calculated the eight coefficient values for their model in the same manner for foam material.
Dunn–Davern and Delany–Bazley model results significantly deviate from the experimental data in the overall frequency range for jute material. The reason for this large mismatch may be that Delany and Bazley conducted experiments on fibrous samples like glass fibers, while Dunn and Davern used reticulated foam material. In both cases the porosity was near to one. In the case of jute material the porosity is not very close to one. The new coefficient values obtained from the inverse method for three types of jute felt show excellent match with the experimental data in the overall frequency range. This confirms the accurate estimation of the coefficient values using the PSO inversion method. Hence by using the same equations as given by Dunn and Davern and new coefficients, accurate estimation of sound absorption of jute felt is achieved. These coefficients for jute felt can further be used in the various finite and boundary element software packages which may be helpful for acoustical modeling of jute material.
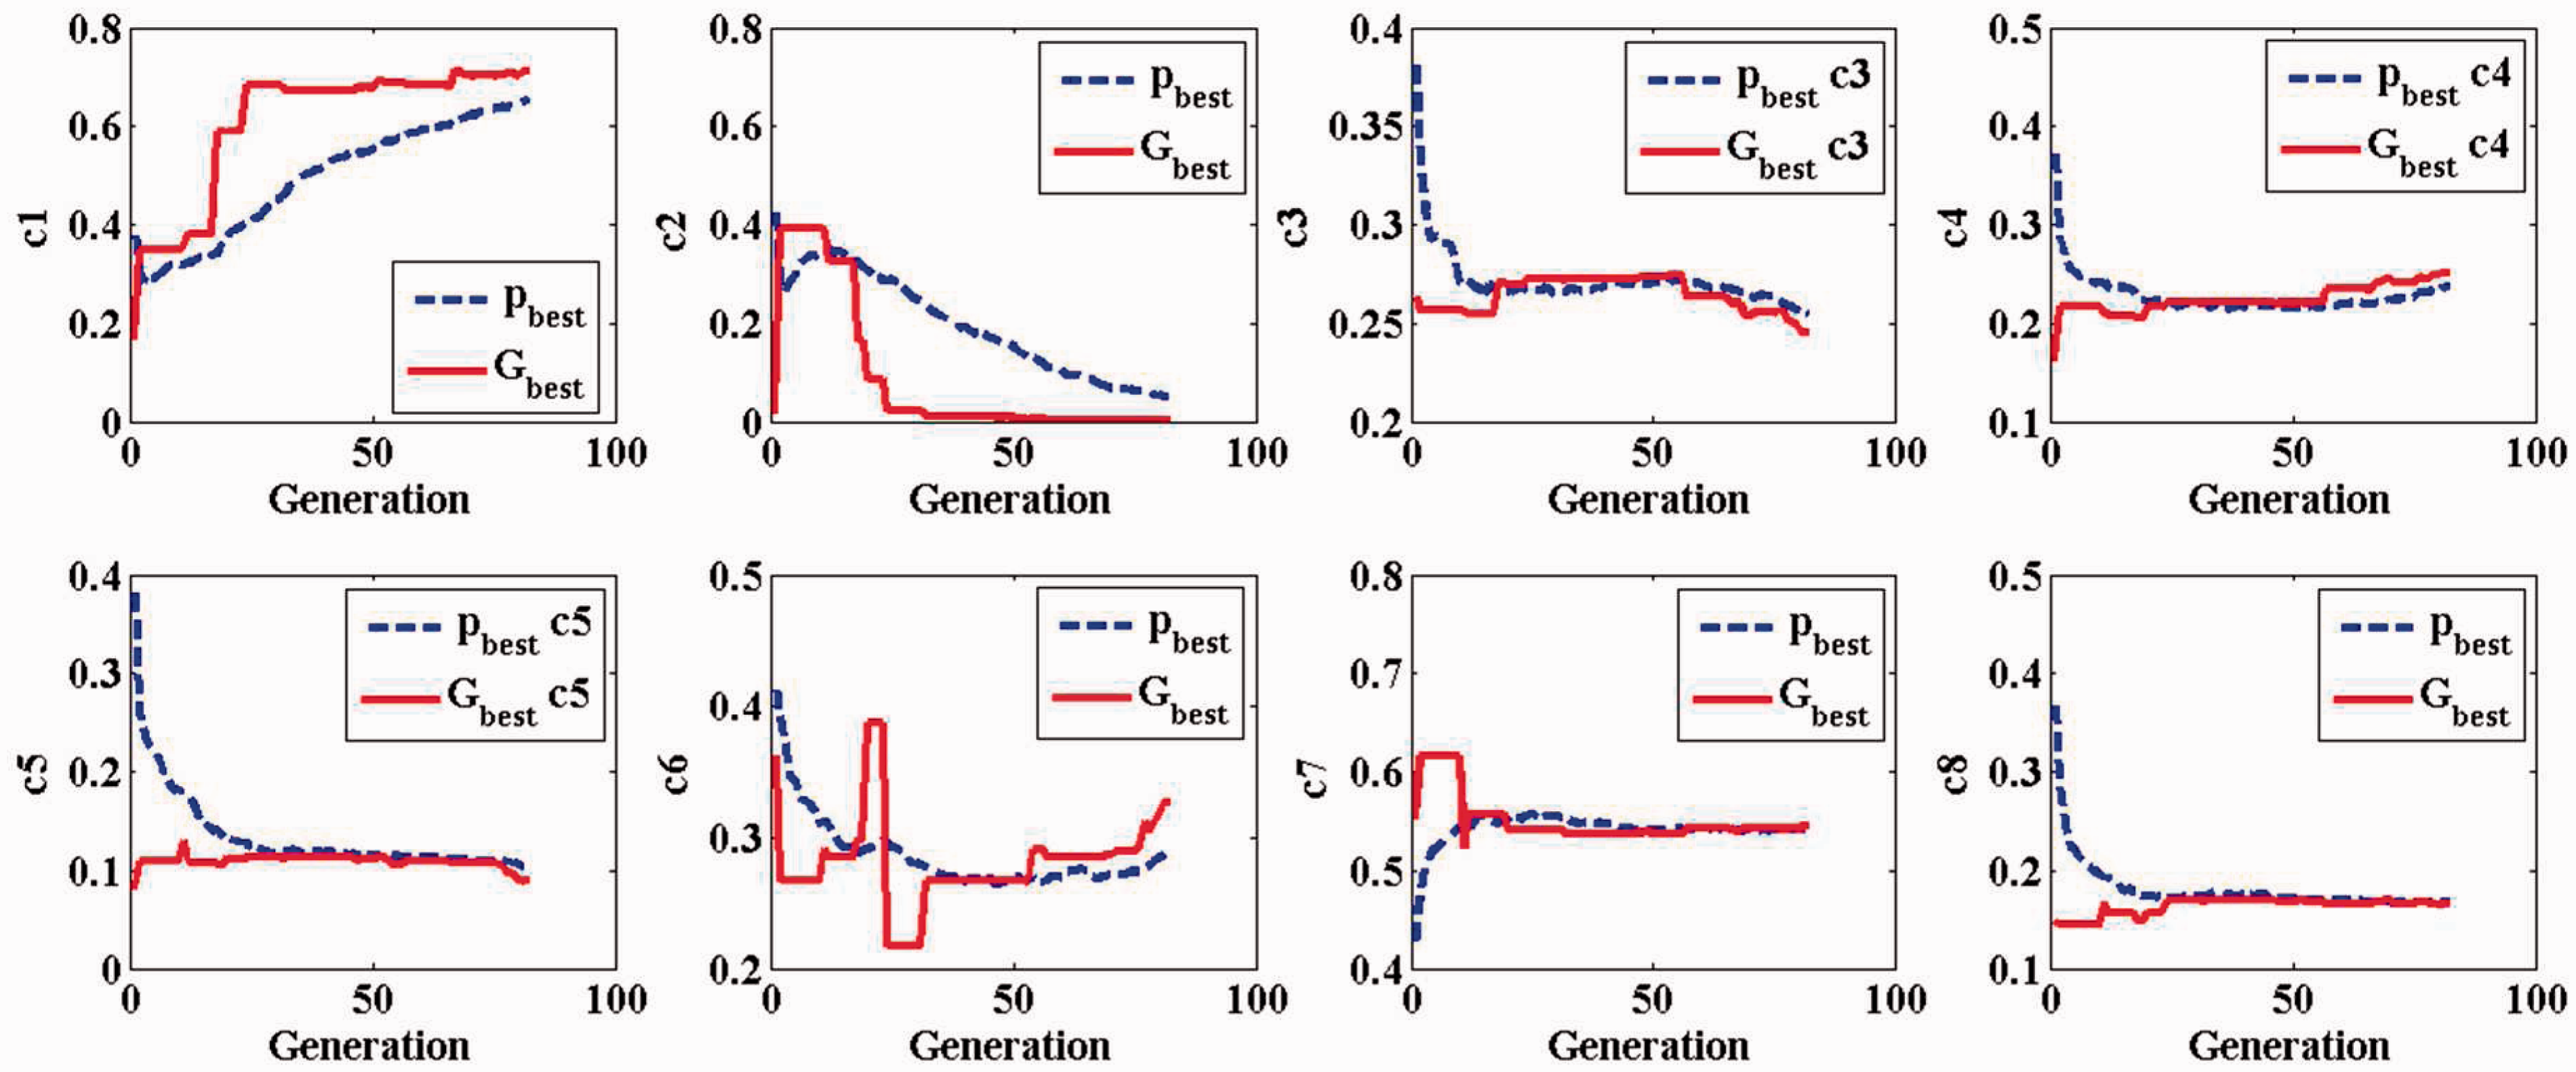
The convergence pattern of the eight coefficient values for Type 1, Type 2, and Type 3 felt is represented in Figures 8, 9, and 10, respectively. The plot represented by the legend PSO in Figures 5, 6, and 7 is plotted with the mean values of ten iterations.
Convergence pattern for Type 1 felt using PSO inversion method. Convergence pattern for Type 2 felt using the PSO inversion method. Convergence pattern for Type 3 felt using the PSO inversion method.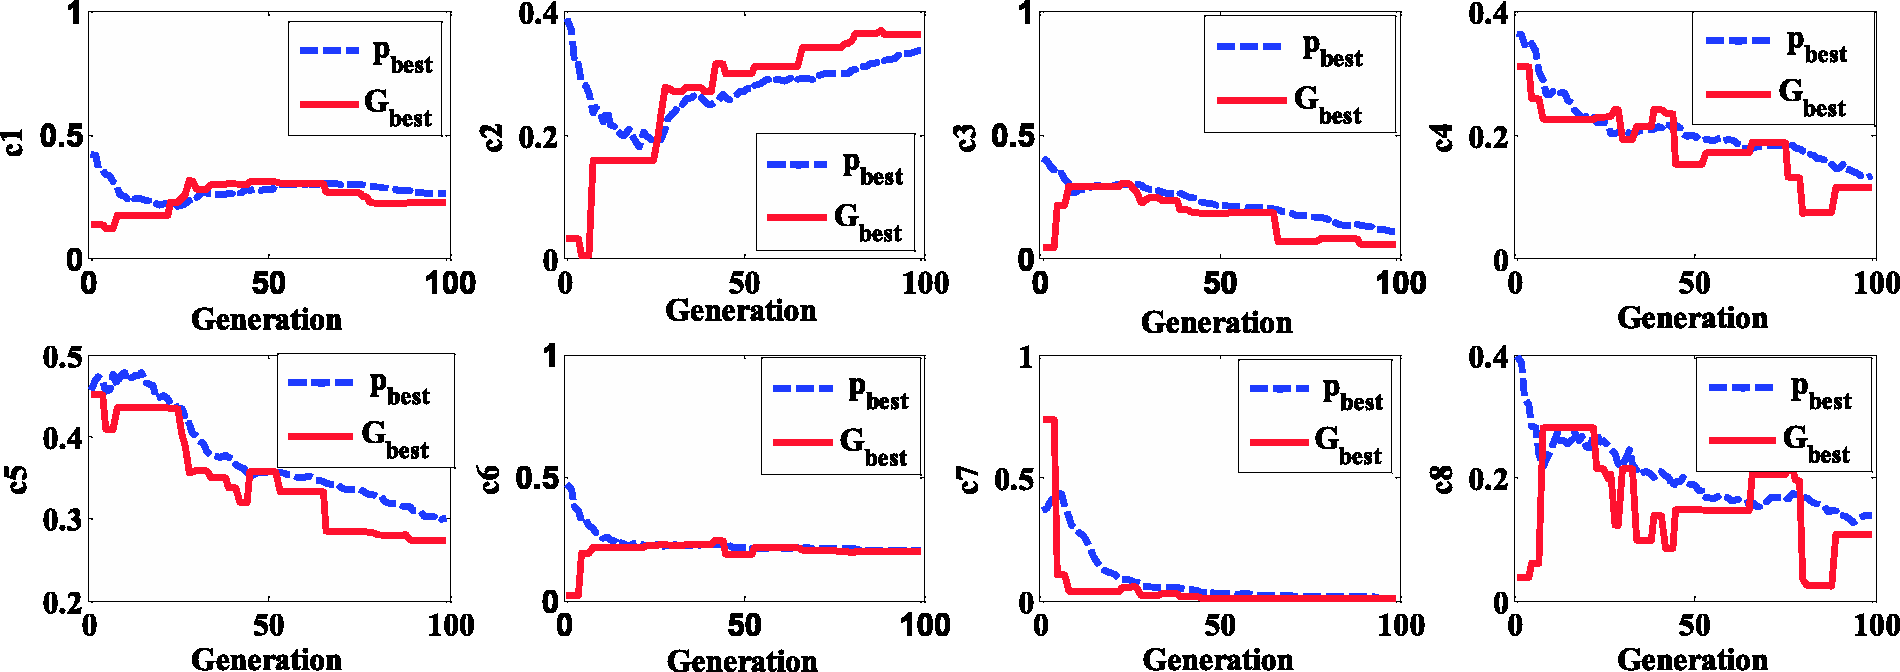
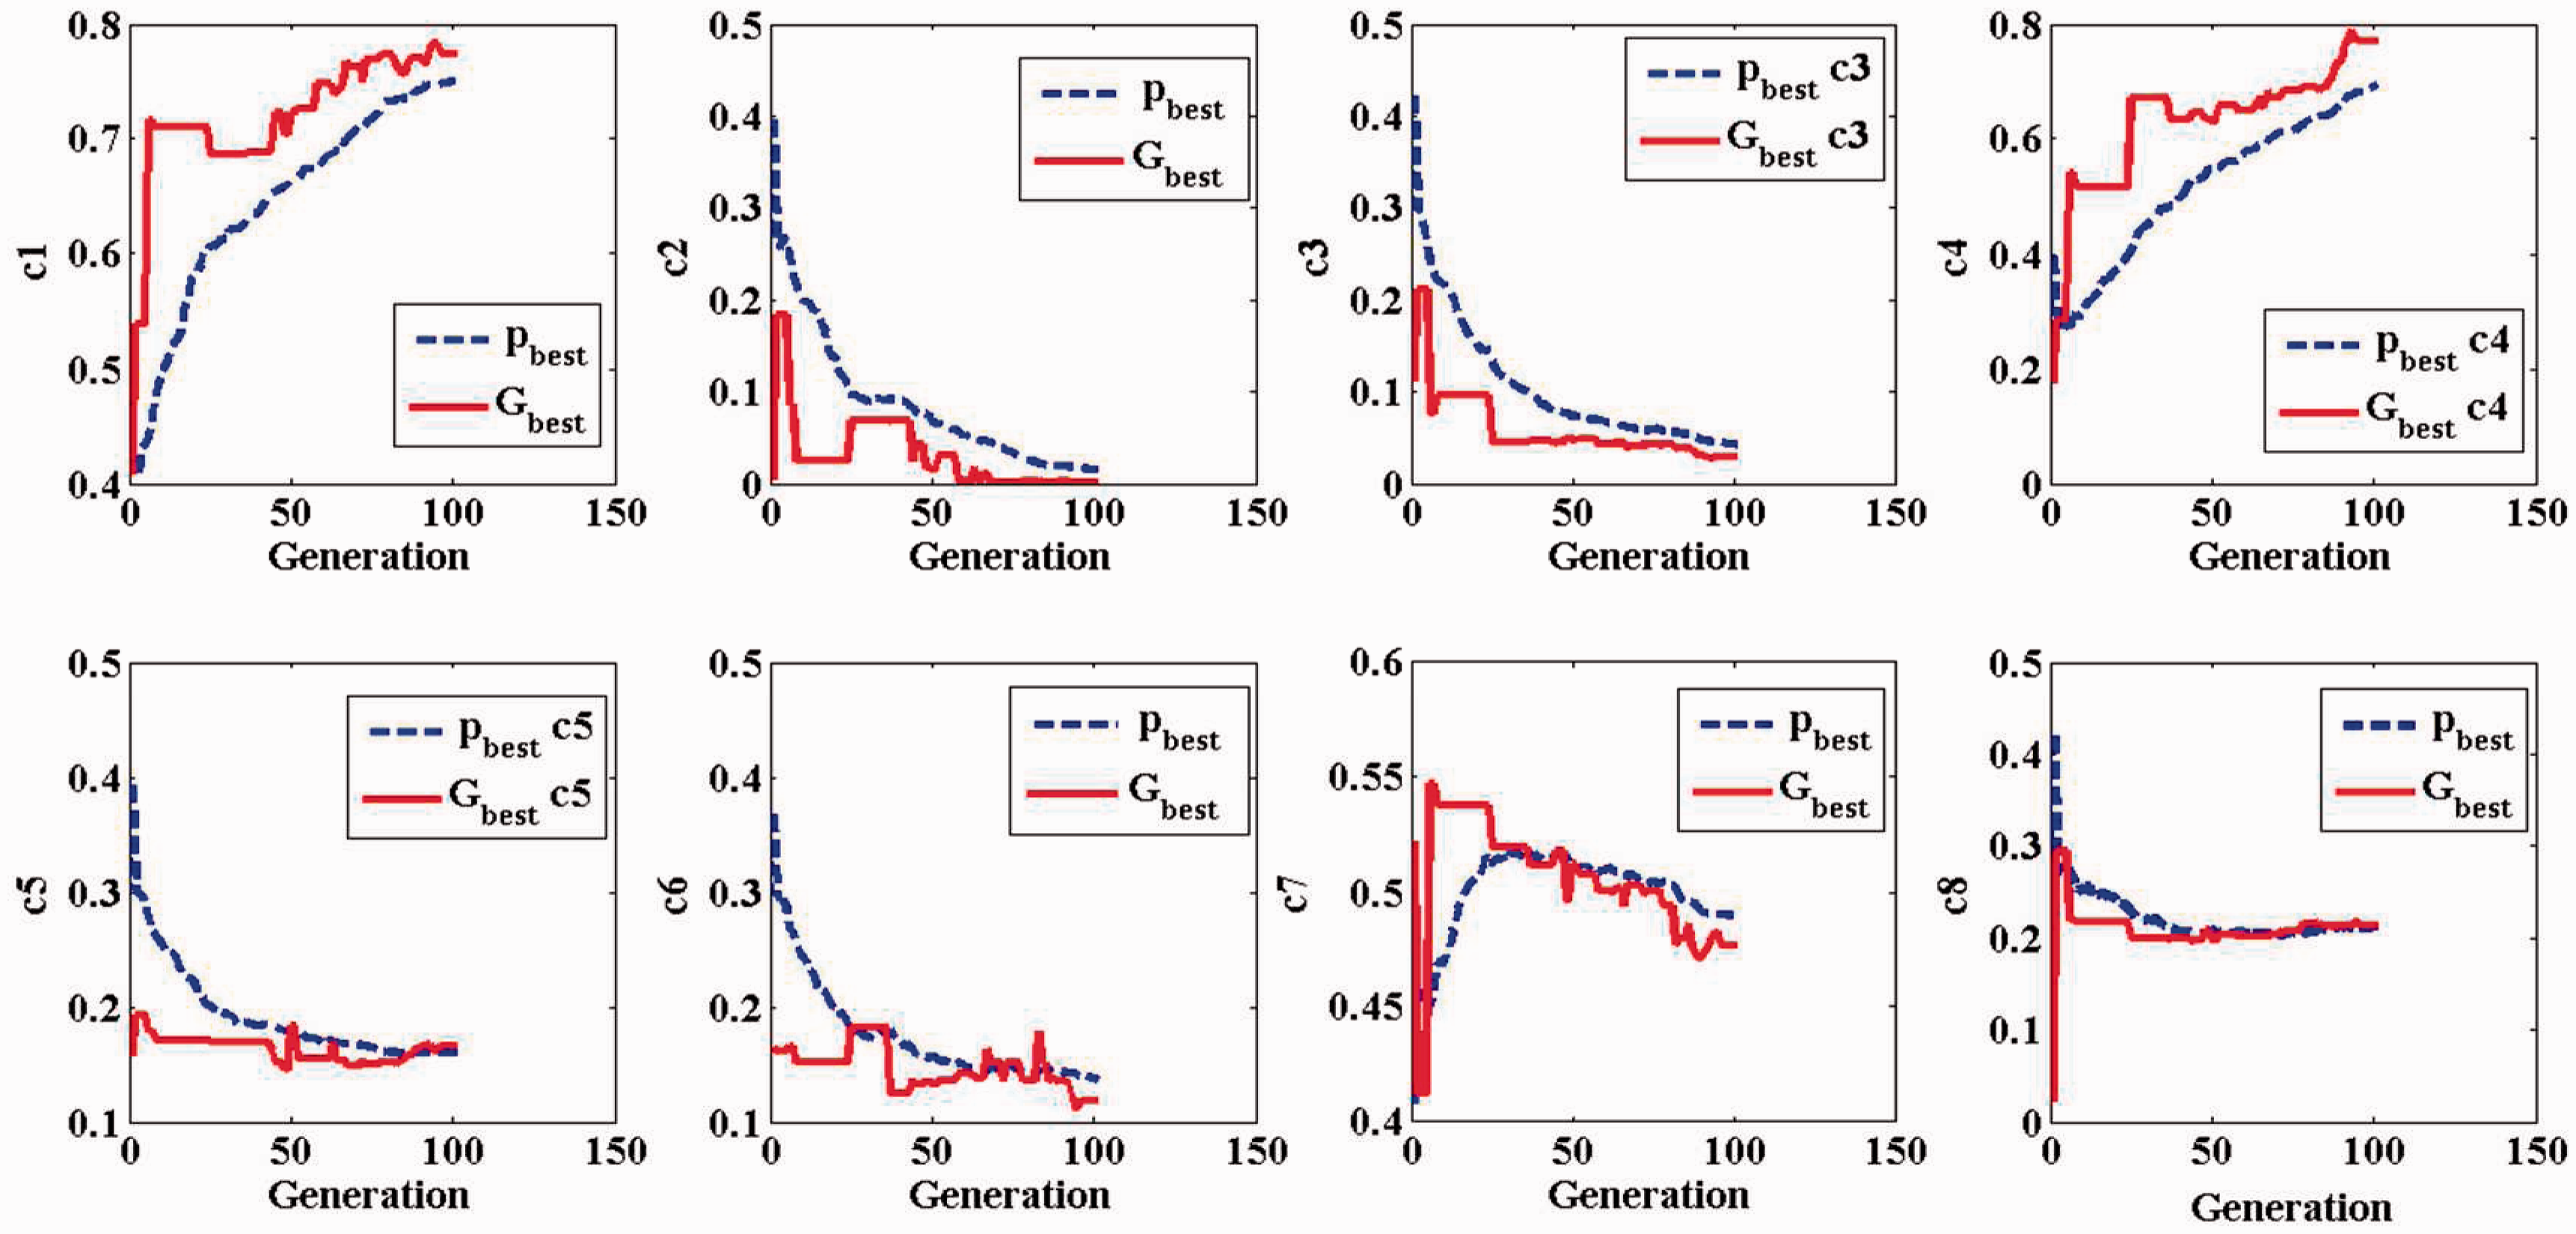
During the iteration process in the PSO, the initialized number of particles spreads over the defined solution range for each individual parameter.
If the
It is well known that the Delany–Bazley model cannot be extended to the low frequency region for acoustic material characterization. Kirby
29
reported that the Delany–Bazley model gives negative values for the real part of the equivalent density from the plot between the equivalent density and the factor X. It is observed that the Delany–Bazley model produces negative values of the equivalent complex density, which indicates the nonphysical behavior of the model in the low frequency range. Because of this, the Delany–Bazley model data should not be extrapolated below values of
The Dunn–Davern model is uses a similar structure of equations the Delany–Bazley model. It is assumed that the porous material is treated as equivalent to a fluid, so its basic properties can be represented in terms of equivalent density and the speed of sound. Any changes that are made to modify the Delany–Bazley model can be evaluated to check its nonphysical behavior by testing the values of the equivalent fluid density. In terms of the Delany–Bazley model, the equivalent fluid density is given as
The real part of the equivalent density for three types of felt.
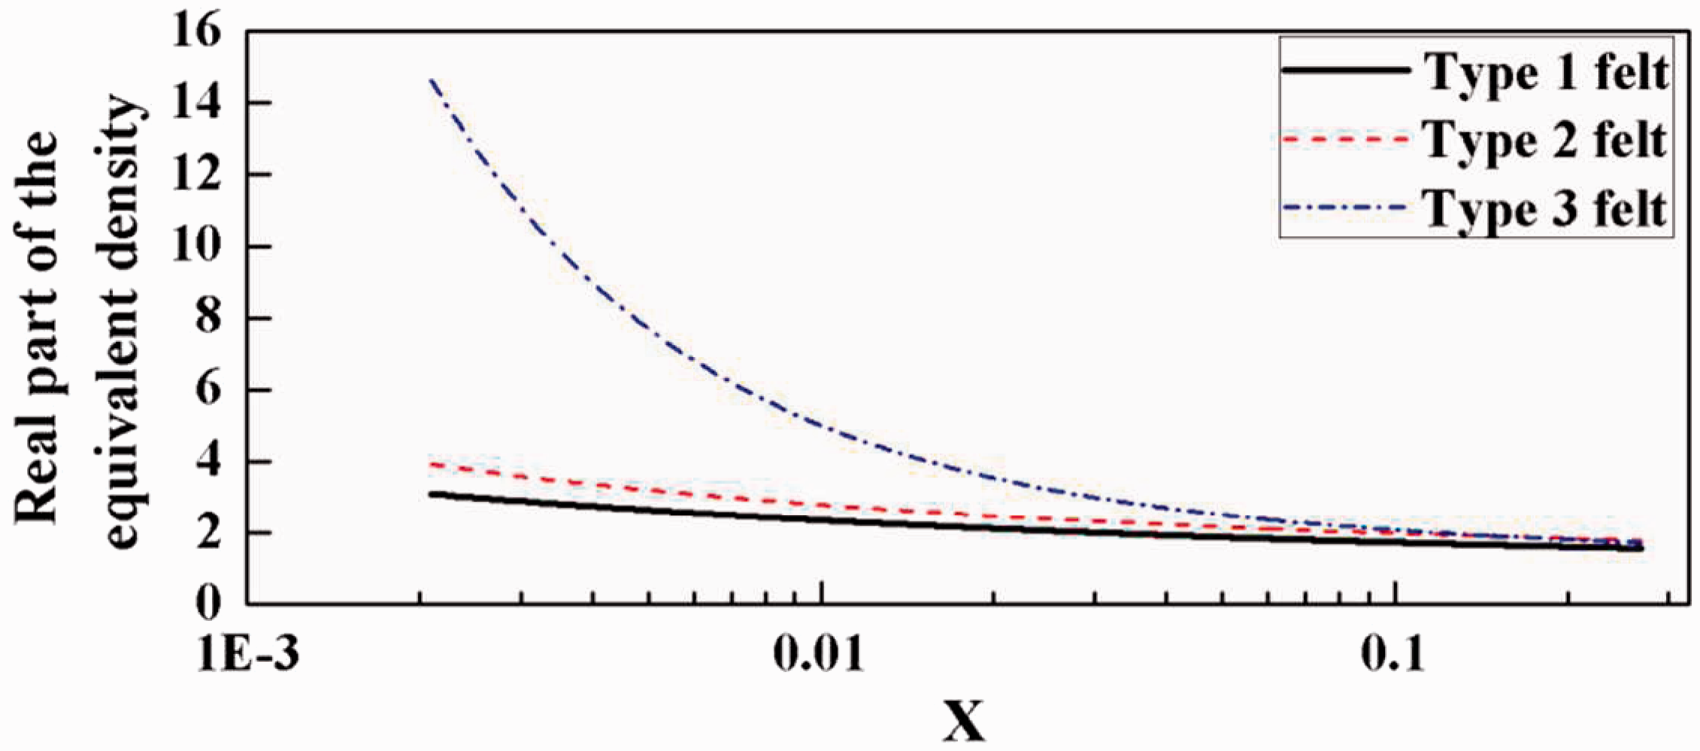
For all three types of felt the values of the equivalent density are positive in the frequency range of interest. This indicates that the new model for jute materials given in this work does not give impossible predictions for the equivalent fluid density. Thus, the PSO proves to be an effective method for the inverse acoustical characterization of the jute material. The main advantage of the method is that it just requires a single measurement of the normal incident sound absorption coefficient with a rigid backing condition. Based on this experimental data, the eight coefficients can be easily estimated for any fibrous material.
Conclusions
In this study, the PSO method is used to determine the values of the eight coefficients of the Dunn–Davern model for jute material. The flow resistivity required for this model is measured for three different jute felts, and then used in this model for the inverse prediction of eight coefficients. The normal incidence sound absorption coefficient is measured, and the data is used for the validation of results obtained from the inverse method. It is found that the results of experimental and model data obtained with the new coefficients agree very well over the entire frequency range. In particular, the misfit in the low-frequency region, which was present in the results of the Delany–Bazley model and the Dunn–Davern model, is corrected using these new coefficients. The nonphysical behavior of the new model for jute material is also studied in this paper and found to be working satisfactorily, as the real part of the complex density remains positive over the frequency range of interest. So the inversion method using PSO gives better results for sound absorption coefficient prediction. This methodology can be extended to inverse acoustical characterization of any porous, fibrous material. provided that the experimental sound absorption coefficient data is available for it.
Footnotes
Declaration of conflicting interests
The authors declared no potential conflicts of interest with respect to the research, authorship, and/or publication of this article.
Funding
The authors received no financial support for the research, authorship, and/or publication of this article.