
Abstract
Easy care for clothing is increasingly important, but the major problem is still the severe wrinkles formed on garments after machine washing. In this research, orthogonal tests and the analysis of variance (ANOVA) at a 95% confidence level were used to determine the critical parameters that affect fabric smoothness. We developed a video capturing and processing system for dynamic measurements of fabric in a top-loading washer to find the relationship between fabric movement and wrinkling performance during laundering. The ANOVA results showed that the smoothness of woven cotton fabrics was mainly affected by the washing load and the drum rotating speed, with p values of 0.000 and 0.036, respectively. Additionally, a relation models for fabric movements suggested by a curvilinear regression analysis indicated that the main causes of fabric wrinkling during top-loading washing were liquor ratio and the centrifugal force imposed on the fabric. The smoothness grade increased with the decrease of washing load and drum rotating speed, since these settings led to lower liquor ratio with a constant water volume and less stress on the fabric. The results of this study provide valuable information for the optimization of washing programs for fabric smoothness.
Top-loading washing machines are known for their high washing performance, and have claimed the maximum market share in Asia. However, they have a very high tendency to wrinkle textiles during laundering, especially those made of cotton fabrics.1–3 The mechanical actions by the centrifugal force of a drum bath and the hydrodynamic flow make the fabrics rotate, bend, and rub against each other, and these mechanical actions are important factors that contribute to wrinkling. However, earlier studies have focused more on the roles of fabric properties and washing parameters on washing performance, and little on the role of fabric movement on wrinkling performance. Previous research on fabric movement in washing machines included the movements in a front-loading washer.4,5 Few studies are available on the mechanism of wrinkling in a top-loading washing machine.
Among the previous studies on the roles of washing parameters and their relationship to the wrinkling performance, Higgins et al. 4 studied the effects of detergent, fabric softener, and fabric structure on the wrinkling of woven cotton fabrics, and they found that the effects were minimal. In recent years, with consumers’ increasing need for easy care, researchers have gradually focused on the optimization of washing programs. Gocek et al. 6 have improved the wrinkling behavior of linen fabrics during washing by selecting suitable levels of temperature, rate of mechanical action, revolution per minute, and water amount applied during laundering. Additionally, Shao and Yuan7,8 have optimized washing programs for cotton shirts by regulating washing parameters, including washing temperature, drying time, rotating speed, and so on. Another noteworthy observation from Yuan’s study is that a fabric’s thickness has an obvious impact on the smoothness of woven cotton fabrics in a front-loading washer. These studies indicate that the washing parameters such as temperature, water amount, rotating speed, spinning time, and fabric thickness are likely to influence the wrinkling of fabrics during laundering. However, the mechanism of the wrinkling process is still not clear.
Among a few studies that have investigated fabric movements in a front-loading washer,4,5,9–11 Park and Yun5,10–12 have analyzed the types of fabric movements inside a front-loading washer to examine the effects of the fabric properties on fabric movement and washing performance. They used high-speed cameras to record and track the fabrics’ outlines. Later, Wang et al. 13 developed a video capturing and processing system for dynamic measurements of a fabric’s wrinkle recovery angle, inspired by the advantages of video sequences in dynamic measurement.
In this study, we identified the significant washing parameters that influenced fabric smoothness using the orthogonal experimental design and analysis of variance (ANOVA) tests. We analyzed fabric movements to explain the relationship between the major parameters and wrinkling through video sequencing. Also, we established regression models to quantify the relationship between a fabric’s smoothness and its movements.
Experimental details
Design of experiment
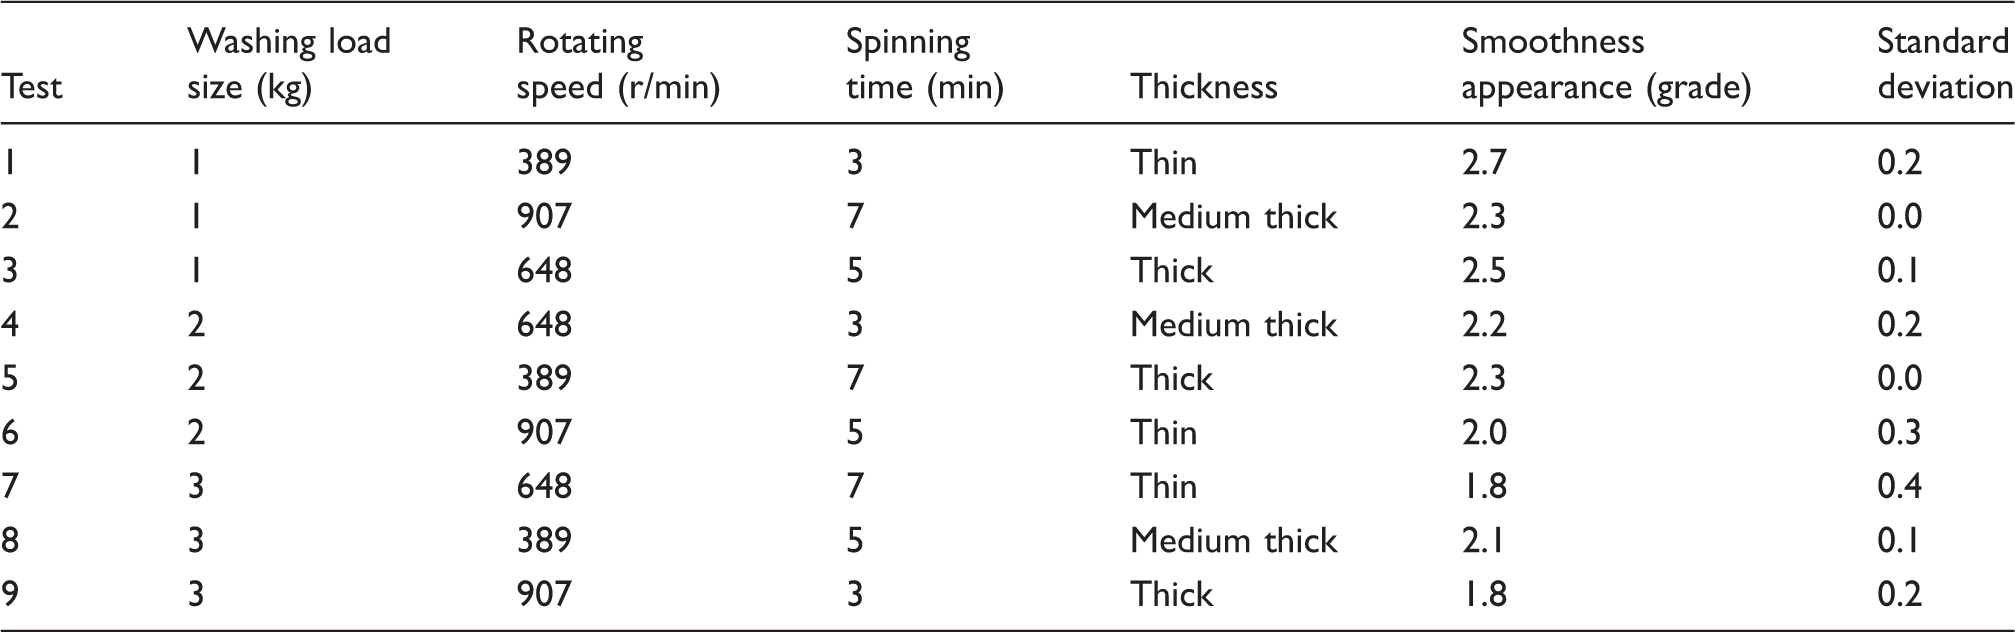
Orthogonal design
Orthogonal design
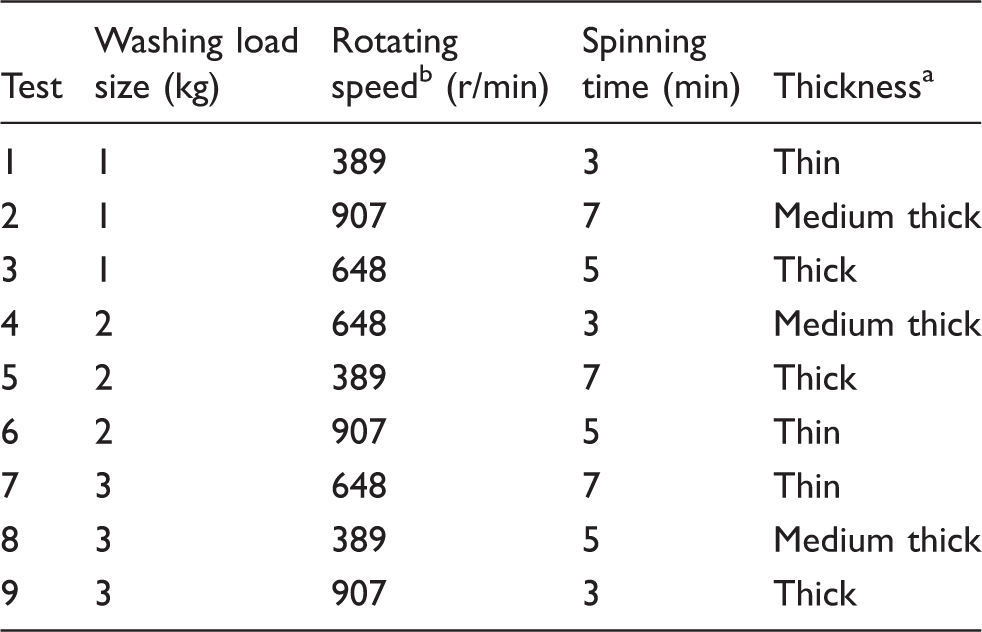
Thin: 0.25 mm; medium thick: 0.25–0.40 mm; thick: > 0.40 mm.
Rotating speed consists of washing speed and spinning speed.
Single factor experimental design
Standard washing procedure

Washing procedures with different rotating speeds

Facilities and equipment
Video capturing and processing system
Inspired by the advantages of video sequencing in dynamic measurements, we developed a video capturing and processing system for the dynamic measurements of fabric movement in a top-loading washer (see Figure 1).
The video capturing and processing system. The system consists of two major parts: a video sequencing acquisition part and an image processing part. The components in Figure 1 are (1) Sony DSC-W290 camera, (2) light source, (3) adjustable support leg, (4) top-loading washer (XQS70-ZY1128, Haier Co. Ltd), and (5) computer.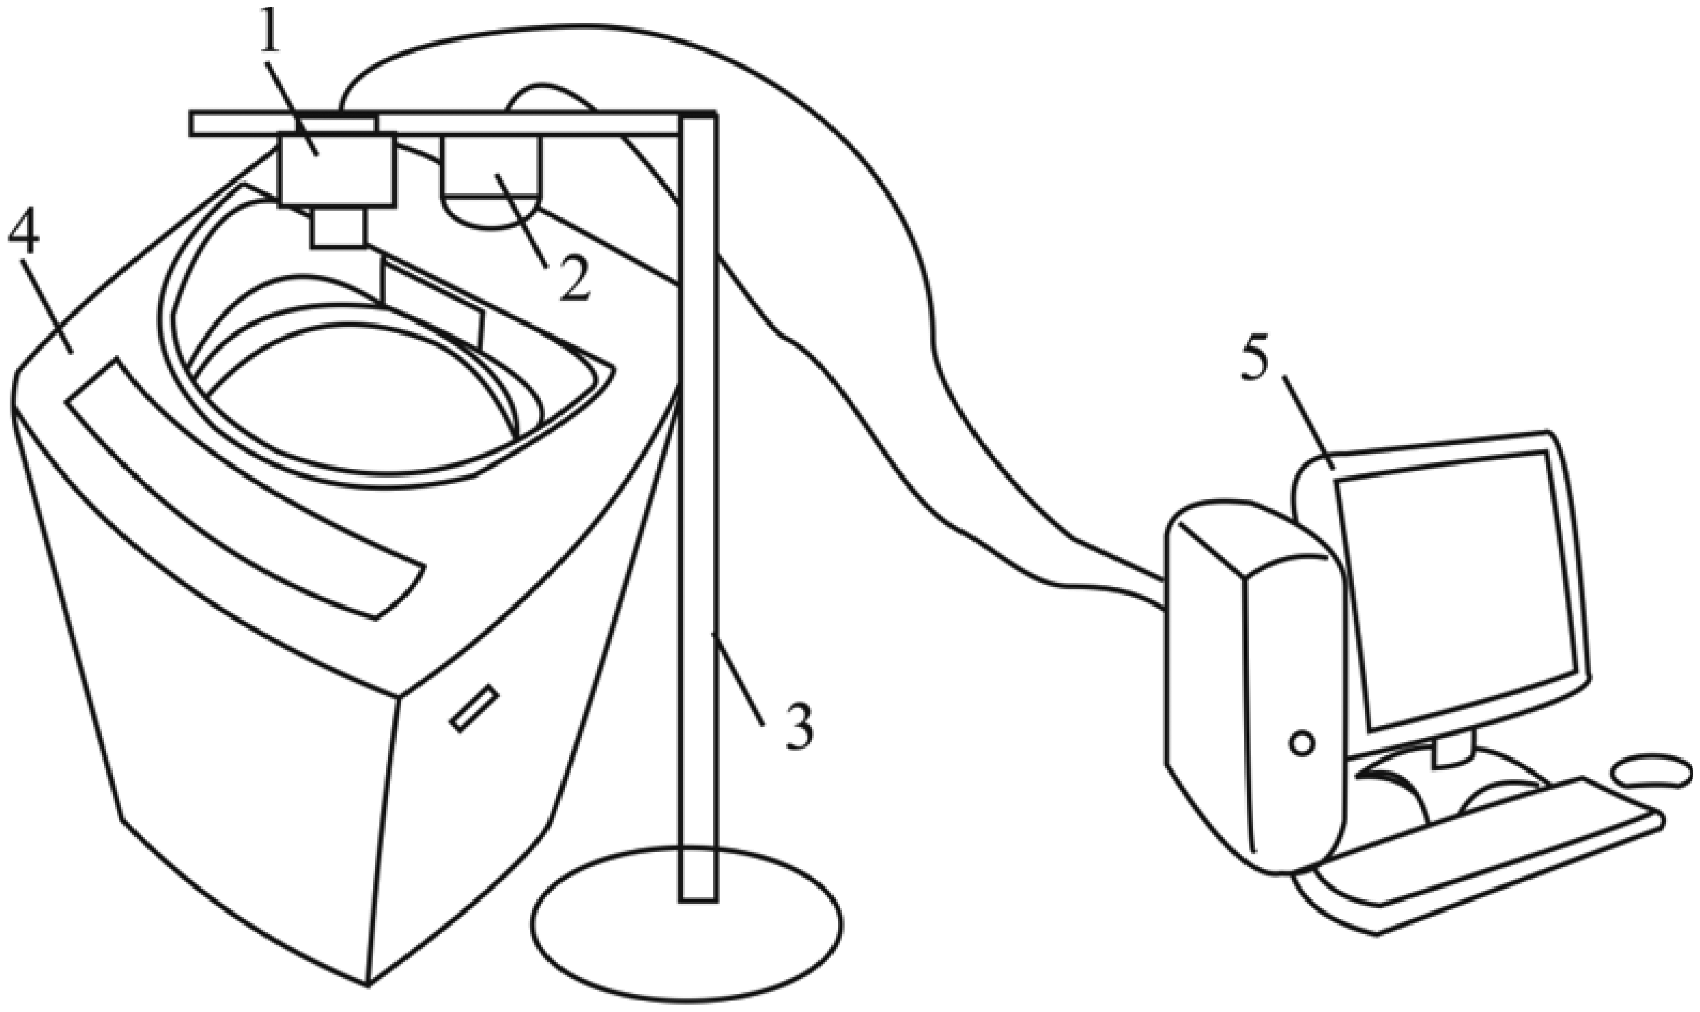
The camera and light source were used to capture fabric washing movements in the top-loading washer. The videos were taken and processed by the Corel Video Studio Pro X5 and CorelDraw 12.0 installed in the computer. The adjustable support leg was used to move the camera and light source to the best position for recording a video. Each fabric movement was analyzed for three seconds (the minimum washing period), and 21 frames were tracked for each three seconds.
The procedure of video frame processing is shown in Figure 2. First, the fabric washing movement was recorded for the minimum washing period (three seconds). Then the video was decomposed to 21 frames to track the outline of the fabric in each frame. Finally, all of the outlines in one washing period were added together to create the fabric’s movement image. The video of the fabric washing was converted by means of the outlines and the fabric’s center of gravity in order to analyze the fabric’s movements.
Image processing of fabric washing movement. (a) Identification of the washing region. (b) Washing region. (c) An outline. (d) Fabric center of gravity. (e) Pattern overlay. (f) Movement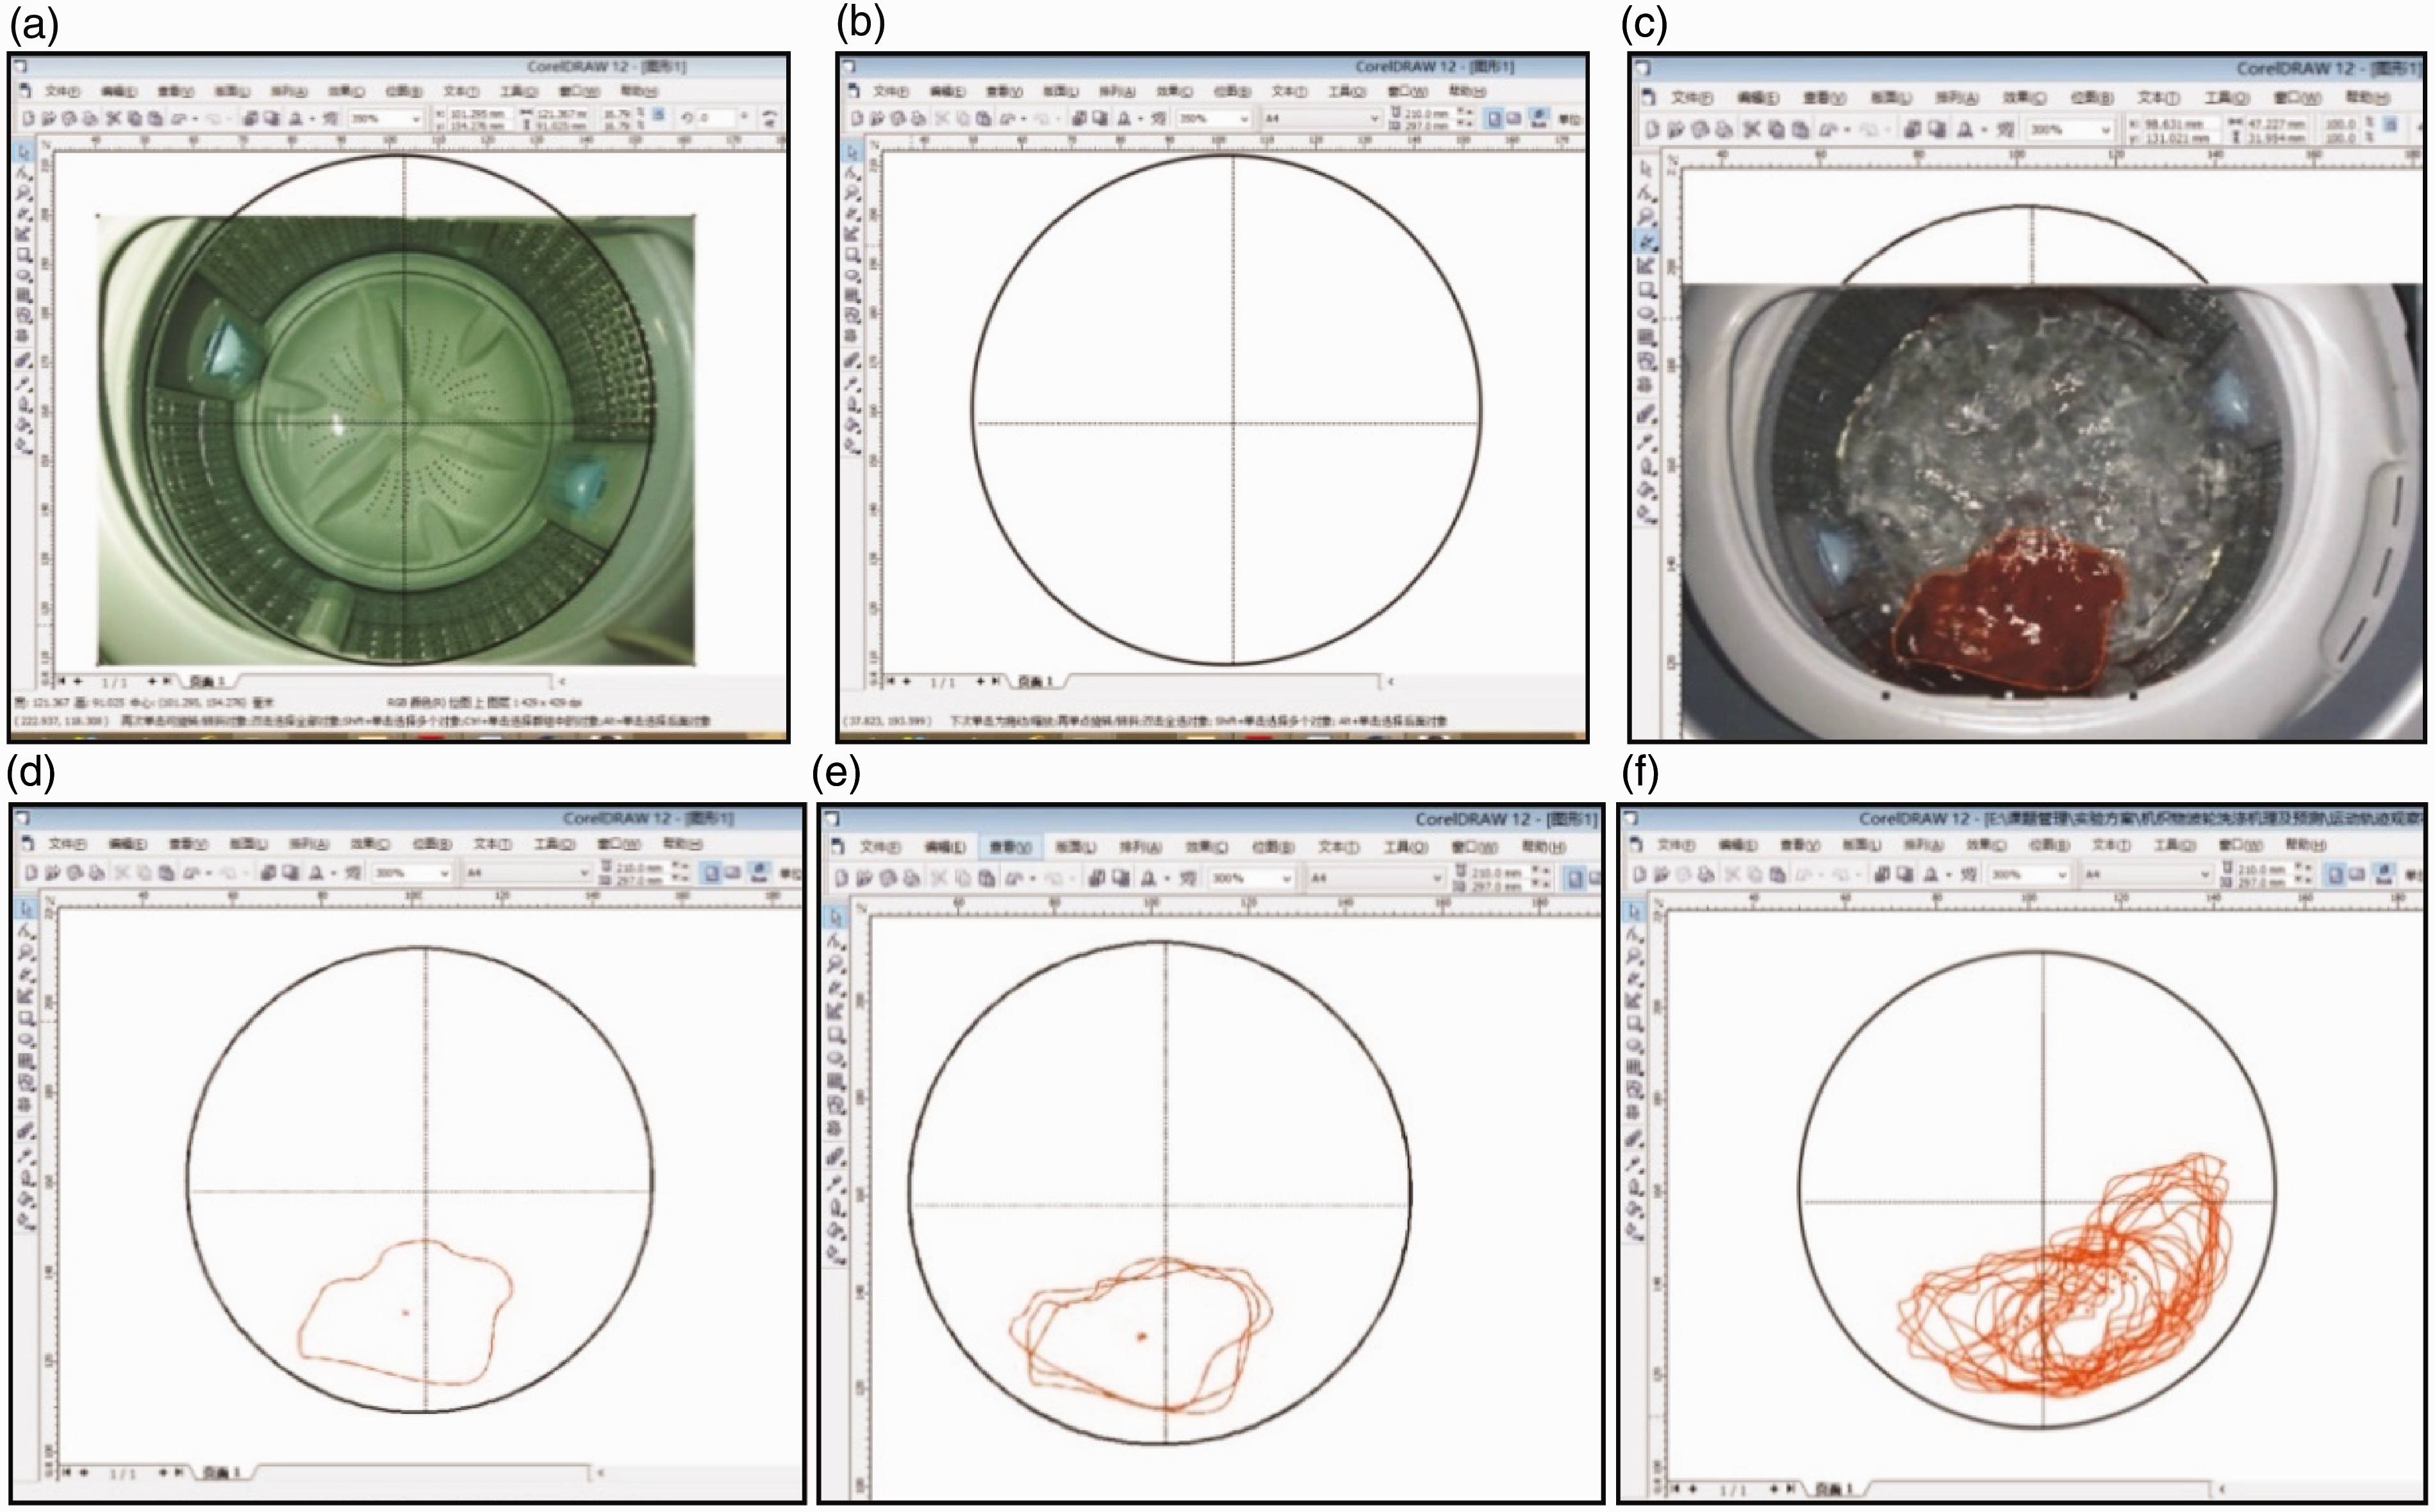
Washer
The laundering procedure was completed using a top-loading, automatic washing machine with washing capacity 7.5 kg made by Haier (Haier XQS70-ZY1128, Qingdao Haier Co. Ltd.) based on ISO6330:2012.
Power measurement
A power measuring meter (CLM221, Christ-elektronik) was used to measure the electric energy consumption for each washing cycle. This is the energy source of the fabric movement based on the law of conservation of energy.
Materials
Characteristics of the cotton specimen
The detergent used in the experiments conforms to the requirements of IEC 60456. 15 The composition of the detergent were 77% base powder with enzyme and foam inhibitor, 20% sodium perborate tetrahydrate, and 3% bleach activator tetra-acetylethylenediamine (TAED).
Evaluation of smoothness
All specimens were line-dried under standard atmospheric conditions for 4–24 hours, and the smoothness of the specimens was evaluated based on AATCC 124:2010 16 in a standardized inspection booth.
Statistical analysis
IBM SPSS Statistics 19.0 (Predictive Analytics Software, IBM, USA) was applied to analyze the relationship between the washing parameters, fabric movements, and fabric wrinkling performance. Statistically significant washing parameters were determined by ANOVA. Curvilinear regression analysis was also used to derive the relationship models between movement indexes and smoothness appearance.
Results and discussion
Effects of washing machine parameters on the fabric’s smoothness appearance
Results of orthogonal test
In order to study the relationships between the washing parameters and fabric wrinkling, the factors that are significant in affecting the fabric smoothness appearance are determined by ANOVA. From the ANOVA test, washing load and rotating speed are found significant in differentiating the smoothness appearance at a 95% confidence level (p < 0.05).
After determining the significant factors, we investigated the fabric movement to study the relationships between washing parameters and fabric wrinkling.
Analysis of fabric movements during washing
The top-loading washing process is a complex multi-phase and multi-scale process, coupled with three-dimensional motions of the fluid and cloth, large and complex cloth deformation, cloth permeability, and the unsteadiness of fluid motion. Although two-dimensional observation cannot capture the vertical tumbling motion of the cloth pieces in a vertical-axis washing machine, it is recognized to be highly correlated with the effectiveness of the washing process. 17
The relationship between washing load, fabric movement and wrinkling
In order to analyze the washing load influence on wrinkling, we analyzed the movements of one piece, two-piece, and three-piece specimens (Figure 3). All washing procedures were common and kept as much the same as possible, apart from the variable parameters such as rotating speed and washing load. The washing programs are shown in Table 2.
Fabric movement with different washing loads: (a) 1-piece specimen, 389 r/min; (b) 2-piece specimen, 389 r/min; (c) 3-piece specimen, 389 r/min; (d) 1-piece specimen, 648 r/min; (e) 2-piece specimen, 648 r/min; (f) 3-piece specimen, 648 r/min.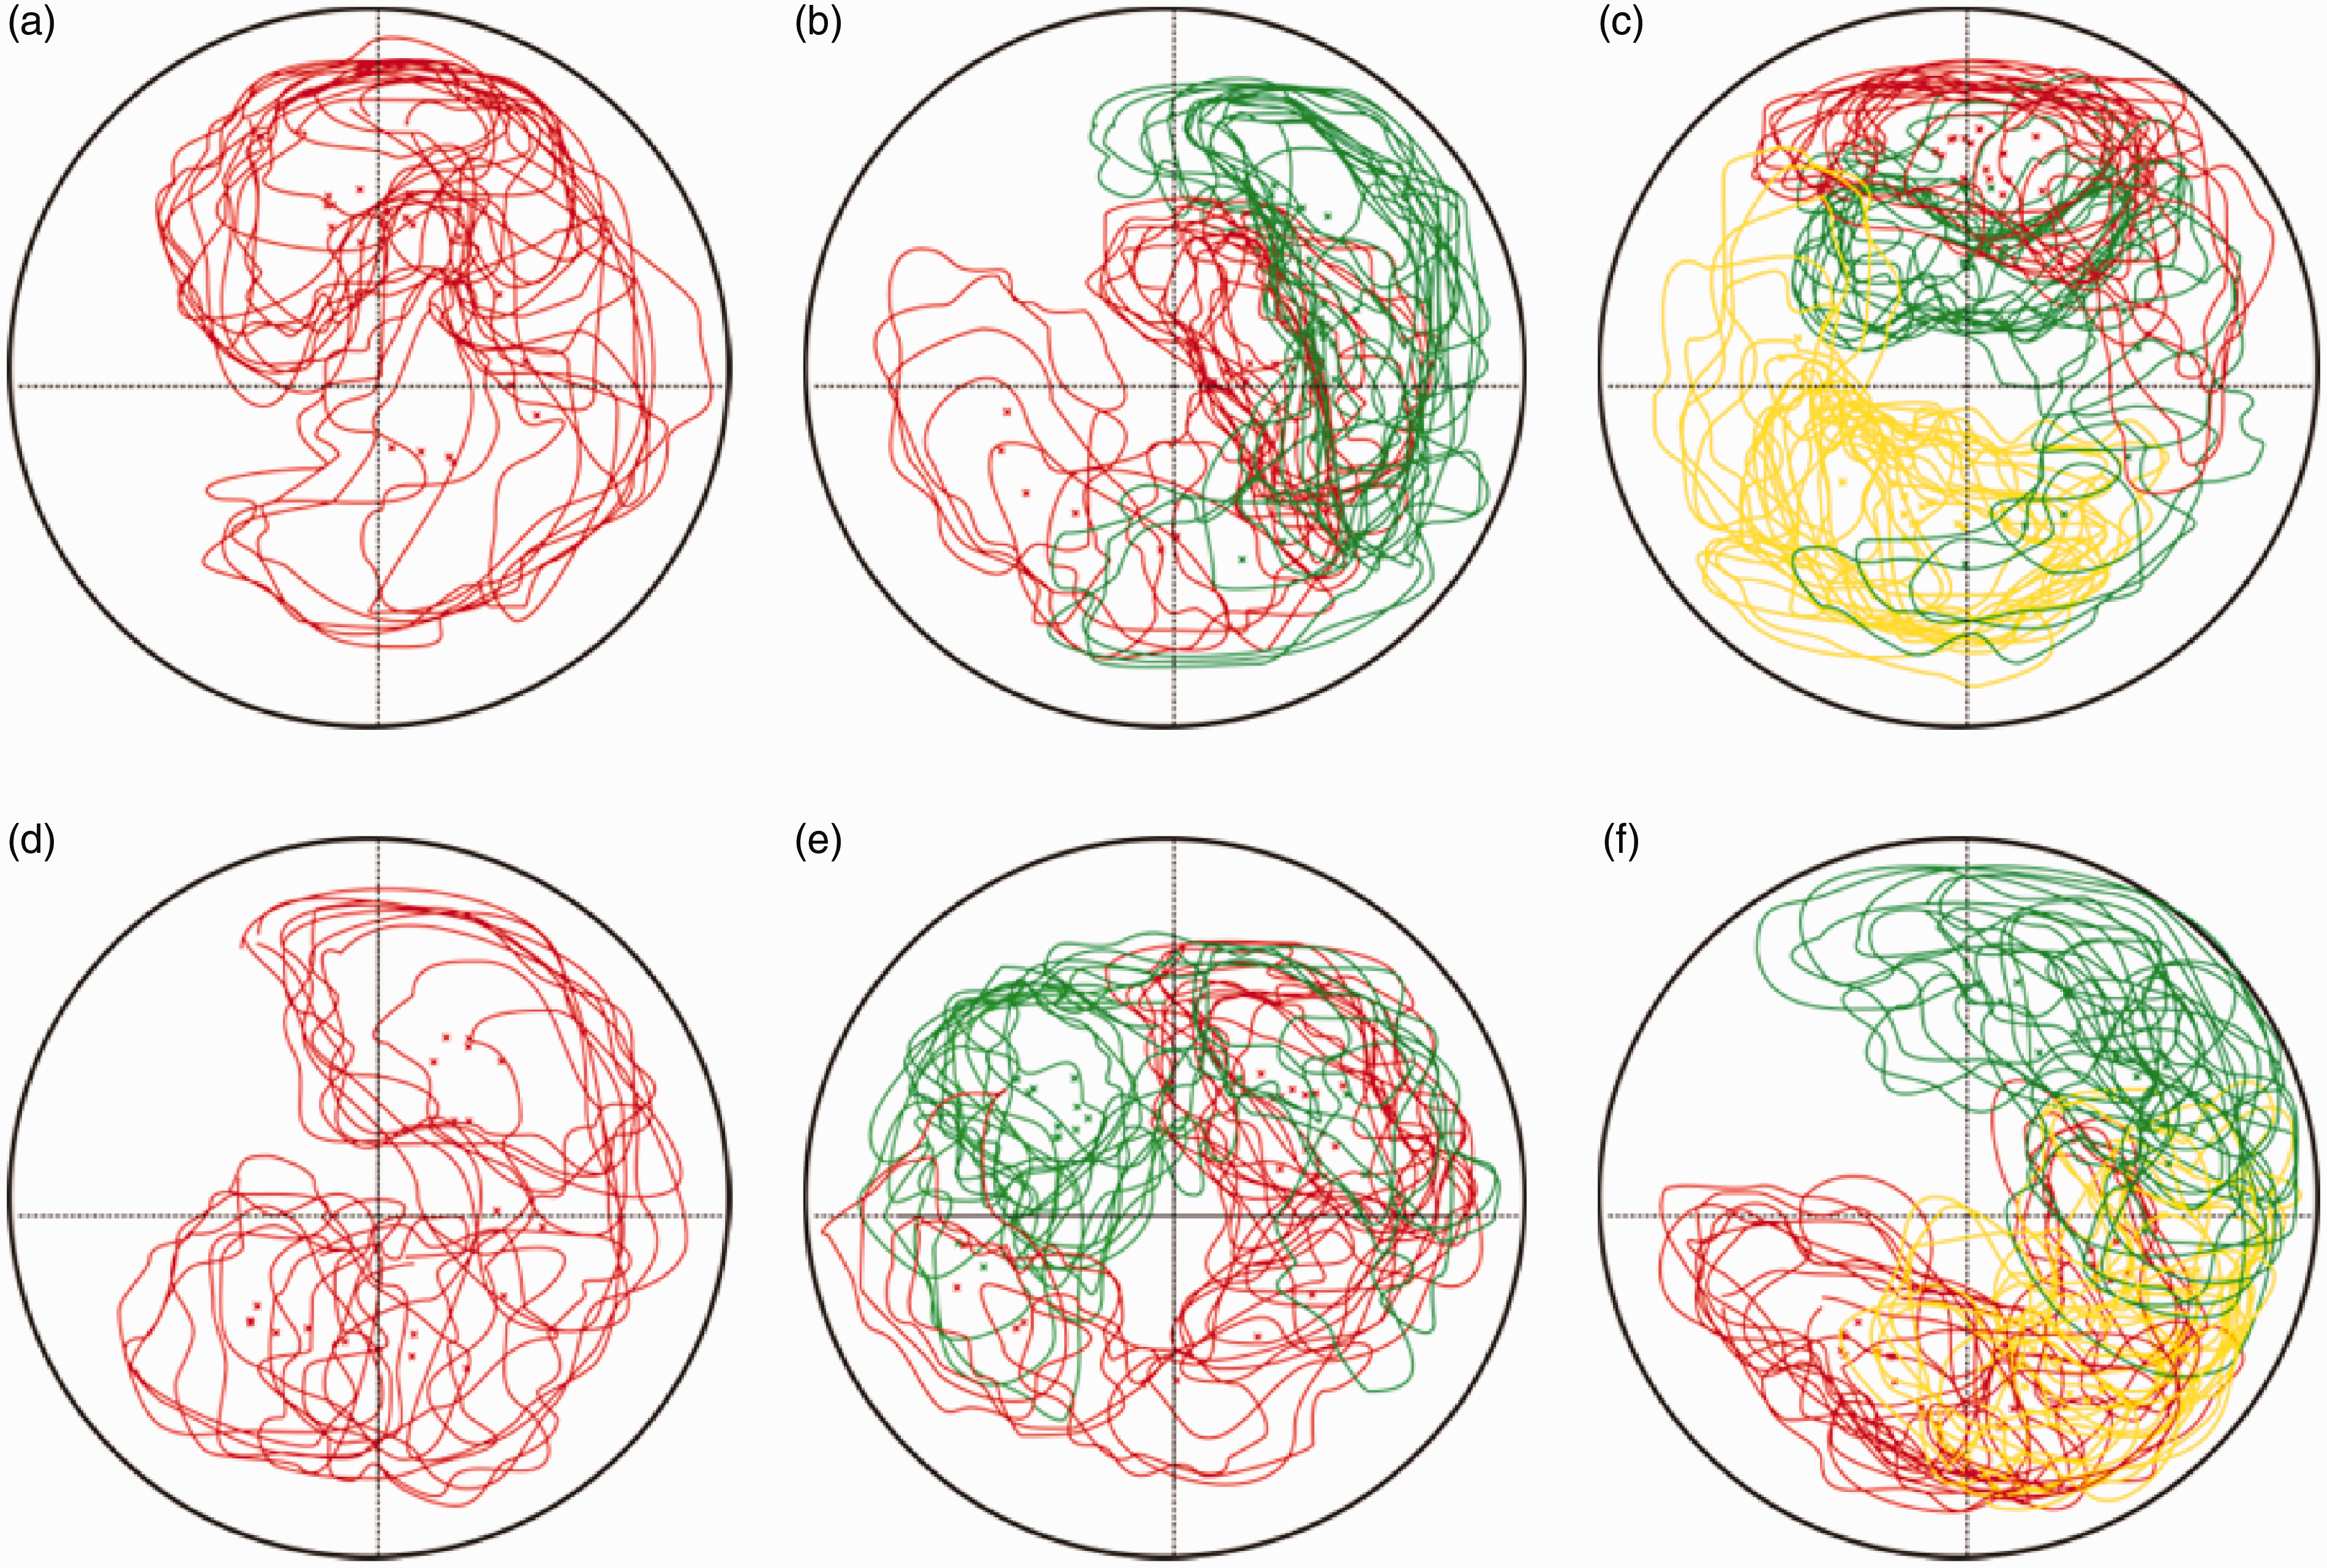
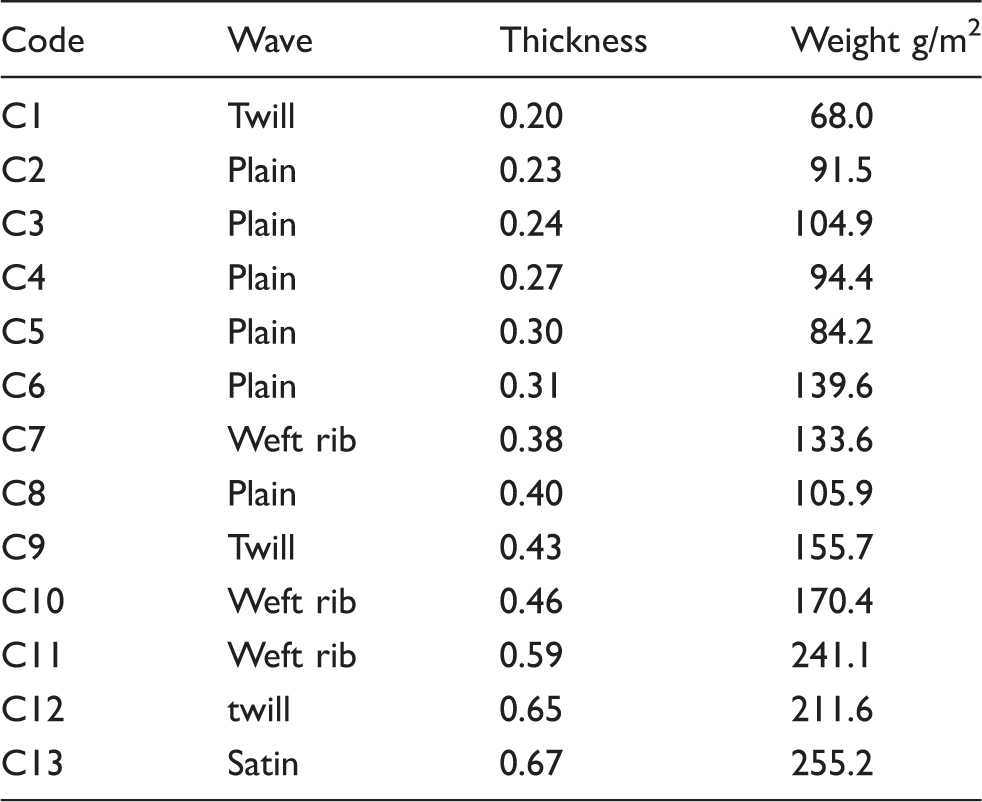
Figures 3(a)–(c) represent fabric movement during the washing procedure with a 389 r/min rotating speed and a washing load of one-piece, two-piece, and three-piece specimens, respectively. Comparing the red specimen in different loading conditions, it is clear that as the number of specimens increases, the distance and speed of the fabric movement decrease. This phenomenon could be explained by the fact that the mechanical action imposed on fabric that leads to wrinkling consists of hydrodynamic and compressional forces from the inner drum and other textiles. Figures 3(d)–(f) show movements at the rotating speed of 648 r/min, and the trends of fabric movement in distance and speed are the same as those in Figures 3(a)–(c).We also tested the smoothness of woven cotton fabric with different washing loads as well as the output energy of the motor (as shown in Figure 4). The specimens used to evaluate the smoothness were C6 (as shown in Table 4).
Smoothness appearance with washing loads from 1 kg to 4 kg at rotating speed of 389 r/min.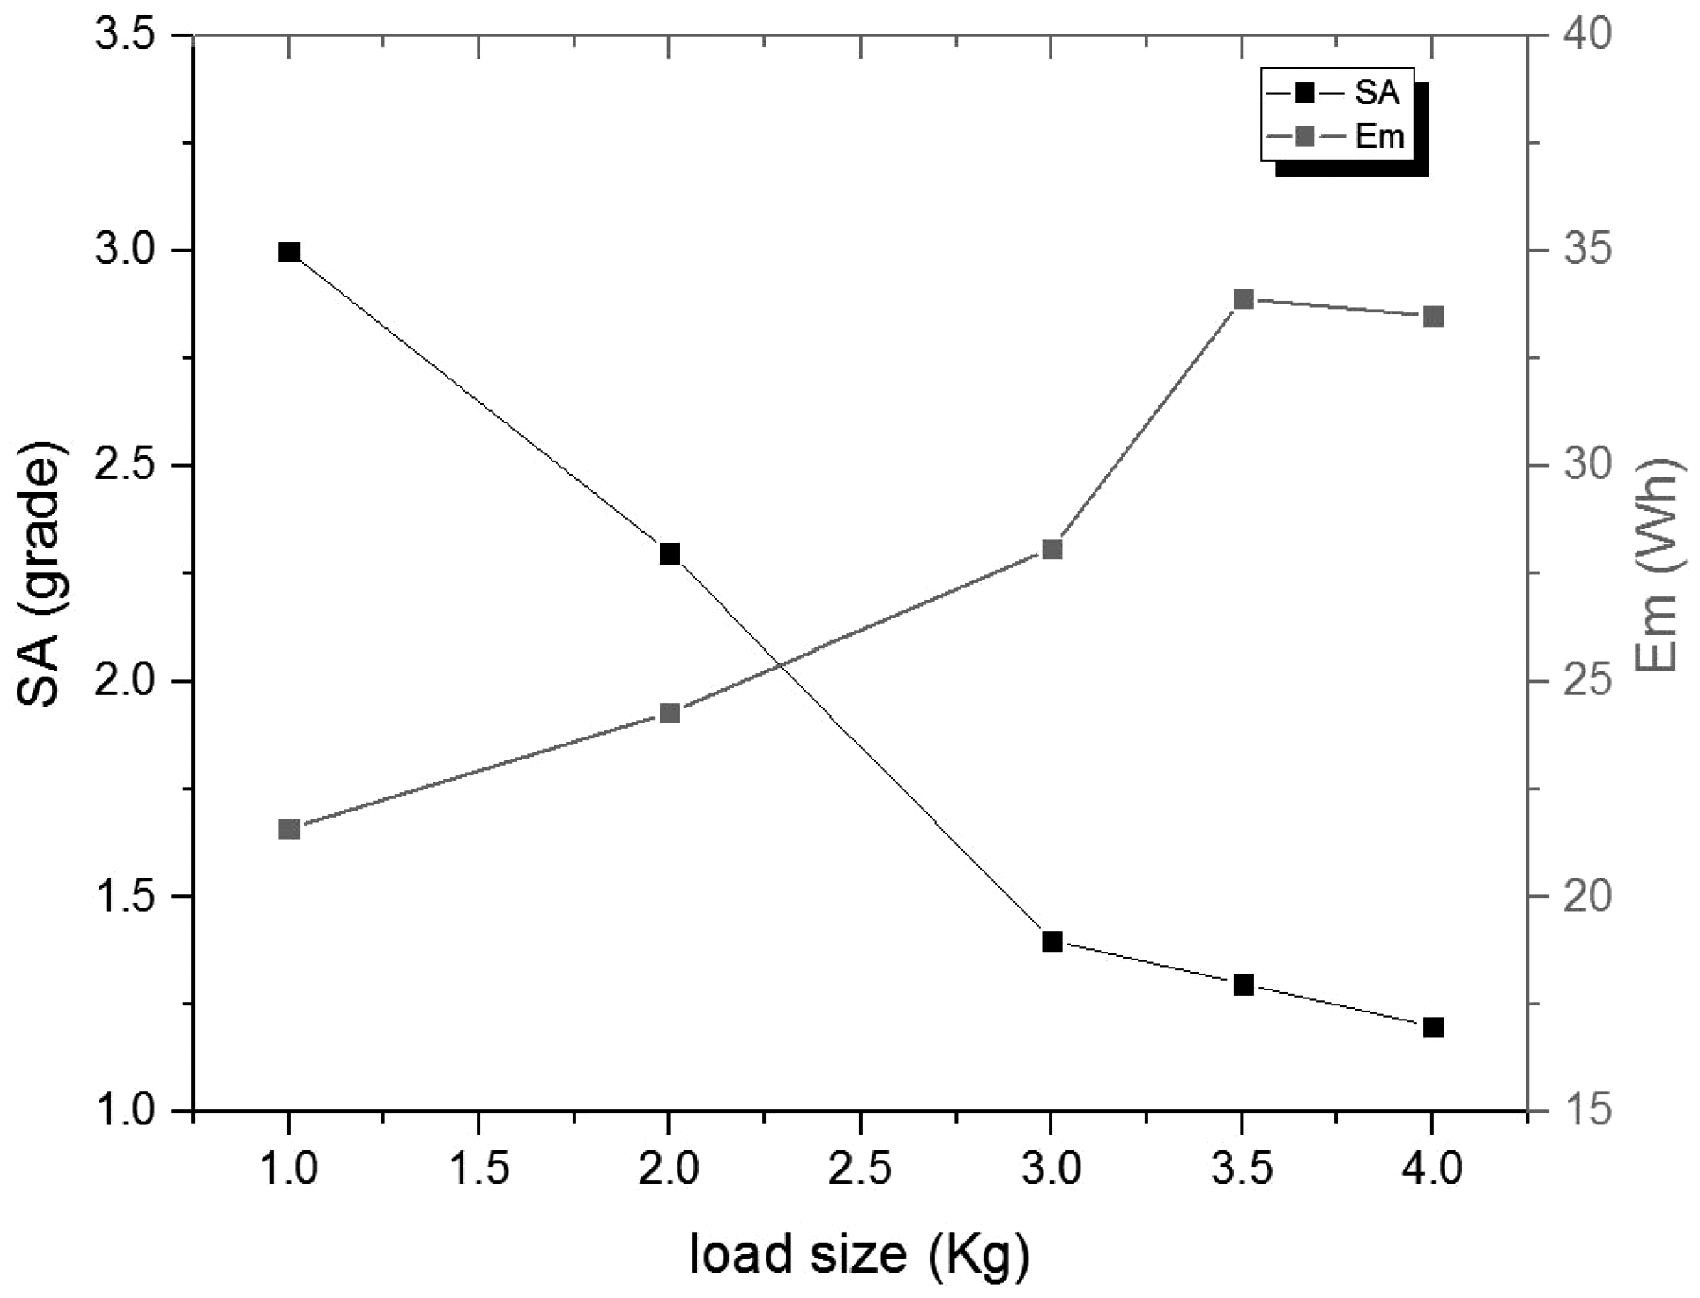
According to Figure 4, we can conclude that with increasing washing load, fabric smoothness decreases, and fabric wrinkles more easily. However, when the washing load is above 3.5 kg (7 kg washing capacity), the smoothness grades begin to flatten around grade 1. This happens because there is not enough space for fabrics to spread when the wash load is over 3.5 kg. It is possible that compressional forces from the inner drum and other fabrics are the main reasons for wrinkling. It indicates that (1) a 50% washing load is enough for woven cotton fabrics to wrinkle severely, and (2) the electric energy consumption (
The relationship between rotating speed, fabric movement and wrinkling
After determining the relationship between the washing load and wrinkling, we analyzed the effects of the rotating speed on the smoothness as well. Similarly, we investigated the movements for one specimen with the rotating speed changing from 259 r/min to 1036 r/min (Figure 6). All washing procedures were common and kept as much the same as possible, apart from the rotating speed, as shown in Table 3. The specimens used to evaluate the smoothness were C6 (as shown in Table 4).
Figures 5(a)–(g) represent fabric movements with rotating speed changing from 259 r/min to 1036 r/min. We can draw the following obvious conclusions: (1) the higher the rotating speed, the longer the distance the fabric moves; (2) when the rotating speed is 259 r/min, the fabric is almost static. This occurs because the force imposed on the fabric is smaller than it is when the rotating speed is higher. This phenomenon can be explained by the fact that when the drum rotation is faster, the hydrodynamics imposed on the fabric are stronger. To analyze the relationship between fabric movement and wrinkling, we tested the smoothness of woven cotton fabrics with different rotating speeds as well as the output energy of the washer motor (as shown in Figure 6).
Fabric movement with different rotating speeds: (a)259 r/min; (b) 389 r/min; (c) 518 r/min; (d) 648 r/min; (e) 777 r/min; (f) 907 r/min; (g) 1036 r/min. Smoothness appearance with rotating speed from 259 r/min to 1036 r/min.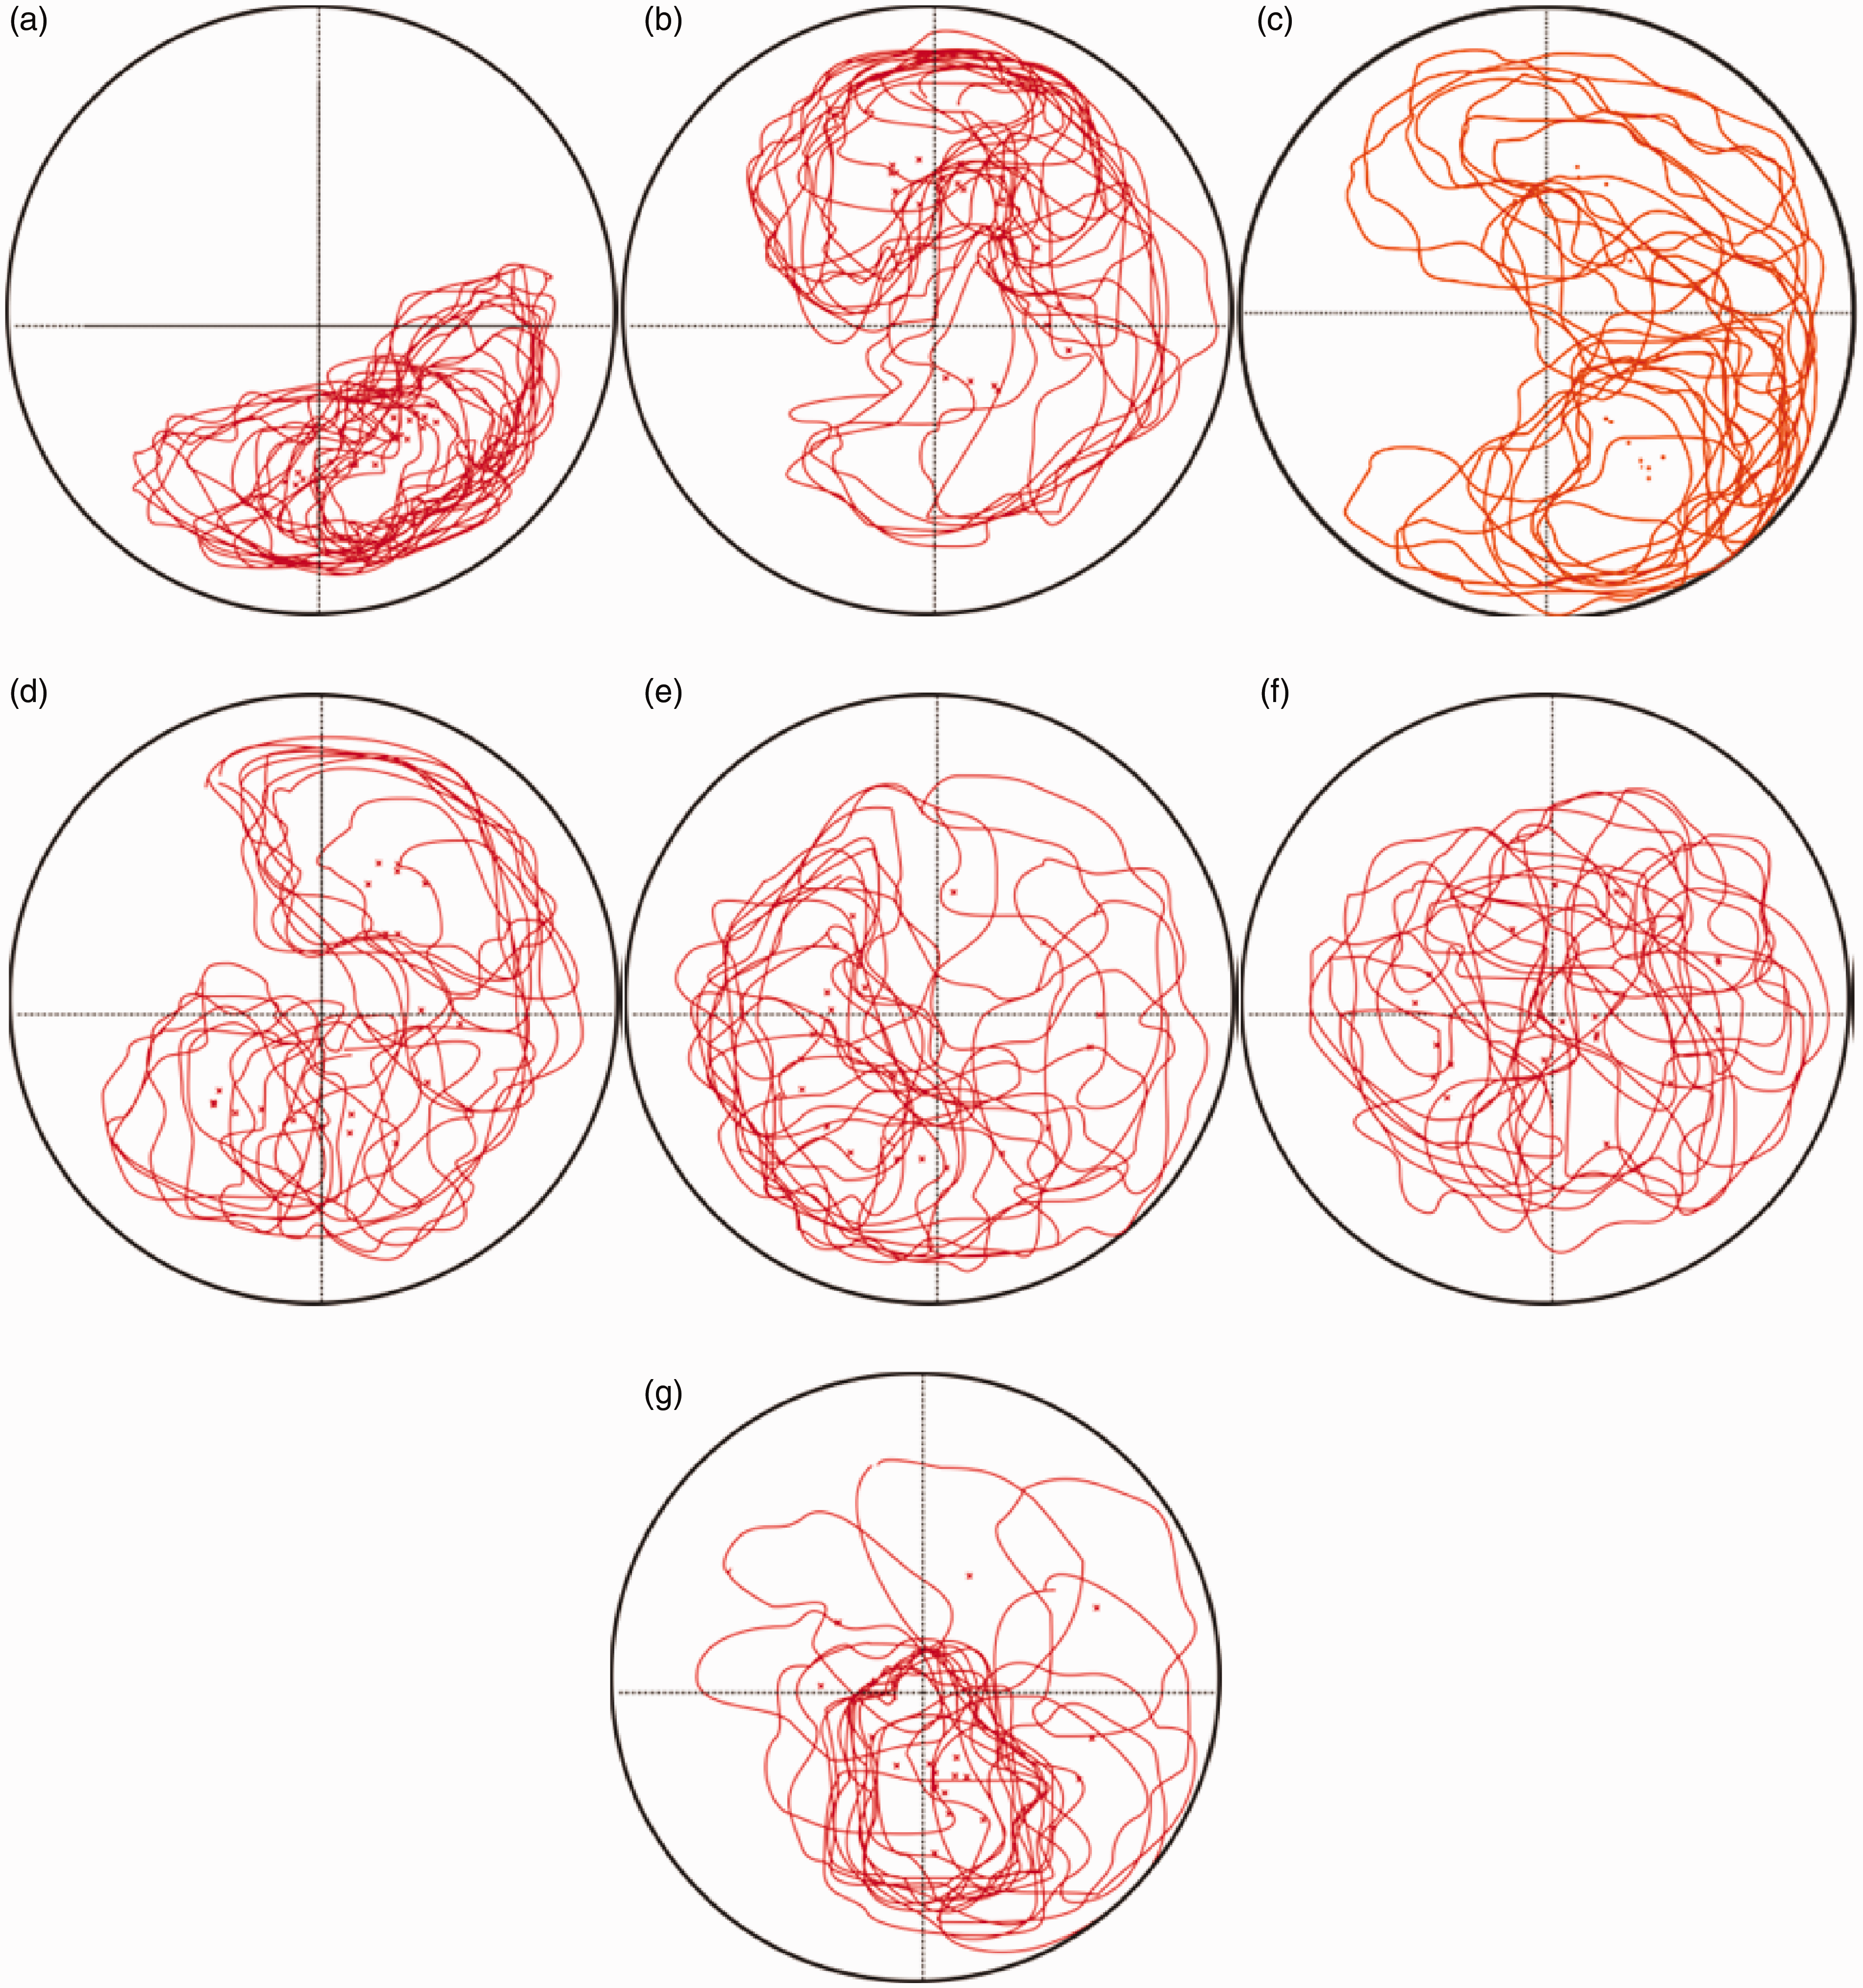
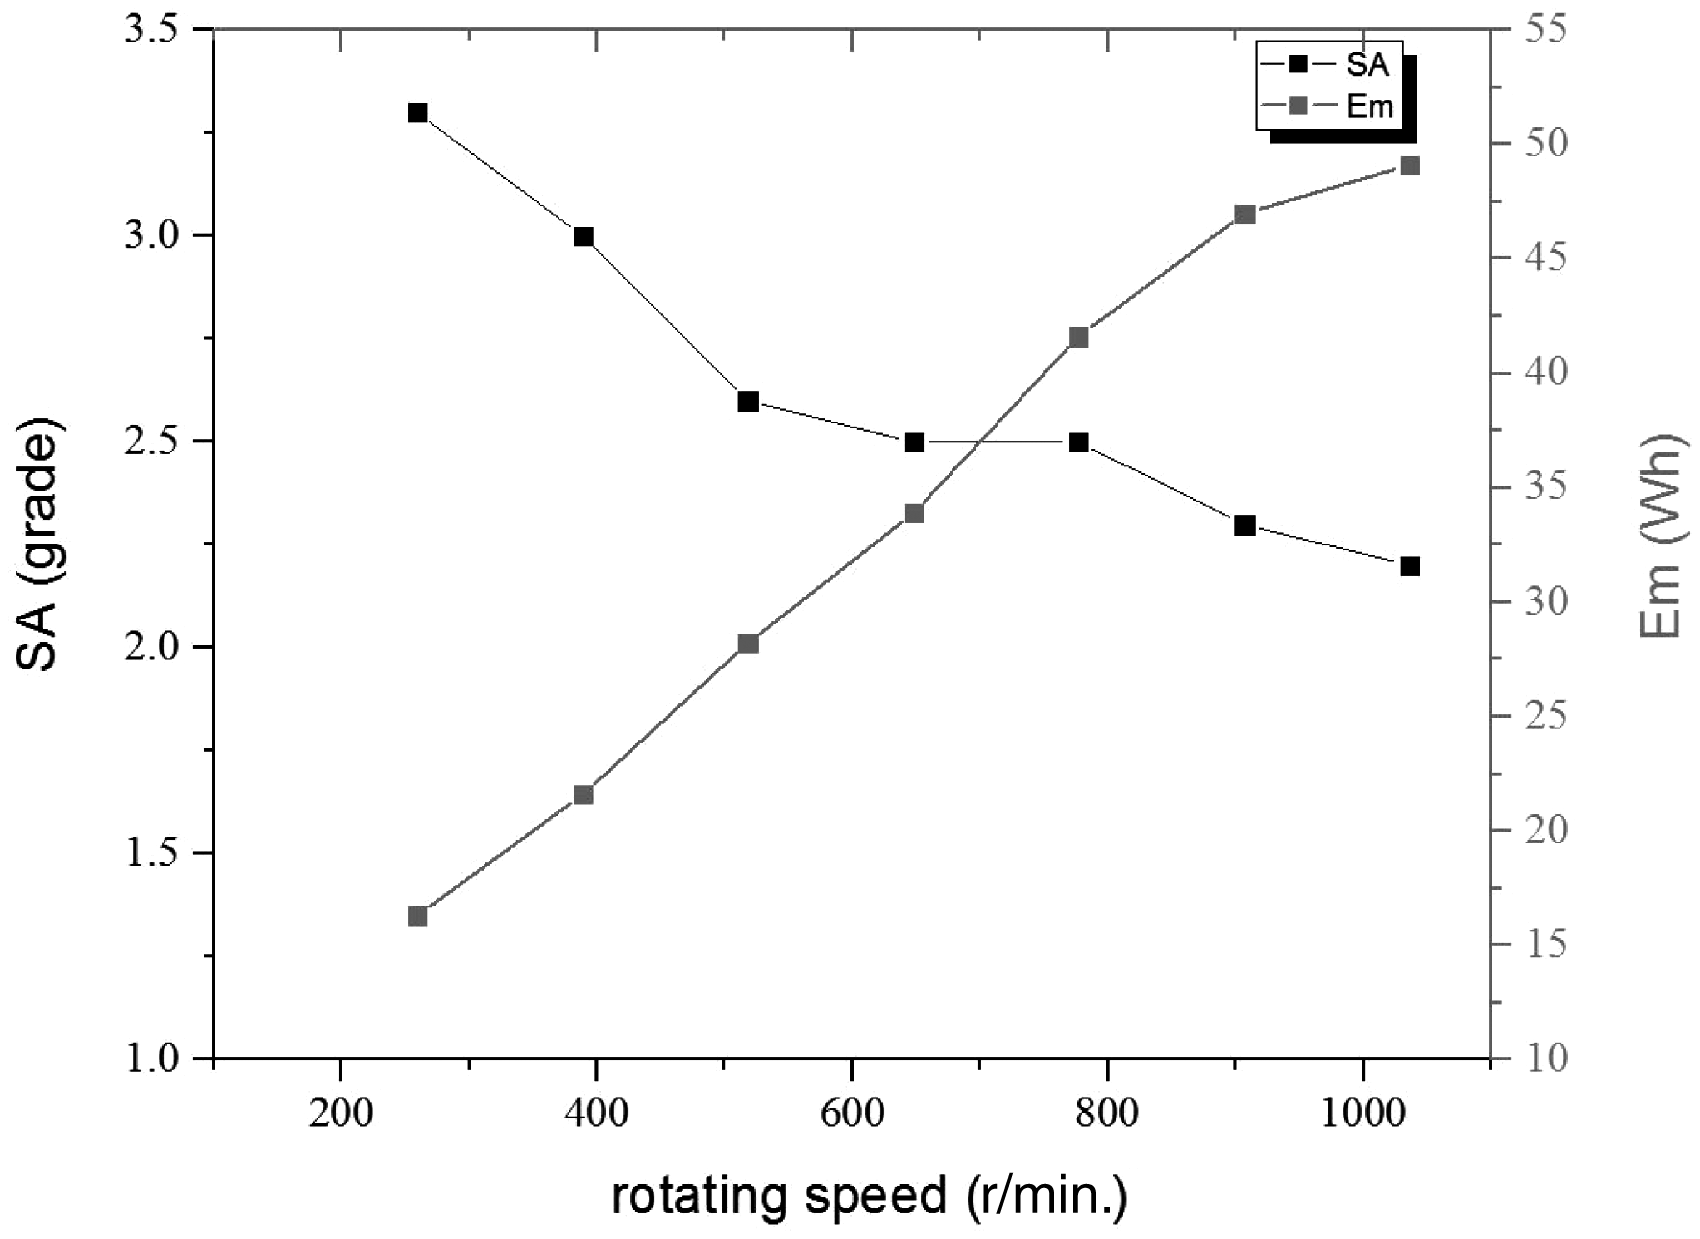
Figure 6 indicates the following: (1) a faster rotating speed with a higher electric energy consumption tends to have a lower smoothness grade after washing; (2) the smoothness begins to flatten around grade 2 when the rotating speed is above 907 r/min under the premise that the washing load is kept low (less than 50 g, weight of one piece of fabric). As shown in Figure 4, when the washing load increases from 1.0 kg to 4.0 kg, the smoothness decreases from grade 3.0 to grade 1.2 at a rotating speed of 389 r/min. The p values of washing load and rotating speed are 0.000 and 0.036, respectively, through ANOVA. We can conclude that the wrinkling performance is affected more by the washing load than by the rotating speed. Moreover, the electric energy is also positively related to rotating speed as shown in Figure 6, and we can use the electric energy consumption of a washing cycle (
Correlation between fabric movement and smoothness
We have conducted a curvilinear regression analysis to test the assumption that fabric movement during washing is influenced by the washing parameters, and consequently, that fabric movement determines the wrinkling of the fabric. Moreover, it is also assumed that (1) the frictional losses are negligible and (2) that the fluid and cloth velocities are equal.
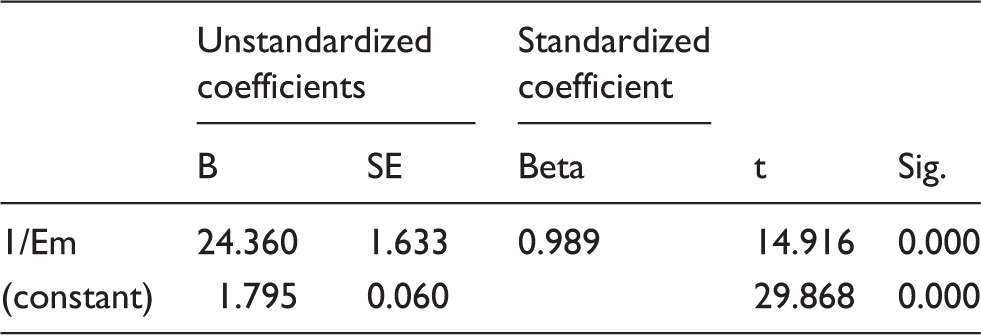
Figure 7 shows the relationship between smoothness and electric energy consumption during a washing cycle. From Figure 7, we can see that the greater the energy the motor consumes, the lower the smoothness grade is. This can be explained by the fact that an increased washing load needs more energy to keep fabrics and water moving at the same rotational speed. Since getting the quantitative data of washing movement is difficult, we introduce electric energy consumption of a washing cycle ( Nonlinear curve fit between smoothness appearance and Em (with changing load size). Parameters of nonlinear curve fit with different washing loads Note: dependent variable is SA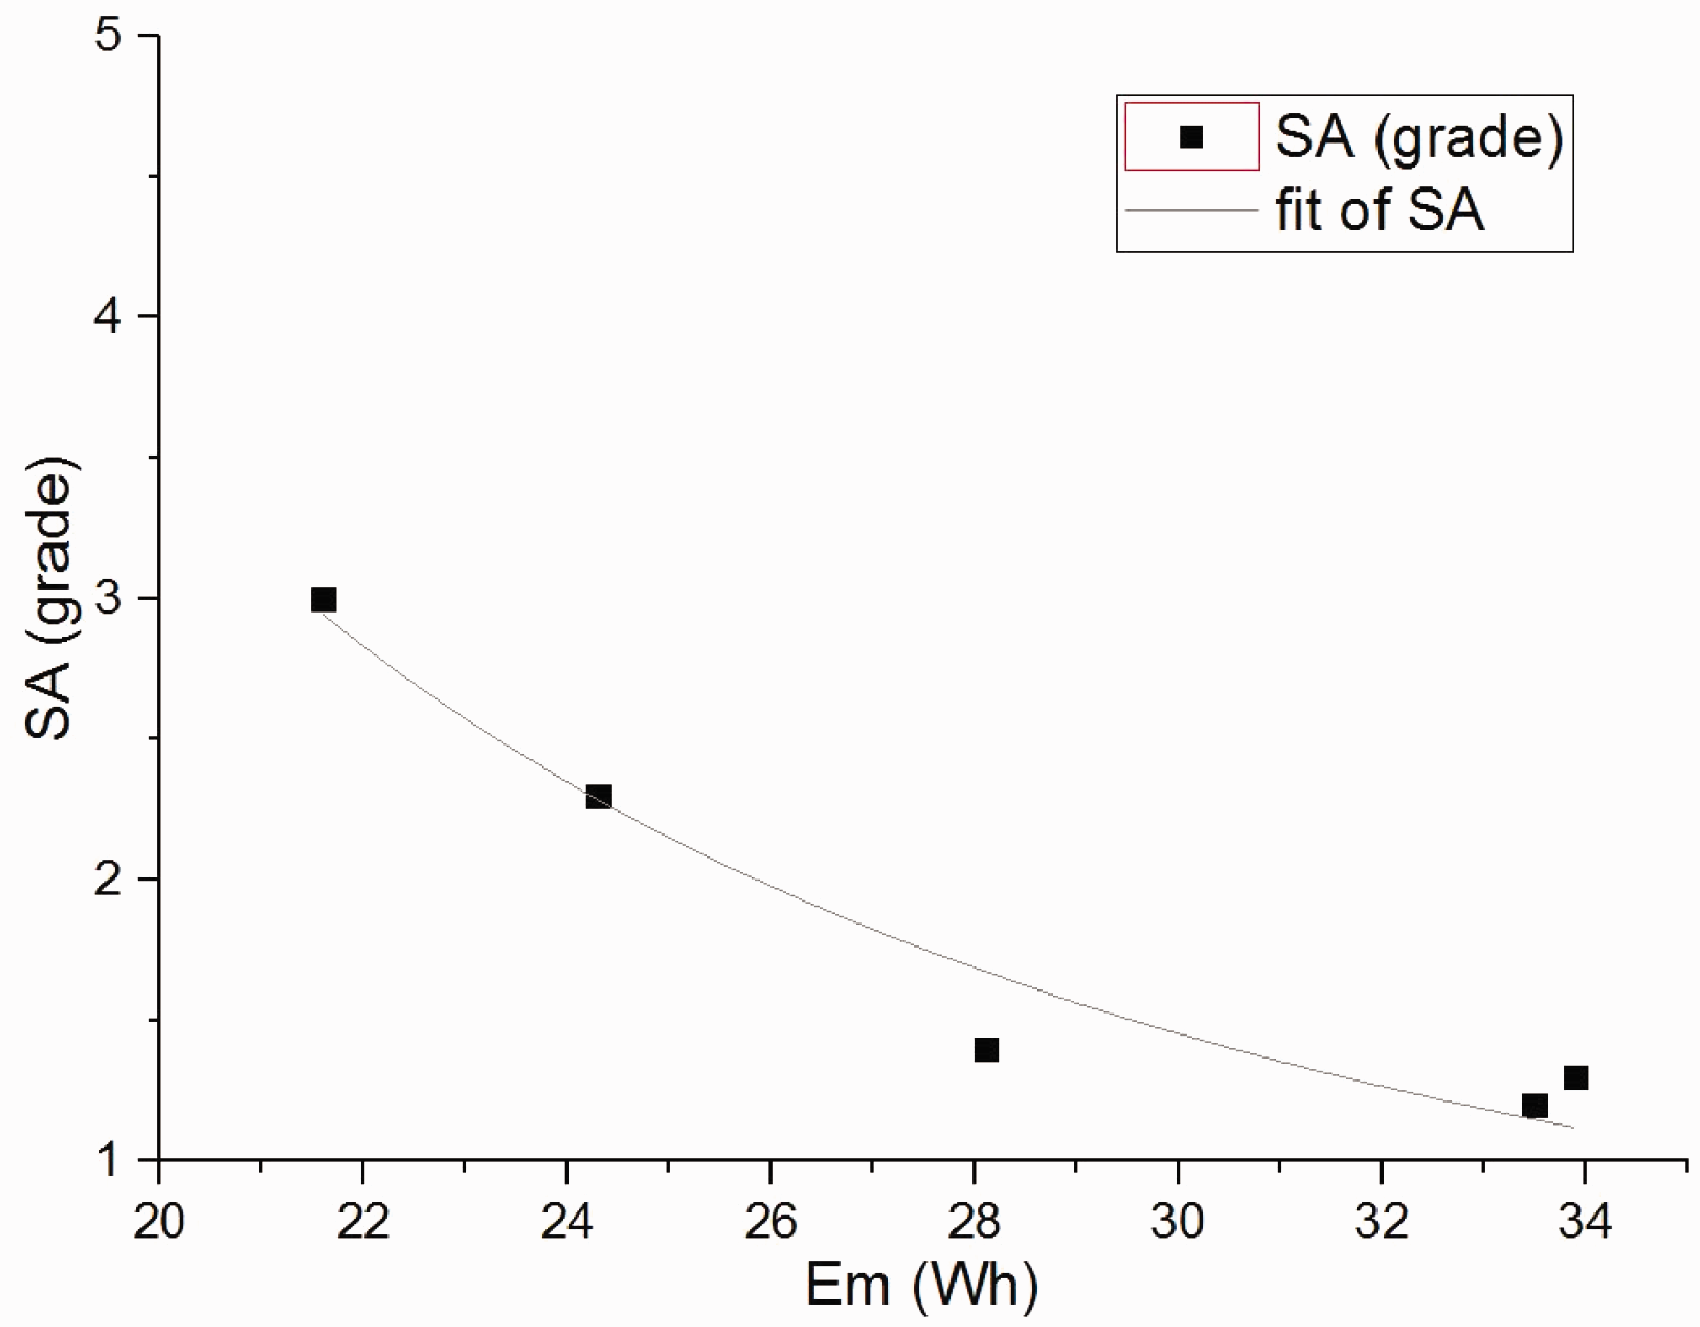
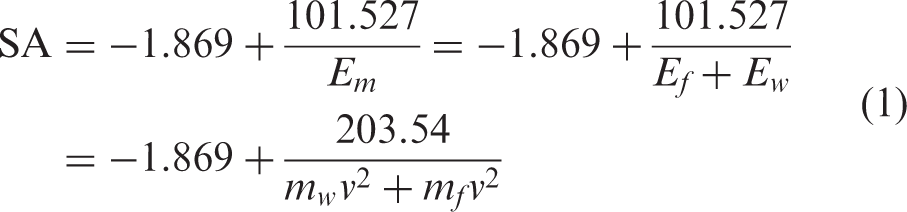
Substituting the unstandardized coefficients, B, into the inverse function model, we have equation (1), as follows
The water volume for the washing procedure is 
Substituting equation (2) into equation (1), we can obtain the relationship between smoothness and liquor ratio, f, as follows
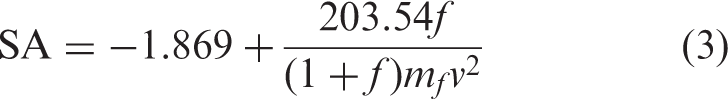
Equation (3) shows a negative correlation between smoothness and washing load, which indicates that the higher the washing load is, the lower the fabric smoothness will be under the same liquor ratio constant. Washing procedures with greater washing loads will generally lead to higher liquor ratio with a constant water volume; moreover, higher liquor ratio makes fabric more likely to bend or deform under the stress from the cylinder wall and other fabrics in the inner drum. Wrinkling can be reduced by lowering the “liquor ratio” through methods such as reducing washing load, increasing water volume, and such like.
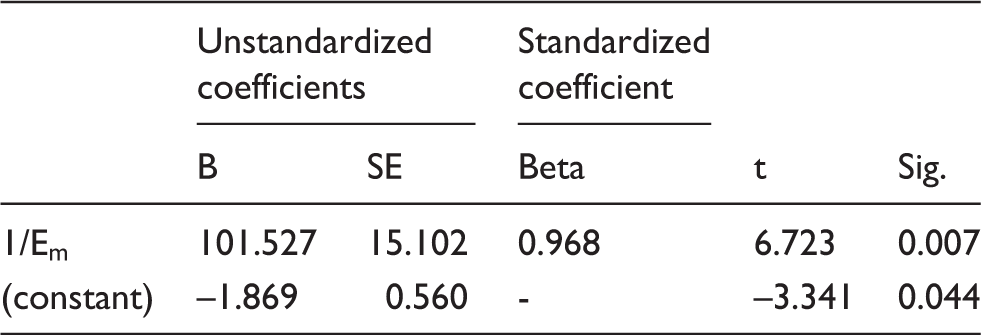
Figure 8 shows the relationship between smoothness and electric energy consumption during washing when the rotating speed changes. From Figure 8 we can conclude that the smoothness decreases gradually with the increase of output energy of the motor because of the rotating speed changing. The effect of washing load on smoothness is more significant than that of rotating speed, from comparing Figures 7 and 8. The output energy of the motor as an indicative variable was introduced to explain why the increase of rotating speed has a negative influence on smoothness. The model coefficients for smoothness and fabric movements under the influence of rotating speed are shown in Table 7.
Nonlinear curve fit between smoothness appearance and Em (with changing rotating speed). Parameters of nonlinear curve fit with changing of rotating speed Note: the dependent variable is SA.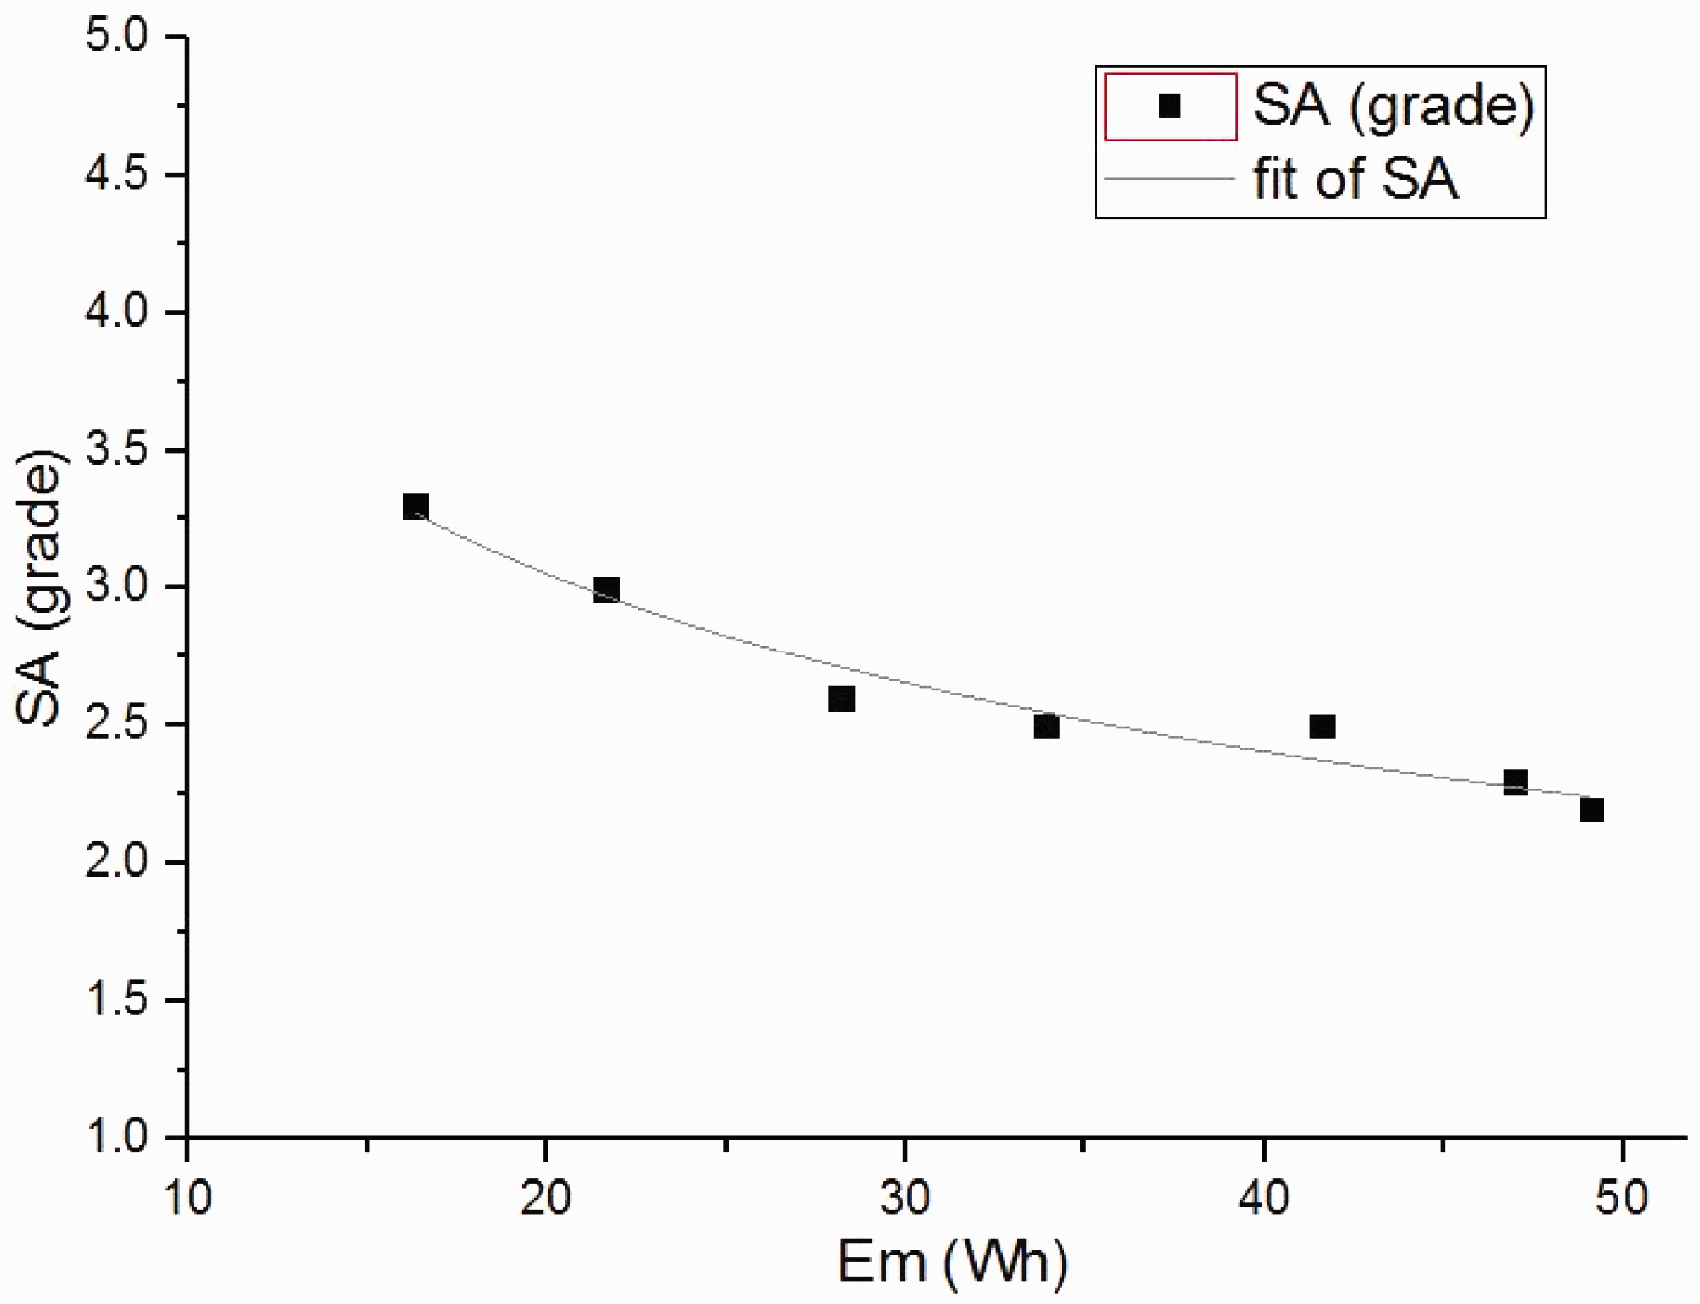
Substituting the unstandardized coefficient B into the inverse function model, we obtain equation (4), as follows
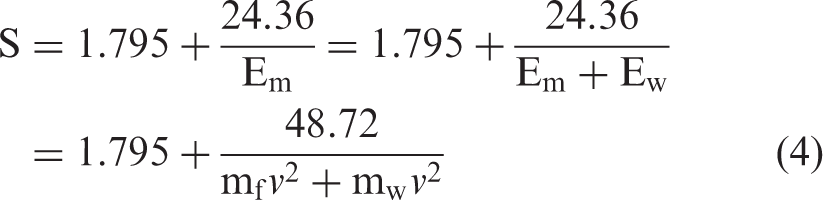
In this research, we assumed that the fabric was conducting an ideal centrifugal motion during the minimum washing period, which is about three seconds in a top-loading washing machine. Therefore, the formulations of force on the fabric were reduced to centrifugal force 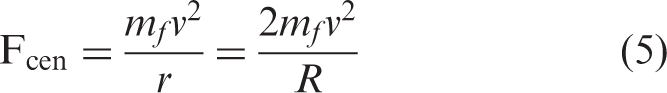
Substituting equations (2) and (5) into equation (4), we obtain the relationship between smoothness and centrifugal force 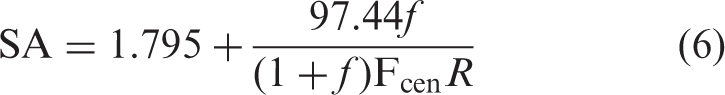
Equation (6) shows a negative correlation between smoothness and centrifugal force
Conclusions
We have found that the major washing parameters that affect fabric movements and wrinkling are washing load and rotating speed. The analysis of fabric movements during washing has indicated that the higher the washing load is, the larger the liquor ratio will be, and the more readily the fabrics will interact with other textiles and the drum, and thus the fabrics will bend and deform more. Additionally, higher rotating speeds lead to stronger forces on the fabric and thus cause more wrinkles. We have developed regression models showing the relationships between fabric smoothness, liquor ratio, and centrifugal force.
The findings provide fundamental information that can be used to develop an appropriate washing program for a top-loading washer that leads to improved fabric smoothness after washing through such methods as reducing washing load size and rotating speed. Further investigation of the effects of washing parameters on the washing appearance of garments made of other materials, such as silk and wool, will be carried out to build a system dedicated to the easy care of garments.
Footnotes
Acknowledgements
The authors would like to thank the Haier Group for providing facilities and technology support to this study.
Declaration of conflicting interests
The authors declared no potential conflicts of interest with respect to the research, authorship, and/or publication of this article.
Funding
The authors disclosed receipt of the following financial support for the research, authorship, and/or publication of this article: National Natural Science Foundation of China for provided funding support for this research through project 71373041, and Donghua University for provided funding support to this research through the “Fundamental Research Funds for the Central Universities”.