
Abstract
The aims of this study were to identify the optimal combination of knitted fabric properties that influence the sensation of coolness and to ascertain the relationship between subjective and objective coolness measurements. Test fabrics included eight cool-touch nylon knitted fabrics and four other knitted fabrics. The physical properties and surface characteristics of the fabrics were assessed. Coolness sensation was determined by the Thermolabo II instrument to provide an objective measurement, expressed as Qmax. A forearm test and palm-of-hand test were used as subjective measurements. Pore volume ratio and geometric roughness had a significant effect on coolness sensation expressed via Qmax. Stiffness and weight influenced the forearm test. Pore volume ratio and the coefficient of steel–fabric friction affected the coolness sensation measured by the palm-of-hand test. Nylon/spandex (78/22) tricot was the coolest of all samples, such that its characteristics were thought to represent the optimal combination of knitted fabric properties for a cooling fabric, that is, a high and balanced stitch density of 150 × 130, light in weight of 161.4 g/m2, a pore volume ratio of 69.4%, medium geometric roughness, and a thin pliable knitted fabric. The objective measurements were highly correlated with the palm-of-hand test, but not with the forearm test because only the palm-of-hand test had a test set-up that was similar to the objective test. Although the objective and forearm test set-ups were only slightly different, coolness assessed with the forearm test was not correlated with coolness assessed with objective measurements.
Keywords
Thermal sensation is an important factor in determining clothing comfort and influences a wearer's physical and psychological well-being.1,2 Recently, cold sensation has received much attention due to increased participation in sports and outdoor activities for healthy living.
There has been increasing interest in synthetic fiber cooling fabrics. Their finish technologies can be divided into five categories according to the coolness-causing source: moisture-absorbent quick-drying, moisture absorbency, sunlight barrier properties, high thermal conductivity, and cool-touch properties. 3 Among them, a cool-touch fabric uses the principle that makes a wearer feel cool by absorbing the body heat through a large contact area between the fabric and the body. With cool-touch fabrics, coolness is obtained through an increase in contact area by changing the cross-section of the synthetic fiber during yarn processing, using a high density of microfiber or by coating the fabric with a multi-porous resin.
Factors that affect coolness can be largely categorized into fiber, yarn, and fabric properties. In terms of fiber properties, thermal conductivity and the cross-section of a fiber affect coolness, 3 and the moisture sorption of fiber is associated with coolness to the touch during fabric/skin contact. 4 Coolness to the touch of smooth fabrics is enhanced by fibers with high moisture sorption capacity. 2 The twist level of yarn, yarn number, and the amount of fine hair affects coolness when considering yarn properties.5,6 Concerning the fabric, fabric density, thickness, weight, bulk density, porosity, and surface characteristics affect coolness.3,7–9 The smoother the fabric surface, the cooler the fabric feels to the touch, because conduction between the skin and fabric is maximized and thermal changes taking place in the fabric are rapidly passed on to the skin. 6
Many cooling fabrics have already been developed using the aforementioned factors. However, there are few practical studies that have examined the level and factors of coolness with newly developed cooling fabrics. Further investigation into the effects of fabric properties on coolness using the recently developed cooling fabrics would assist the development and manufacturing of cooling fabrics.
Methods for measuring coolness can be largely divided into objective and subjective measurements. Objective measurements include measuring the heat transfer or temperature changes using instruments such as the Thermolabo II or Alambeta. 10 Test methods vary according to the mechanism that causes coolness. Subjective measurements assess the coolness level that a subject feels when wearing a test garment or touching a test fabric; the coolness level is presented as categorical or numerical scales. Objective and subjective measurements are often used together, as each has advantages and disadvantages.
Objective coolness measurements include measurement of heat transfer or skin temperature,2,6 assessment of coolness by moisture absorption, determination of thermal absorptivity, 10 and determination of Qmax by Thermolabo. Among those, Qmax, the most widely used coolness indicator, represents the maximum heat current that occurs the moment a fabric touches a copper plate maintained at a constant temperature. The Thermolabo, devised by Kawabata, 11 is an instrument that measures thermal conductivity and heat-keeping properties, as well as Qmax, and its effectiveness has been reported by Imai et al. 7 The contact warmth–coolness sensation is observed at the moment or shortly after the moment when the human body touches the fabric, and is associated with a heat transfer phenomenon in which body heat is absorbed by the fabric. The contact warmth–coolness sensation has been determined by Qmax in many precedent studies.12–19
Objective measurements have advantages that include ease of use, and good repeatability and reproducibility of data. However, it is difficult to predict a person’s coolness using only objective results because coolness can change with a person’s sensitivity and health status, environmental conditions, and more. Consequently, subjective methods are also used for the evaluation of fabric coolness, and include a wearing test to examine the coolness of a test garment worn by a subject, and a touch test to measure the coolness of fabrics that come in contact with parts of the body. The forearm and hand are the body parts most often used in touch tests.2,20–22
The forearm test, in which a subject perceives warm/cool feelings when fabrics contact his/her forearm, is an easier measure of coolness than a wearing test. Also, forearm skin has similar numbers of cold-sensing spots as back skin. 8 Several studies adapted a forearm test for coolness measurement and found that the coolness of a fabric depended on the fabric structure, relative humidity (RH) of the environment, 2 fiber type, and surface state of the fabric. 23 Also, it was reported that even if a fabric was hydrophobic, when the fabric absorptivity was increased and its friction coefficient decreased using a textile finish, the coolness of the finished fabric increased. 24
Another subjective method, the hand test, is used to measure the coolness of fabrics. The hand test has generally been used to measure the handle/texture of fabrics, where a subject perceives the coolness by tactile and pressure sensations. It is an outstanding method in terms of ease of determination. In a study on sensory profiles of wool fabrics, sensory evaluation by hand by a trained panel defined the touch traits of various wool fabrics. 20 A study on the wetness sensation of textile products reported that when subjects assessed the wetness intensity of woven fabrics, the forefinger of the hand they frequently used was chosen as the site for the assessment. 21 Under the prerequisite that a crisp fabric is cool, Rombaldoni et al. 22 also studied the coolness of fabrics using hand sensation.
As discussed above, both objective and subjective measurements are necessary to evaluate the coolness of fabrics. However, they do not always provide similar results because they use different test methods and procedures. Consequently, it is necessary to examine the relationship between objective and subjective coolness measurements. Therefore, the aim of this study was to identify the optimal combination of fabric properties for the coolest fabric through the investigation of the effect of fabric properties on the coolness of recently developed cool-touch fabrics. Also, this study sought to investigate the relationship between objective and subjective coolness measurements.
Experimental details
Materials
Sample specifications
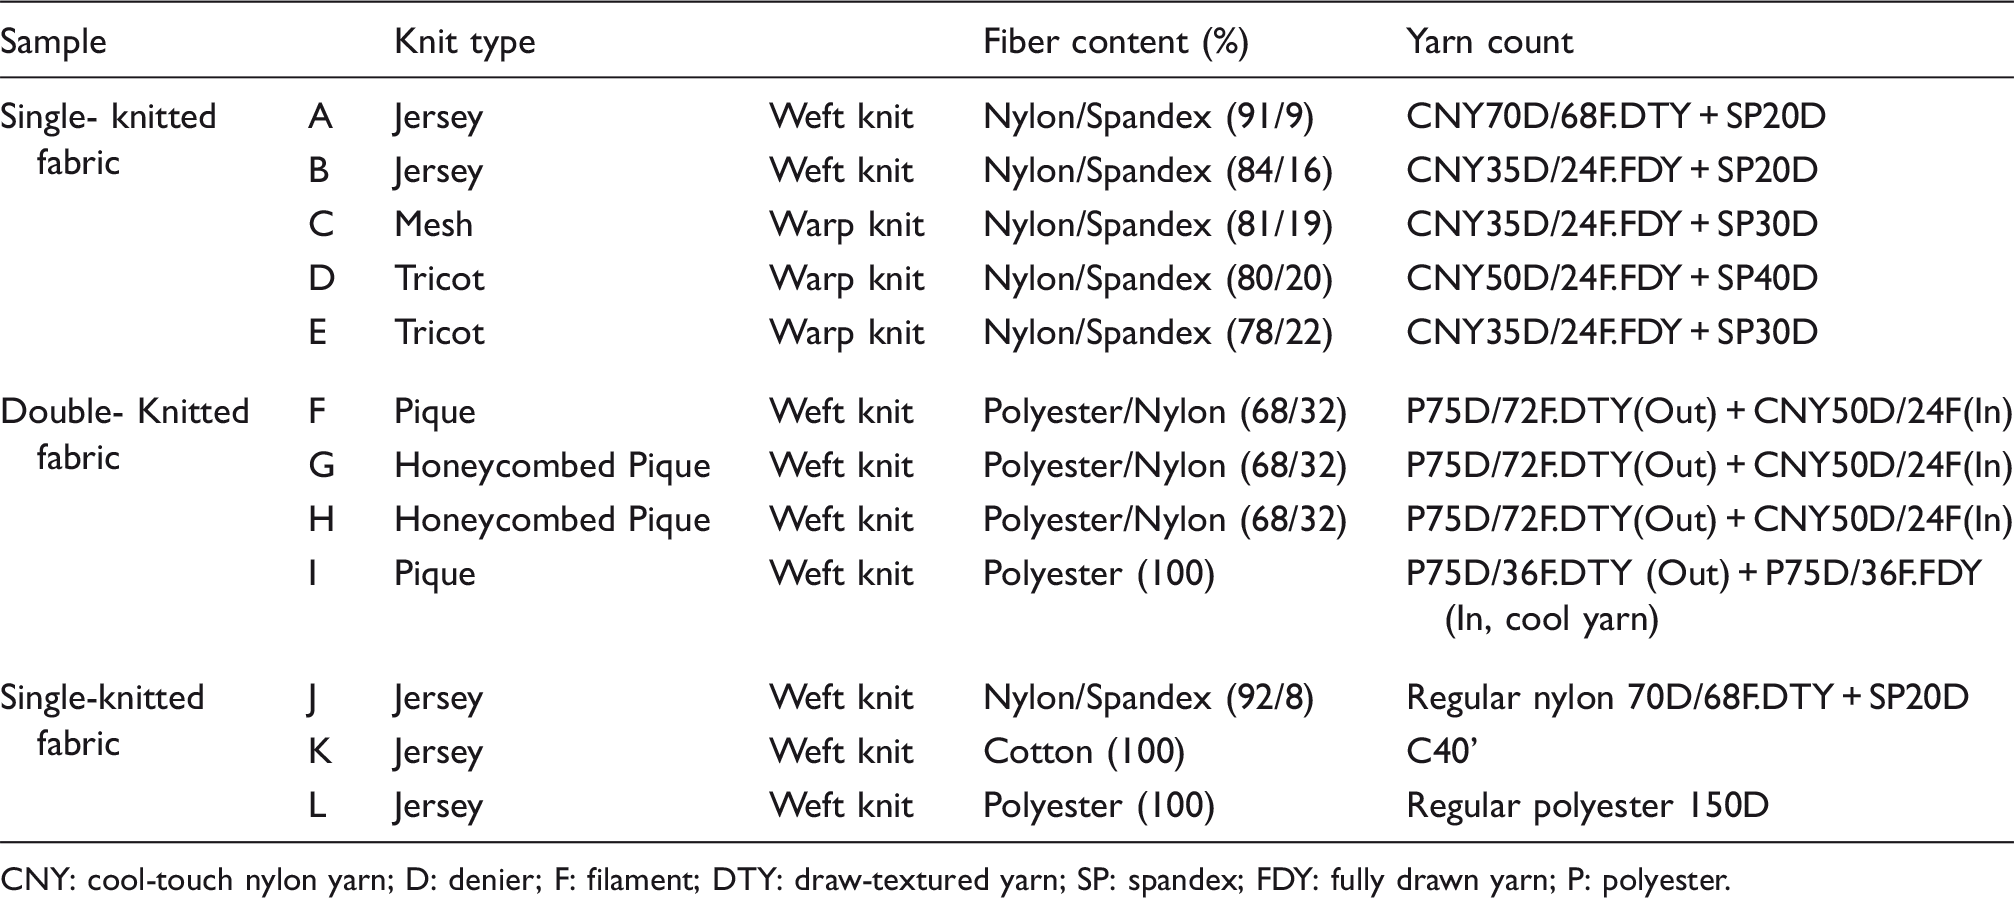
CNY: cool-touch nylon yarn; D: denier; F: filament; DTY: draw-textured yarn; SP: spandex; FDY: fully drawn yarn; P: polyester.
Characteristics of knitted fabrics
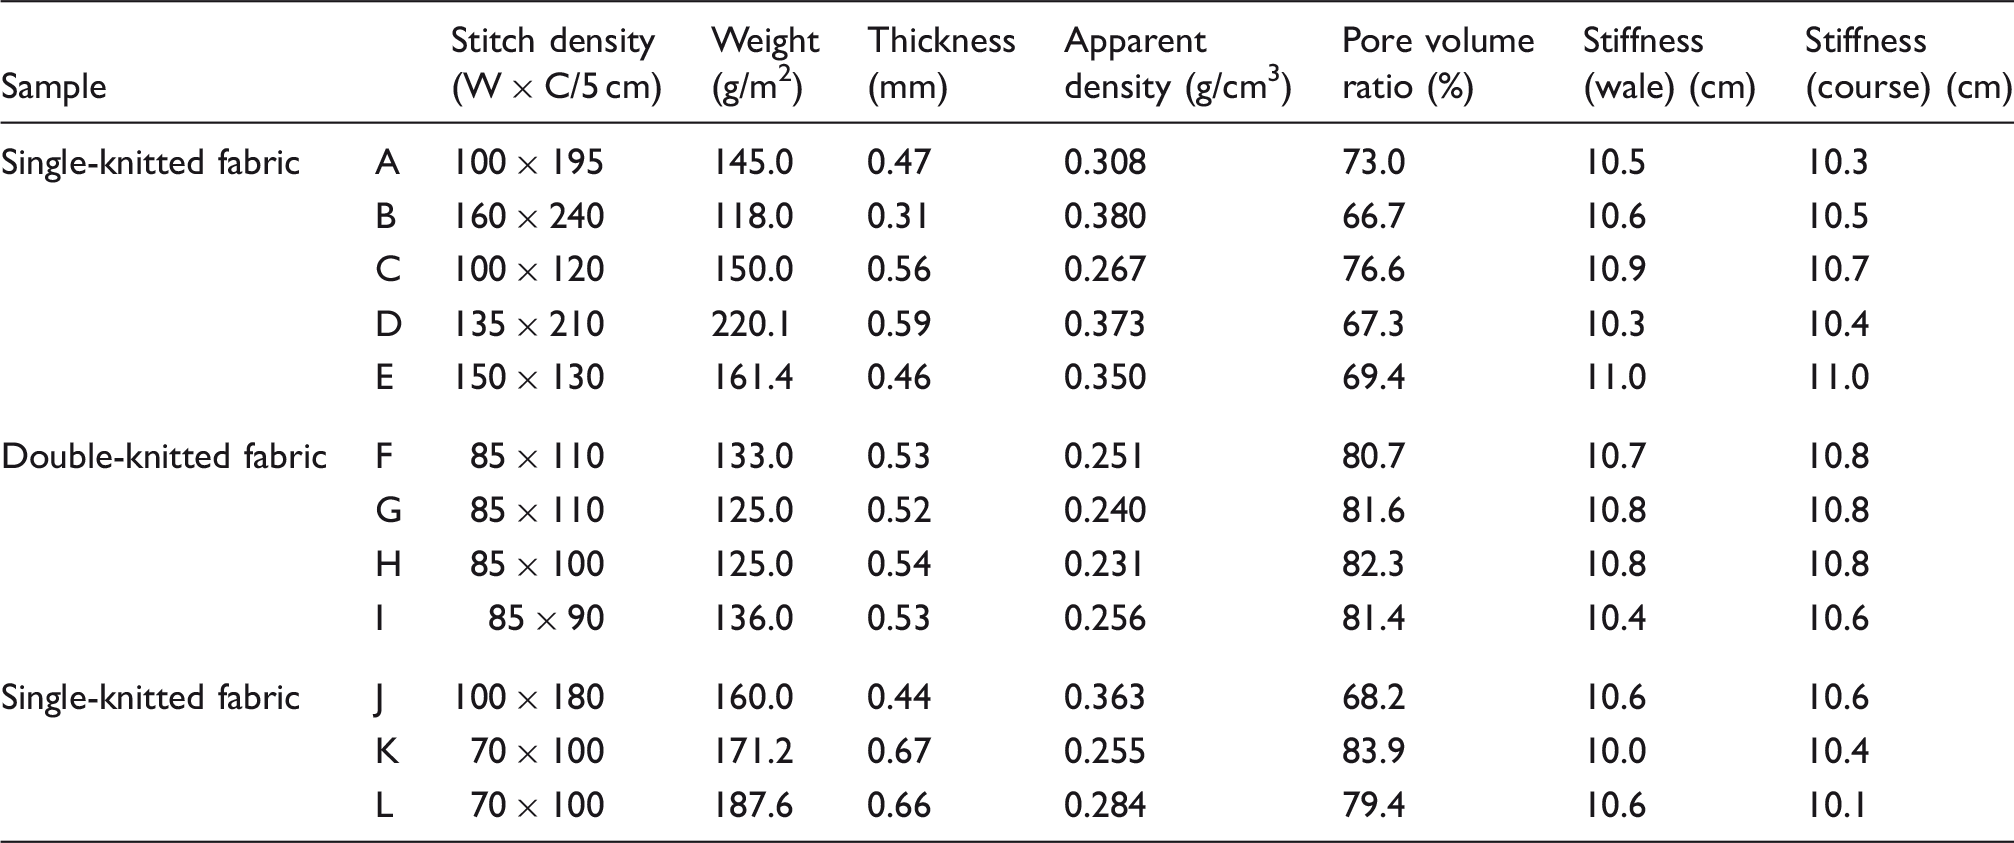
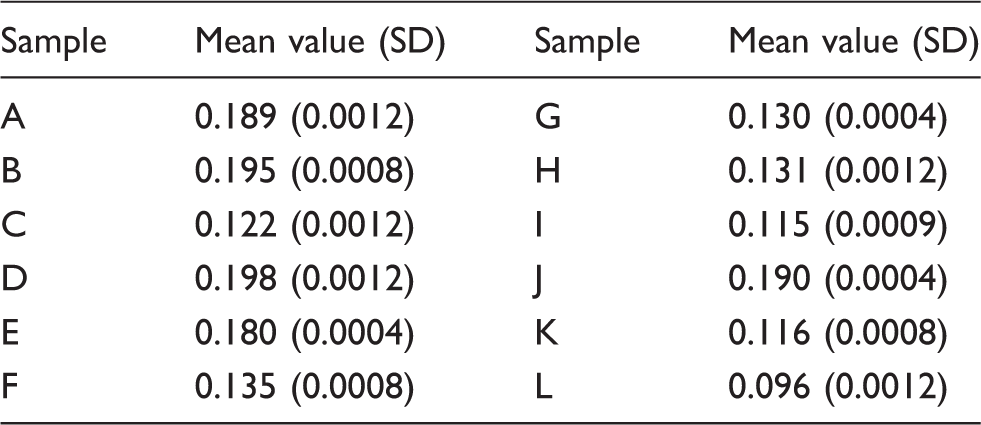
Physical properties of samples
Surface characteristics of samples
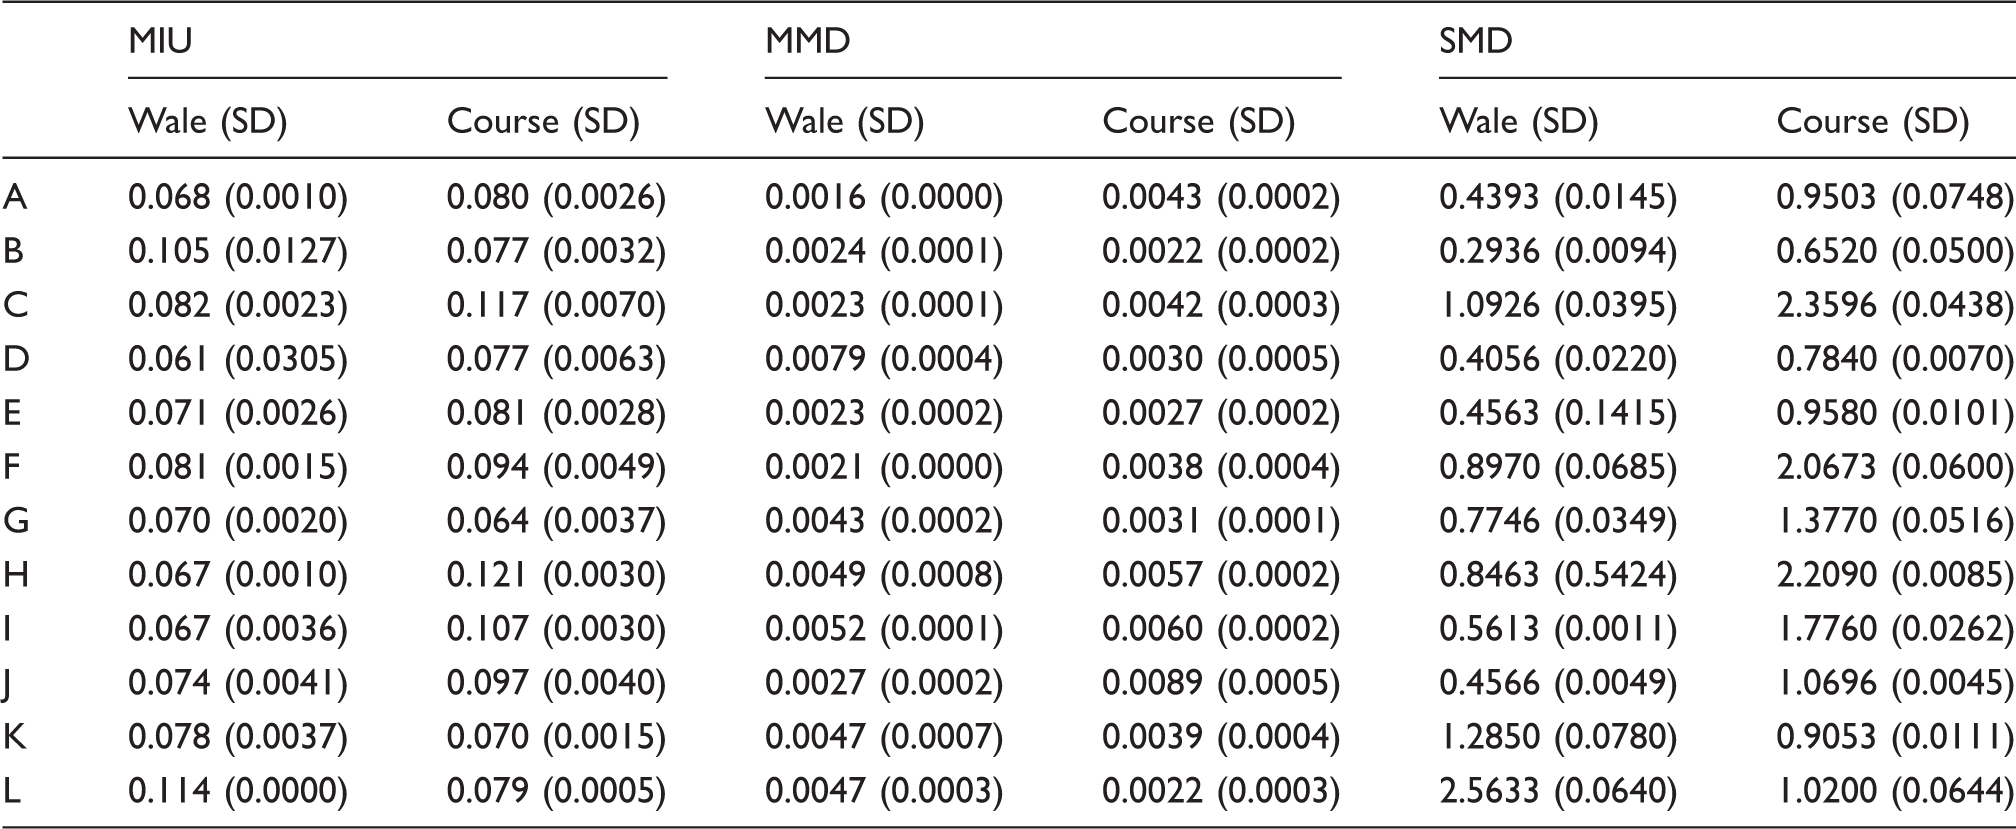
SD: standard deviation; MIU: coefficient of steel–fabric friction; MMD: mean deviation of MIU; SMD: geometric roughness.
The image of the surface that contacted the skin was photographed using an SZ1145 TR CTV Zoom Stereo Microscope (Olympus Co., Ltd, Japan) at 30 × magnifications. Also, the shapes of cross-sections of yarn were observed by scanning electron microscopy (SEM; model JSM–7600F; JEOL Co., Ltd, Japan) at 1000×.
Coolness evaluation by objective measurement
The coolness of fabrics was determined by a Thermolabo II instrument (Model KES–FB7; KATO Tech., Co., Ltd, Japan), and described as Qmax. Qmax describes the maximum heat flow that is measured for a fraction of a second after a preheated hot plate contacts the fabric; the higher the Qmax, the cooler the fabric. Environmental conditions in the laboratory were 25 ± 1℃ and 60 ± 5% RH. Specimens used in the tests were placed in the laboratory 24 h prior to the experiment. The temperature of the fabric on the water-box was controlled to the laboratory temperature by circulating 25℃ water in the water-box part of the Thermolabo II. Considering that skin temperature is typically 35℃, the temperature difference between the heat source (t-box) and specimen was adjusted to 10℃.
When the heat source (t-box) at 35℃ was placed on a specimen of dimensions of 10 × 10 cm2, which was then placed over the water-box to make contact, the heat transmittance that flowed from the heat source to the fabric surface was measured instantaneously. All experiments were performed in triplicate, and the results were recorded as average values.
Coolness evaluation by subjective measurement
Forearm test
A forearm test was carried out among 13 college students in their 20s.2,26 Ten samples were used in the main test (samples F and K were not used because samples F and G showed nearly identical results and sample K was always the warmest sample in a pretest). The experimental condition was 25 ± 1℃, 60 ± 5% RH, and a fabric sample had dimensions of 15 × 30 cm2 (wale × course). A subject was instructed to wear a short-sleeved shirt and rest on a chair for 20 min after entering the laboratory. After the rest, the subject was asked to wear an eye cover, and laboratory staff simultaneously placed two different samples on the subject’s two forearms, and then the subject evaluated the coolness of the samples within 5 s. The subject reported to the staff which specimen was cooler or if there was no difference. For instance, if fabric samples were A (tested fabric) and B (reference fabric), sample A received 1 point if A was not cooler than B. If the coolness of A and B was the same, then sample A received 2 points; if sample A was cooler than sample B, then sample A received 3 points.
The subject rested for 30 s after each test. Samples that were used in a test were not used again in the test immediately following. Samples were selected randomly and alternately covered both forearms such that each fabric contacted each forearm at least once during the entire test. The process was repeated until all samples were compared with one another; the coolnesses of 45 pairs of fabrics were compared during one test. The test was conducted three times per subject at two- or three-day intervals. Coolness values of the samples per subject were the average of the results of three tests.
Spearman's rank correlation coefficients between coolness evaluations of each pair of subjects
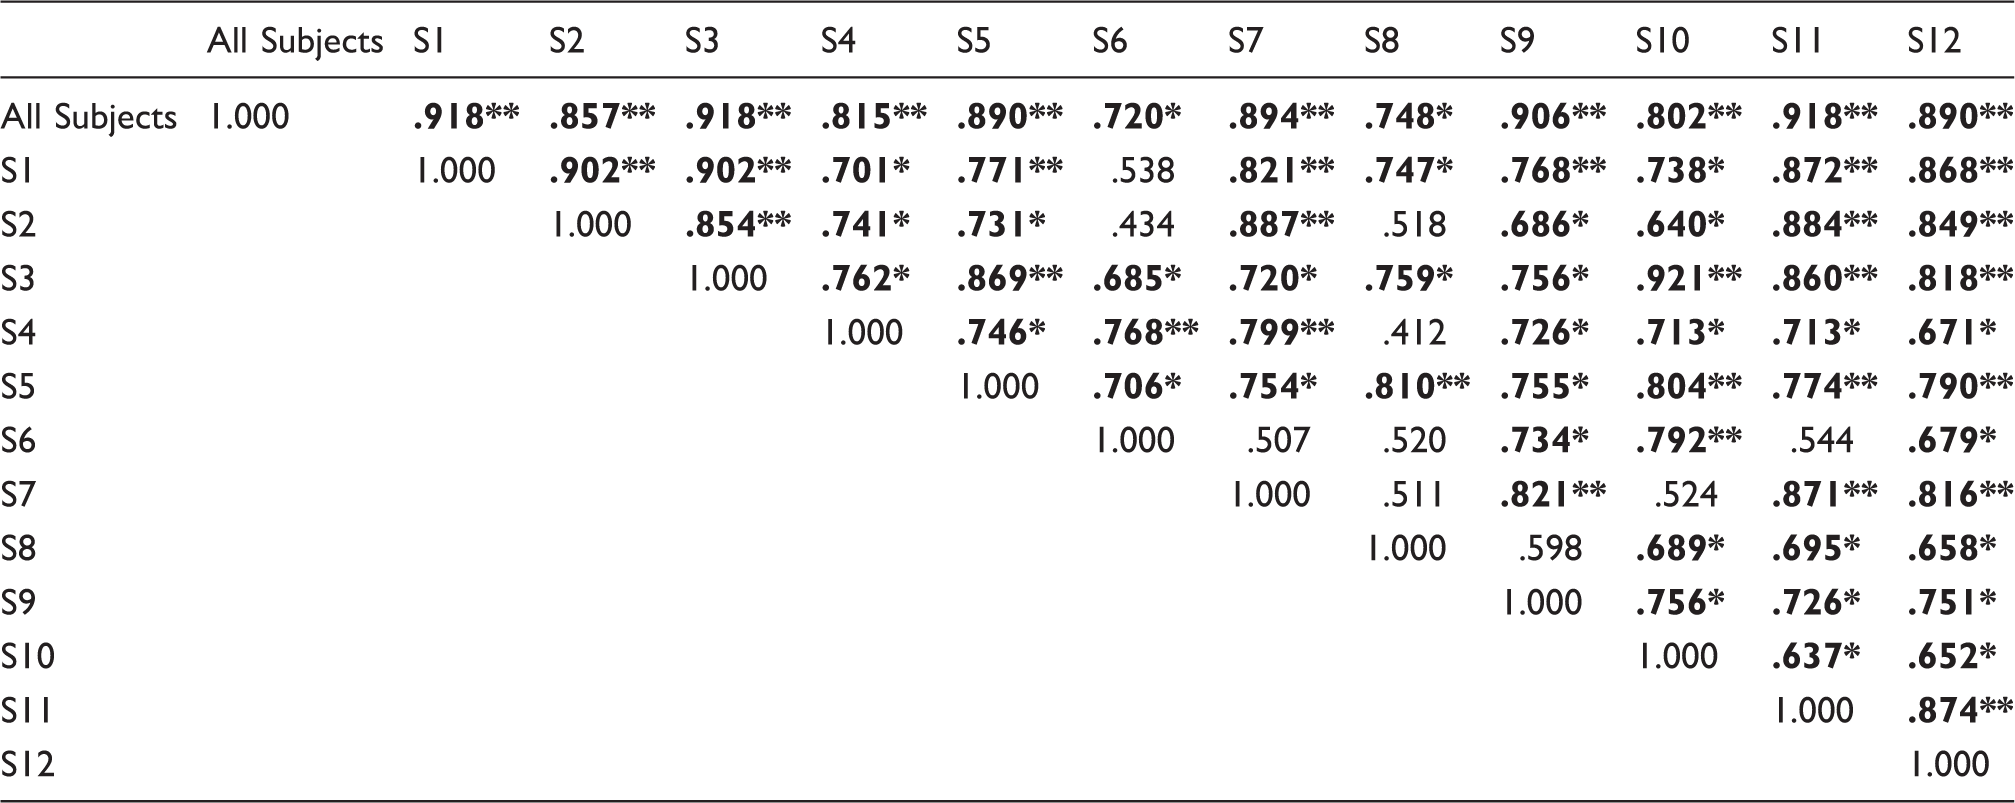
p < .05; **p < .01.
Palm-of-hand test
The palm-of-hand test was also conducted as a subjective coolness measurement. The experimental conditions, test fabrics, and subjects were identical to the forearm test. A subject was asked to only contact the fabric on the table with the palm of his or her hand for a fraction of a second and to express the coolness of the 10 fabrics. Because it was difficult for the subjects to place 10 samples in the order of their coolness at once, the subjects were asked to divide the samples into three groups: high coolness, medium coolness, and low coolness. Subjects then again evaluated the order of coolness of specimens within each group. The coolest sample was given 10 points and the warmest 1 point. The test was conducted three times per subject. Each fabric’s coolness evaluated by all subjects was averaged and described as the subjective coolness of the fabric. The subjective tests of this study were reviewed by the University of Ulsan International Review Board before conducting the experiments; a notice of review exemption (No. 1040968-E-2014-011) was received.
Data analysis
SPSS 21.0 software (IBM Corp., USA) was used for descriptive, correlation, and stepwise regression analyses of the data.
Results and discussion
Coolness by objective measurement
Effects of the blend ratio of fiber, yarn number and type, and knit type on coolness
Qmax values of fabric samples (W/cm2)
SD: standard deviation.
Coolness as a function of the blend ratio of cooling yarn was evaluated using the Qmax values of single jersey samples A–E. The samples were not significantly different. The blend ratio of cool-touch nylon fiber in sample C was equal to that in sample D, which had the highest Qmax value, but sample C had a low Qmax value. This seems to derive from structural characteristics that caused differences in the contact area. Four samples of single jersey (A, B, D, and E) had a high apparent density ranging from 0.308 to 0.380 g/cm3; only sample C had a notably low apparent density of 0.267 g/cm3. Sample C had the highest pore volume ratio (76.6%) of all the samples, along with a larger SMD than four of the samples (Tables 2 and 3). From these results, it was evident that the blend ratio of cooling yarn of the fabrics was important for a high Qmax, but the fabrics also needed structural characteristics, such as high apparent density, low pore volume ratio, and a flat surface, which could provide a larger contact area with skin. Contact area is the greatest determinant of how warm or cool a fabric feels to an individual. 27
In addition, sample J of regular nylon had almost the same Qmax as sample A, which was a cool-touch nylon sample; the two fabrics appeared to have similar structural characteristics. Figure 1 shows SEM photographs of samples A and J. The yarn cross-section of sample A had an elongated oval shape, whereas that of sample J was more circular.
Scanning electron microscopy images (1000×) of the cross-sections of samples A and J.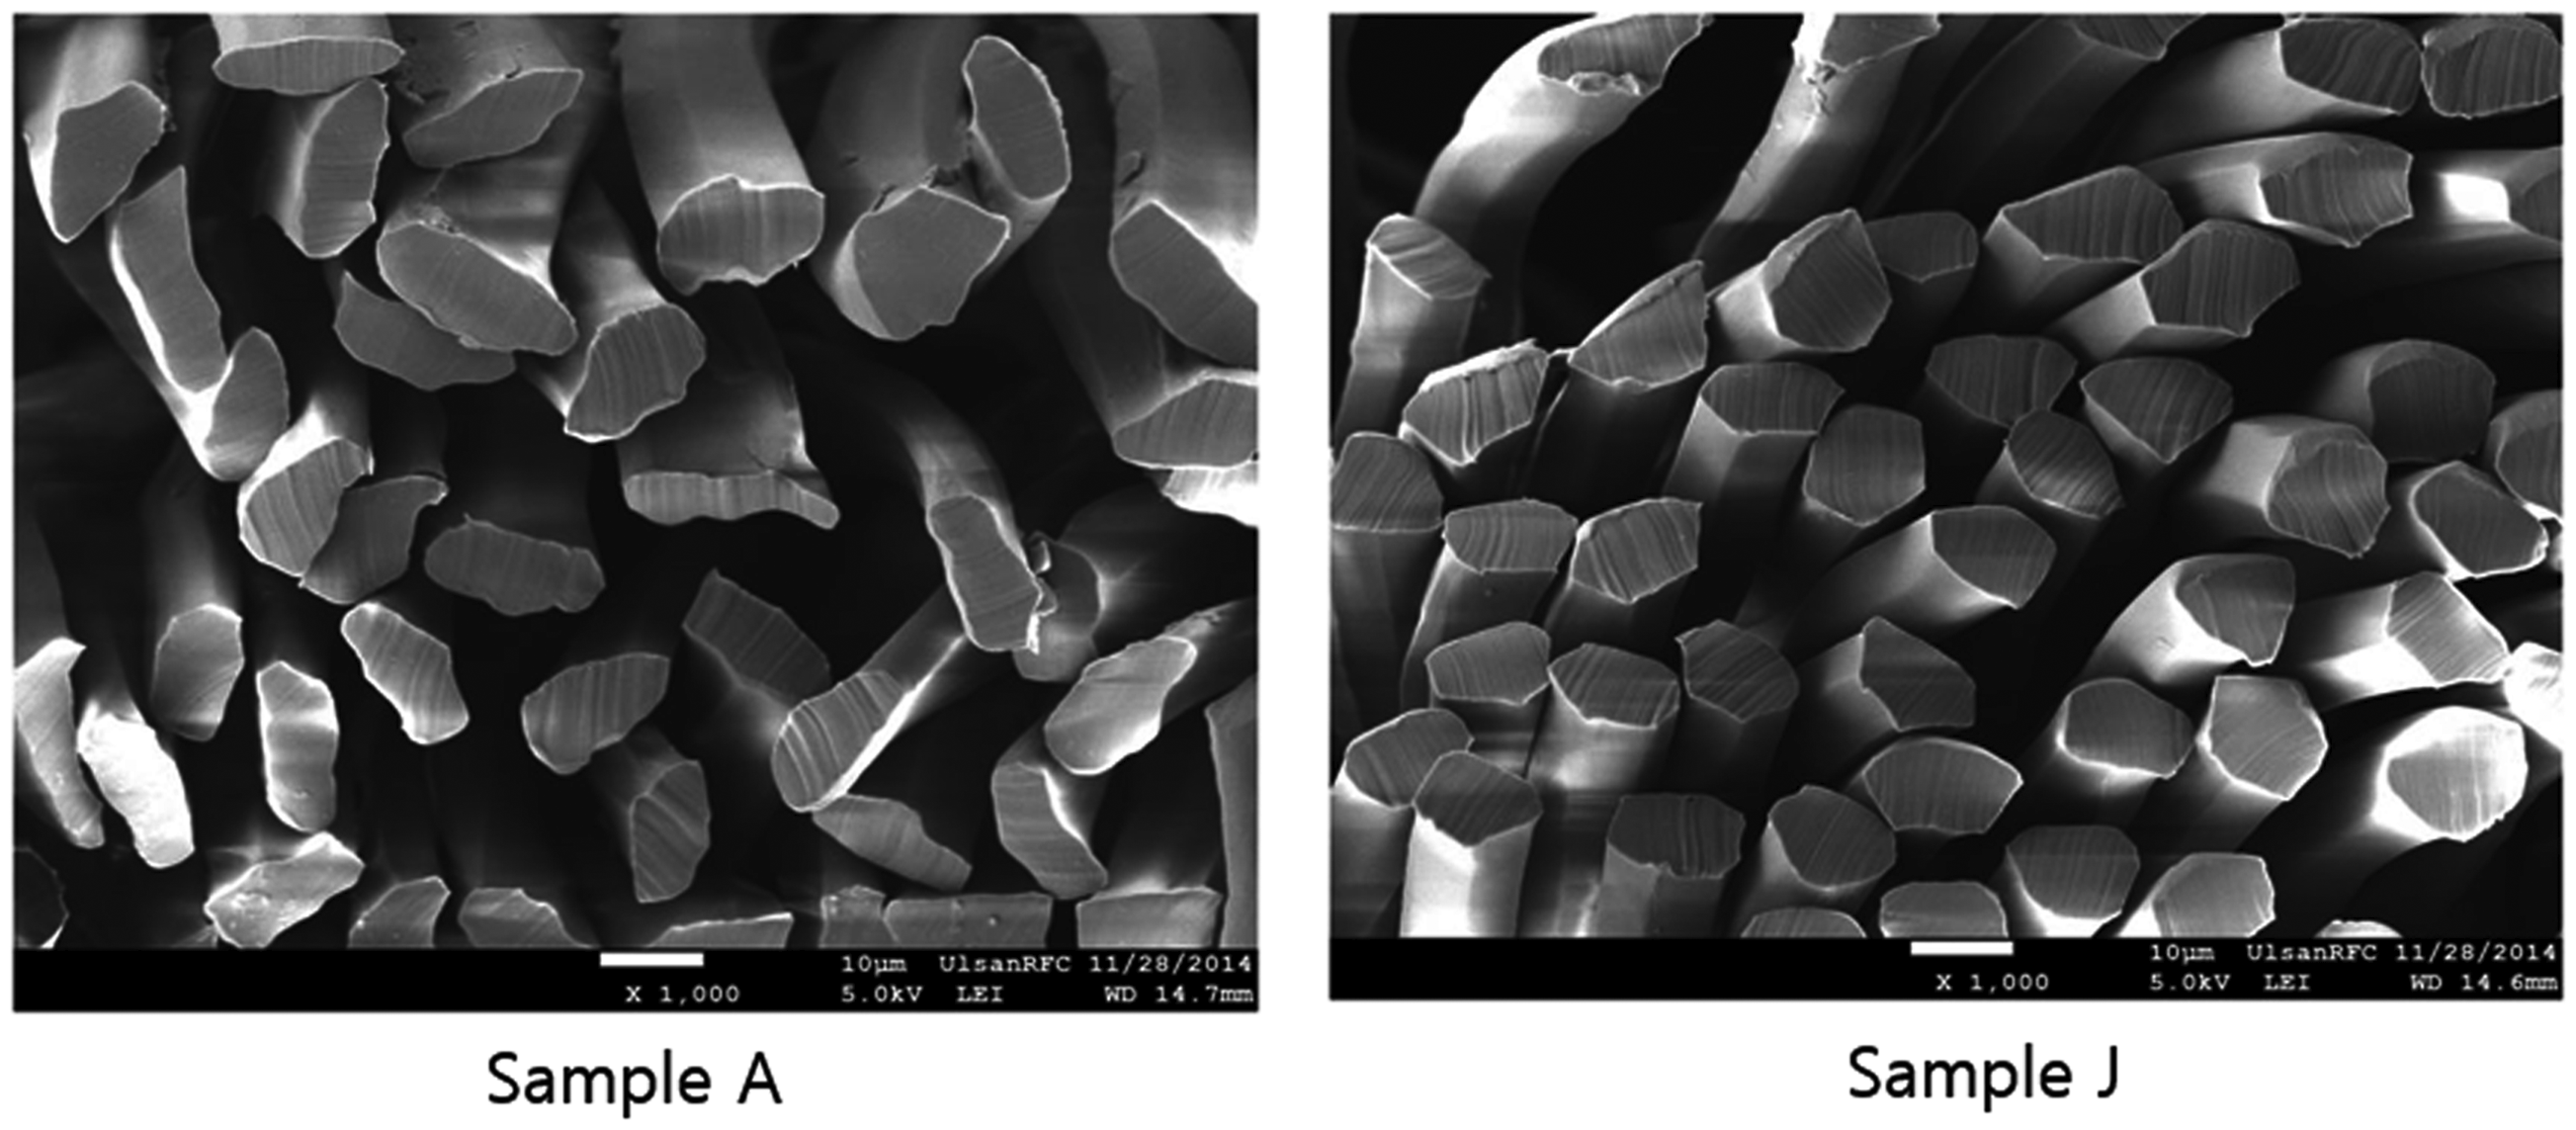
When comparing a yarn of sample A with one of sample J, the contact area of sample A appeared larger than that of sample J, but, taken as a whole, the contact area of sample J was comparable to that of sample A. Furthermore, the yarn packing level of sample A was lower than that of sample J due to its cross-sectional elongated oval shape. This is why samples A and J had similar Qmax values, despite not containing any cool-touch nylon yarn. This is also evident in the data of Table 2, in which the apparent density of sample A is 0.308 g/cm3 and the pore volume ratio of the sample is 73.0%, while the corresponding values for sample J are 0.363 g/cm3 and 68.2%, respectively. The apparent density and pore volume ratio of sample J were similar to those of samples B, D, and E, which had high Qmax values.
Samples with similar cool-touch nylon yarn content and knit type, that is, samples A (70D), B (35D), D (50D), and E (35D), were compared to identify the effects of yarn characteristics on coolness. Firstly, comparing sample A with B, sample A, with a higher denier, had a smaller Qmax than sample B, with a lower denier. This is because while the yarn of sample A was thicker, it was a DTY (draw-textured yarn) type that caused a reduction in the contact area (Table 1). In contrast, sample D, with a higher denier, showed a higher Qmax than sample E, with a lower denier. These results suggest that samples with a high yarn number usually have a large contact area and high Qmax; however, changes in yarn form by texturing can induce changes in the contact area. This makes it difficult to obtain consistent results as a function of yarn number.
Comparing single jersey with double-knitted fabrics for the effects of knit type, Qmax values of double-knitted fabrics were generally lower than those of single jersey fabrics. Among single jersey fabrics (A–E), single jerseys (A, B) and tricot (D, E) had high Qmax values that exceeded 0.180 W/cm2; mesh fabric (C) had a relatively low Qmax value of 0.122 W/cm2. Thus, knit type influenced Qmax.
Effects of structural characteristics on coolness
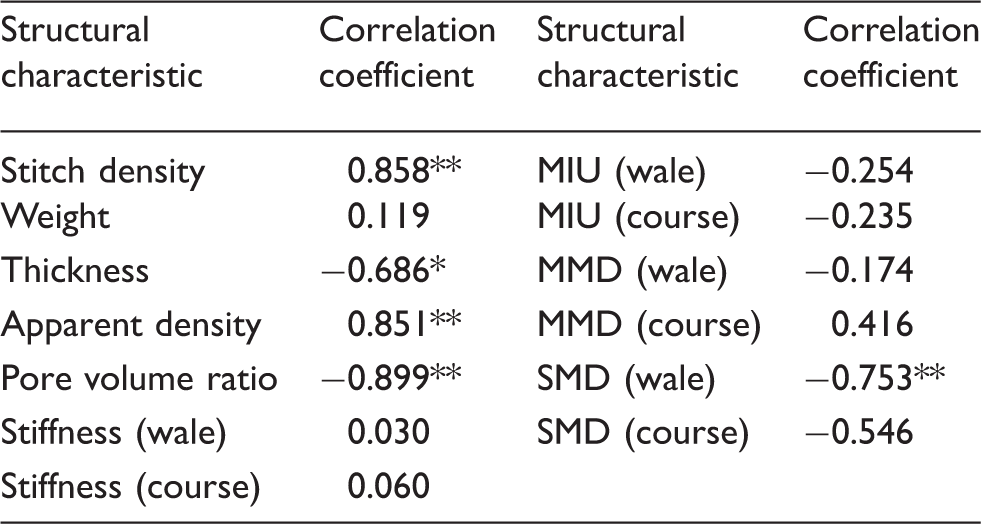
Correlation coefficients between Qmax and the structural characteristics of knitted fabrics
p < 0.05; **p < 0.01.
MIU: coefficient of steel–fabric friction; MMD: mean deviation of MIU; SMD: geometric roughness.
Stitch density, thickness, apparent density, pore volume ratio, and SMD (wale) were significantly correlated with Qmax, consistent with other published studies.7,8 High stitch density, high apparent density, and low pore volume ratio increase the contact area of the fabric, 28 which results in increased coolness. Thinner fabrics have a faster heat transfer rate, which increases coolness. 9
It was also found that the geometric roughness of knitted fabrics, SMD (wale), was significantly negatively correlated with Qmax. Therefore, given that rough fabrics have lower contact areas, Qmax decreased with increasing fabric roughness. The geometric roughness of knitted fabrics is affected by surface hairiness. Optical microscopy was used to examine the texture of the knitted fabric surfaces. The surface of sample K, with a higher SMD value, was rougher than those of samples B and D, which had the lowest SMD values due to more pronounced surface hairiness (Figure 2). This explained the very low Qmax of sample K compared with those of samples B and D.
Optical microscopy images (30×) of the surfaces of samples B, D, and K.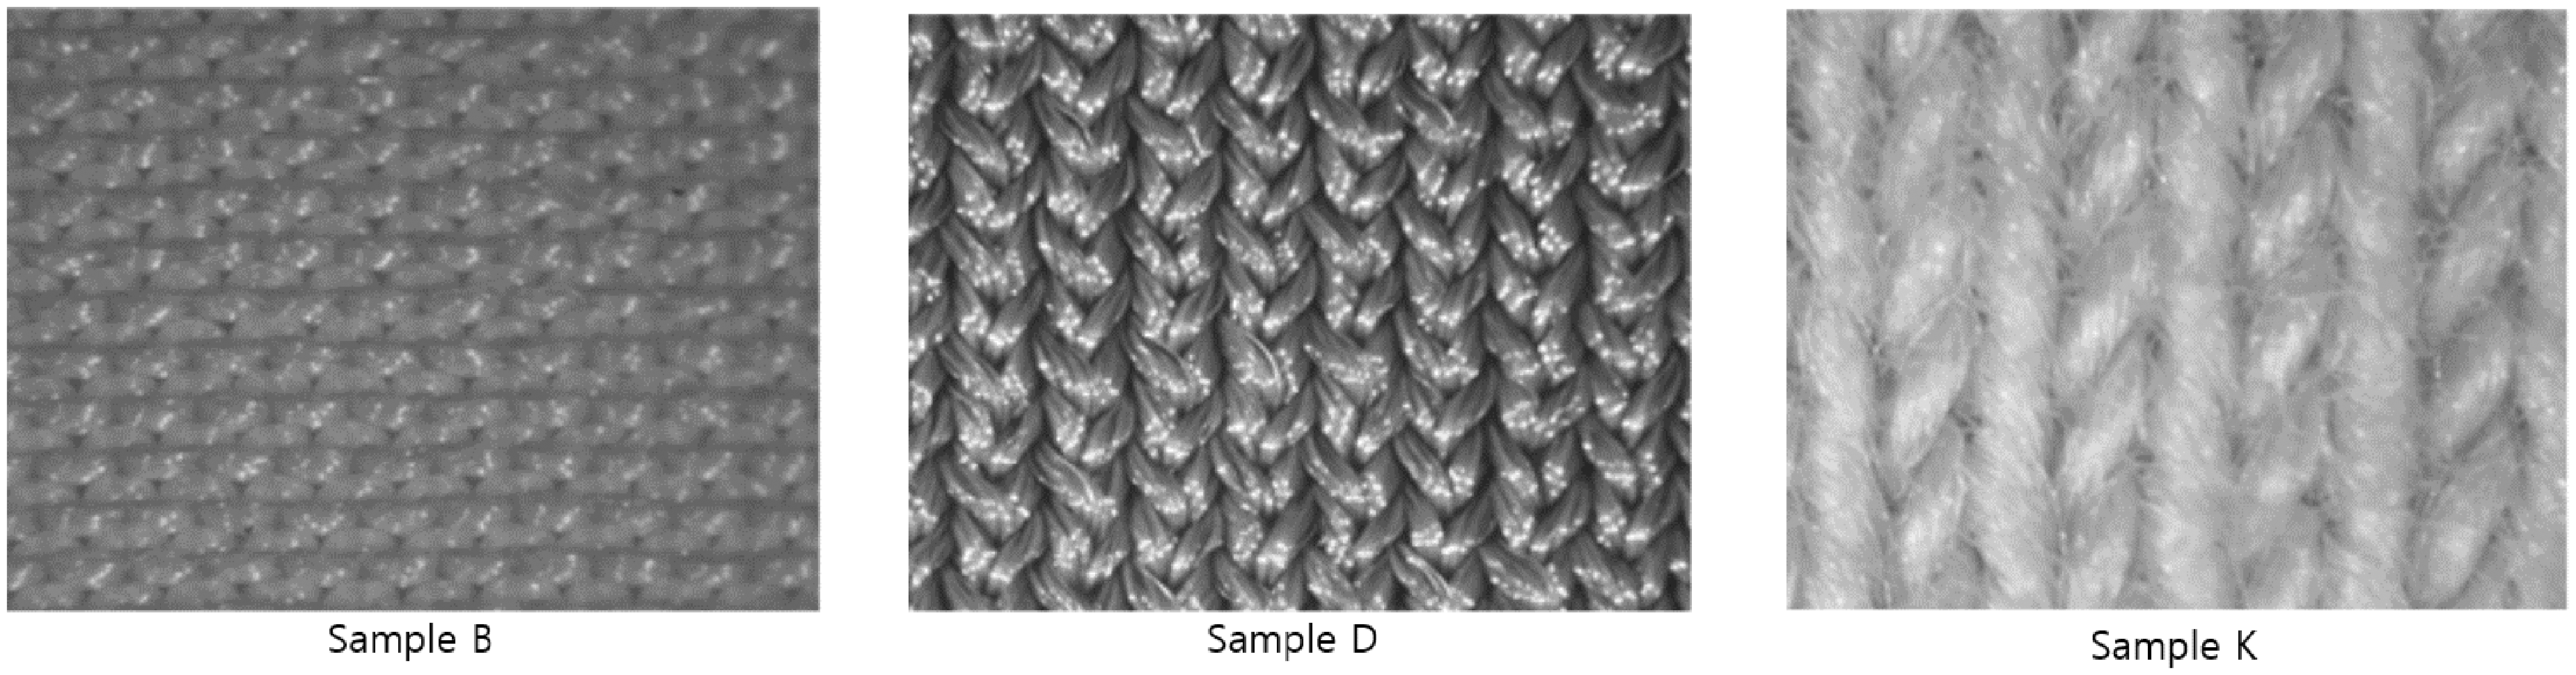
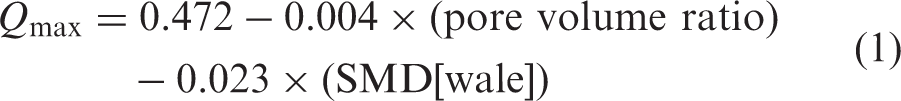
Stepwise multiple regression analysis of Qmax
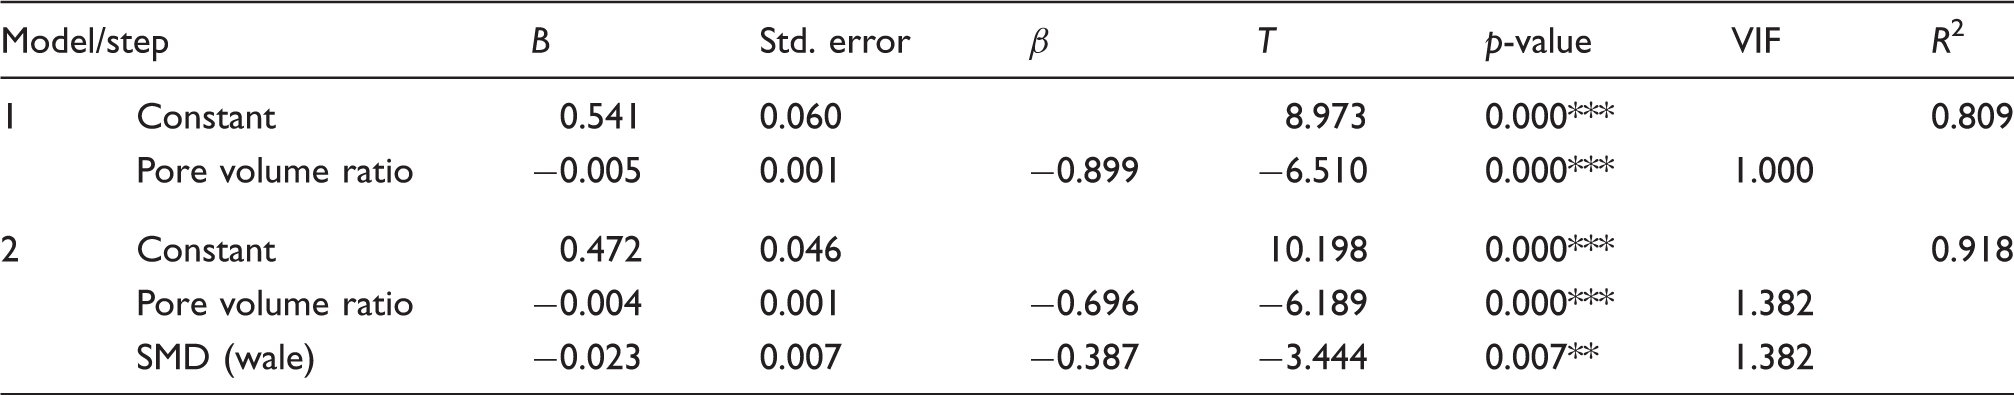
p < 0.01; ***p < 0.001.
VIF: variance inflation factor; SMD: geometric roughness.
Coolness by subjective measurement
Effects of the blend ratio of fiber, yarn number and type, and knit type on coolness
Subjective coolness was measured by the forearm test (coolness F) and the palm-of-hand test (coolness P). The data of 12 subjects were analyzed (the data of subject S13 differed significantly from those of the others and was inconsistent even within his own data; thus, the data were excluded from analyses).
Subjective coolness of the samples measured using the forearm test and the palm-of-hand test
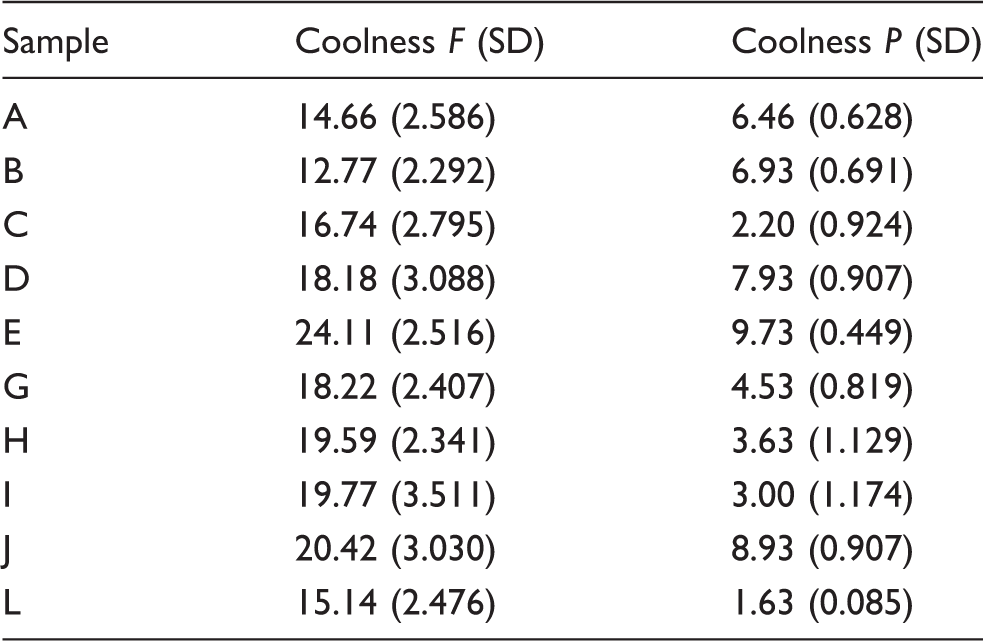
SD: standard deviation.
However, the two measurements had a single feature in common: sample E was found to be the coolest sample by the forearm test as well as by the palm-of- hand test.
Sample E, with a Qmax of 0.180 W/cm2, was expected to be a cool fabric, but did not display a very high Qmax value compared with other samples in the objective test (Table 5). Nevertheless, sample E was rated as the coolest fabric in the two subjective determinations. Although it is generally unusual for subjective test results to be identical, in this case, they were the same. Therefore, further exploration into the characteristics of sample E was warranted. The characteristics of sample E and comparisons with other samples are displayed in Figure 3. Judging from these results, it is likely that the subjective coolness of a product would be high if it was made applying the characteristics of sample E.
Position of sample E in fabric properties within the range of samples.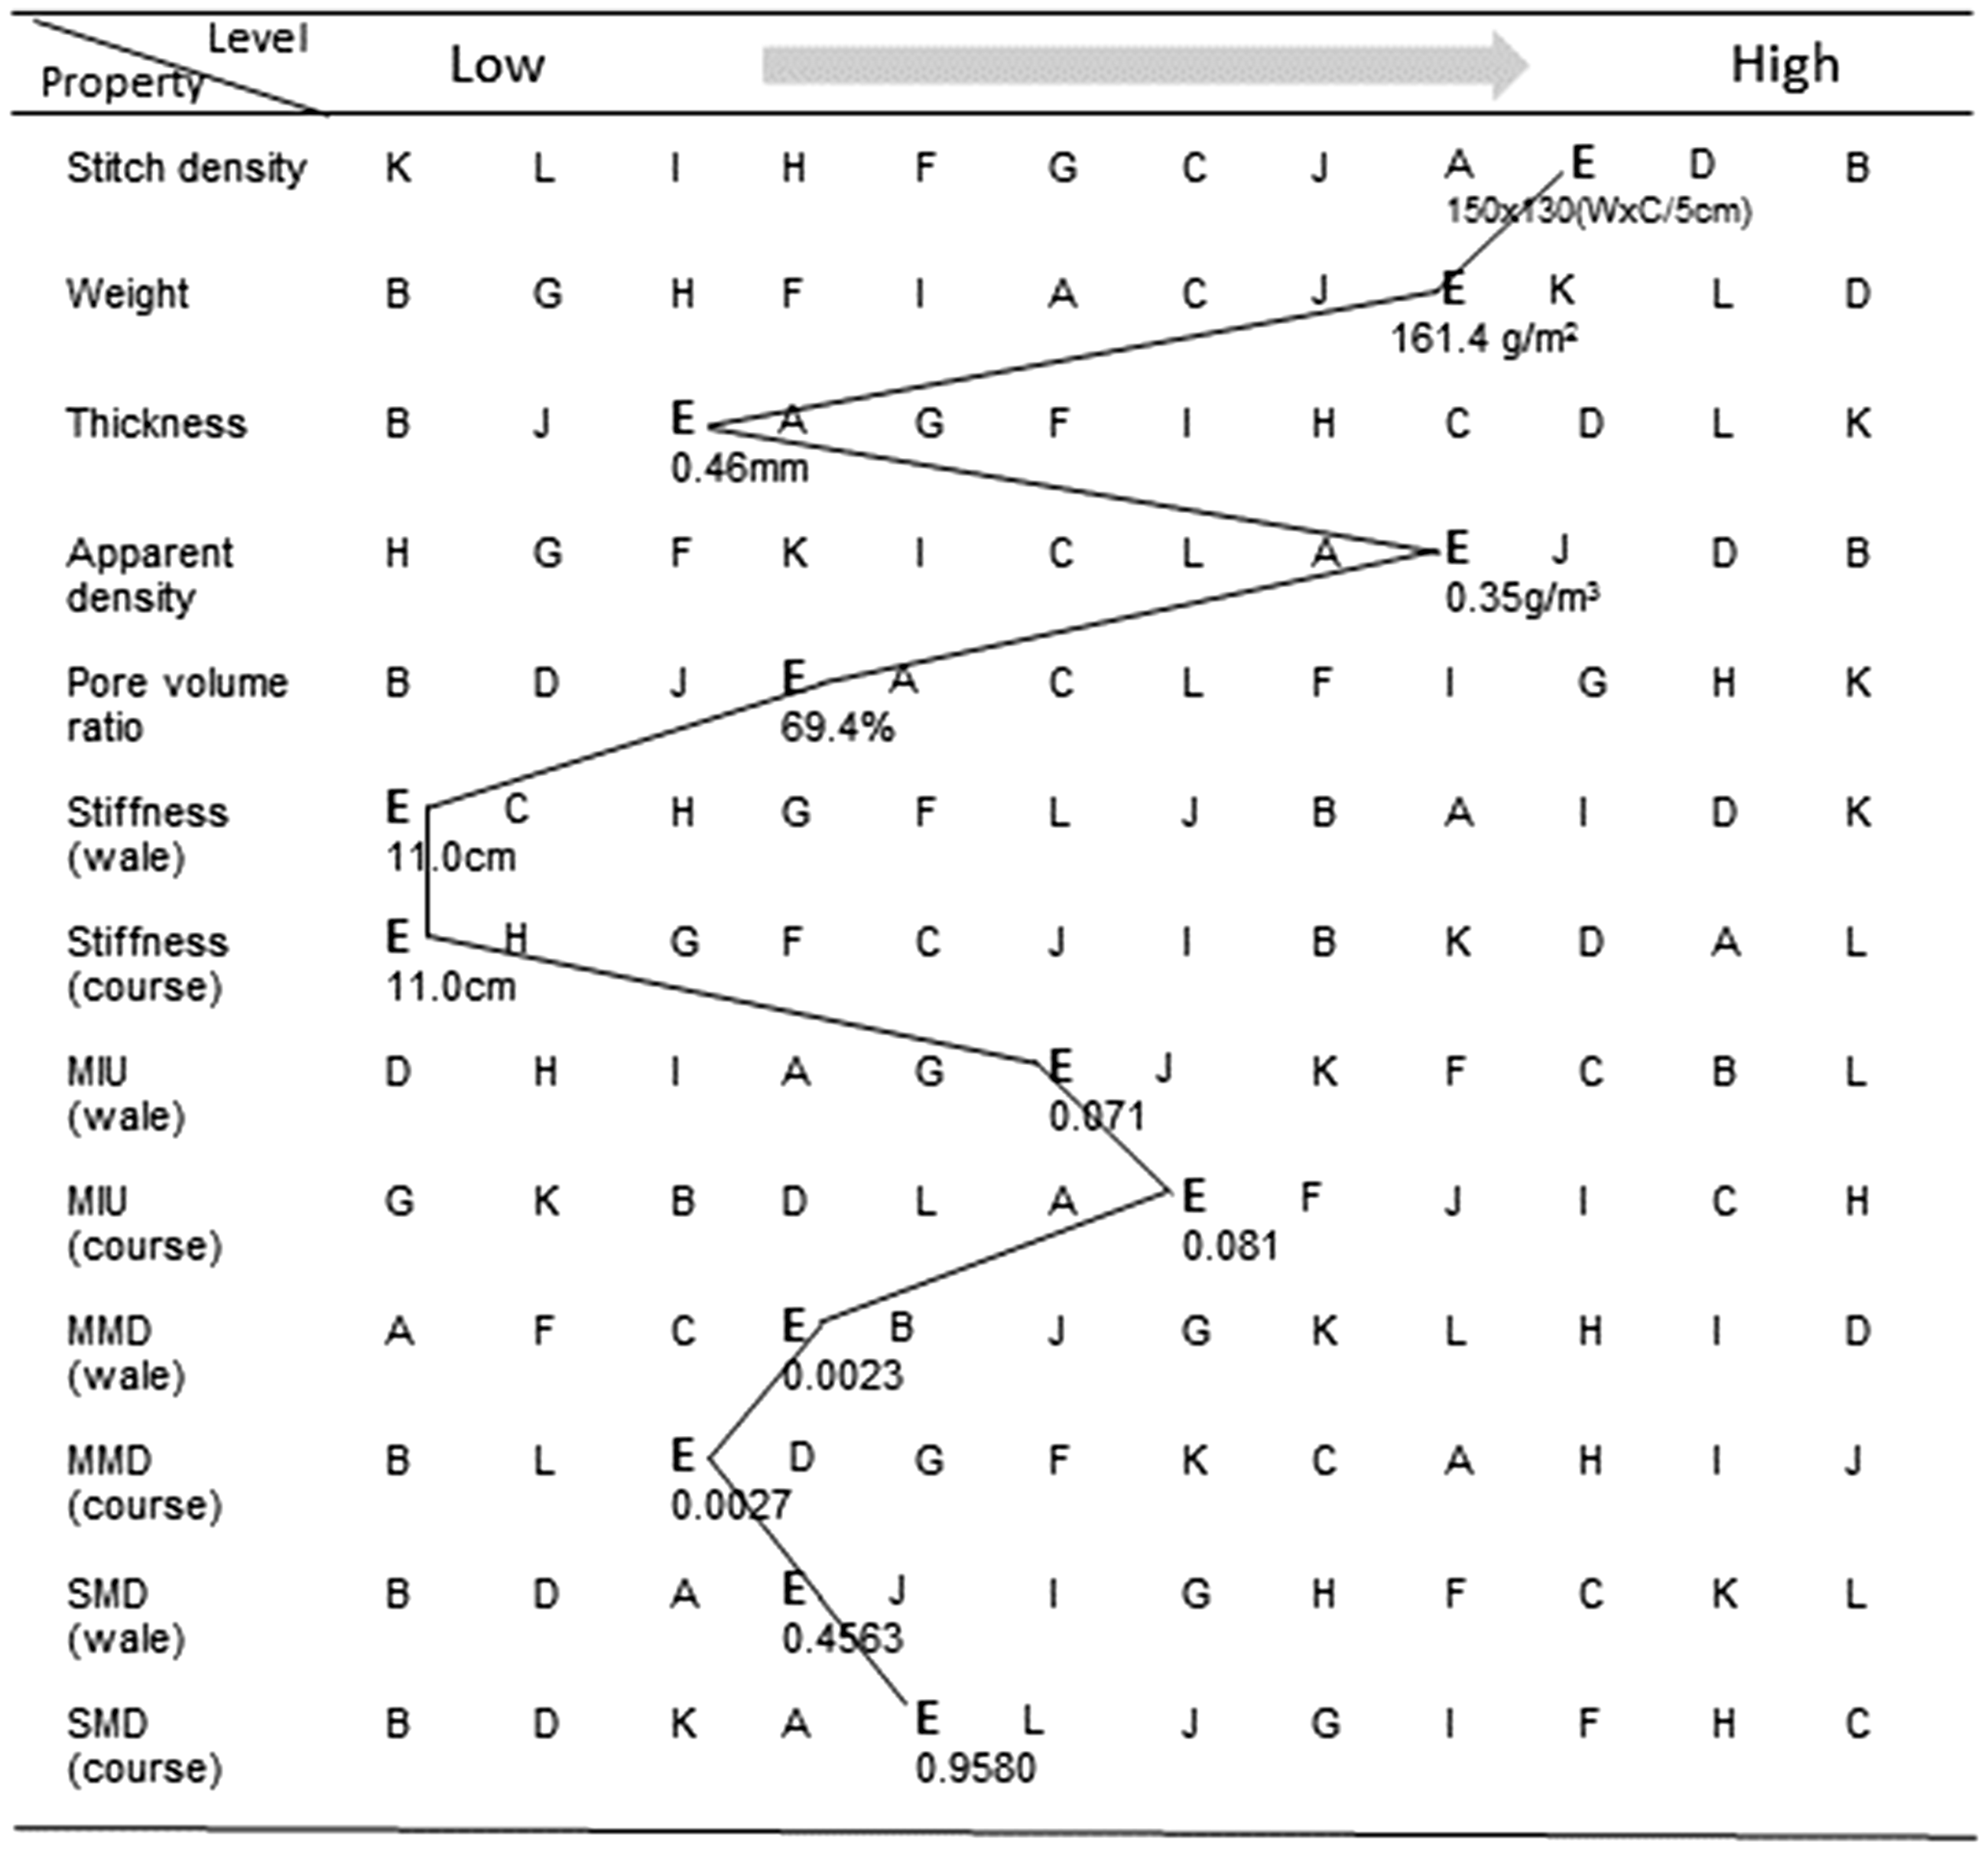
Effects of structural characteristics on coolness
Correlation coefficients between subjective coolness and the structural characteristics of knit fabrics
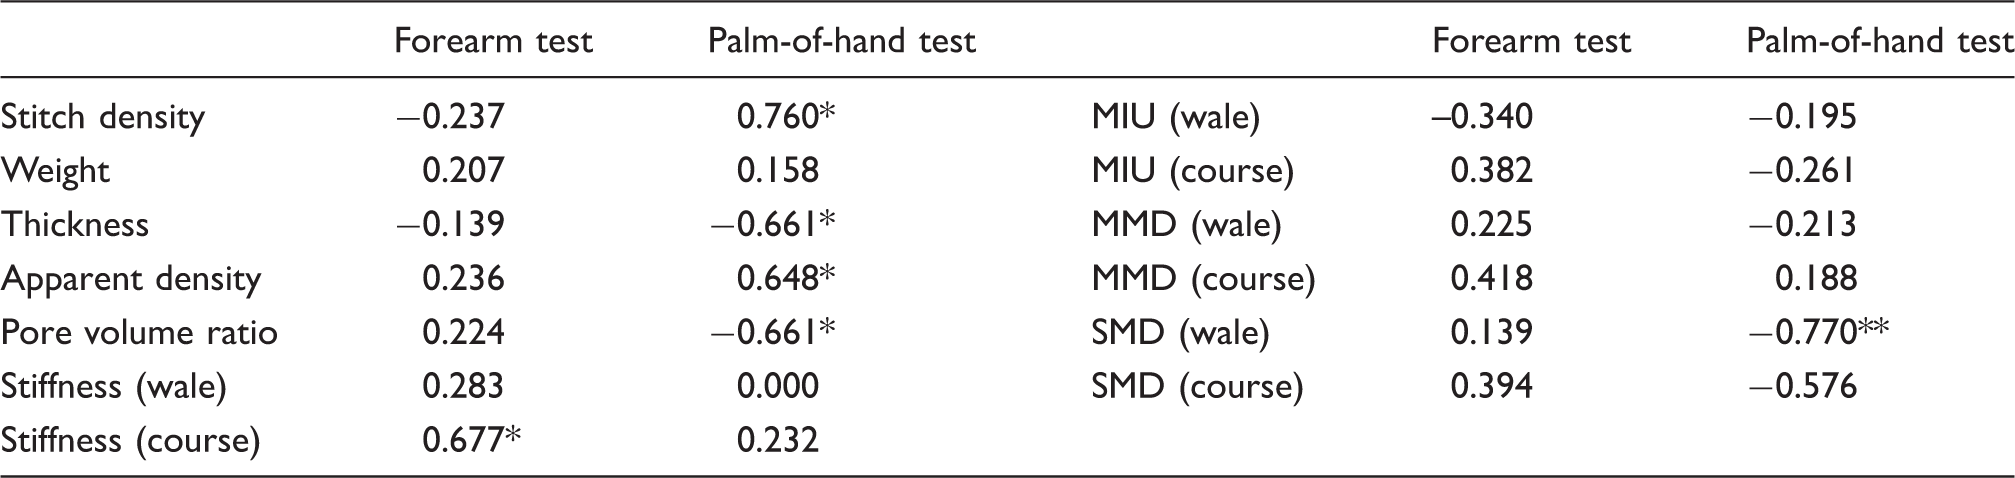
p < 0.05; **p < 0.01.
MIU: coefficient of steel–fabric friction; MMD: mean deviation of MIU; SMD: geometric roughness.
Coolness by the forearm test was not significantly correlated with any structural characteristics except stiffness (course). With the forearm test, subjects evaluated coolness of a sample when a specimen having dimensions of 15 (wale) × 30 (course) cm2 was placed on a subject’s forearm and allowed to naturally fall in the course direction. In this situation, when the stiffness of a sample is high in the course direction, the sample is pliable, falls easily, and its contact area increases. Consequently, this test method seemed to affect the coolness evaluation.
In comparison, with the palm-of-hand test, coolness was correlated with stitch density, thickness, apparent density, pore volume ratio, and SMD (wale) (Table 9), which was similar to the correlations between structural characteristics and Qmax (Table 6). This result appeared to be induced by the similarity in the test methods, as heat transmittance is sensed when the palm of a hand or a cube (t-box) as a heat sensor contacts a fabric on a table or on a hot plate.
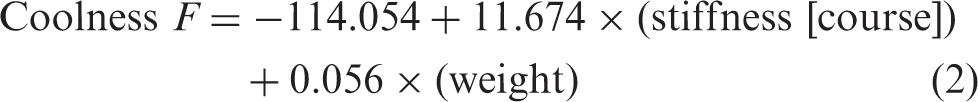
Stepwise multiple regression analysis of the forearm test
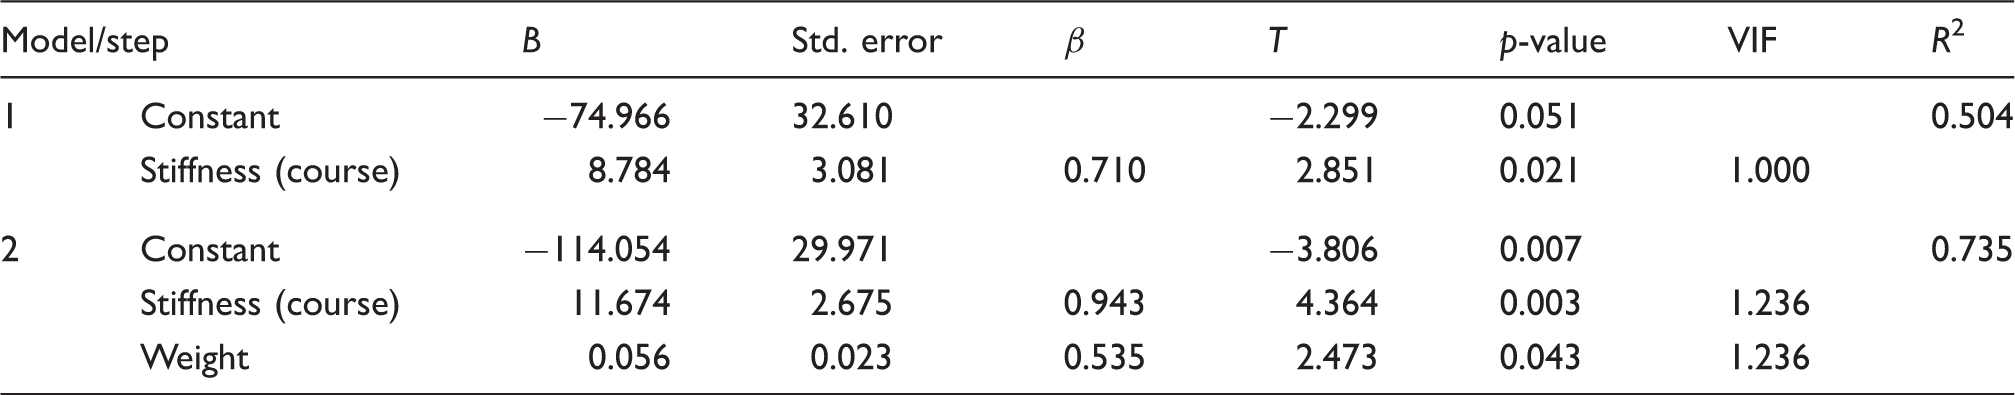
VIF: variance inflation factor; MIU: coefficient of steel–fabric friction.
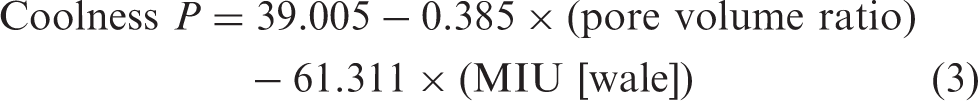
Stepwise multiple regression analysis of the palm-of-hand test
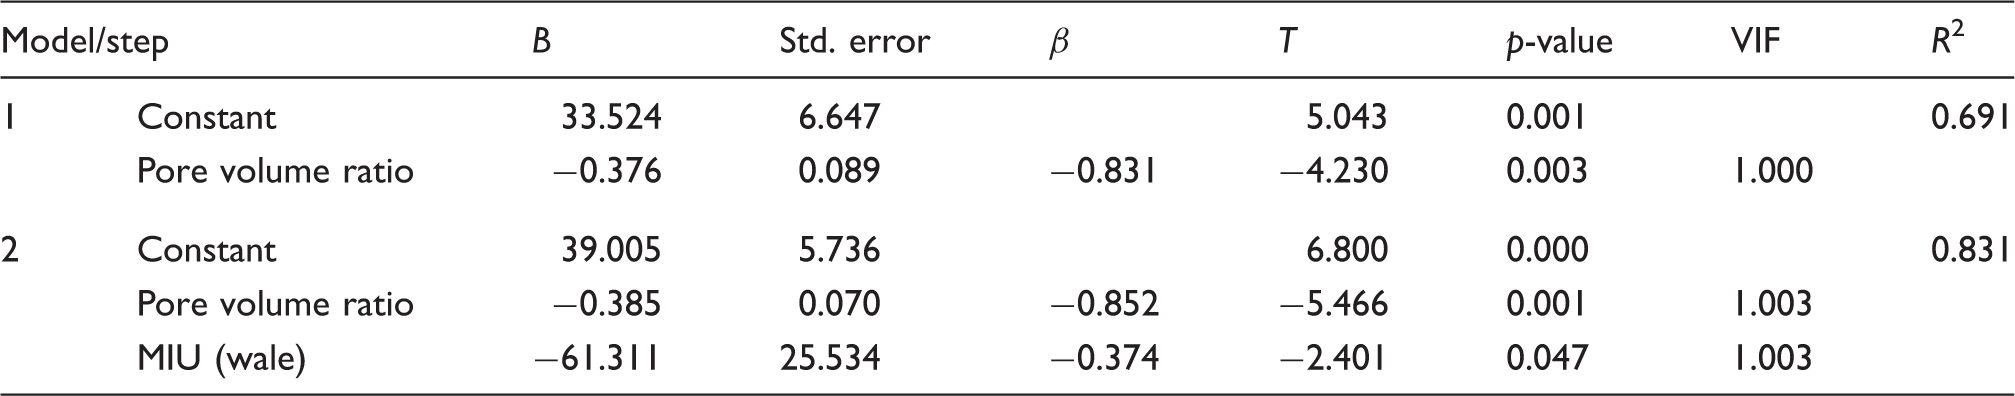
VIF: variance inflation factor; MIU: coefficient of steel–fabric friction.
The above results indicate that the major structural characteristics influencing coolness were stiffness and weight in the forearm test, and pore volume ratio and MIU in the palm-of-hand test. It was apparent that the effects of fabric characteristics on coolness could vary and that samples can be evaluated differently depending on the measurement method. Therefore, in a subjective coolness evaluation, it appears necessary to select a determination method according to the fabric characteristics and to analyze the results dependent on that method.
Relationship between objective and subjective coolness measurements
Correlation coefficients between Qmax value and coolness by the forearm test and the palm-of-hand test
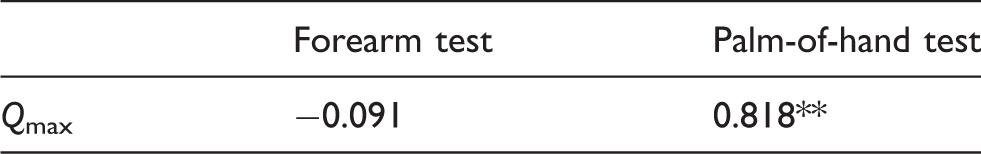
p < 0.01.
The Qmax data provided by the Thermolabo II instrument were not significantly correlated with coolness for the forearm test, but showed a significant correlation for the palm-of-hand test. This may be a consequence of differences in how samples make contact with body parts that act as a heat sensor, as well as the effect of the sample on the test. Firstly, in terms of the contact style of samples with the human body, Qmax is obtained by measuring the heat transmittance under a constant pressure by the weight of the t-box placed over a sample; coolness by the palm-of-hand test is measured under the pressure of the palm of a hand. However, since coolness by a forearm test is measured by contacting the skin under the pressure of only the sample weight, each sample has a different contact area, depending on its weight. The contact style where samples touch the forearm without applied pressure appears to have no significant correlation with Qmax.
Secondly, these results may be affected by a varying influence of the test method on the samples. A forearm test measures coolness by placing fabric on the skin, while the Qmax and palm-of-hand tests measure coolness by touching the sample on a flat plate. Therefore, Qmax by the objective measurement and coolness by the palm-of-hand test are determined without the influence of fabric properties that might change the contact area. However, in a forearm test, samples are placed on the forearm in a curved shape, so that a very light or stiff sample will have a relatively smaller contact area and therefore be evaluated as low coolness. In our study, sample B was expected to have a large contact area due to its high apparent density, very light weight, low pore volume ratio, and high stiffness. Accordingly, sample B had a high Qmax value of 0.195 W/cm2 due to its large contact area, but displayed the lowest coolness rating by the forearm test due to its light weight and high stiffness.
Conclusions
The objectives of this study were to investigate the optimal combination of fabric properties that affect coolness using cool-touch nylon knitted fabrics, and to examine the relationship between objective and subjective coolness measurements. The conclusions are as follows.
Firstly, the Qmax values of cool-touch nylon knitted fabrics were higher than those of regular PET and cotton knitted fabrics. The blend ratio of cool-touch nylon fiber and yarn number and type did not induce consistent changes in Qmax, although knit type did affect Qmax. Stitch density, thickness, apparent density, pore volume ratio, and SMD were structural characteristics that correlated with Qmax. Examining relative influences through regression analysis established that pore volume ratio and SMD were the main contributors to Qmax.
Secondly, the forearm test and the palm-of-hand test, both subjective coolness measurements, had varied results. Coolness by the forearm test did not show consistent changes with the blend ratio of cool-touch nylon fiber, yarn number and type, or knit type, but was significantly correlated with the stiffness among the structural characteristics. In the regression analysis of all structural characteristics, coolness by the forearm test could be estimated by stiffness and weight. Given that the samples were placed on forearms in the forearm test, samples that were heavy and had high stiffness would press the skin hard and have a large contact area with the skin so that they would have high coolness. Coolness by the palm-of-hand test also did not show consistent changes with the blend ratio of cool-touch nylon yarn or yarn number and type, but was affected by knit type; it also correlated with stitch density, thickness, apparent density, pore volume ratio, and SMD (wale). Pore volume ratio and MIU were significant variables in the subjective coolness regression equation.
Thirdly, an examination of knitted fabric property effects on subjective coolness established that the knit characteristics that affected subjective coolness varied, and coolness evaluations on the same sample varied according to the subjective measurement. Nevertheless, sample E was evaluated as the coolest of all samples in the forearm and palm-of-hand tests. It had a high Qmax value as well. Sample E had a high and balanced stitch density of 150 × 130, light weight of 161.4 g/m2, pore volume ratio of 69.4%, medium geometric roughness, and was a thin and pliable knitted fabric; this is thought to be the optimal combination of knitted fabric properties for a cool-touch fabric. If a new product is developed with characteristics similar to those of sample E, its subjective coolness would likely be high.
Fourthly, this study examined the relationships between objective and subjective measurements. Qmax values were not significantly correlated with coolness by the forearm test, but were highly correlated with coolness by the palm-of-hand test. The reason for this is that only the palm-of-hand test had a similar test set-up as the objective test. When objective and subjective methods differed in a sample’s contact style or test set-up, no matter how small these differences were, coolness evaluations using subjective measurements were not correlated with coolness evaluated using objective measurements. It was found that the coolness evaluation of a sample was highly dependent on the determination method.
Consequently, it was identified that both an objective test and a subjective test are necessary to assess the coolness of textile products. Test results should be carefully analyzed, because coolness measurements are influenced by fabric properties and the experimental set-up. Therefore, to predict and describe the subjective coolness under certain wear conditions, the objective coolness measurements should be chosen based on the way of wearing a garment, body parts covered by the fabric, and environmental conditions, such as temperature and RH.
Footnotes
Declaration of conflicting interests
The authors declared no potential conflicts of interest with respect to the research, authorship, and/or publication of this article.
Funding
The authors received no financial support for the research, authorship, and/or publication of this article.