
Abstract
Due to spiral winding, there is an inclination angle between the teeth and the direction of the tangential velocity of the licker-in, which makes the teeth obliquely work with the fibers instead of vertically. In the previous work in Part I, we discussed the impacts of this using theoretical mechanical analysis and a digital model in ANSYS Explicit Dynamics. Based on the analysis, this paper makes a new type of card clothing for the licker-in and manufactures the rack by adding a process in the processing for traditional AT5610 × 05611 racks. The comparison of the two slivers worked by the traditional and new design licker-in card clothing show that the new design clothing has an increase of 24.41% on nep removal, which is consistent with the theoretical analysis. According to the paired samples test, the trash removal ratio and the short fiber content in the sliver, this new design shows no deterioration. For further discussion, we collect the noils and calculate the producing rate of the sliver, licker-in droppings and card strips with special collecting equipment. This new design shows a significant increase in the fiber yield percentage (8.45%) and a dramatic decrease for licker-in droppings (33.6%). Yarns from the new rack have better performance on breaking elongation (a decrease of 5.6%) and evenness. Therefore, this design has higher utilization for fibers and good commercial benefit.
Keywords
In the carding machine, because of the high rotating speed of the licker-in, the teeth of the licker-in work on the fibers with great momentum. When one end of the fibers is held by the feed roller, the other end is being carded on the feed plate. The forces from the teeth are so strong that they cause fiber damage. It has been proved by experiments that card clothing with a cambered tooth back shows less fiber damage when compared with the same card clothing with a straight tooth back. 1 Therefore, tooth geometry affects the sliver quality, and in recent years, researchers have made some investigations on the design of teeth geometry. Some researches were on the morphologic changes of the teeth. The Camel’s type metallic card clothing helps to realize a better fiber transferring from the licker-in to the cylinder and it has been applied to practical production. 2 In addition to that, there are other different kinds of tooth geometry, such as arched tooth shape, flat tooth shape, beak-shaped, a tooth with double tips, teeth with respective working angles and so on, for less fiber damage or higher carding efficiency.3–5 Most of them have been developed and applied in manufacturing. Some researchers tried to improve the curved shapes, such as adopting a smooth curve to decrease damage on both teeth and fibers. For instance, to make the teeth retain a high level of aggressiveness over their lifetime, Marz and Maerz 6 put forward an idea for a tooth whose first portion of the tooth front is convex or approximately convex. Another similar kind of licker-in card clothing, named ‘Tapered Teeth Clothing’, has a small transition circular arc on the teeth edge; this tapered teeth clothing helps to reduce the content of short fibers in the sliver and improve the final yarn properties. 7 In addition, for the teeth arrangement, Ao 8 put forward a card clothing in which the teeth are squeezed alternatively to increase the axis density. The card sliver produced by this kind had fewer neps and the yarn produced had better evenness. Therefore, the teeth geometry plays an important role in the carding process.
According to the theoretical analysis in our early work, ‘An improvement design of groove-wound clothing on licker-in—Part I. Theoretical analysis and modeling validation’, the presence of inclination angle θ (Figure 1) leaves the fiber assembly with greater pressure and friction, which leads to more damage on the fiber assembly. When the inclination angle is 0°, the deformation and stress of the fiber assembly are smaller and their values are in a more uniform distribution, and the stress concentration is much less significant. Therefore, in this paper, this new kind of card clothing is designed and manufactured based on the licker-in rack AT5610 × 05611.
Comparison of traditional card clothing and the new design.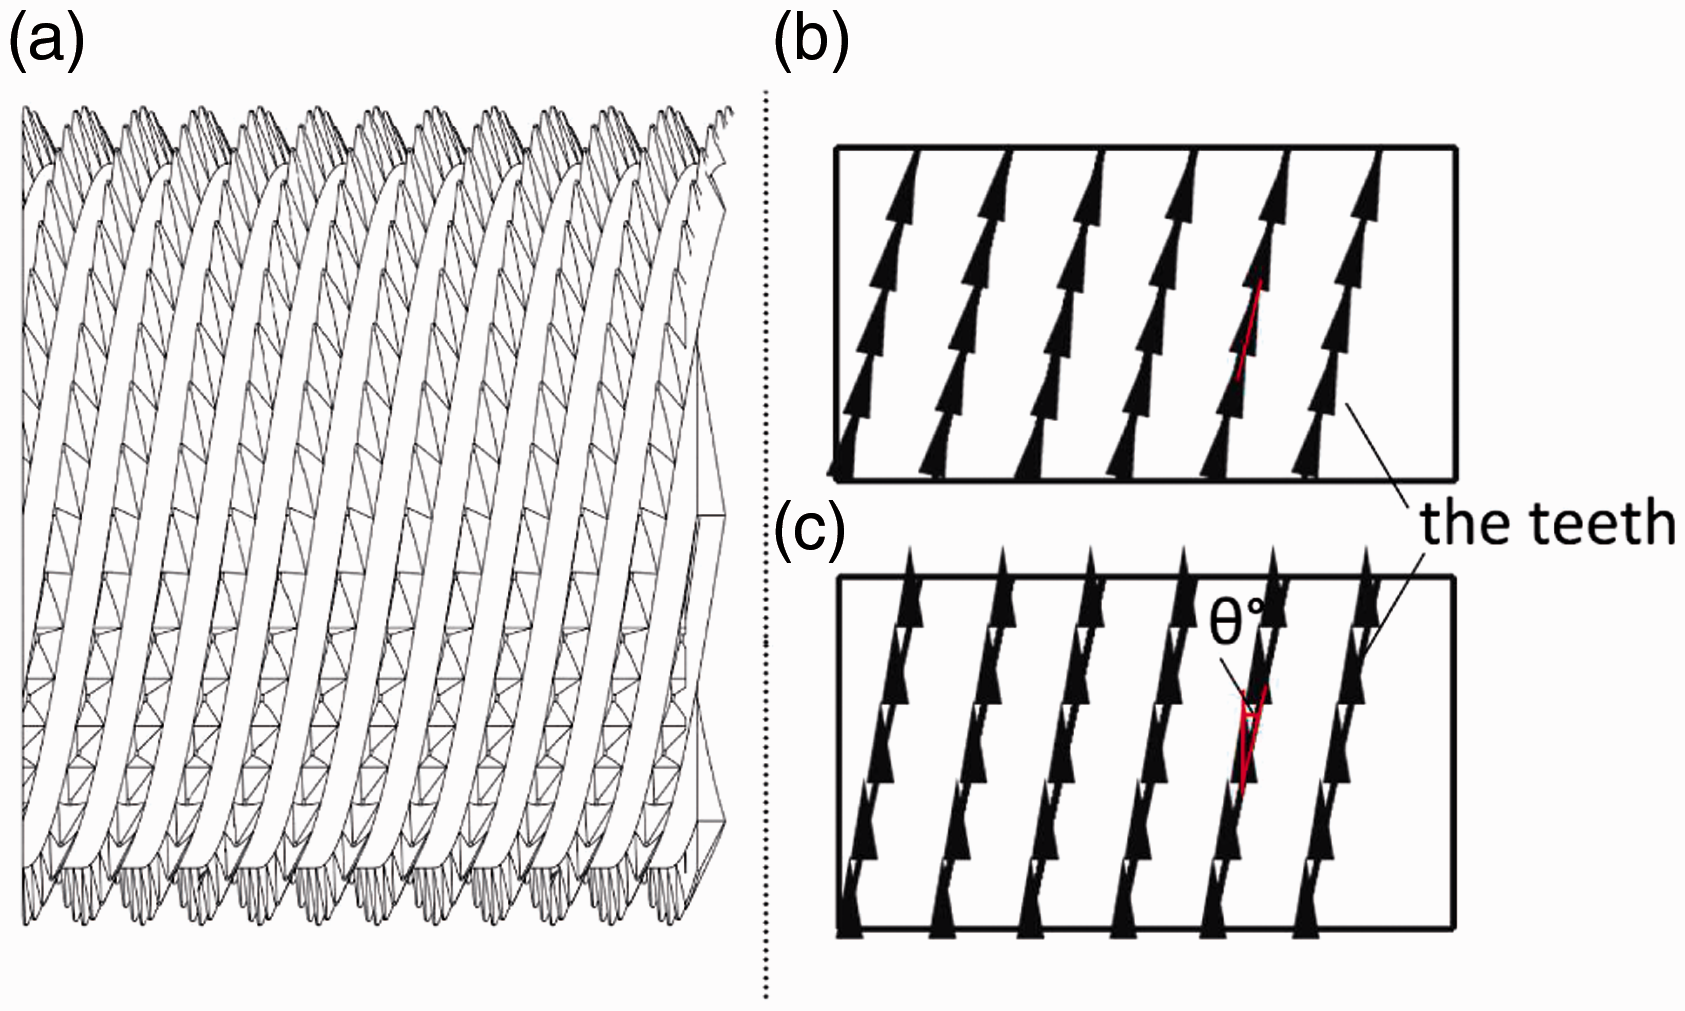
New card clothing design
Characteristics of new card clothing
According to the results of the theoretical analysis in Part I, the characteristics of the new card clothing for the licker-in in this study is that the teeth stand parallelly to the axial section of the licker-in, and vertically to the fiber flow when the card clothing is spirally mounted on the licker-in.
This visual effect is shown as Figure 1. Figure 1(a) is the diagram of the card clothing applied on the licker-in; in Figures 1(b) and (c), the surface of the licker-in is expanded and the projection of the teeth are marked as well. In Figure 1(b), the traditional card clothing is wrapped on the licker-in and all the teeth are in accordance with the spiral curve completely. In Figure 1(c), there is an inclination angle θ between the teeth axis and the helix, so the teeth’s body can work with the coming fiber flow vertically.
Card clothing preparation
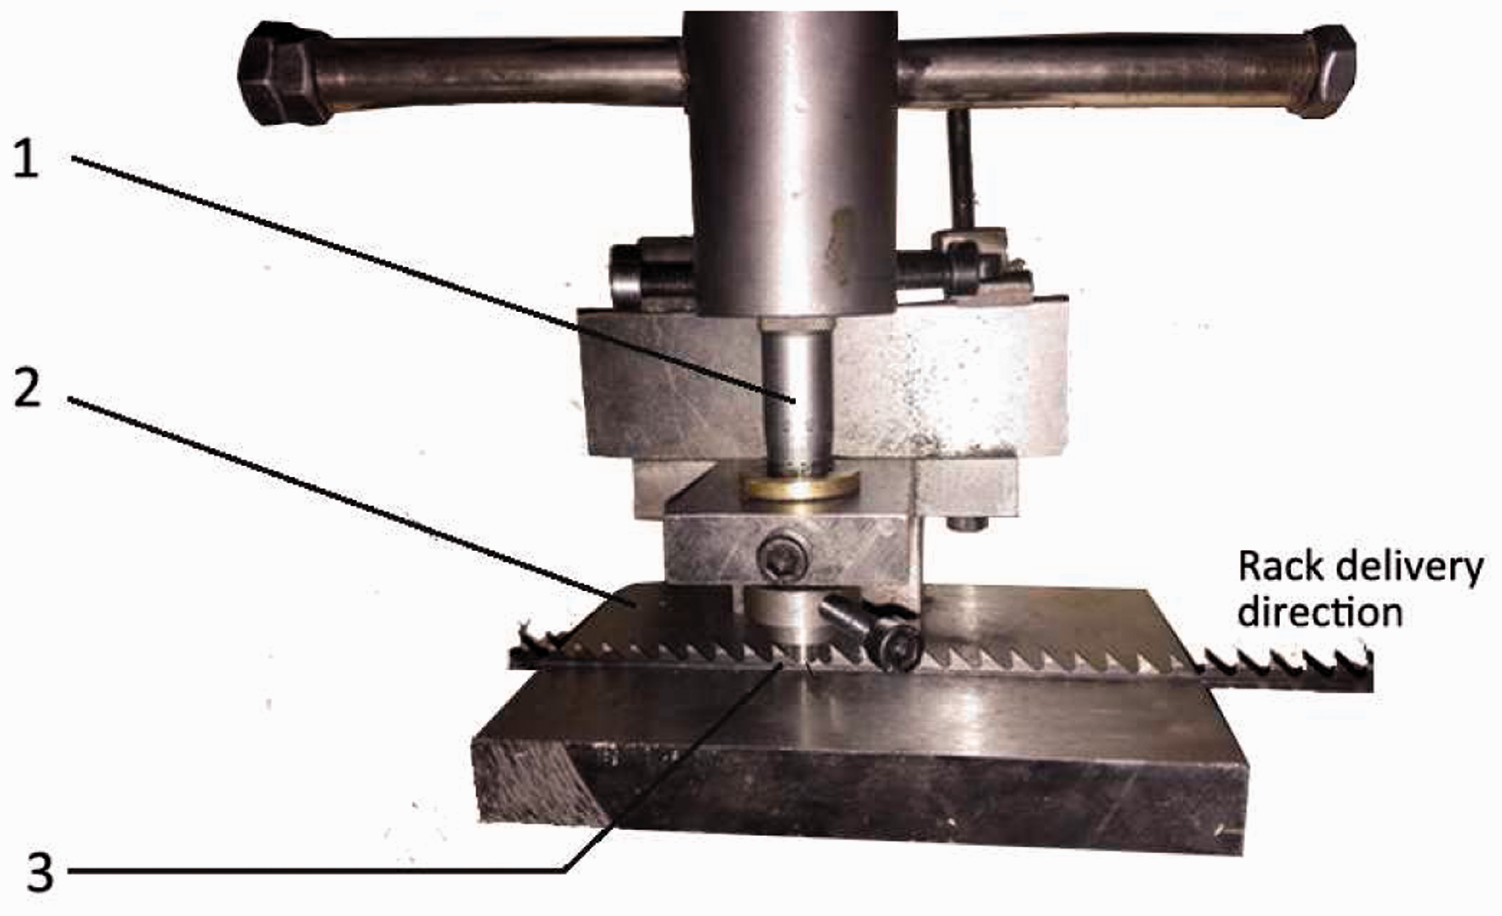
In this study, the new kind of card clothing is manufactured through small batch processing. The difference between the manufacturing processes of this new design of card clothing and the traditional card clothing is an additional teeth-torsion treatment for new design clothing (Figure 2). This means that, after the punching and the first quenching, the racks are delivered through a mold for teeth torsion, as shown in Figure 3. The angle is set as 2.68° on the dial column based on our previous work. The racks are fed into the gripper and extruded with an inclination angle of 2.68° to the axis. Then the rack is quenched for the second time. Therefore, when the rack is wound on the licker-in, the projective plane of each tooth is parallel to the circumference of the licker-in, as shown in Figure 1.
Manufacturing processes of card clothing. The additional processing method for the new kind of card clothing: (1) dial column; (2) gripper table; (3) gripper.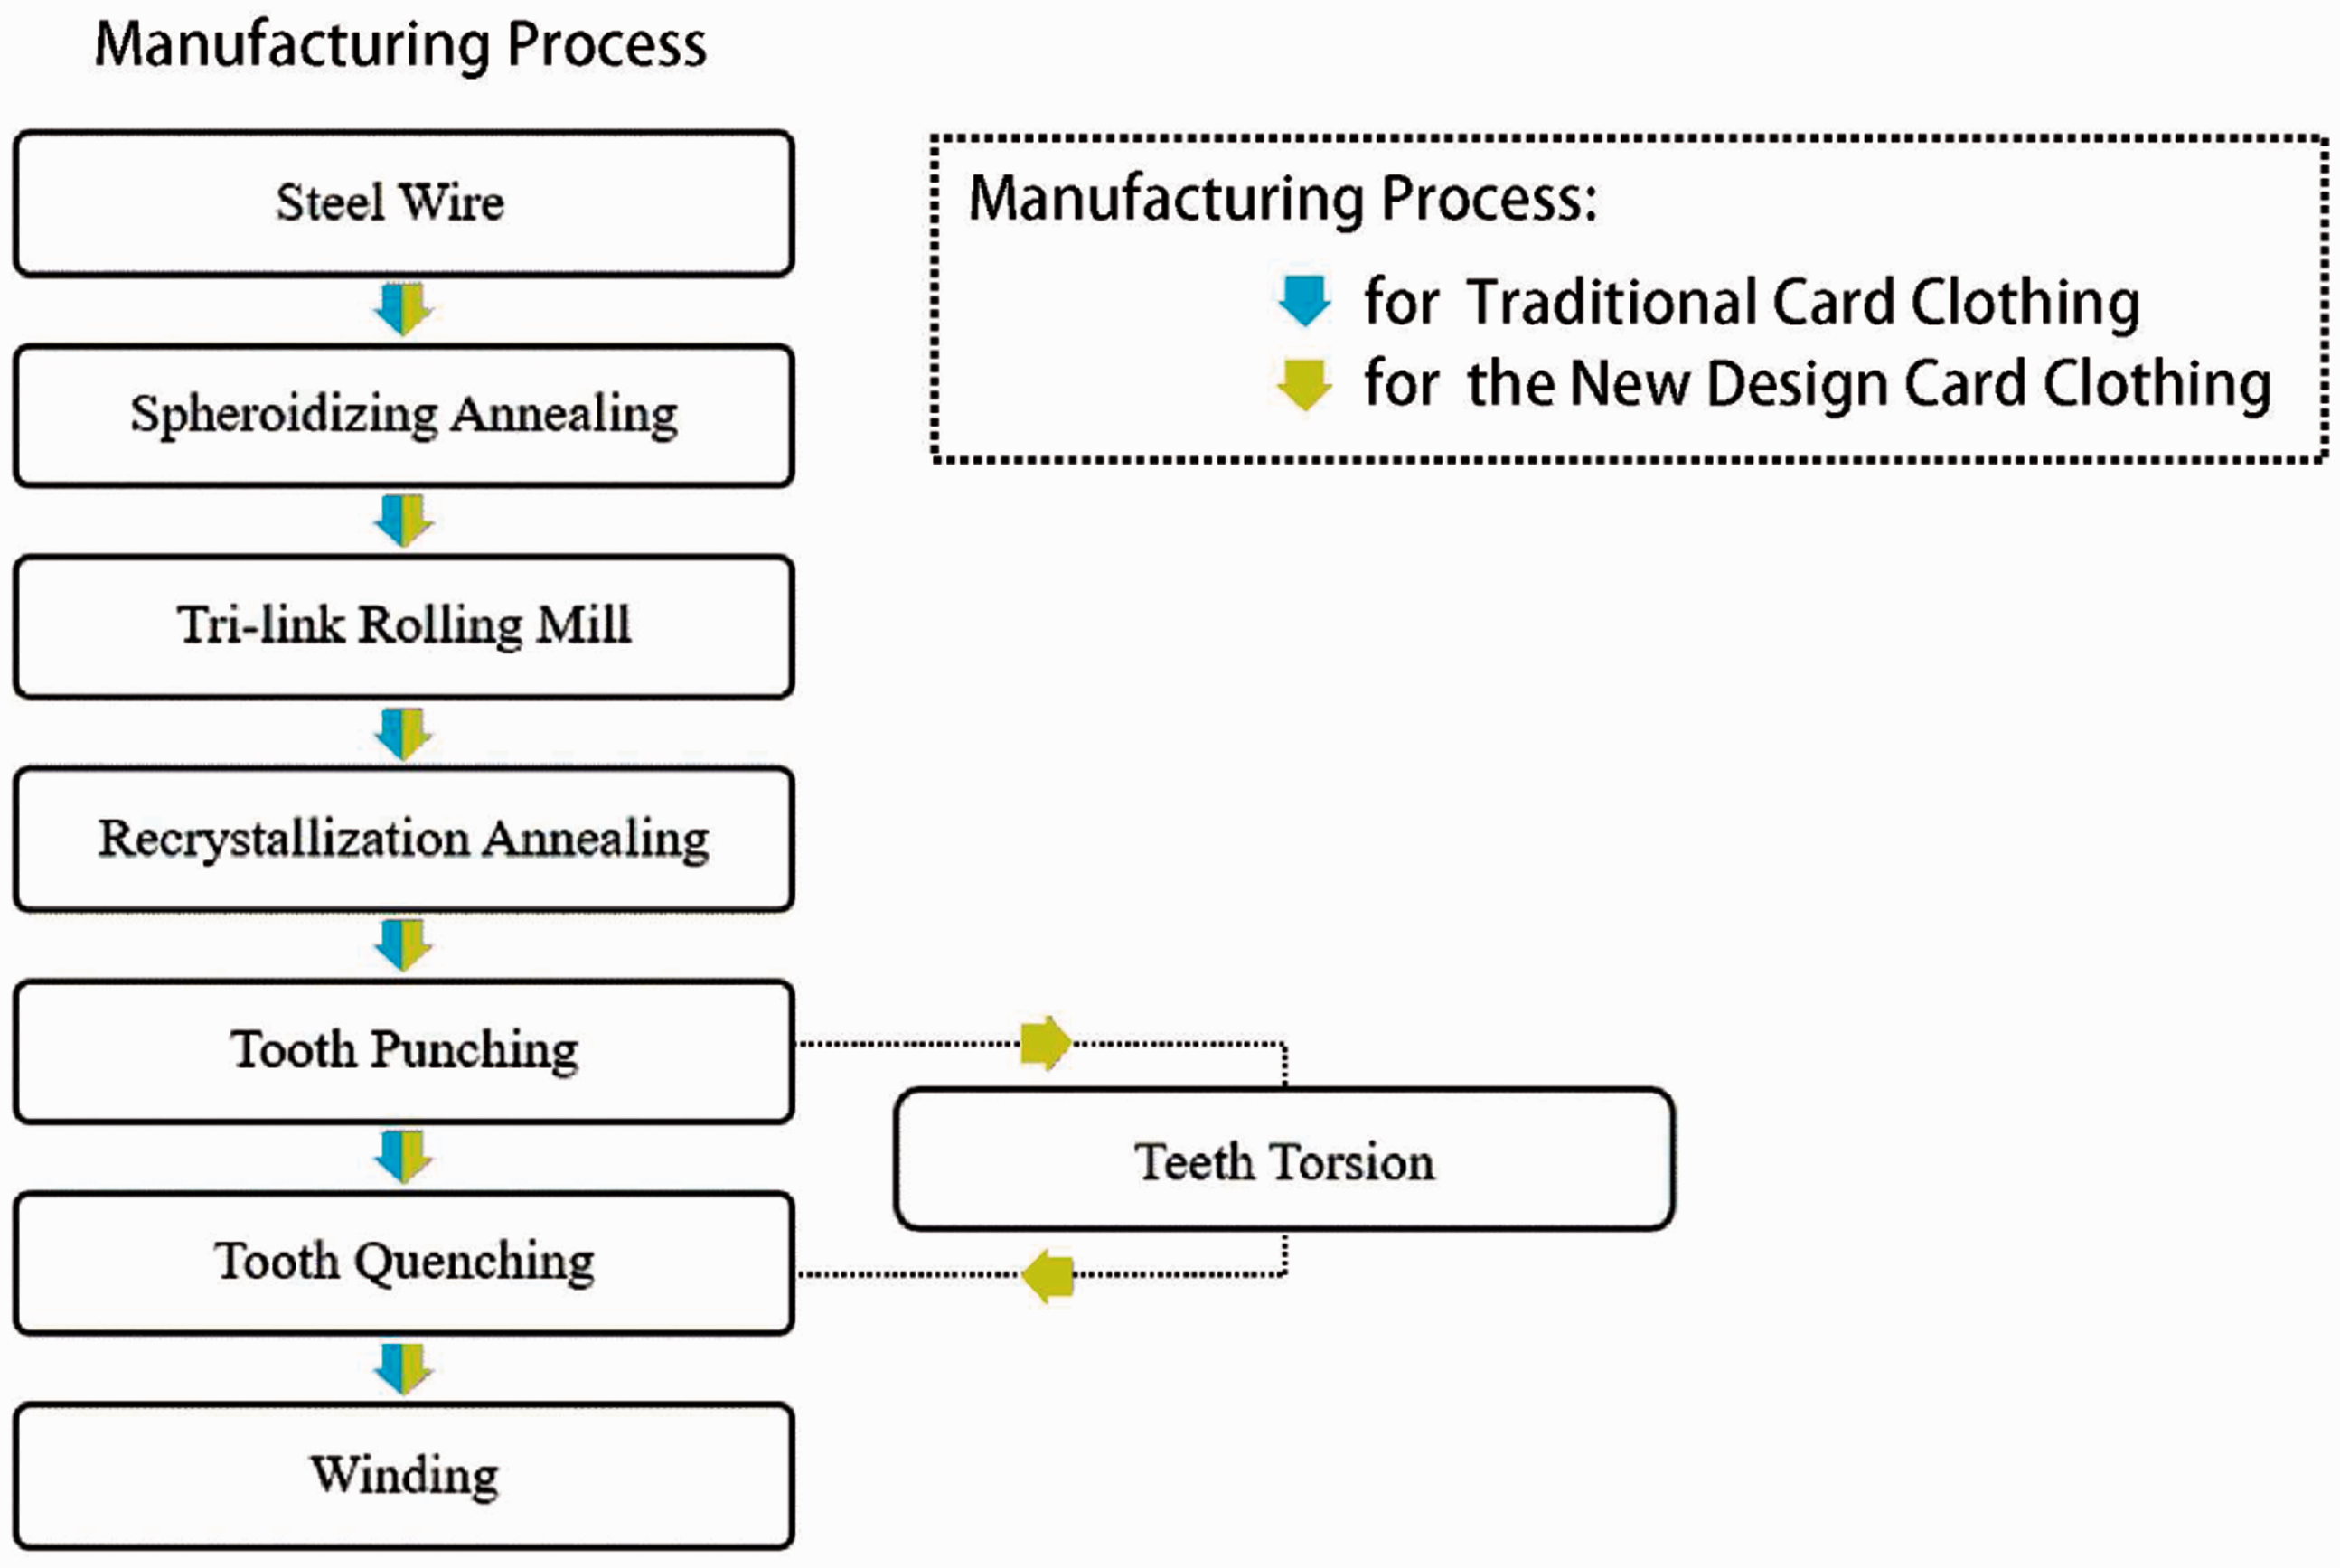
In this experiment, we manufacture an improved card clothing based on the licker-in card clothing AT5610 × 05611. The steel wire used to make the racks is from Geron Co., Ltd, China. The parameters for the tooth height, the tooth pitch, the base width and the carding angle are 5.6 mm, 5.6 mm, 1.09 mm and 10°, respectively. The point density is 105 points/inch2. Racks A and B are made from the same wire. However, for rack A, it needs to be fed into this extra mold while B does not.
In Figure 4, rack A is the new design and rack B is the traditional AT5610 × 05611 rack. They are observed under a stereomicroscope (SMZ745T, Nikon, USA) with a magnification of 8. Figure 4(a) shows racks A and B in their front view, and a crease can be seen on each tooth of rack A when we compare it with rack B; Figure 4(b) shows them in the top view. For rack A, there is an angle θ between the teeth and the card clothing base, while for rack B this angle is zero. This inclination angle makes the teeth have an angle θ to the longitudinal direction. The licker-in on which the rack is wound has a diameter of 250 mm.
The rack of the new design and the traditional AT5610 × 05611 rack.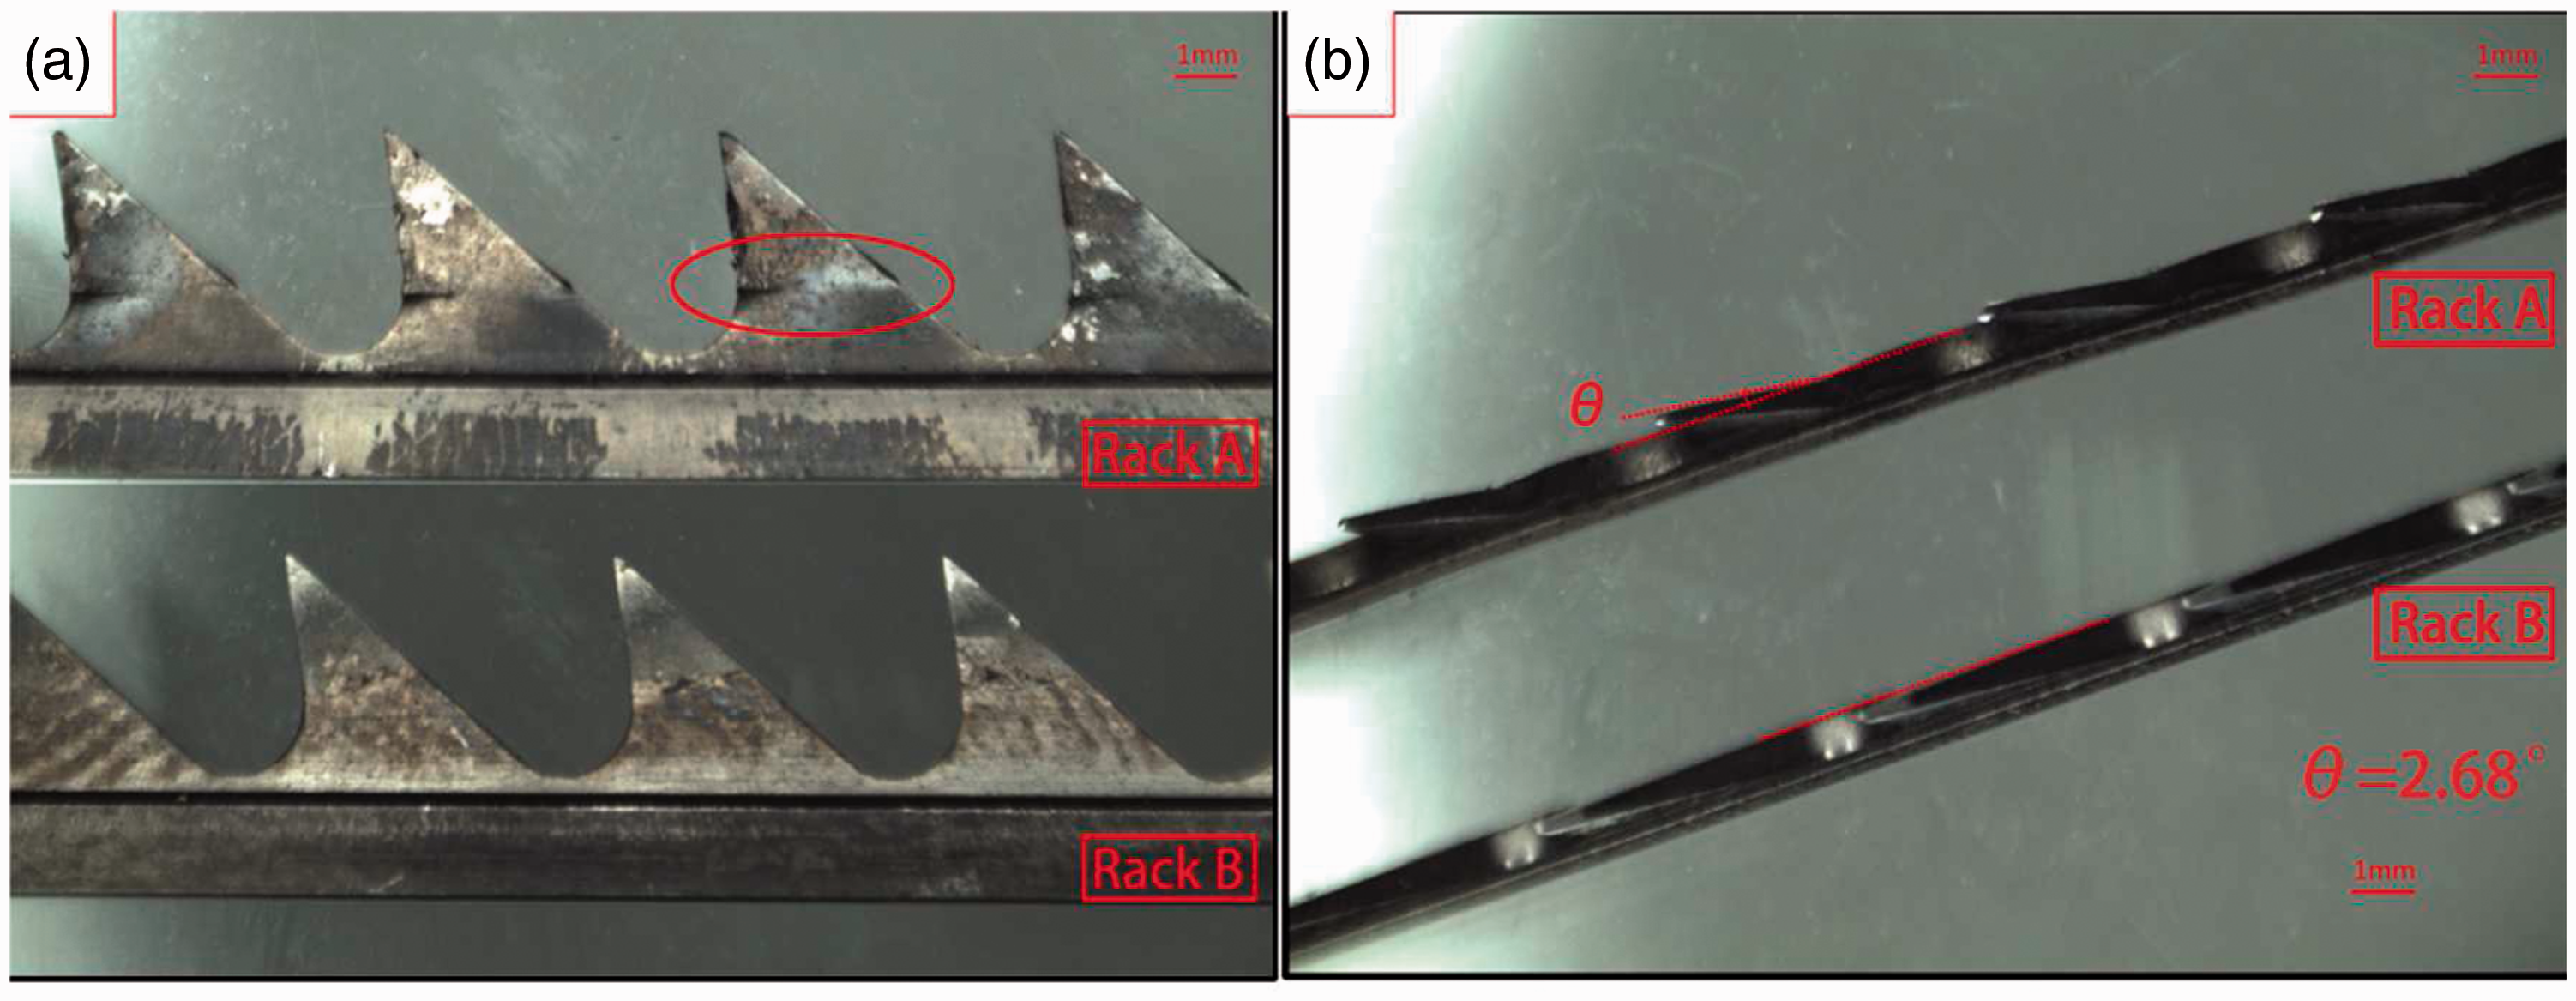
Experimental details
Experimental design
We designed a comparison experiment between racks A and rack B. They are set as experimental test A and control test B, respectively. Both tests are conducted on the same carding machine. The quality of the card sliver of these two tests is compared to study the carding effect after this improvement design. In addition, for further investigation, the card sliver, licker-in droppings and card strips are also weighed to calculate the producing rates. In addition, some relative yarn properties have also been tested and are discussed briefly.
Experimental parameter setting
Information for the raw cotton
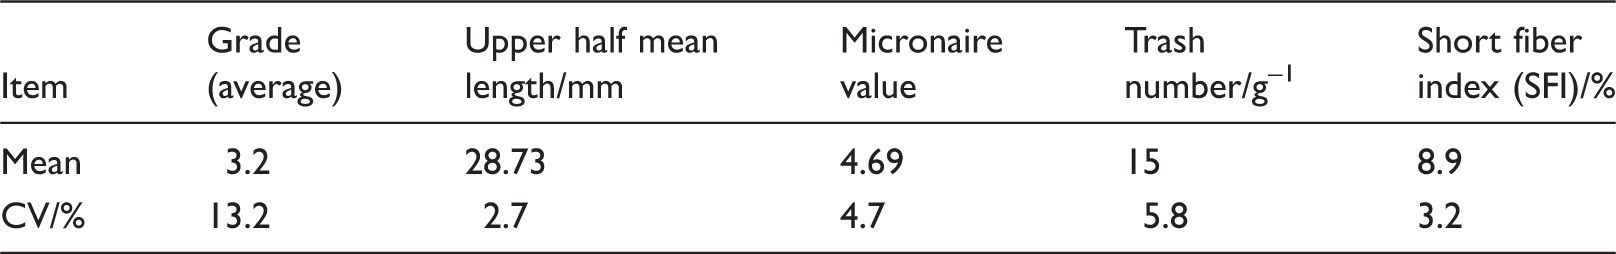
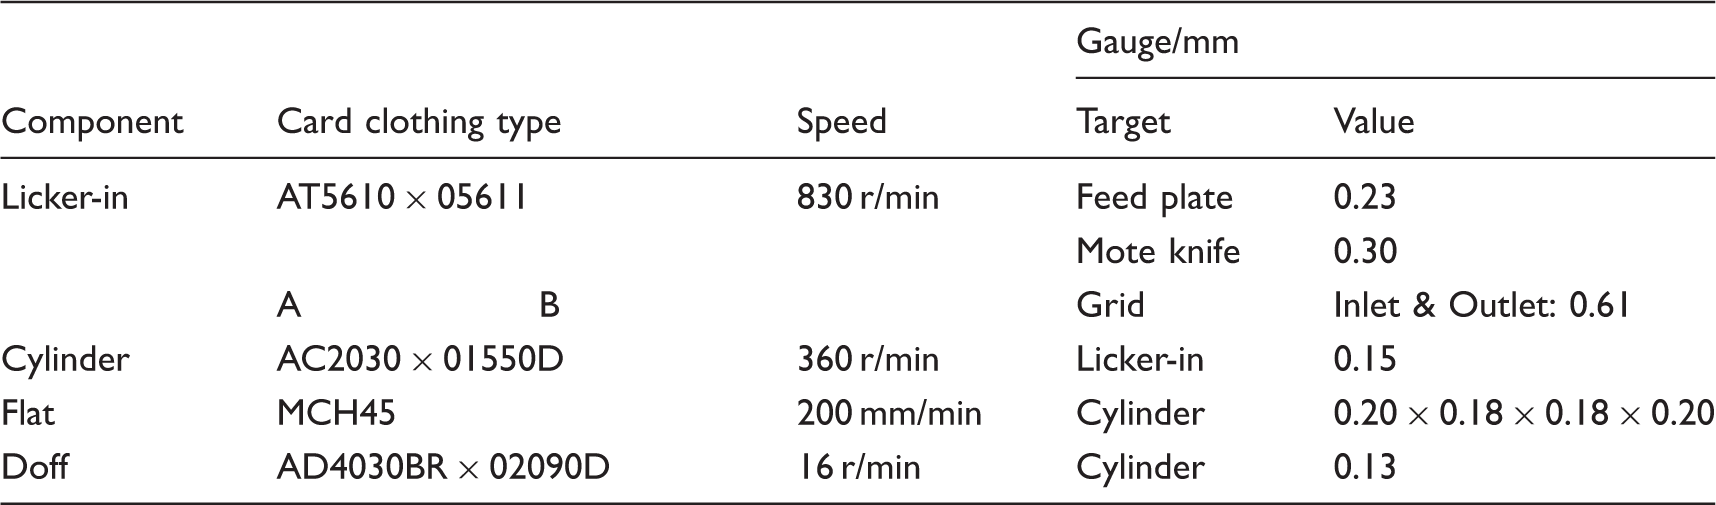
The carding machine used for this experiment is an FA231C manual lap-feeding carding machine (Qingdao Textile Machinery Co., Ltd, China), shown in Figure 5. A manual lap-feeding card is chosen to be used in this experiment because we can compare the quality of the fiber assembly before and after the carding machine with the test results of the mat and card sliver. All the card clothing used and the relevant settings for the card are listed in Table 2. The linear weight of the card sliver is set as 3.98 ktex under conventional moisture regain. The sliver is delivered at a speed of 55 m/min.
The FA231C manual lap-feeding carding machine used in this experiment. Card clothing used and parameters relevant to this experiment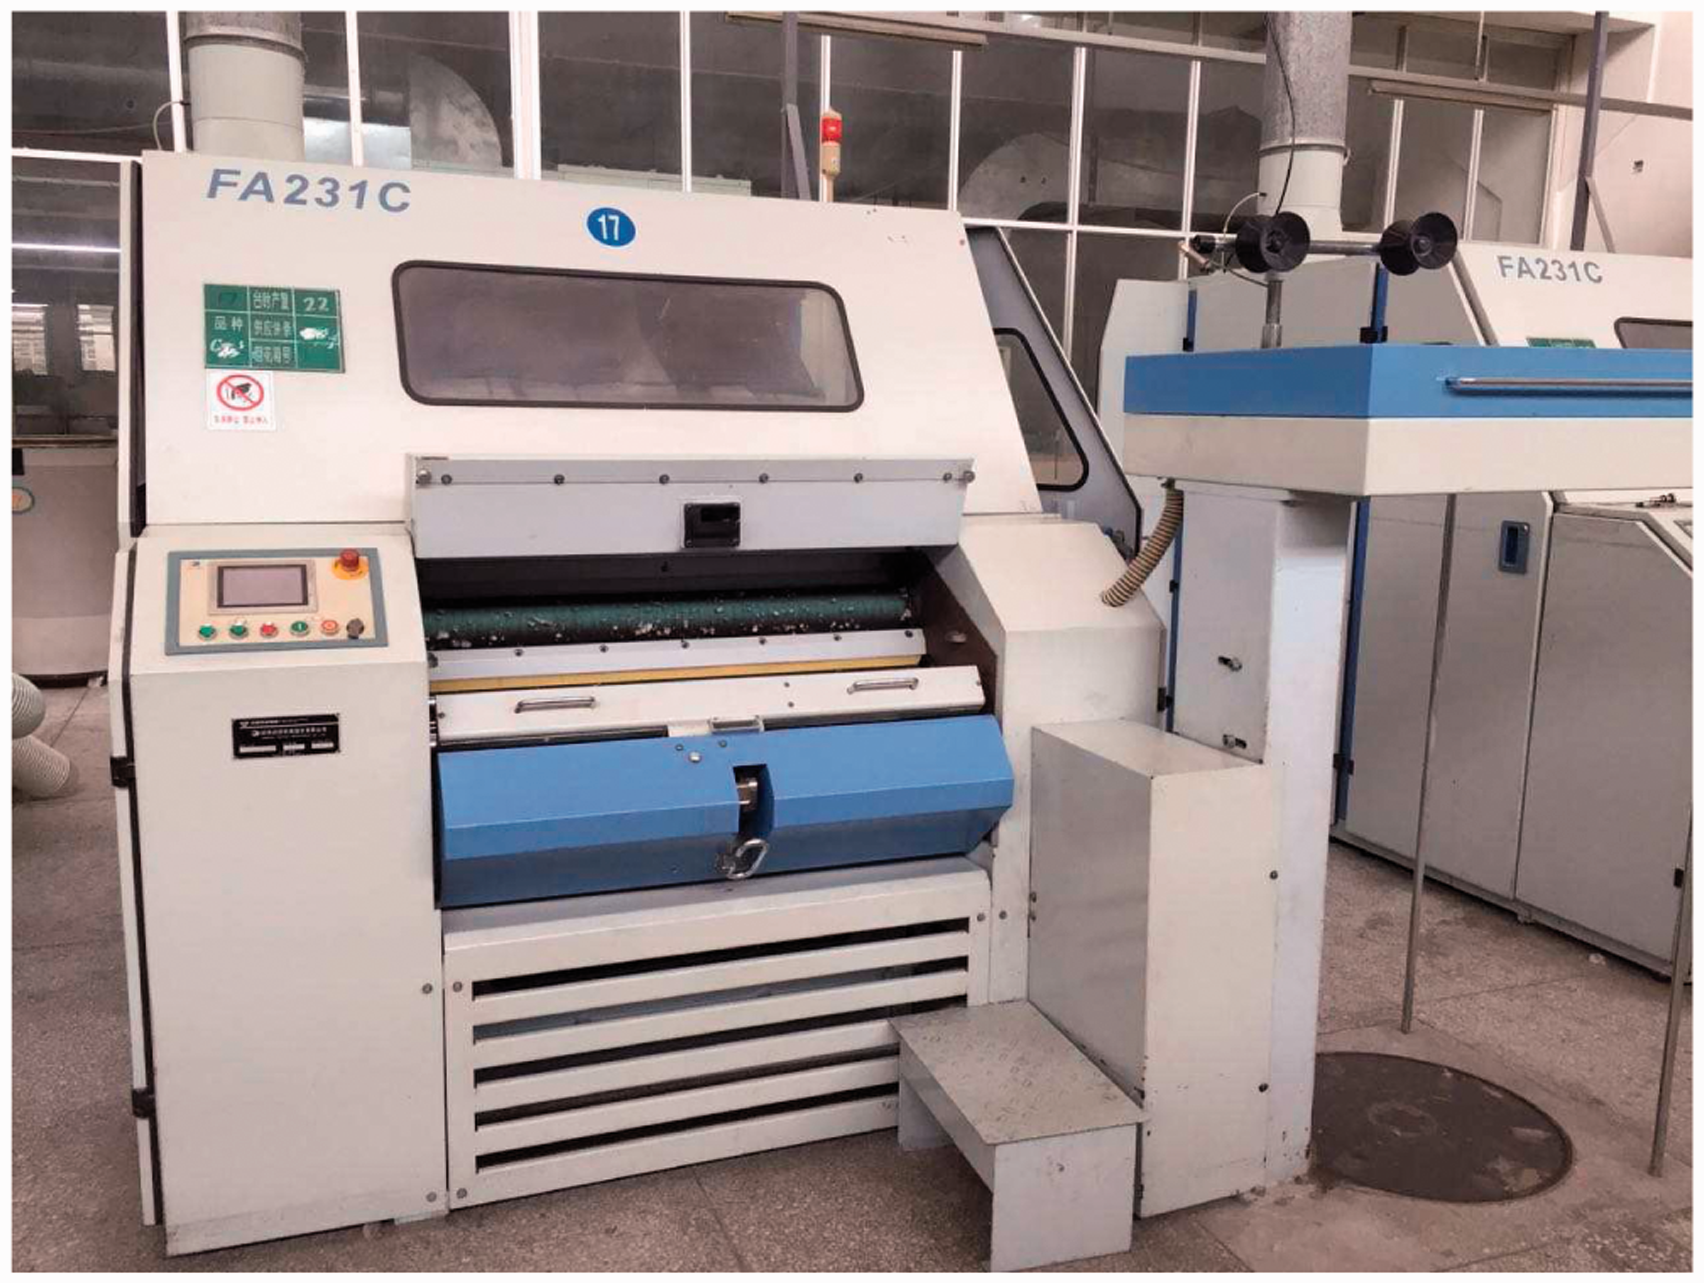
The sliver quality is characterized by the indicators provided by the USTER® AFIS PRO.9,10 These indicators are the short fiber, trash and nep removal efficiencies. For the AFIS test, all the experiments are carried out at the temperature of 22℃ and the relative humidity of 65%.
Sampling the cotton lap
In order to guarantee the results to be reasonable, five cotton laps are applied to both A and B tests as repeated trials. All five cotton laps are selected randomly to ensure the representativeness of the quality of the laps. They are numbered as 1, 2, 3, 4 and 5. Tests A and B both use these five laps.
Sampling the mat
When replacing a lap from the carding machine, we make a piece of mat from this lap as the sample for the AFIS test. For each lap, two samples are taken out. The weight of the sample is about 0.5 g.
Sampling the sliver and noils
When one lap is applied to test A or B, the carding machine is set to work for 15 min. Every time the machine is shutdown, all the card sliver, licker-in droppings and card strips are collected and weighed. From each sliver, four samples are picked and tested by AFIS.
Producing rate
To determine the rate of production, the weights of the cotton lap before and after use and the weight of sliver should be weighted. In addition, for the initial stage of carding, there are some fibers wasted, and these wastes are also taken into consideration as the experiment is not on a large scale. Recording the weight of sliver cans with and without the sliver, the weight of the card sliver can be measured.
Noil collection
The noil analysis experiment mainly focuses on the taker-in droppings and card strips, with a specially designed collecting device. Figure 6 shows the noil collection device used in this study. This device is on during the carding process and suck out the noils. Chamber 1 collects the taker-in dropping. The noils from chambers 2 and 3 are collected together as the card strips.
The specially designed device for collecting noils.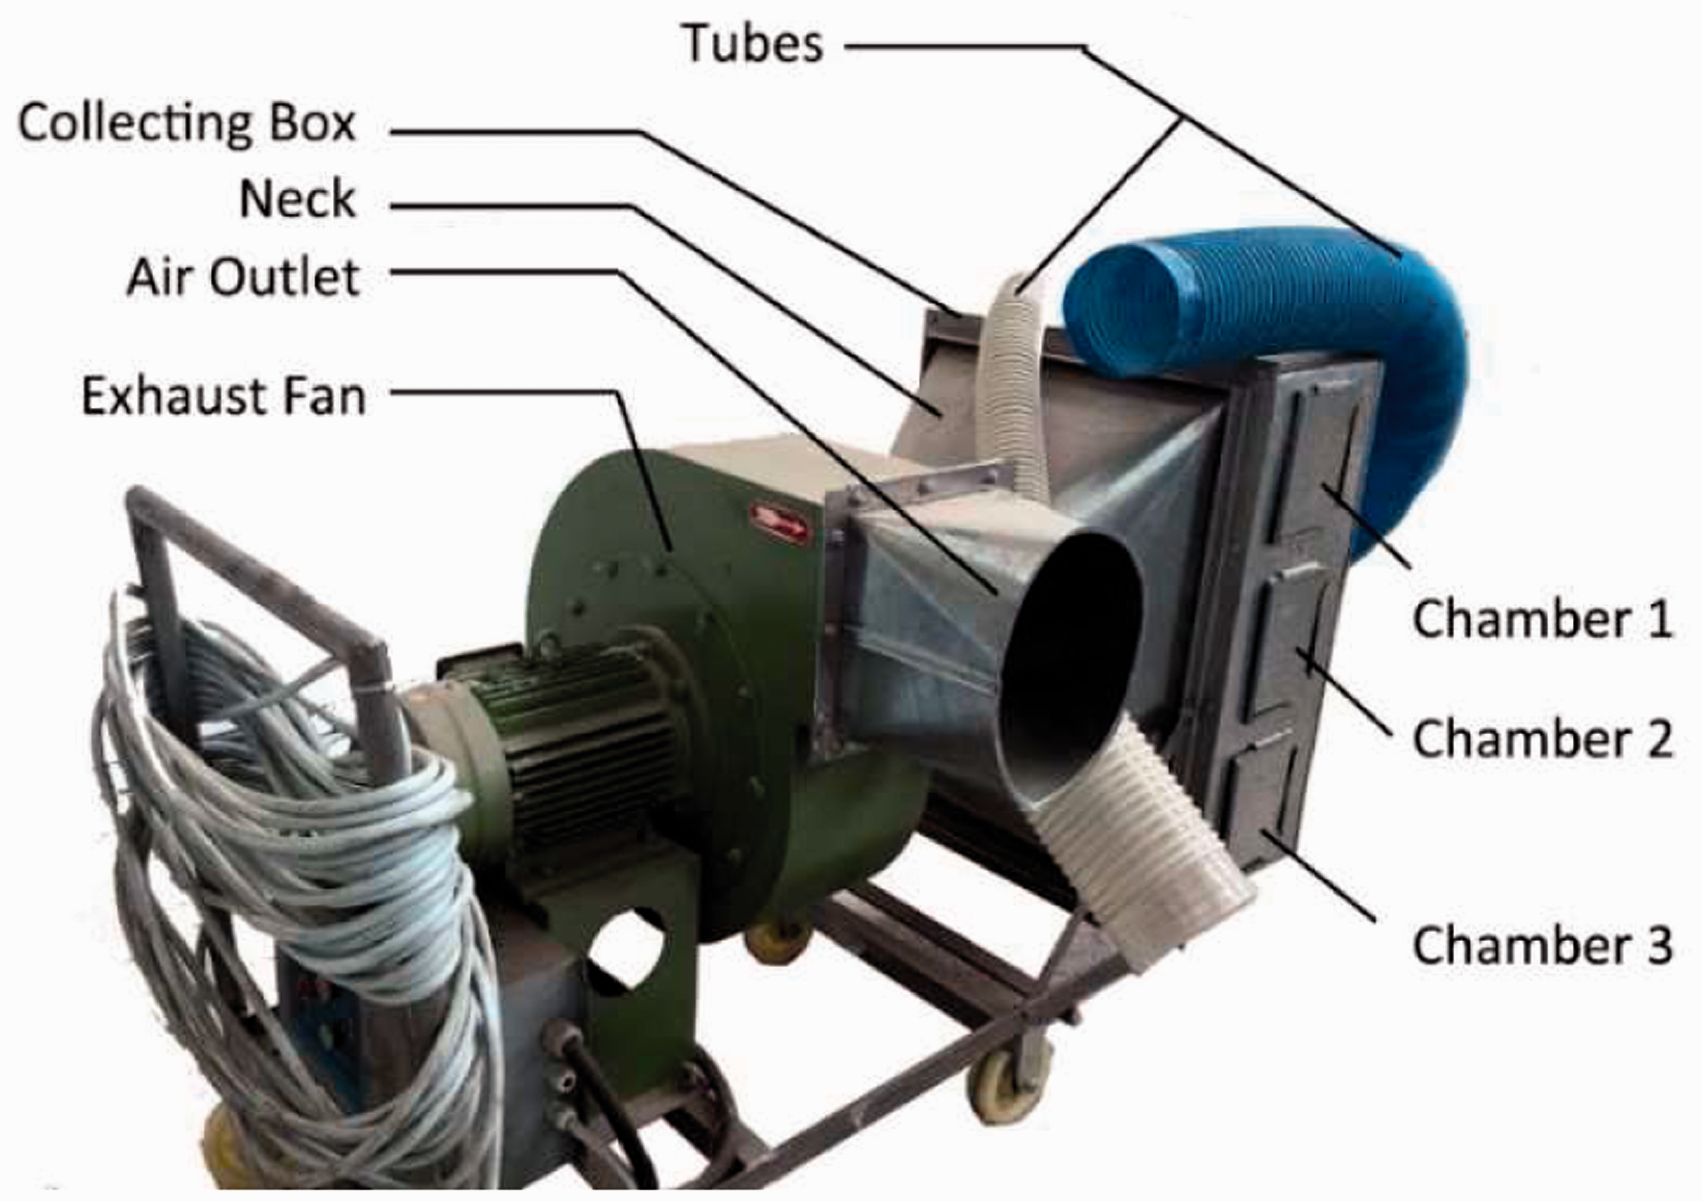
Yarn properties
As all the sliver quality should serve for the yarn property, the yarns from racks A and B were compared and the linear density is set as 14.6 tex. The drawing, roving and the spinning processes for A and B were done on the same head or spindle of the same machine. The tensile property experiments were conducted on an USTER® TENSORAPID and the results were the average of 10 yarn samples; each sample was tested six times (based on GB/T 398-2008 with some adjustments). The yarn evenness experiment was taken on an USTER® ME100 based on 10 samples (based on GB/T 3992. 1-2008). The speed is 400 m/min, and the duration is 1 min.
Results and analysis
Sliver quality analysis
Nep analysis
The results of neps in card slivers are shown in Figure 7. For each sliver, there are 20–30 neps per gram. The nep number in the mat is in the range from 280 to 310 per gram. The number of neps in every gram of sliver is less than that in every gram of mat. The reduction can represent the nep removal efficiency of the carding machine.
11
The average number of neps for A is 21.1, which is 24.41% less than B. So, there are fewer neps in slivers of Test A than that of Test B.
Comparison of the number of neps in slivers.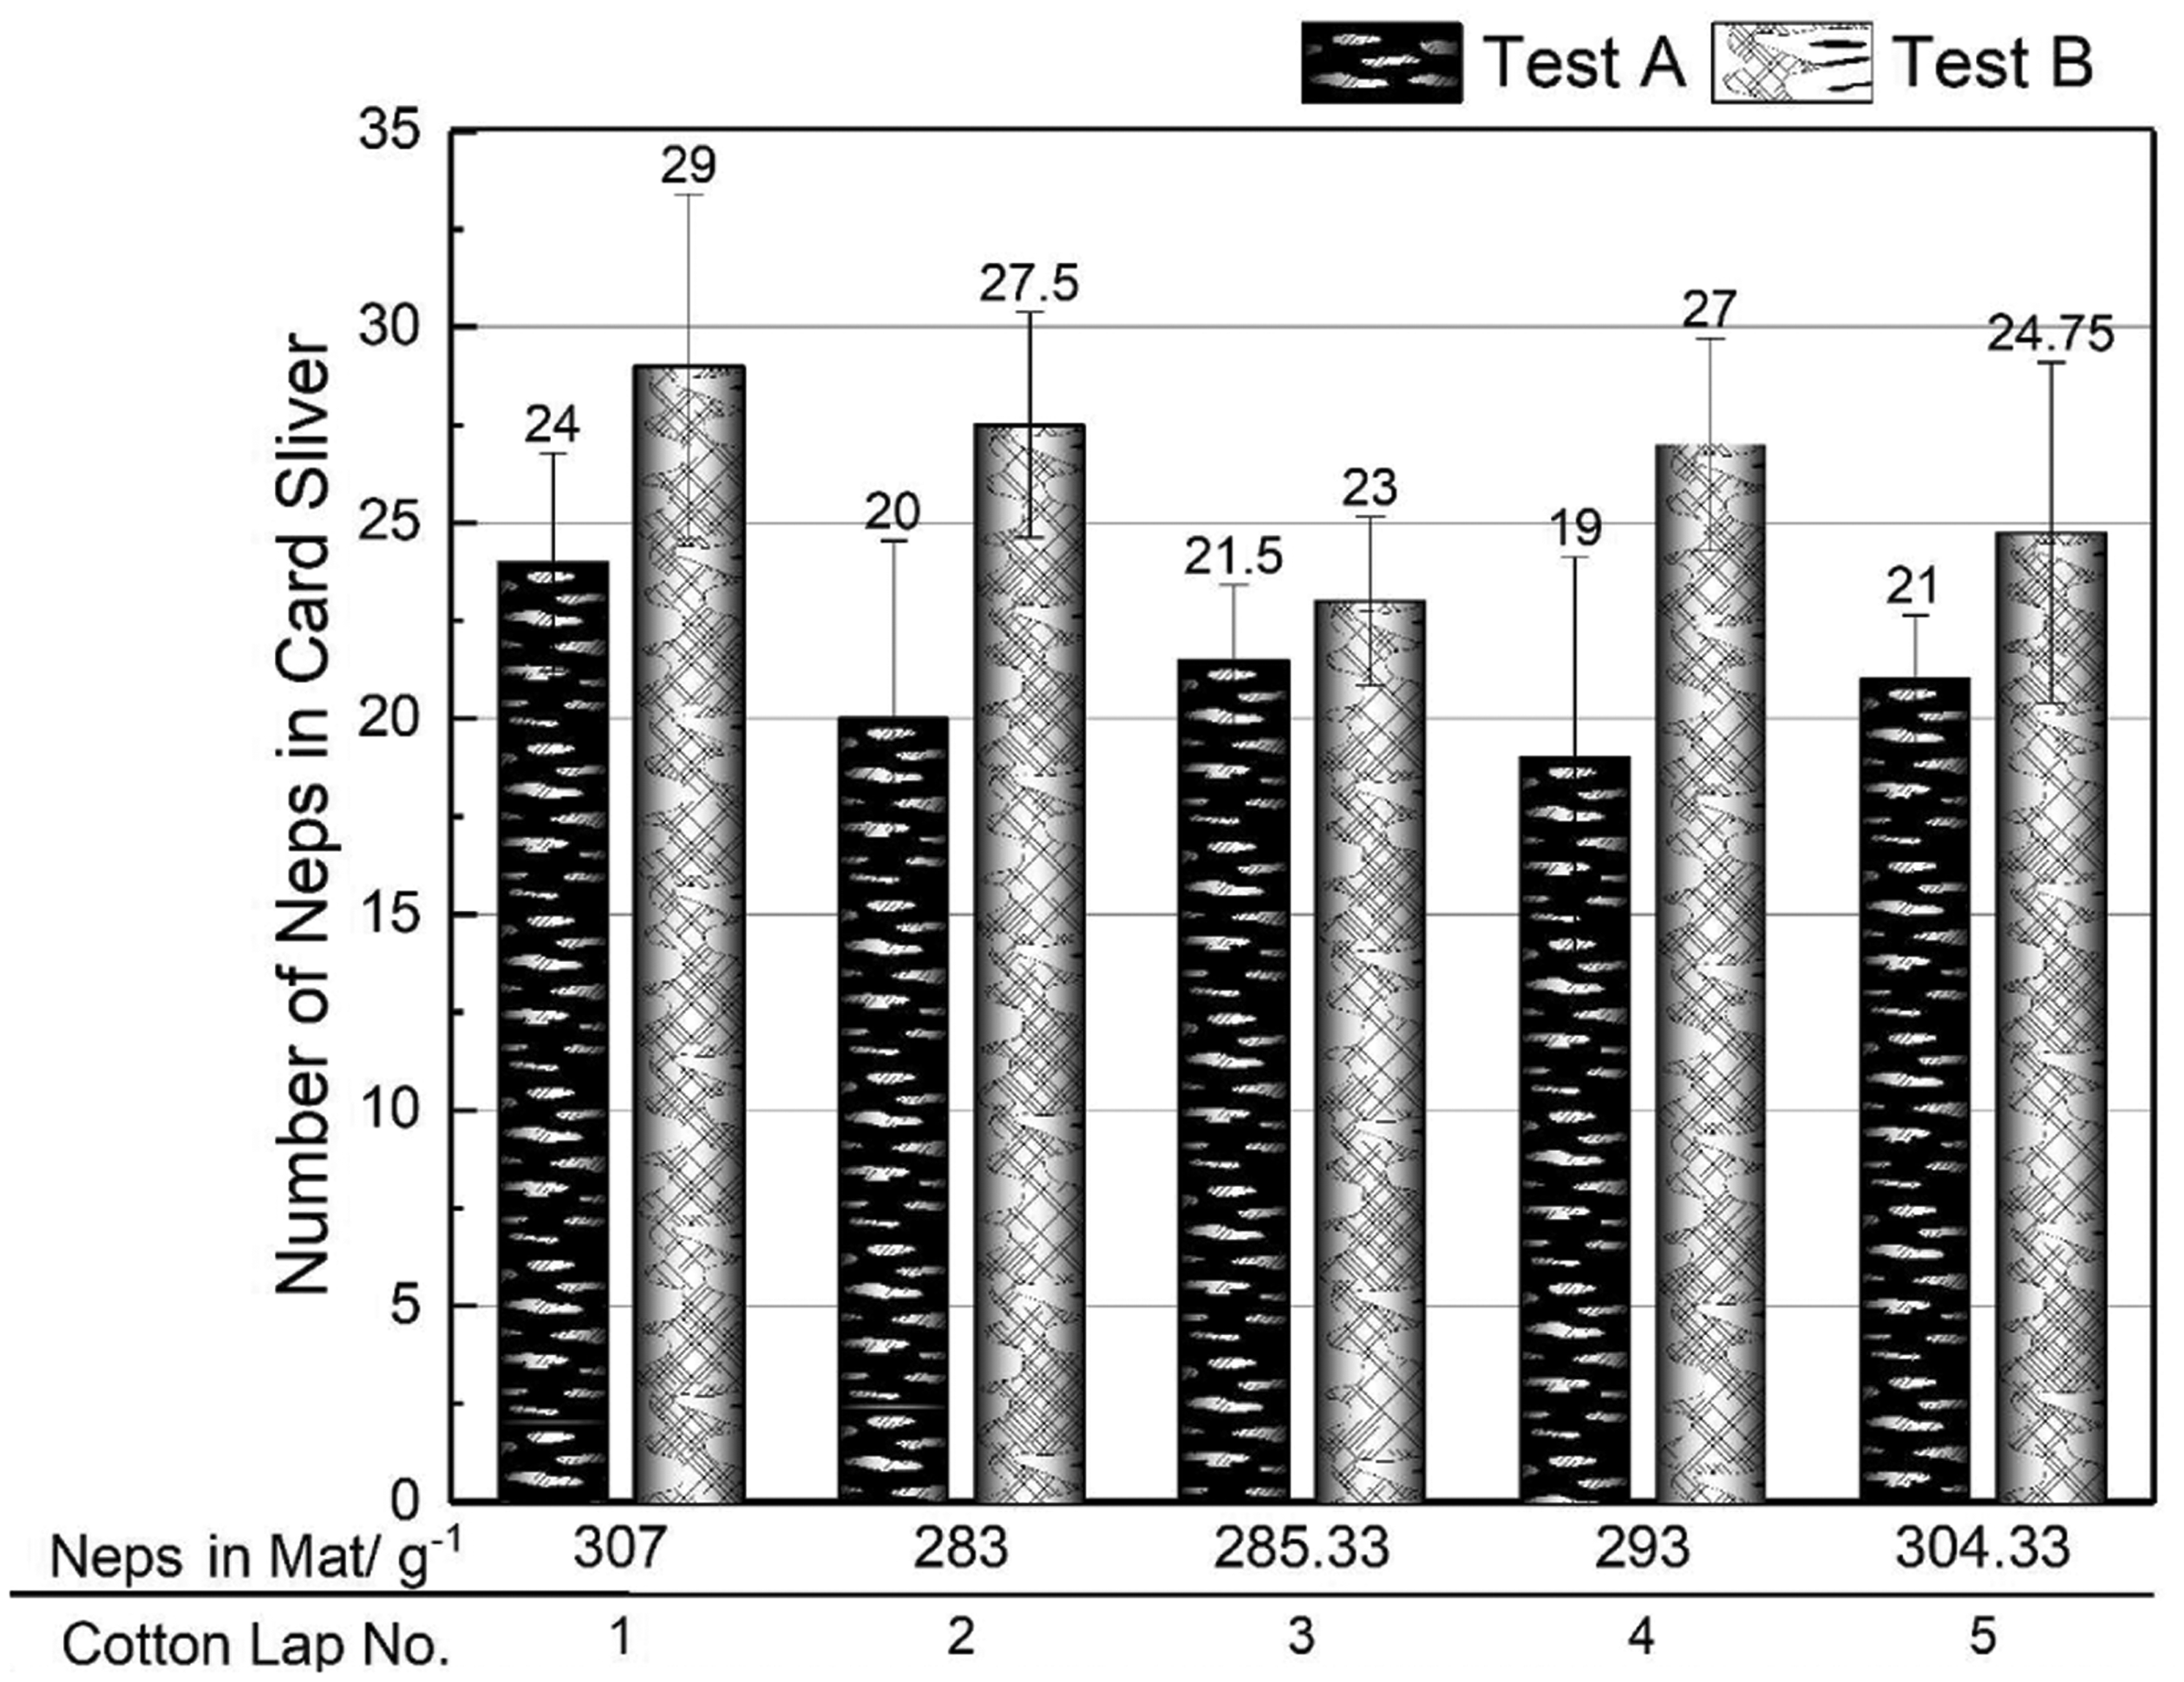
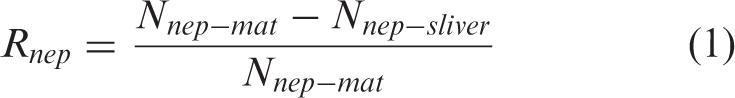
Nep removal ratio
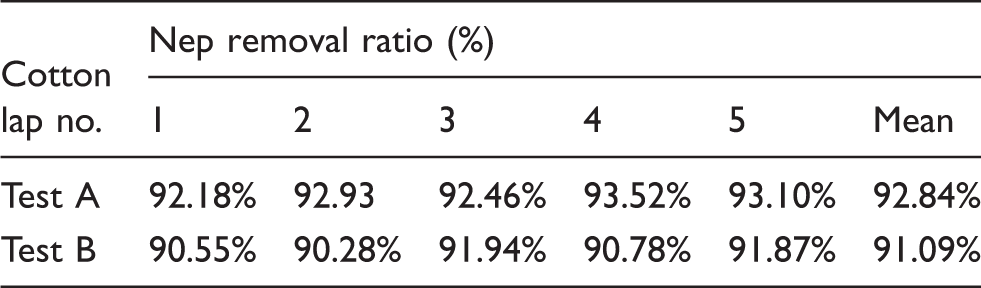
Assuming that the quality of a lap can be presented by the mat sample, the difference between each lap is considered. Therefore, for the slivers from the same cotton lap, the card clothing of the licker-in is the only variable. Then the paired samples test 13 is done to see whether the difference of the nep removal ratio between Tests A and B is significant. The t value is calculated to be 4.16, and the df is 4. The corresponding significance probability obtained by SPSS (Statistic Package for Social Science) software is 0.014, smaller than 0.05, which means that the difference between A and B is significant. Therefore, the improvement on nep removal is credible.
The cotton nep in the mat is a fiber group kinked by the mature fiber. Most of them can be opened and carded into single fibers during the carding process. Due to the presence of the inclination angle, the space between teeth declines, so the fibers between every two lines of racks are compressed with heavier forces and the interaction of fibers is enhanced. This larger interaction makes the fiber bundle difficult to decompose. The inclination leads to the friction path increasing between the tooth and the fiber (referred in Part I), which increases the probability of knotting between the fibers. Finally, as we mentioned above, the teeth in rack B bring more force on fibers, and thus more short fibers can be produced because of fiber damage. The short fibers are important reasons for neps forming in the area between the flats and the cylinder. This hypothesis is supposed to be verified by the short fiber results later. All of the above can be possible reasons for the higher number of neps in test B.
Trash removal analysis
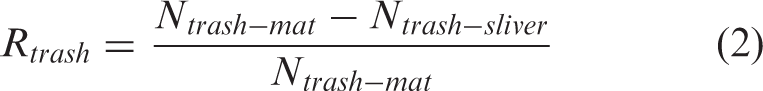
In this research, the trash removal ratio is calculated as shown in Equation (2) to establish the variation of the trash in per unit mass of the fiber assembly. The impurity removal efficiency of the licker-in part should be controlled in the range from 50% to 60%,
14
which means the licker-in plays an important role in trash removal. So, the trash elimination should been taken into consideration to verify the carding effect of the new card clothing as well
The trash results are shown in Figure 8 and Table 4. The average trash removal ratio (Rtrash) of A is slightly higher. To be specific, in Figure 8, three groups of test B show more trash remains in the sliver than in A, while the other two groups show the opposite results. Therefore, the test results cannot fully draw the conclusion of impurity purification improvement.
Comparison of the amount of trash in slivers. Trash removal ratio in the card sliver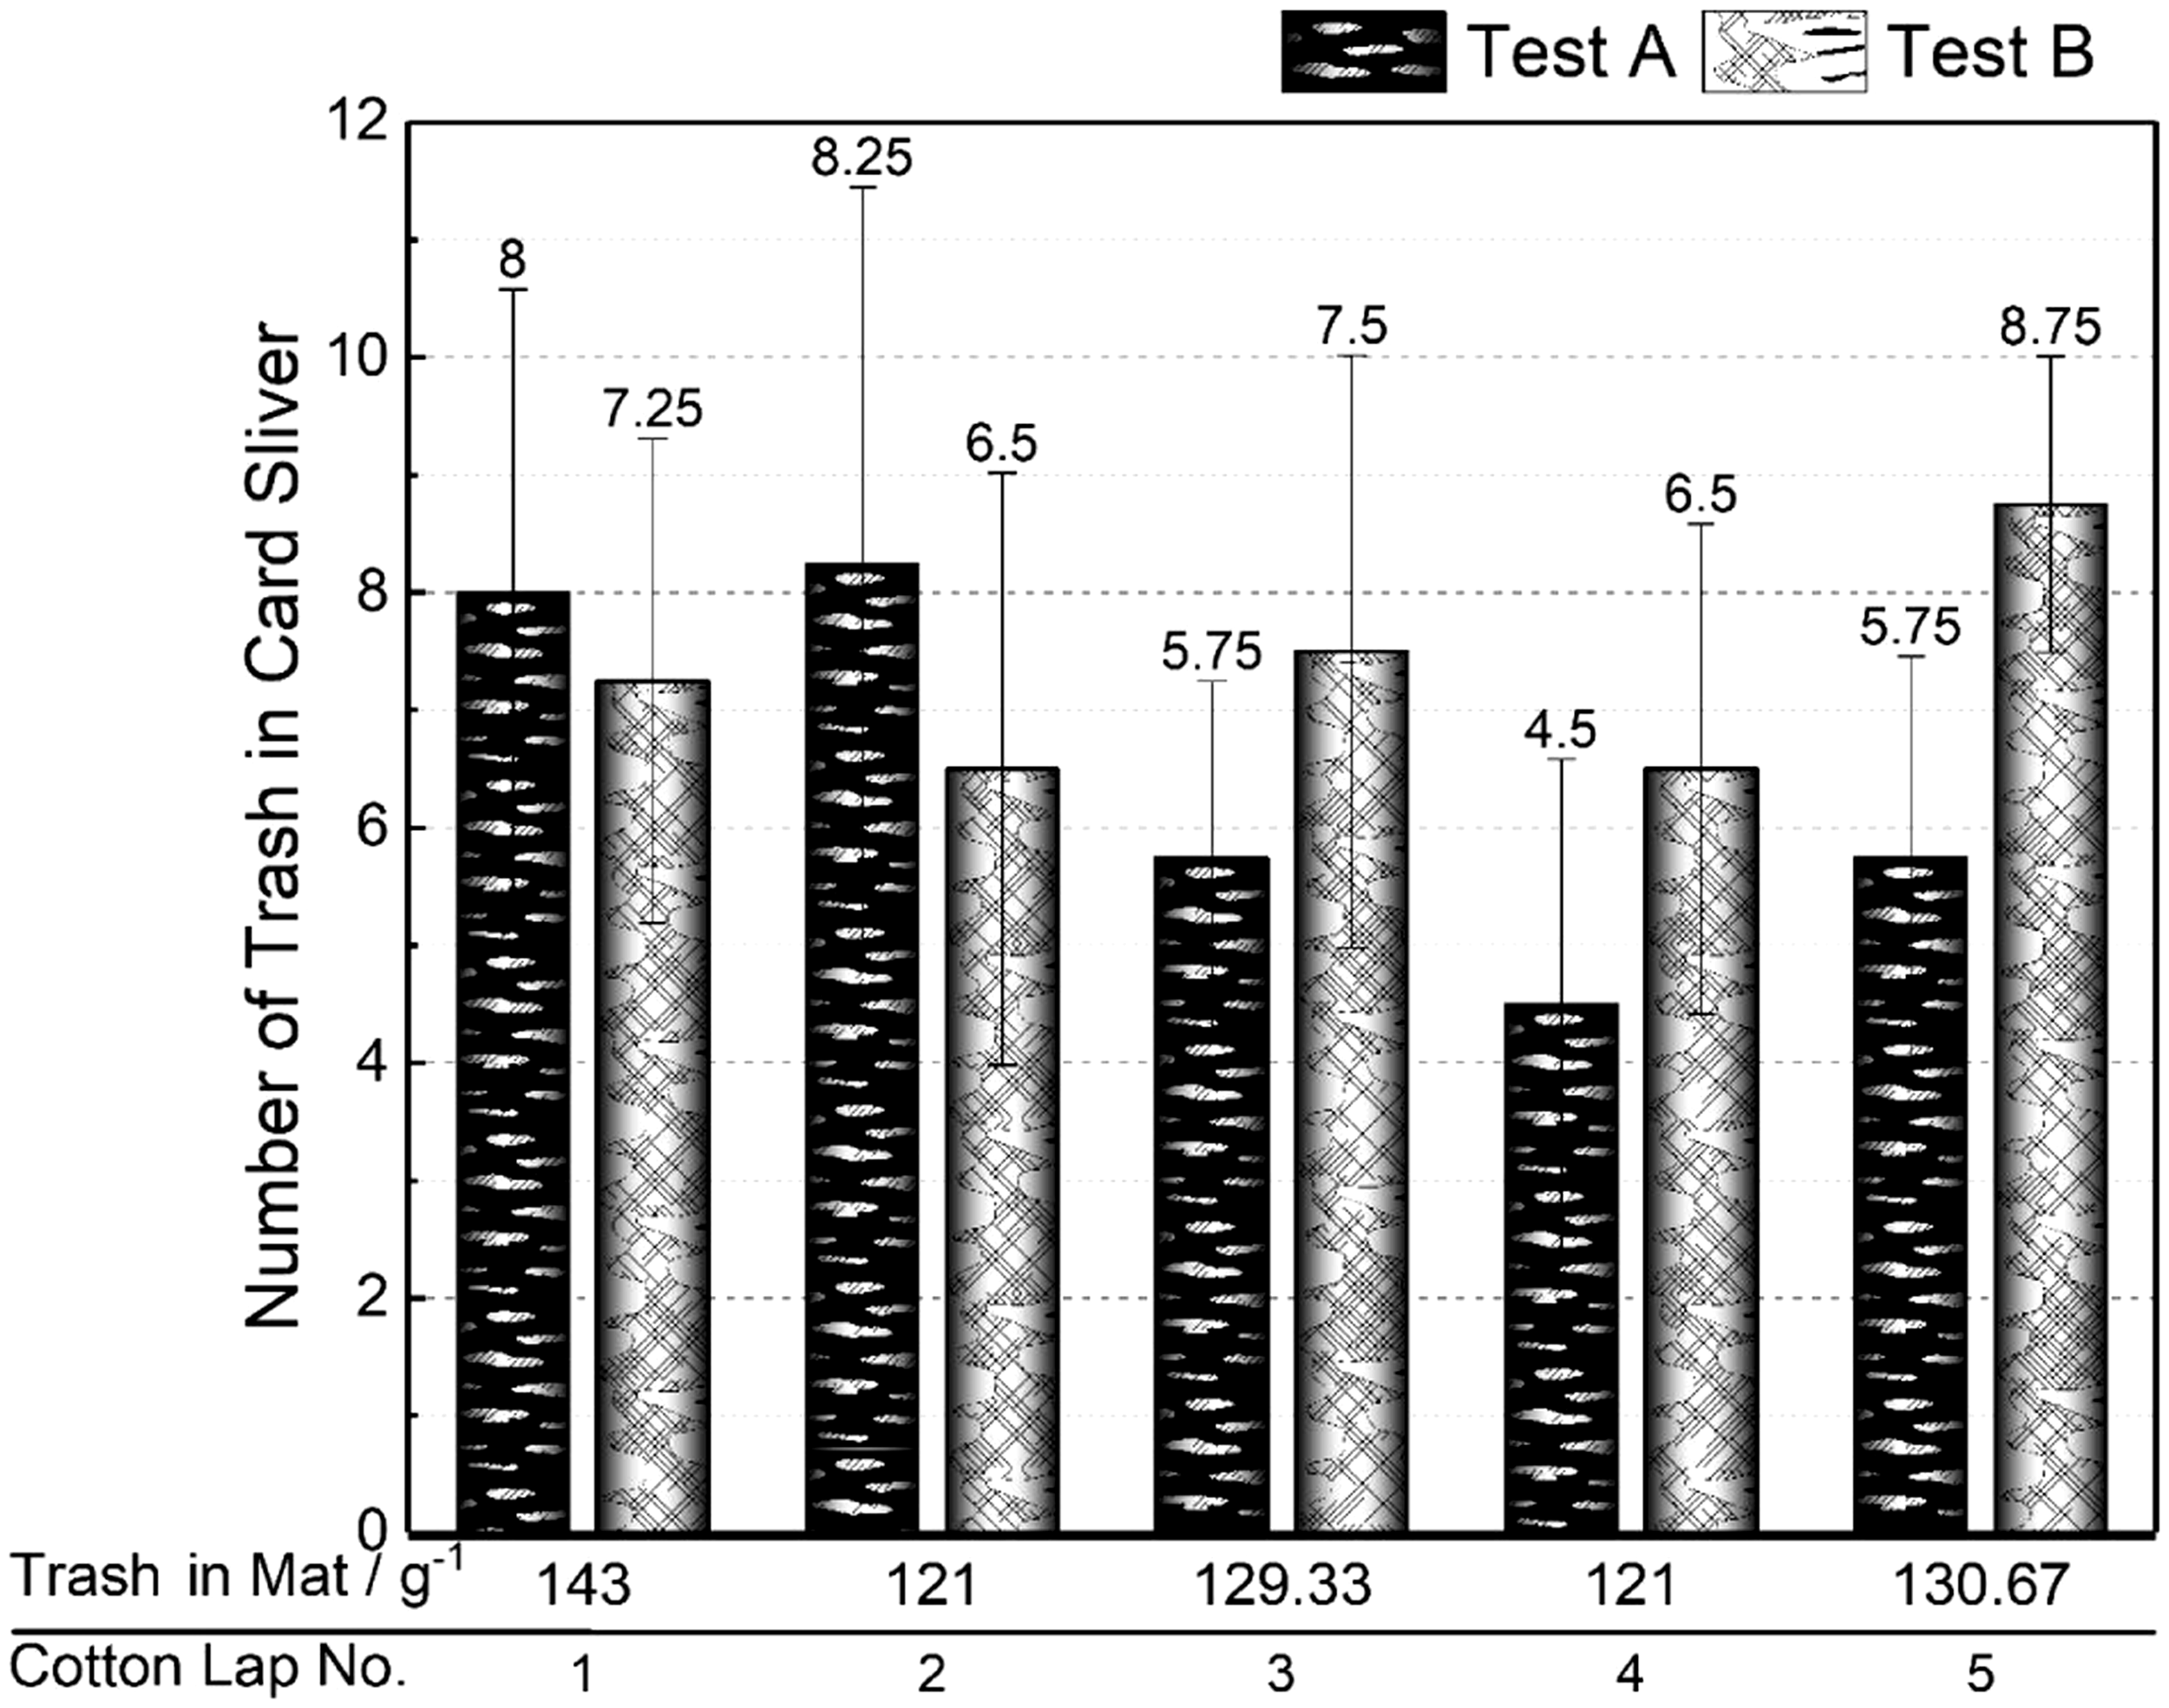
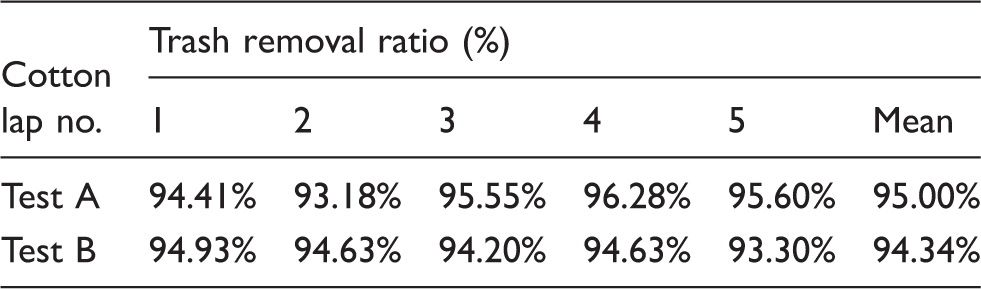
A further paired samples test is done to see the difference between the trash removal ratios of A and B. The t value is calculated as 0.943. The significance probability is 0.399, much higher than 0.05. Therefore, the difference between tests A and test B is not significant. This phenomenon means that this new design has no special improvement on trash cleaning. So, this new kind of card clothing produces no worsening effect on the impurity removal.
The trash removal efficiency of a carding machine has a significant relationship with the centrifugal force and the allocation on dust dropping zones, 15 so the teeth change have limited influence on it. The theoretical models in our Part I paper only show differences I then forces of fibers, so the constant results on trash are acceptable.
Short fiber content
The short fiber content (SFC) in the sliver can be represented by two properties, which are SFC by weight (SFCw) and SFC by number (SFCn). The short fibers refer to fibers shorter than 12.7 mm regulated by the USTER®. SFCw is the percentage of short fiber weight to the total fiber weight, while SFCn is the percentage of short fiber number to the total fiber number.
From the SFCw results shown in Figure 9, those of A and B are nearly the same. For these five groups of tests, the SFCw average value of tests A and B are 7.41 and 7.33, respectively. The difference is less than 1%. Furthermore, the paired samples test also shows a significance probability of 0.512 (>0.05), which means there is no significant difference between A and B with regard to SFCw.
Short fiber content by weight (SFCw) and short fiber content by number (SFCn).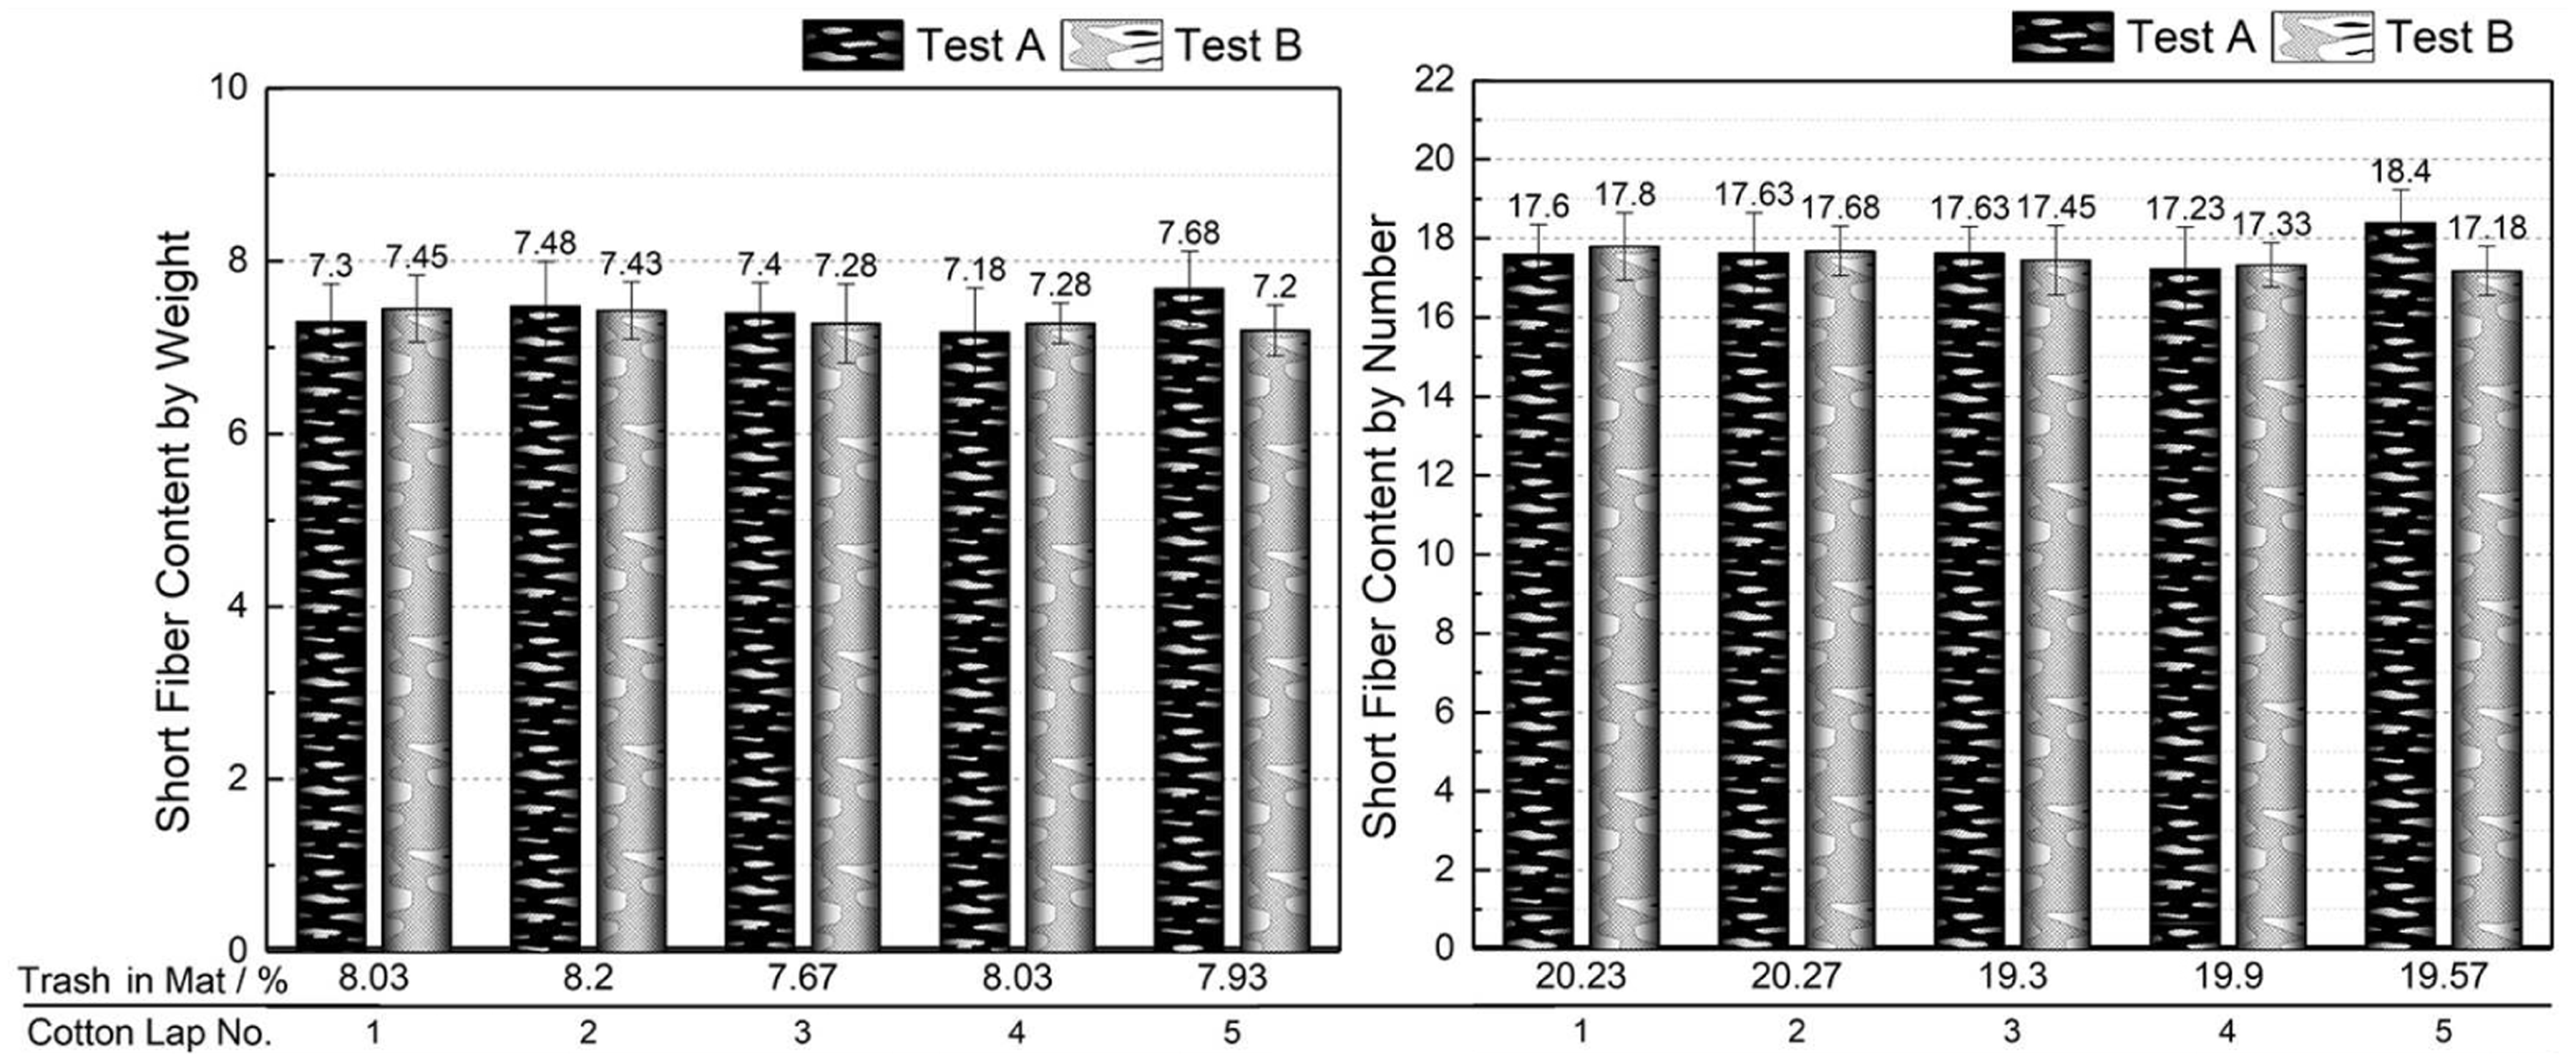
SFCn is also taken into consideration (Figure 9). The average values of are still not obvious distinguished. The significance probability of the paired samples test is 0.465 (>0.05). So, the difference for SFCn is not significant, either.
The analysis of both theoretical analyses and test results on sliver neps refers to a high potential for the new card clothing on declining SFC. In addition, during the carding process, the carding force in the licker-in part is relatively heavier than the other parts and it causes fiber damage and produces new short fibers. 16 In the sliver quality results above, it seems that the SFC does not have much relationship with the change of this new design of card clothing. That is to say, this new kind of card clothing has no negative or positive effect on SFC in the card sliver. However, when it comes to the short fibers in the carding machine, what should not be neglected is that the short fibers distribute not only in the slivers, but also in the noils from the card. Therefore, the noils should be analyzed further.
Noil and fiber yield percentage analysis
The results above show that the difference of SFC in the sliver is not significant, so the change of short fibers, which is expected in our above analysis, may be reflected in the noil quantity. Therefore, the fiber yield percentage and noils are calculated to verify the hypothesis.
The noils studied in this experiment are the taker-in droppings and card strips. The taker-in droppings can reflect the fiber damage on the licker-in. The calculating method is shown in Equations (3)–(5)
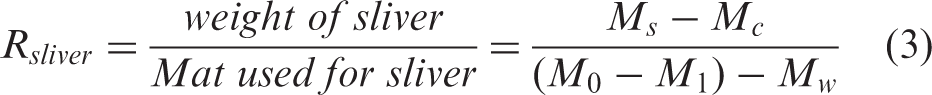
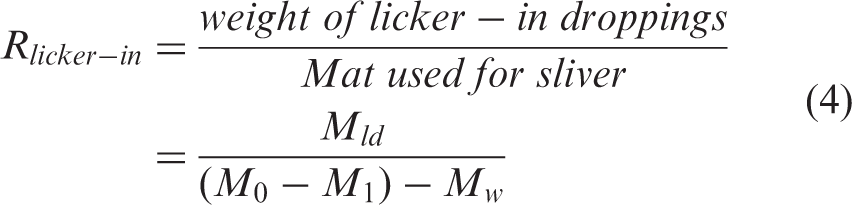
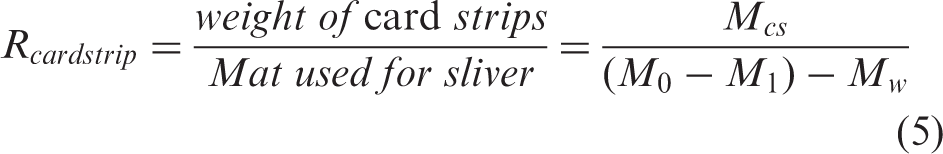
Noils and fiber yield percentage
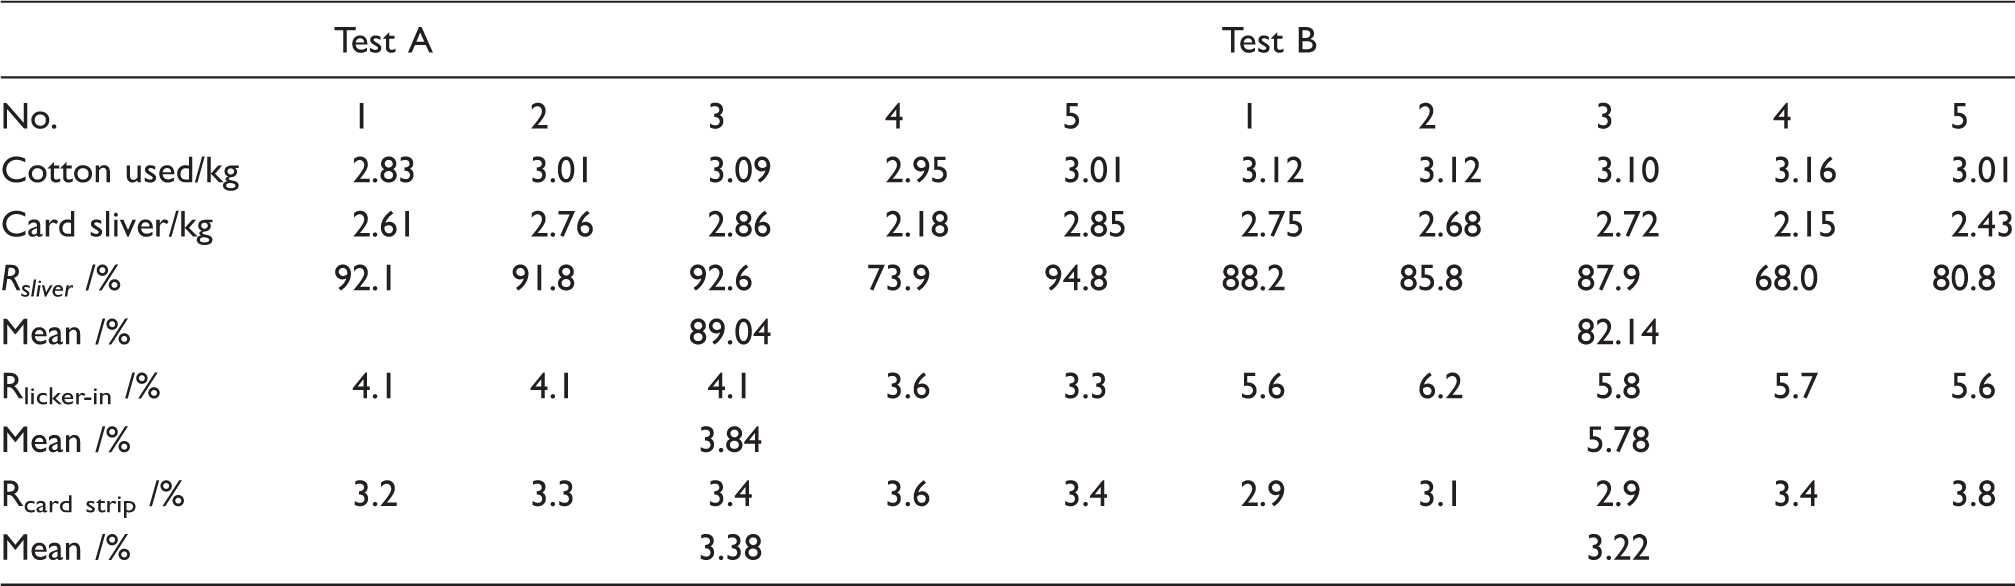
A further analysis is made on the licker-in droppings to investigate the reasons for the increasing productivity and the non-change of the SFC in slivers between A and B. For tests A and B, the average production rates of licker-in droppings (Rlicker-in) are 3.84% and 5.78%. Therefore, the Rlicker-in value for A is 33.6% less than that of B. The result of the licker-in dropping production rate verifies the hypothesis put forward in the Nep analysis section, while the difference of the card strip production rate between A (3.38%) and B (3.22%) is small. In the paired samples test, the difference is not significant, either. Therefore, the licker-in dropping plays a more important role on the productivity increasing.
From all of the above analyses, we can draw the conclusion that the card clothing has a significant effect on the improvement of the production rate. In addition, this fiber yield percentage resulting from the new card clothing design can contribute to a cost reduction. So, it will bring considerable economic benefits.
Yarn properties
Yarn property comparison
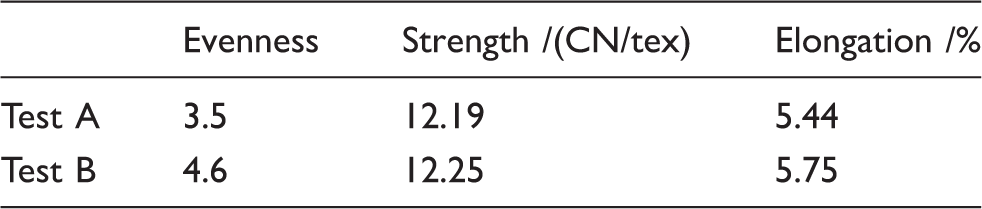
The strength of B is almost the same as that of A, with a negligible decline of 0.49%, while the breaking elongation of B is 5.6% less than that of A. There are complicated reasons for the breaking elongation of staple yarns. It should be noted that, for cotton yarns, the breaking elongation of yarn is usually smaller than that of the cotton fibers.17,18 This means that cotton yarn elongation has a strong relationship with the cohesion between fibers. In this experiment, yarns of A and B have the same kind of fibers, hence, the decrease of yarn A’s breaking elongation could be a result of its better fiber alignment. This result means that the fibers in test A were opened and carded better by this new rack.
Conclusion
This paper designs and manufactures a new kind of licker-in card clothing without an inclination angle. This new kind of card clothing has been wound on the licker-in and compared with this traditional card clothing. Studies have been conducted of the card sliver quality and the fiber yield percentages between the new design card clothing and the traditional card clothing. The experimental results show that the new type of card clothing shows obvious advantages in the decrease of cotton neps remaining in the slivers (a decline of 24.41%) and the increase in fiber yield percentage (an increase of 8.4%). For other quality indices of slivers, such as trash removal and SFC, it shows no deterioration. In addition, the yarns from the new rack have better performance on breaking elongation (a decrease of 5.6%) and evenness. Therefore, the repeated tests of the comparison between this new design clothing and the traditional rack verify the correctness of the new rack theory analysis and show significant economic benefits in real and even extended situations for similar cotton spinning manufacturing.
Footnotes
Declaration of conflicting interests
The authors declared no potential conflicts of interest with respect to the research, authorship and/or publication of this article.
Funding
The authors disclosed receipt of the following financial support for the research, authorship, and/or publication of this article: This work was supported by the Fundamental Research Funds for the Central Universities and National Science and Technology Major Project (grant number 2017YFB0309100).