
Abstract
Single high-performance fibers (Kevlar® K129, Twaron® 2040, Technora® T200, Dyneema® SK76, Zylon® AS, Vectran® HT, and S-glass) are subject to lateral cutting action by an industrial blade. Due to the inherent variability of such testing, 40–60 replicate experiments were performed for each fiber type, at each of three different loading orientations, and the data were fit with a generalized extreme value distribution to summarize likelihood of failure under each condition. The results show that when organic fibers are cut at an angle that introduces shear loads, cut resistance drops by 60–90% compared to normal-incidence cut loading. This trend is driven by the highly oriented and fibrillar nature of organic fibers, in contrast to the isotropic S-glass fibers which show comparatively little change in cut resistance with blade orientation. Overall, the Vectran fibers provide the best resistance to normal loading, while the S-glass fibers are most resistant to non-normal loading. Micrographs show that, for organic fibers, shear loads lead to more localized failure compared to normally loaded fibers.
High-performance fibers composed of materials such as aromatic polyamides, ultra-high molecular weight polyethylene (UHMWPE), and glass are valued for their exceptional mechanical properties, most notably their high specific strength and elastic modulus. Such characteristics are desirable in a variety of applications, including underwater cables, aerospace tethers, protective membranes, and load-bearing components of composite systems. Of particular interest is the use of high-performance fibers in the construction of soft body armors. The ballistic properties of fabrics used in this manner have been studied thoroughly and the mechanics of ballistic loading and failure processes are well-established.1–4
In contrast, the behavior of soft armor materials against cut-based threats such as slash, stab, and puncture is less understood, in spite of ongoing threats faced by correctional officers and law enforcement personnel. 5 Various system-level studies have been performed to measure the cut and stab response of conventional fabrics6,7 and to determine the effects of various textile modifications, including additions of ceramic particles 8 and coatings of nanoscale 9 and microscale 10 thicknesses, shear-thickening fluids,11–15 thermoplastics,16–18 and layers of natural fiber, such as wool. 19 Cut studies have also been performed on isolated multi-filament yarns under quasi-static20–23 and dynamic conditions. 24 However, test data under these conditions result from a complex array of interactions over multiple length scales as fabric plies, yarns, and fibers share loads, experience frictional and transverse contact, and undergo progressive and parallel failure.
It is reasonable to hypothesize that the overall cut strength of fabrics depends largely on the properties of their constituent fibers and that experimental evaluation of single fiber cut behavior could provide a more fundamental understanding of the relevant mechanisms that determine system-level response. However, due to the experimental challenges associated with characterization at such fine length and force scales, few such studies have been undertaken. Lu et al. 25 measured the transverse force required to sever polyacrylonitrile-based (PAN) carbon fibers using a carbon steel blade. The loading rate, cut strength, and failure mode were dependent on the compliance of the fiber substrate: carbon fibers resting on glass failed in transverse compression, while fibers positioned on rubber failed due to localized bending under the blade edge. Knoff 26 attempted to relate single fiber, yarn, and fabric cut properties by measuring the transverse energy required to deform single fibers and yarns after initial contact with the blade. Mayo and Wetzel 27 measured the cut resistance of several synthetic, high-performance single fibers using a modified version of the test method presented by Shin et al. 20 A load frame actuator was used to drive a commercial cutting blade into single fiber specimens laterally and at 19 different cutting angles. The data showed that inorganic fibers such as S-glass and carbon provided higher cut resistance than organic fibers such as Kevlar and Dyneema, and confirmed the decrease in cut strength shown by Shin et al. 21 when the angle of incidence increased.
A limitation of Mayo and Wetzel 27 is the small sample size (five fibers) chosen for each fiber-orientation data set, due in part to the large number of cutting angles explored. While clear trends in cut strength were evident between organic and inorganic fibers and as a function of cutting angle, the data were insufficient to conclusively differentiate between the performances of the organic fibers tested. This study seeks to provide better insight into differences in cut response among high-performance fibers by increasing sample size and reducing the scope to three critical cutting orientations, which are described later. As the mechanical response of high-performance fibers is often probabilistic in nature,28–30 the cut data are analyzed and mapped to statistical distributions. Microscopy of fracture surfaces is included to provide further insights into single fiber failure modes.
Experimental
Materials
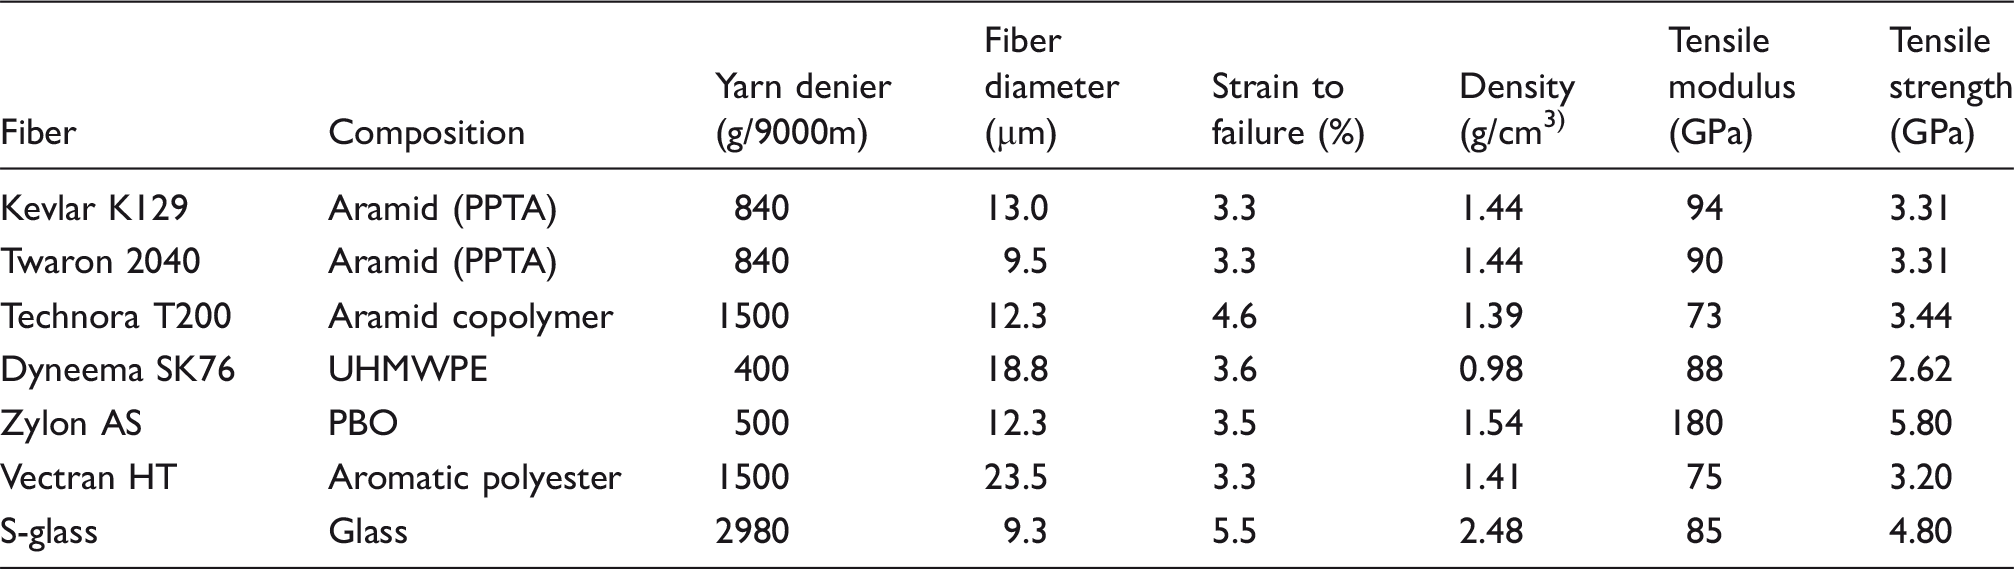
Manufacturer data and tensile properties for tested fibers
Fiber extraction and mounting
Fibers were manually extracted from spooled yarn with no weaving history. Immediately after extraction, fibers were loaded into a custom mounting apparatus (Figure 1(a)), described in detail previously.27,33 The apparatus is equipped with two pairs of clamping rubber grips, a rotating platform, and a digital angle gauge with a resolution of 0.1°. The gage length is defined as the shortest distance between grip points and is 140 mm. To load a fiber in the apparatus, the fiber was clamped at one end and allowed to hang vertically. The fiber was then pre-tensioned to a load equal to 10% of the expected tensile failure load by attaching a custom weight to the free end of the fiber. While under tension, the fiber was clamped at the free end so that the sample passed through the center of the grip faces. The platform was then rotated to the testing position and locked in place using a pair of set screws.
(a) Photograph of the cut testing apparatus (a yarn, rather than a single fiber, is shown in the photographs for clarity). (b) Schematic of cutting orientations. Incident fiber is depicted in yellow.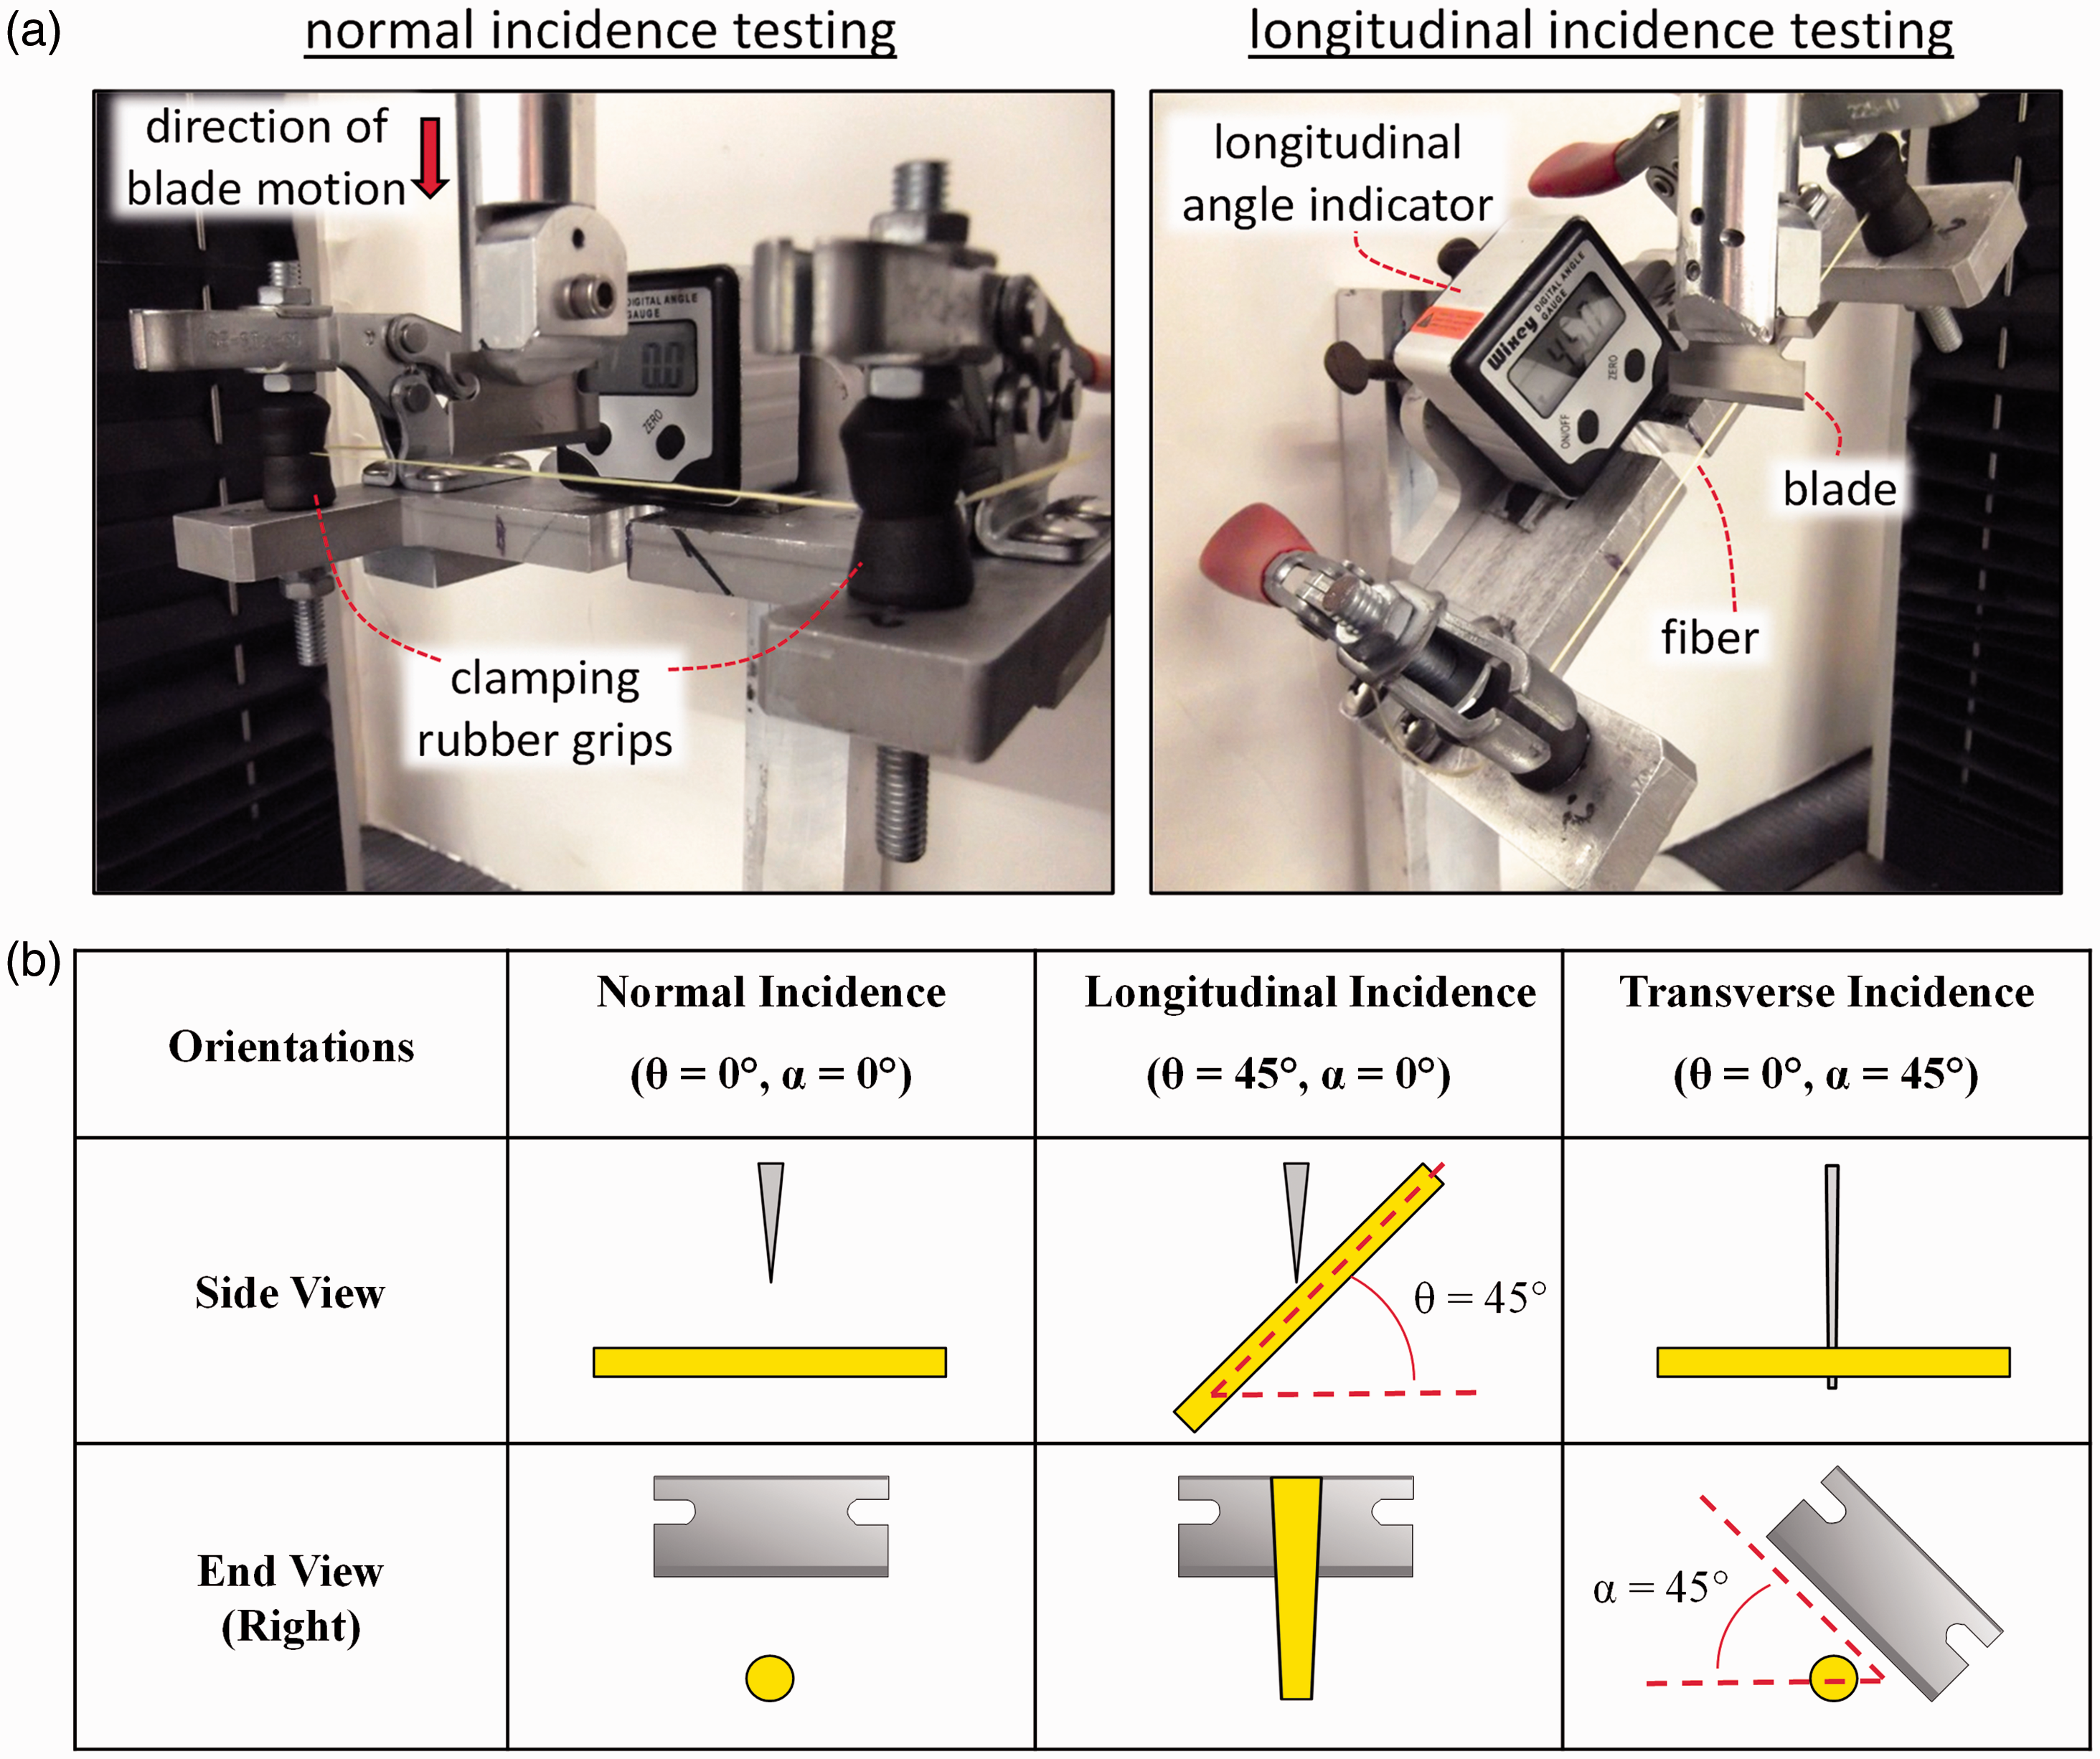
To assess how fiber cut strength varied with the angle of blade incidence, experiments were conducted at three distinct cutting orientations. Figure 1(b) provides schematic views of each orientation; the angular descriptions of each orientation are consistent with Mayo and Wetzel. 27 Normal incidence describes the case where the fiber is oriented horizontally and the blade edge is positioned orthogonally with respect to the fiber (θ = 0°, α = 0°). Longitudinal incidence differs from normal incidence in that the fiber is oriented 45° relative to horizontal (θ = 45°, α = 0°) by rotating the test fixture. Transverse incidence describes the case where the blade edge is rotated 45° and the fiber remains horizontal (θ = 0°, α = 45°).
A stainless steel Celanese food processing blade (American Cutting Edge, Inc., Centreville, OH) was used for all experiments, consistent with prior studies.27,33 Testing was performed using an Instron 1122 Universal Testing Instrument (Grove City, PA) with a 20 N compression load cell, collecting data at 10 Hz while the blade was displaced downward at 30 mm/min. Sixty tests were executed for each fiber-orientation pair for a total of 180 tests per fiber type. Due to the difficulty of handling the brittle S-glass fibers, only 40 tests were conducted for each S-glass fiber orientation. Markers placed on the fibers outside of the clamping points were visually tracked during each test to ensure the absence of significant fiber slip in the grips. To account for possible blade dulling effects, the mounting apparatus was pushed back 1 mm after each test to expose the subsequent fiber specimen to an unused portion of the blade edge. Blades were replaced after every 20 tests.
Blade extension (displacement) at failure, over all fiber types, ranged from 3–18 mm. Given the span of 140 mm and assuming an initially taut fiber, these displacement values correspond to the fibers being angled at 2–15° relative to horizontal at failure.
Statistical analysis of nominal cut response
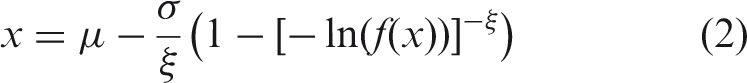
Past studies regarding the tensile strength of high-performance fibers validate the two-parameter Weibull and modified Weibull distributions as effective means of characterizing tensile failure;30,34 however, application of these distributions to our cut data resulted in poor fits, indicating that those functional forms were not good representations of the failure physics. Distribution of cut strength in single fibers is modeled here using the generalized extreme value (GEV) distribution, which combines the Gumbel, Frechet, and Weibull extreme value distributions and whose cumulative distribution function is given by:
35
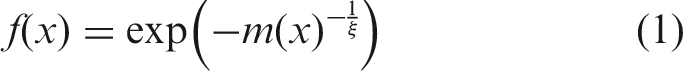
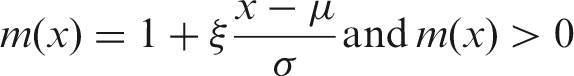
The three distribution function parameters are the local parameter, μ, the scale parameter, σ, and the shape parameter, ξ. The cumulative distribution function can be inverted to find the value of the function at a given probability, as
To analyze cut data, MATLAB was used to sort and rank the failure loads for all specimens of each fiber-orientation pair. GEV distributions were fitted to the data and all parameters were calculated using maximum likelihood estimation, where data were binned according to the Freedman–Diaconis rule. 36
Normalization of nominal cut response
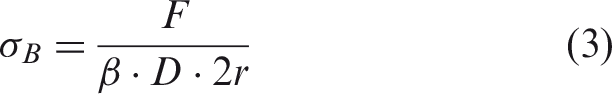
To objectively compare the relative cut strength of different high-performance fibers, the effect of fiber diameter must be considered. To this end, Mayo and Wetzel
27
proposed to analyze cut data in terms of “blade stress”, nominally the stress acting over the contact area between the blade edge and the fiber. Blade stress may be approximated by
Post-failure microscopy
To gain further insight into cut failure, the fracture surfaces of several failed fibers were examined using scanning electron microscopy (SEM). After collecting and analyzing initial cut strength data, an additional five tests were conducted for each fiber-orientation pair. Fragments from the test specimens most comparable to the mean cut behavior of the fiber population were chosen for microscopic examination. A cold sputter coater (Denton Vacuum Desk V-TSC, Moorestown, NJ) was used to deposit 10–15 nm of a gold–palladium alloy on the fragments before imaging to reduce charging effects. A scanning electron microscope (FEI Nova NanoSEM, Hillsboro, OR) was used to image the fibers at a working distance of 5 mm and an accelerating voltage of 5 kV in high-vacuum mode.
Results
Nominal cut response
Summary of nominal cut force statistics for each fiber by orientation
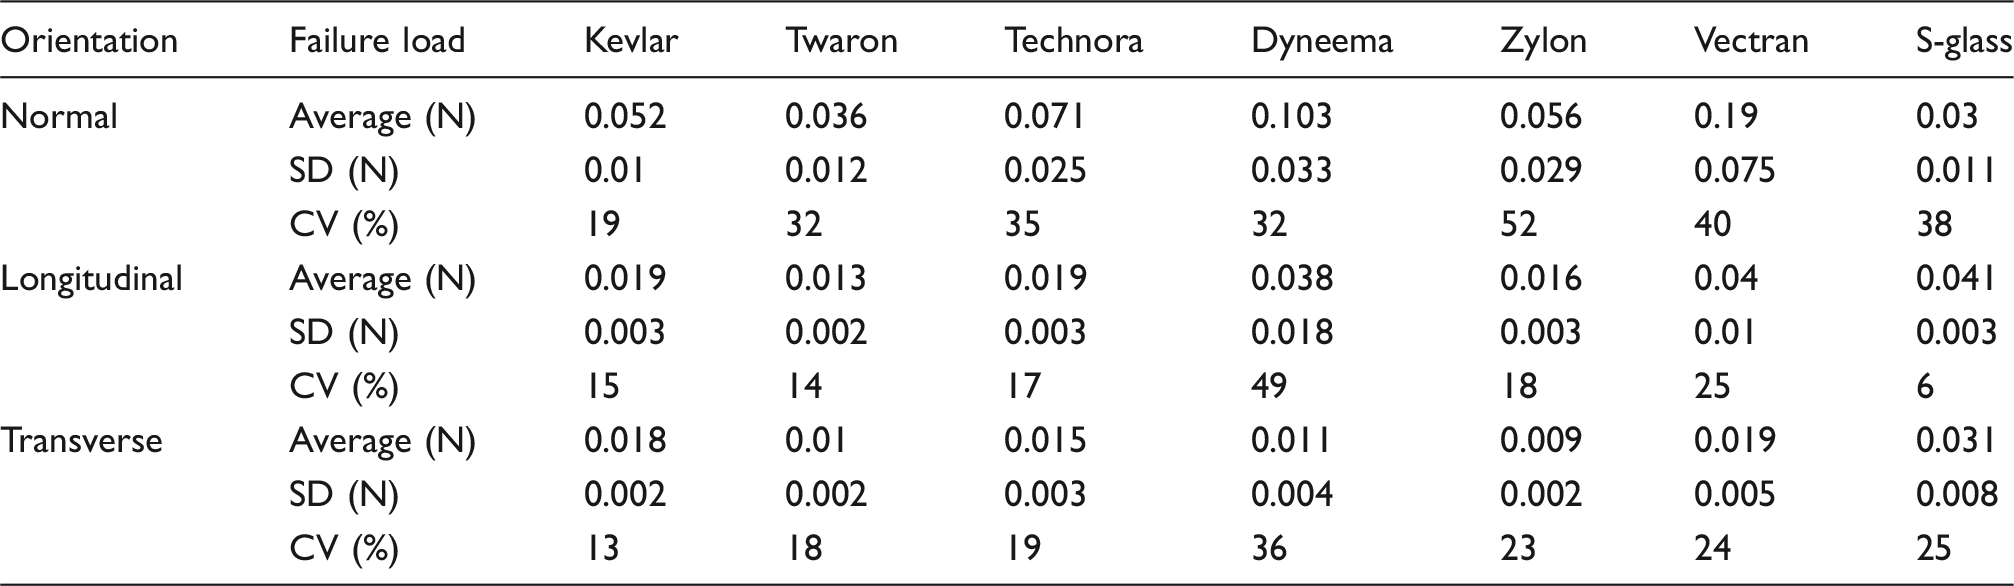
SD: standard deviation; CV: coefficient of variation.
Typical load-extension curves for all fibers tested at each orientation are shown in Figure 2. The samples shown are representative of their respective fiber-orientation data sets and were chosen based on the close proximity of their failure loads to the average failure load. At normal incidence, the rate of load increase tends to scale with failure load and fiber diameter, and the extension at failure is relatively consistent among all fibers, as shown in Figure 2(a). All tested fibers experienced a gradual, non-linear increase in load, followed by a rapid decrease in load upon fracture (not shown for clarity). Figure 2(b) and (c) show load-extension curves for the angled orientations. These curves are characterized by alternating increases and decreases in load. Unlike the normal incidence case, fibers tested at the angled orientations failed across a wide range of extension values, from 3 to 16 mm. For the angled orientations, S-glass demonstrated the highest extension to failure, while Vectran yielded the lowest extension to failure.
Typical load-extension curves for all tested fibers and orientations. (a) Normal, (b) longitudinal, and (c) transverse orientations. Portions of curves depicting unloading are omitted to preserve clarity of figures.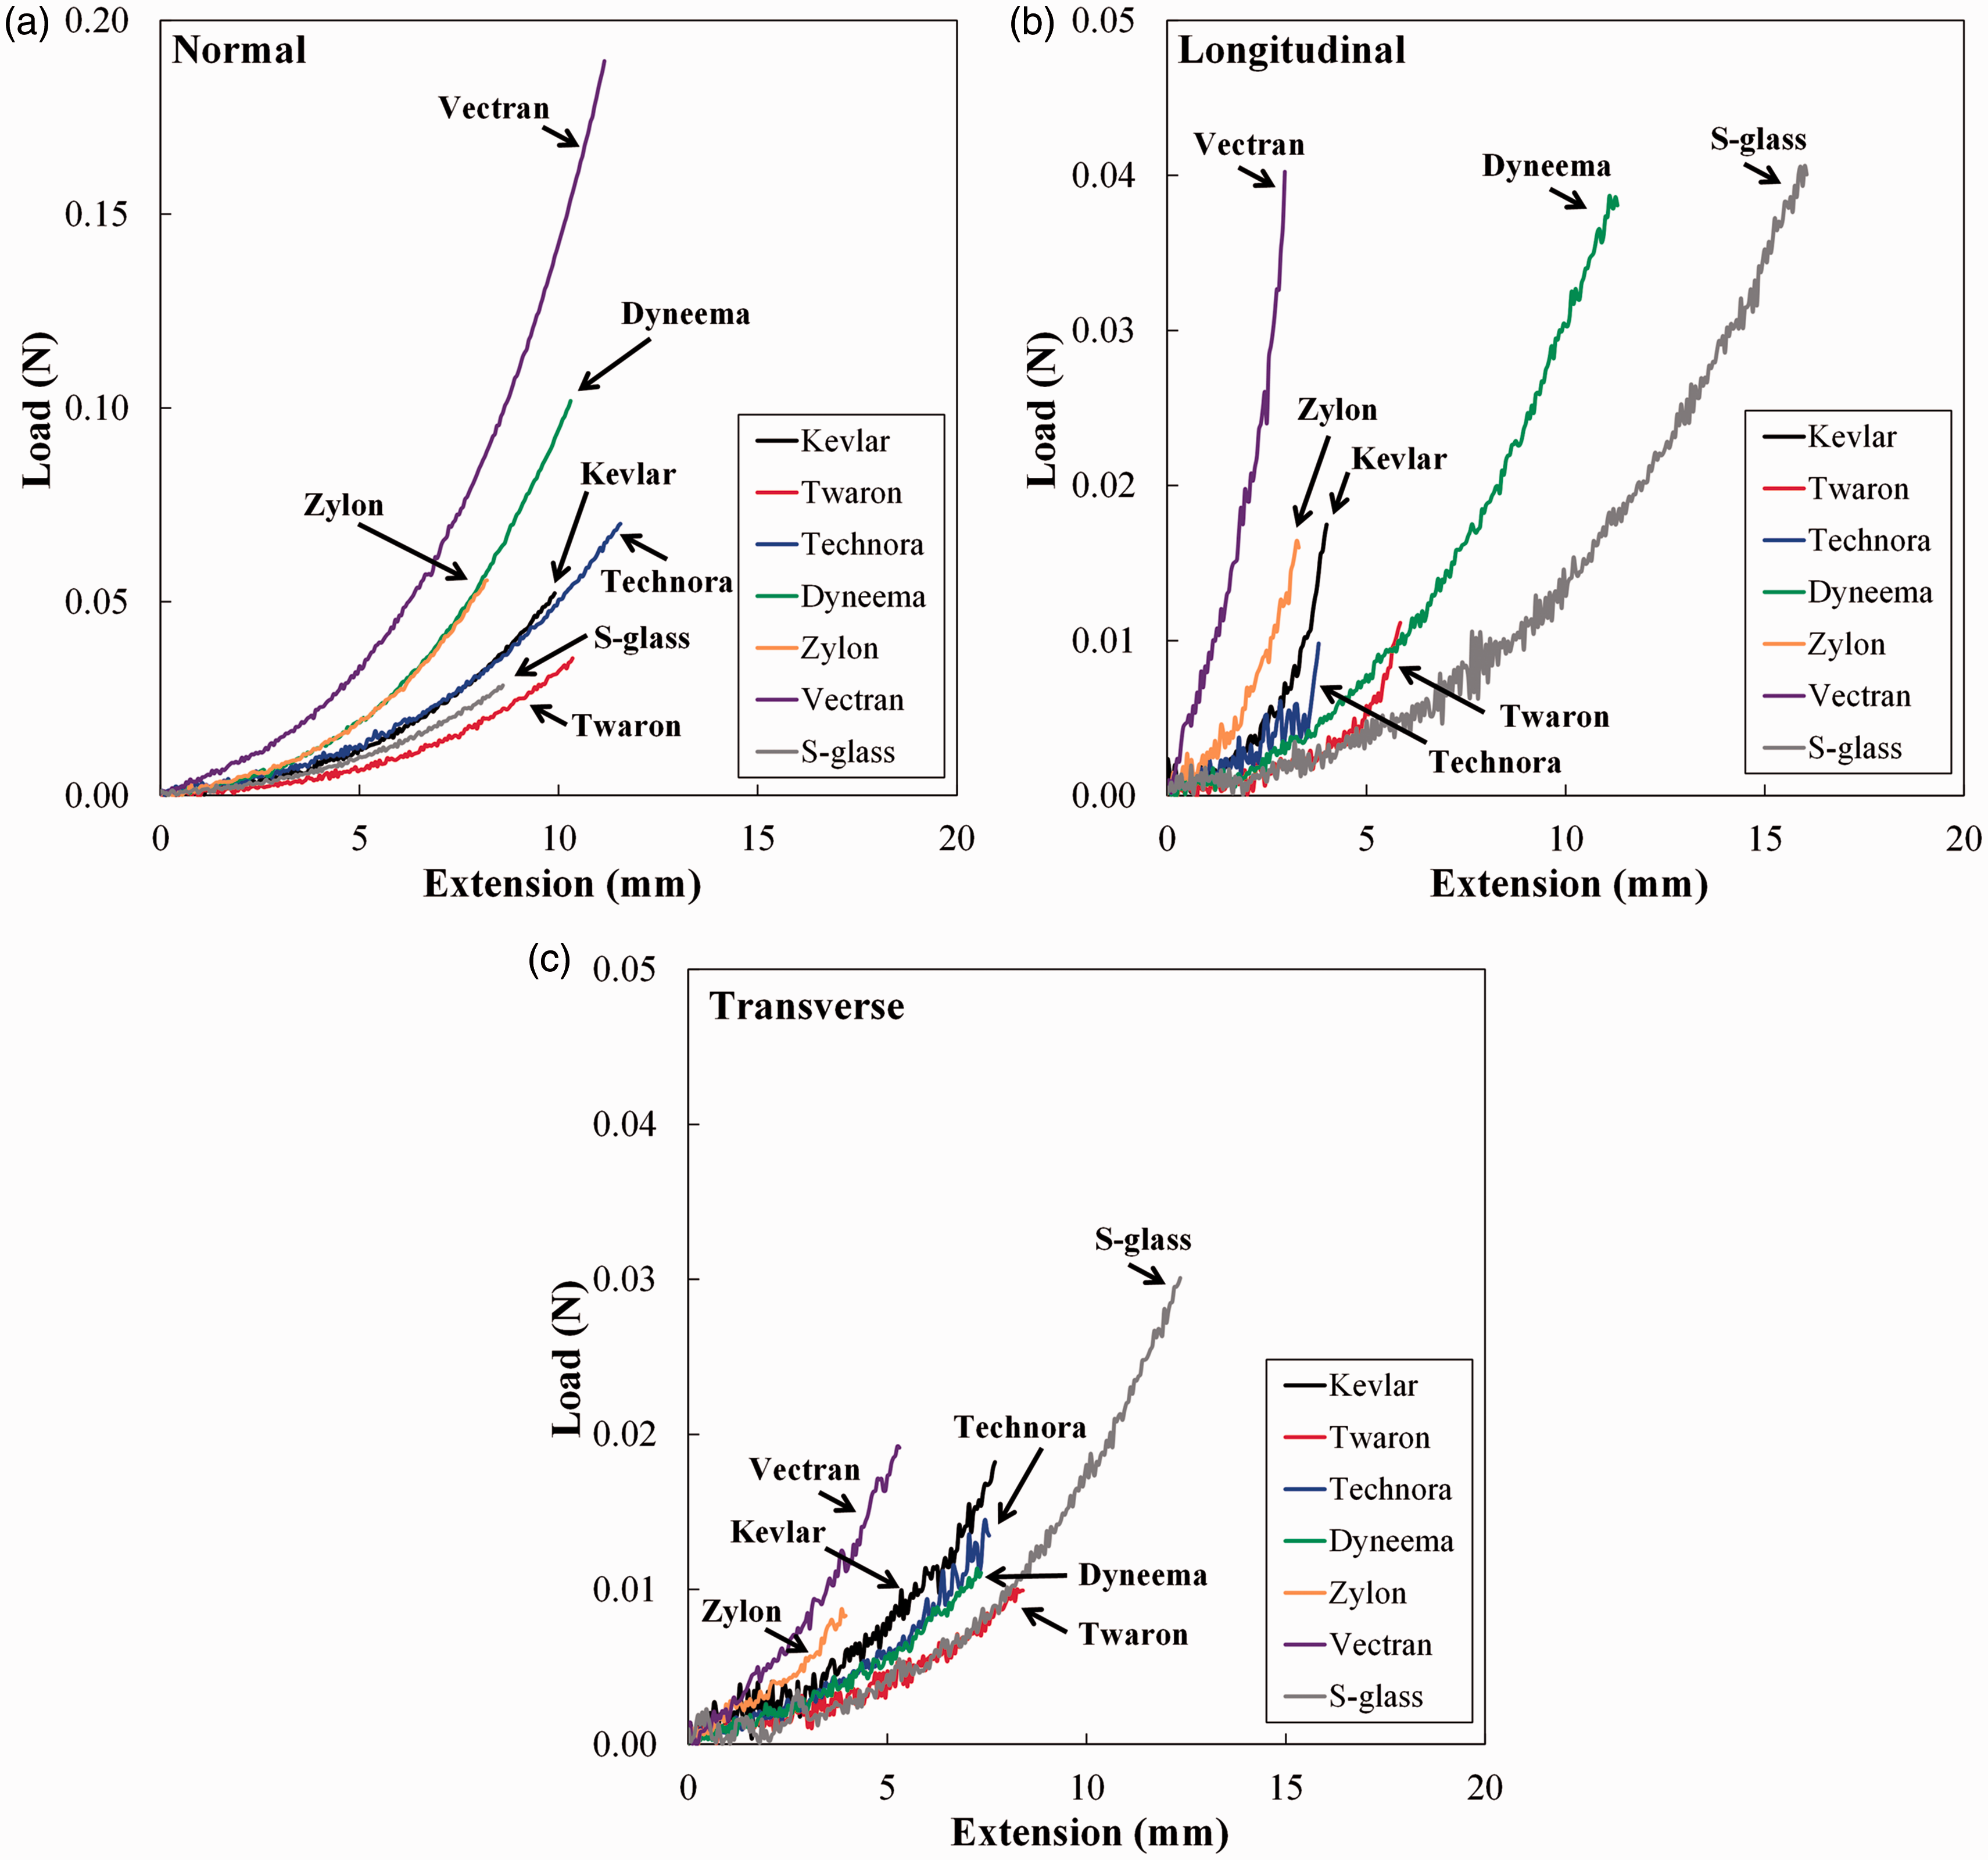
Figure 3 illustrates differences in load-extension behavior among the three tested orientations for representative organic and inorganic fibers (Kevlar and S-glass). For both fibers, the rate of load increase is highly dependent on orientation. For Kevlar, maximum load and extension are observed for normal orientation, while minimum values are observed for longitudinal loading. For S-glass, the trend is opposite, with longitudinal loading providing maximum load and extension at failure and normal loading producing the smallest load and extension.
Typical load-extension behavior by orientation for representative organic and inorganic fibers. (a) Kevlar and (b) S-glass. Portions of curves depicting unloading are omitted to preserve clarity of figures.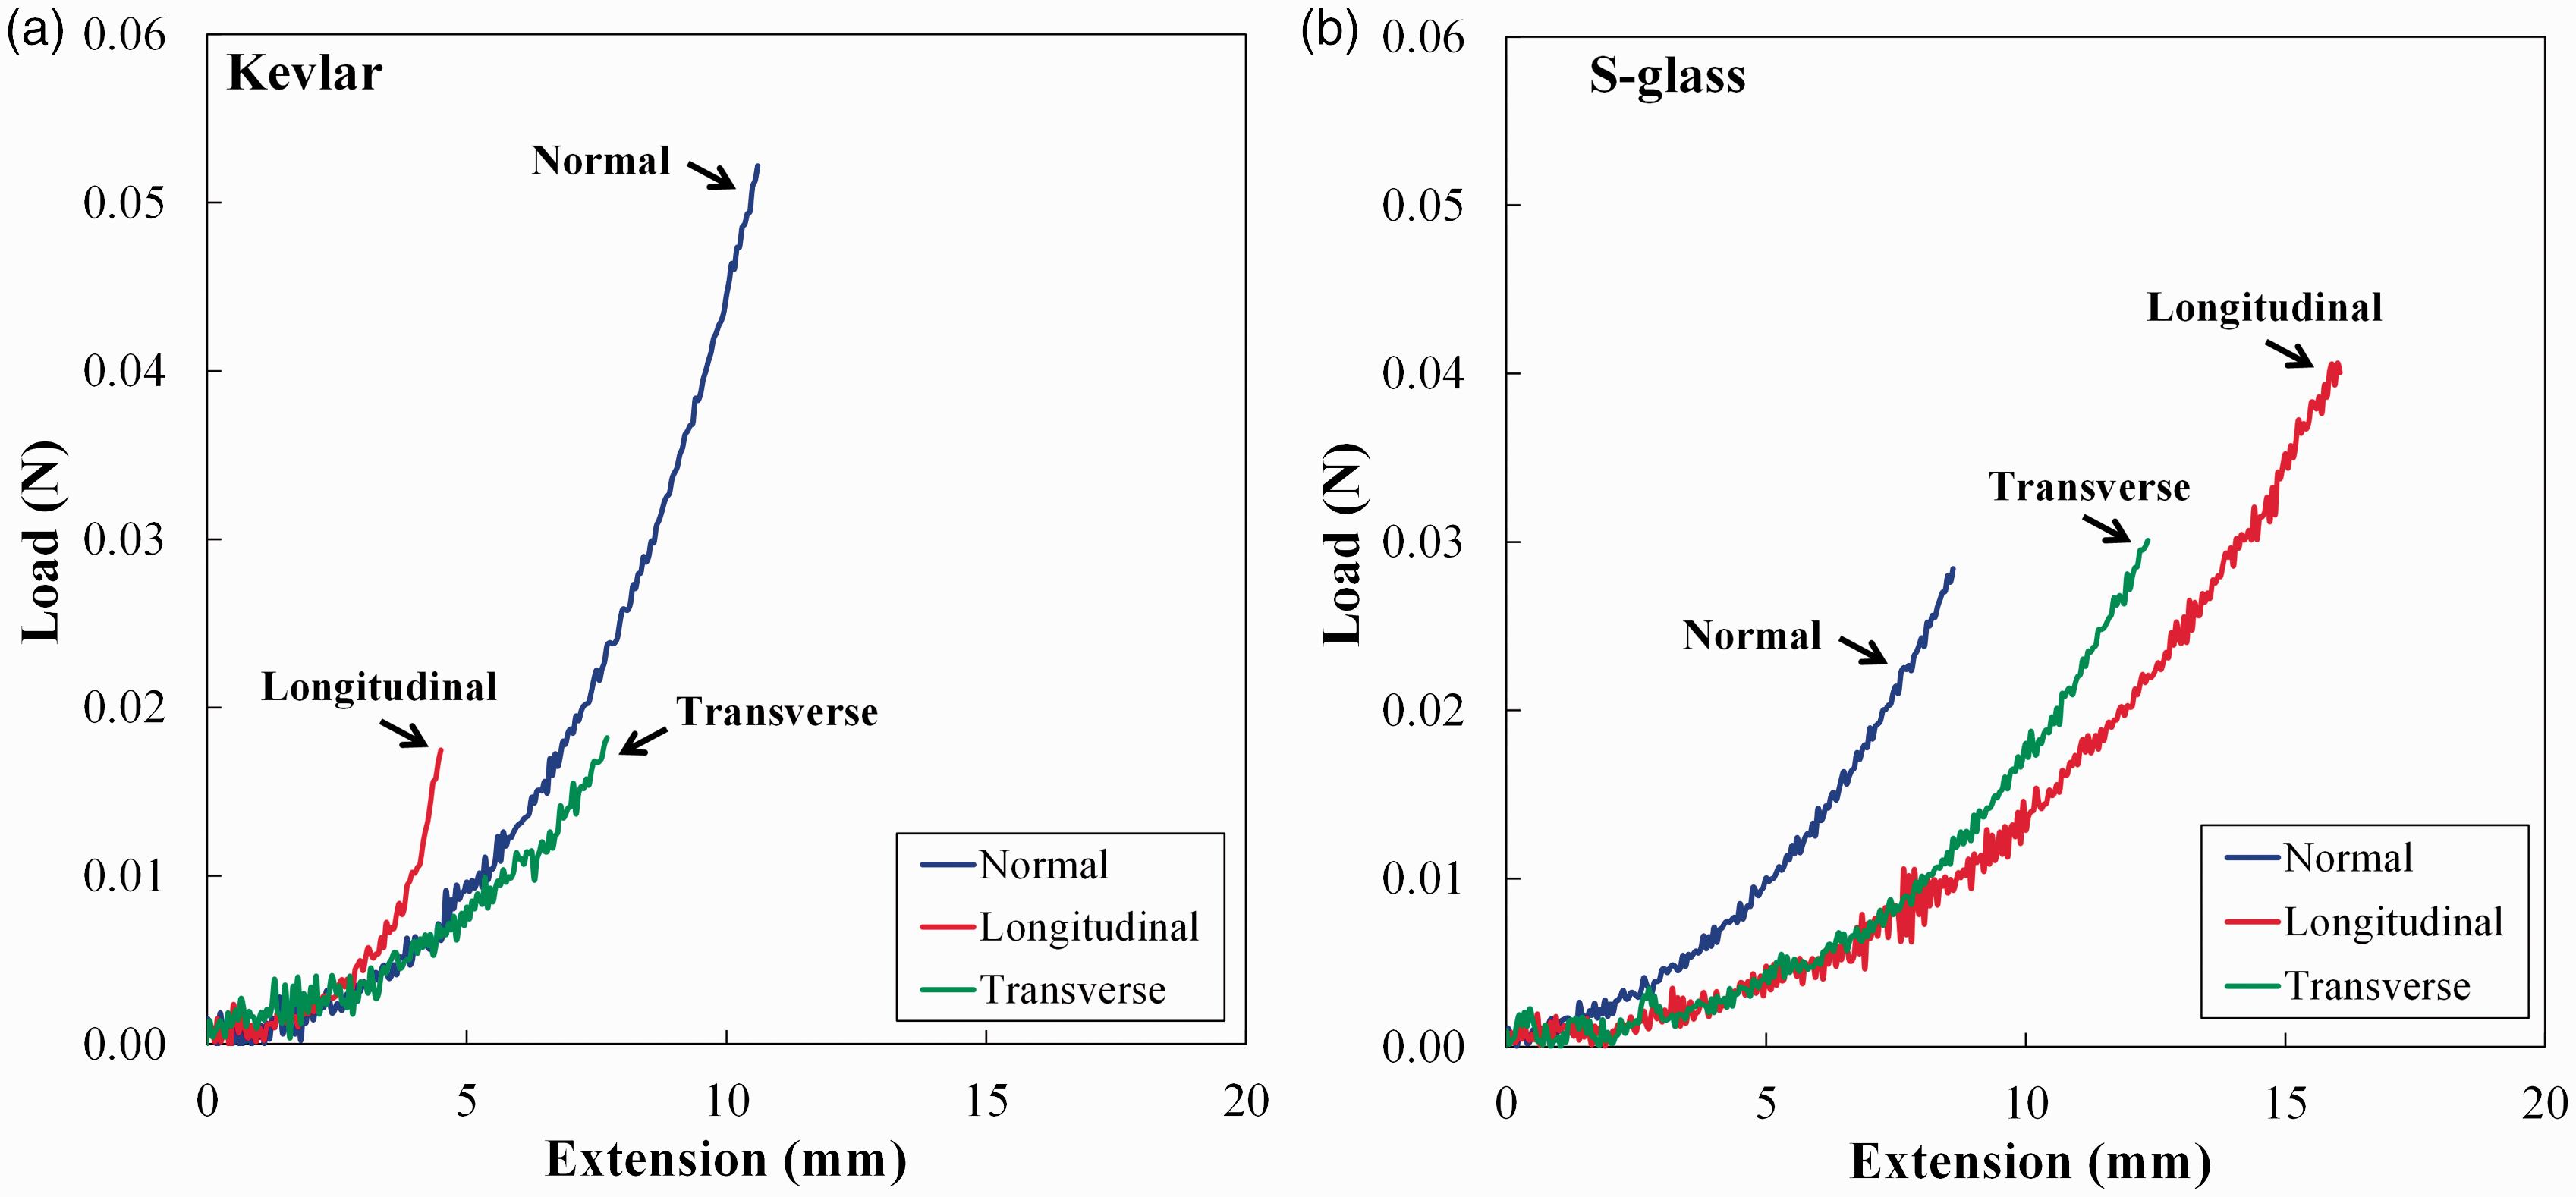
Statistical analysis of nominal cut response
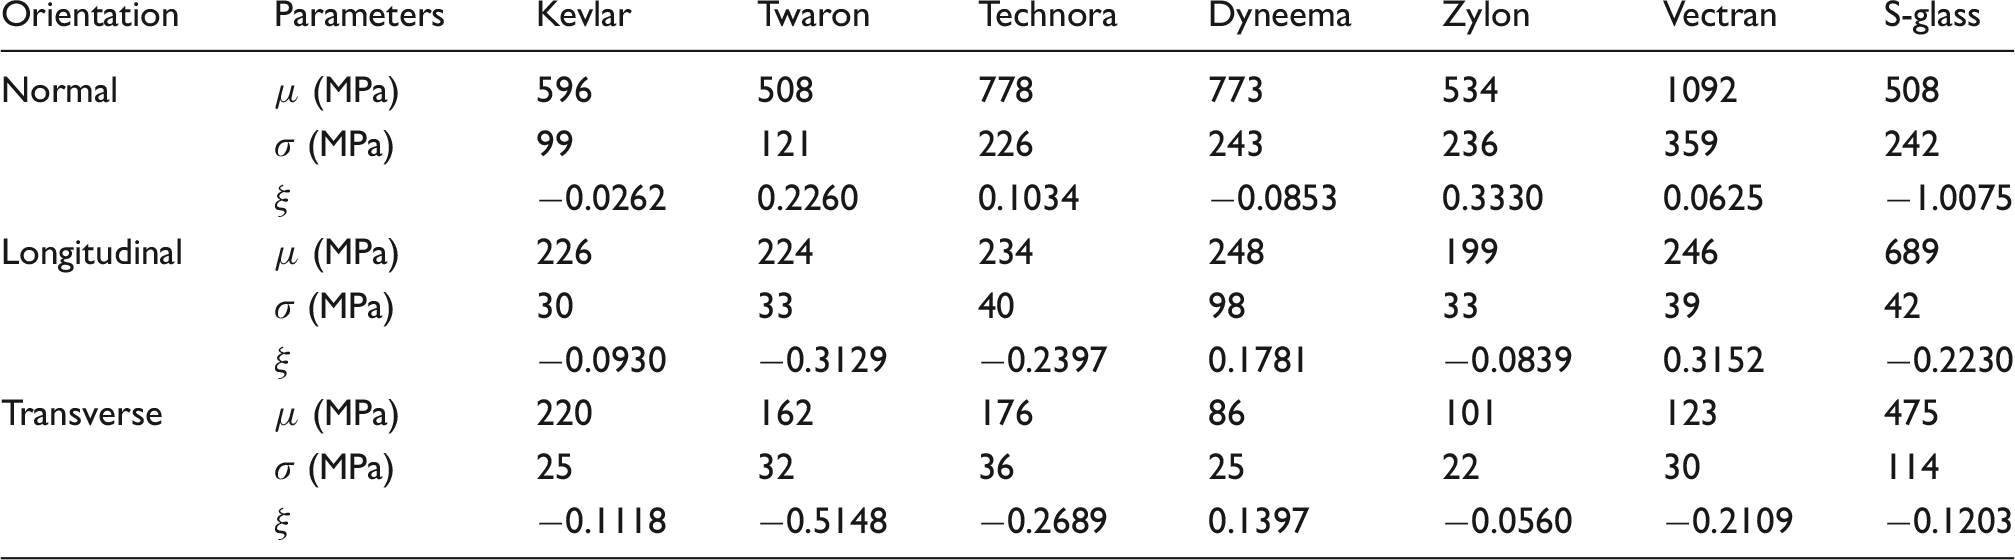
Summary of estimated generalized extreme value parameters for failure load for all fibers and orientations
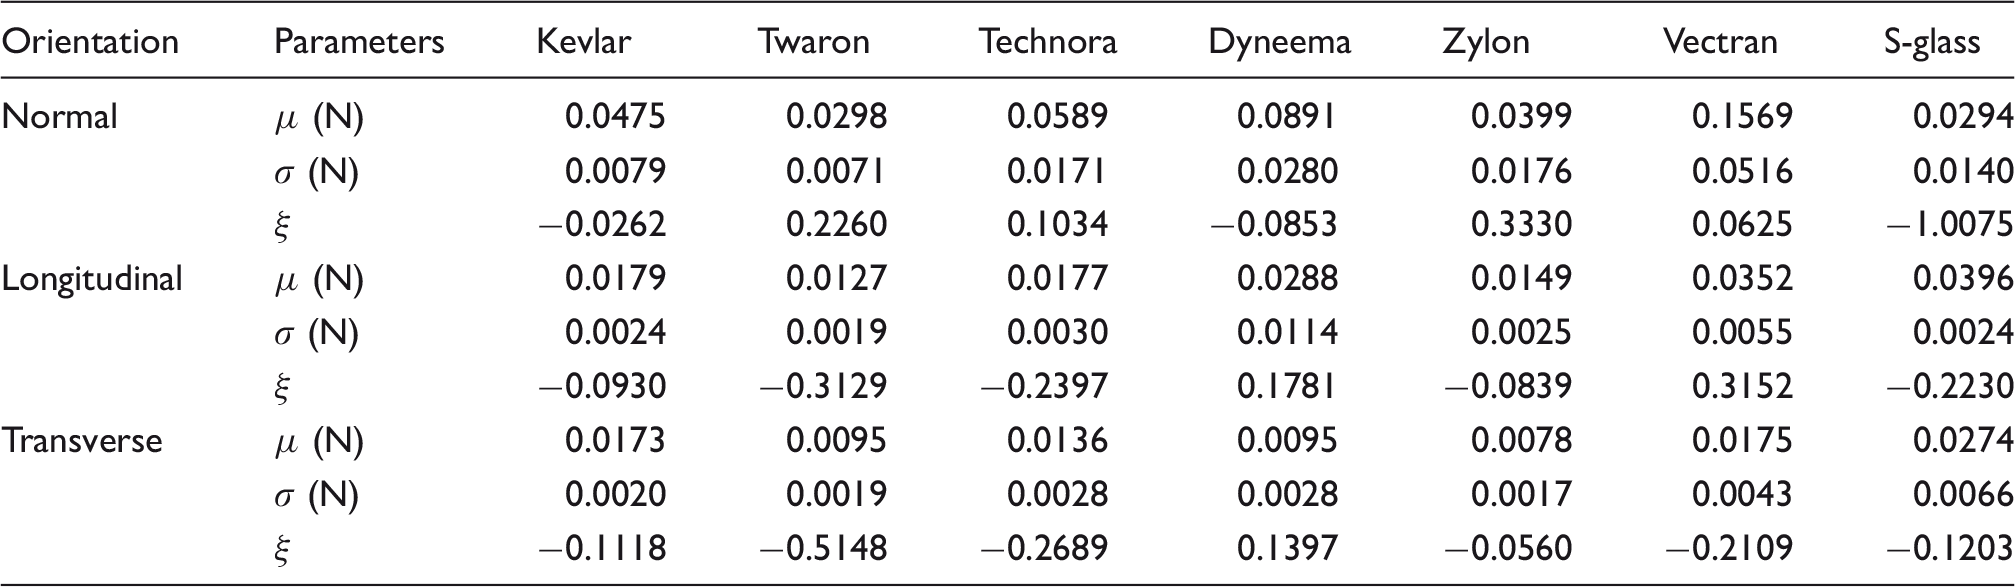
μ is defined as the location parameter; σ is defined as the scale parameter; ξ is defined as the shape parameter and indicates the distribution tail behavior most applicable to the data, where ξ < 0 gives the Weibull distribution, ξ = 0 gives the Gumbel distribution, and ξ > 0 gives the Frechet distribution.
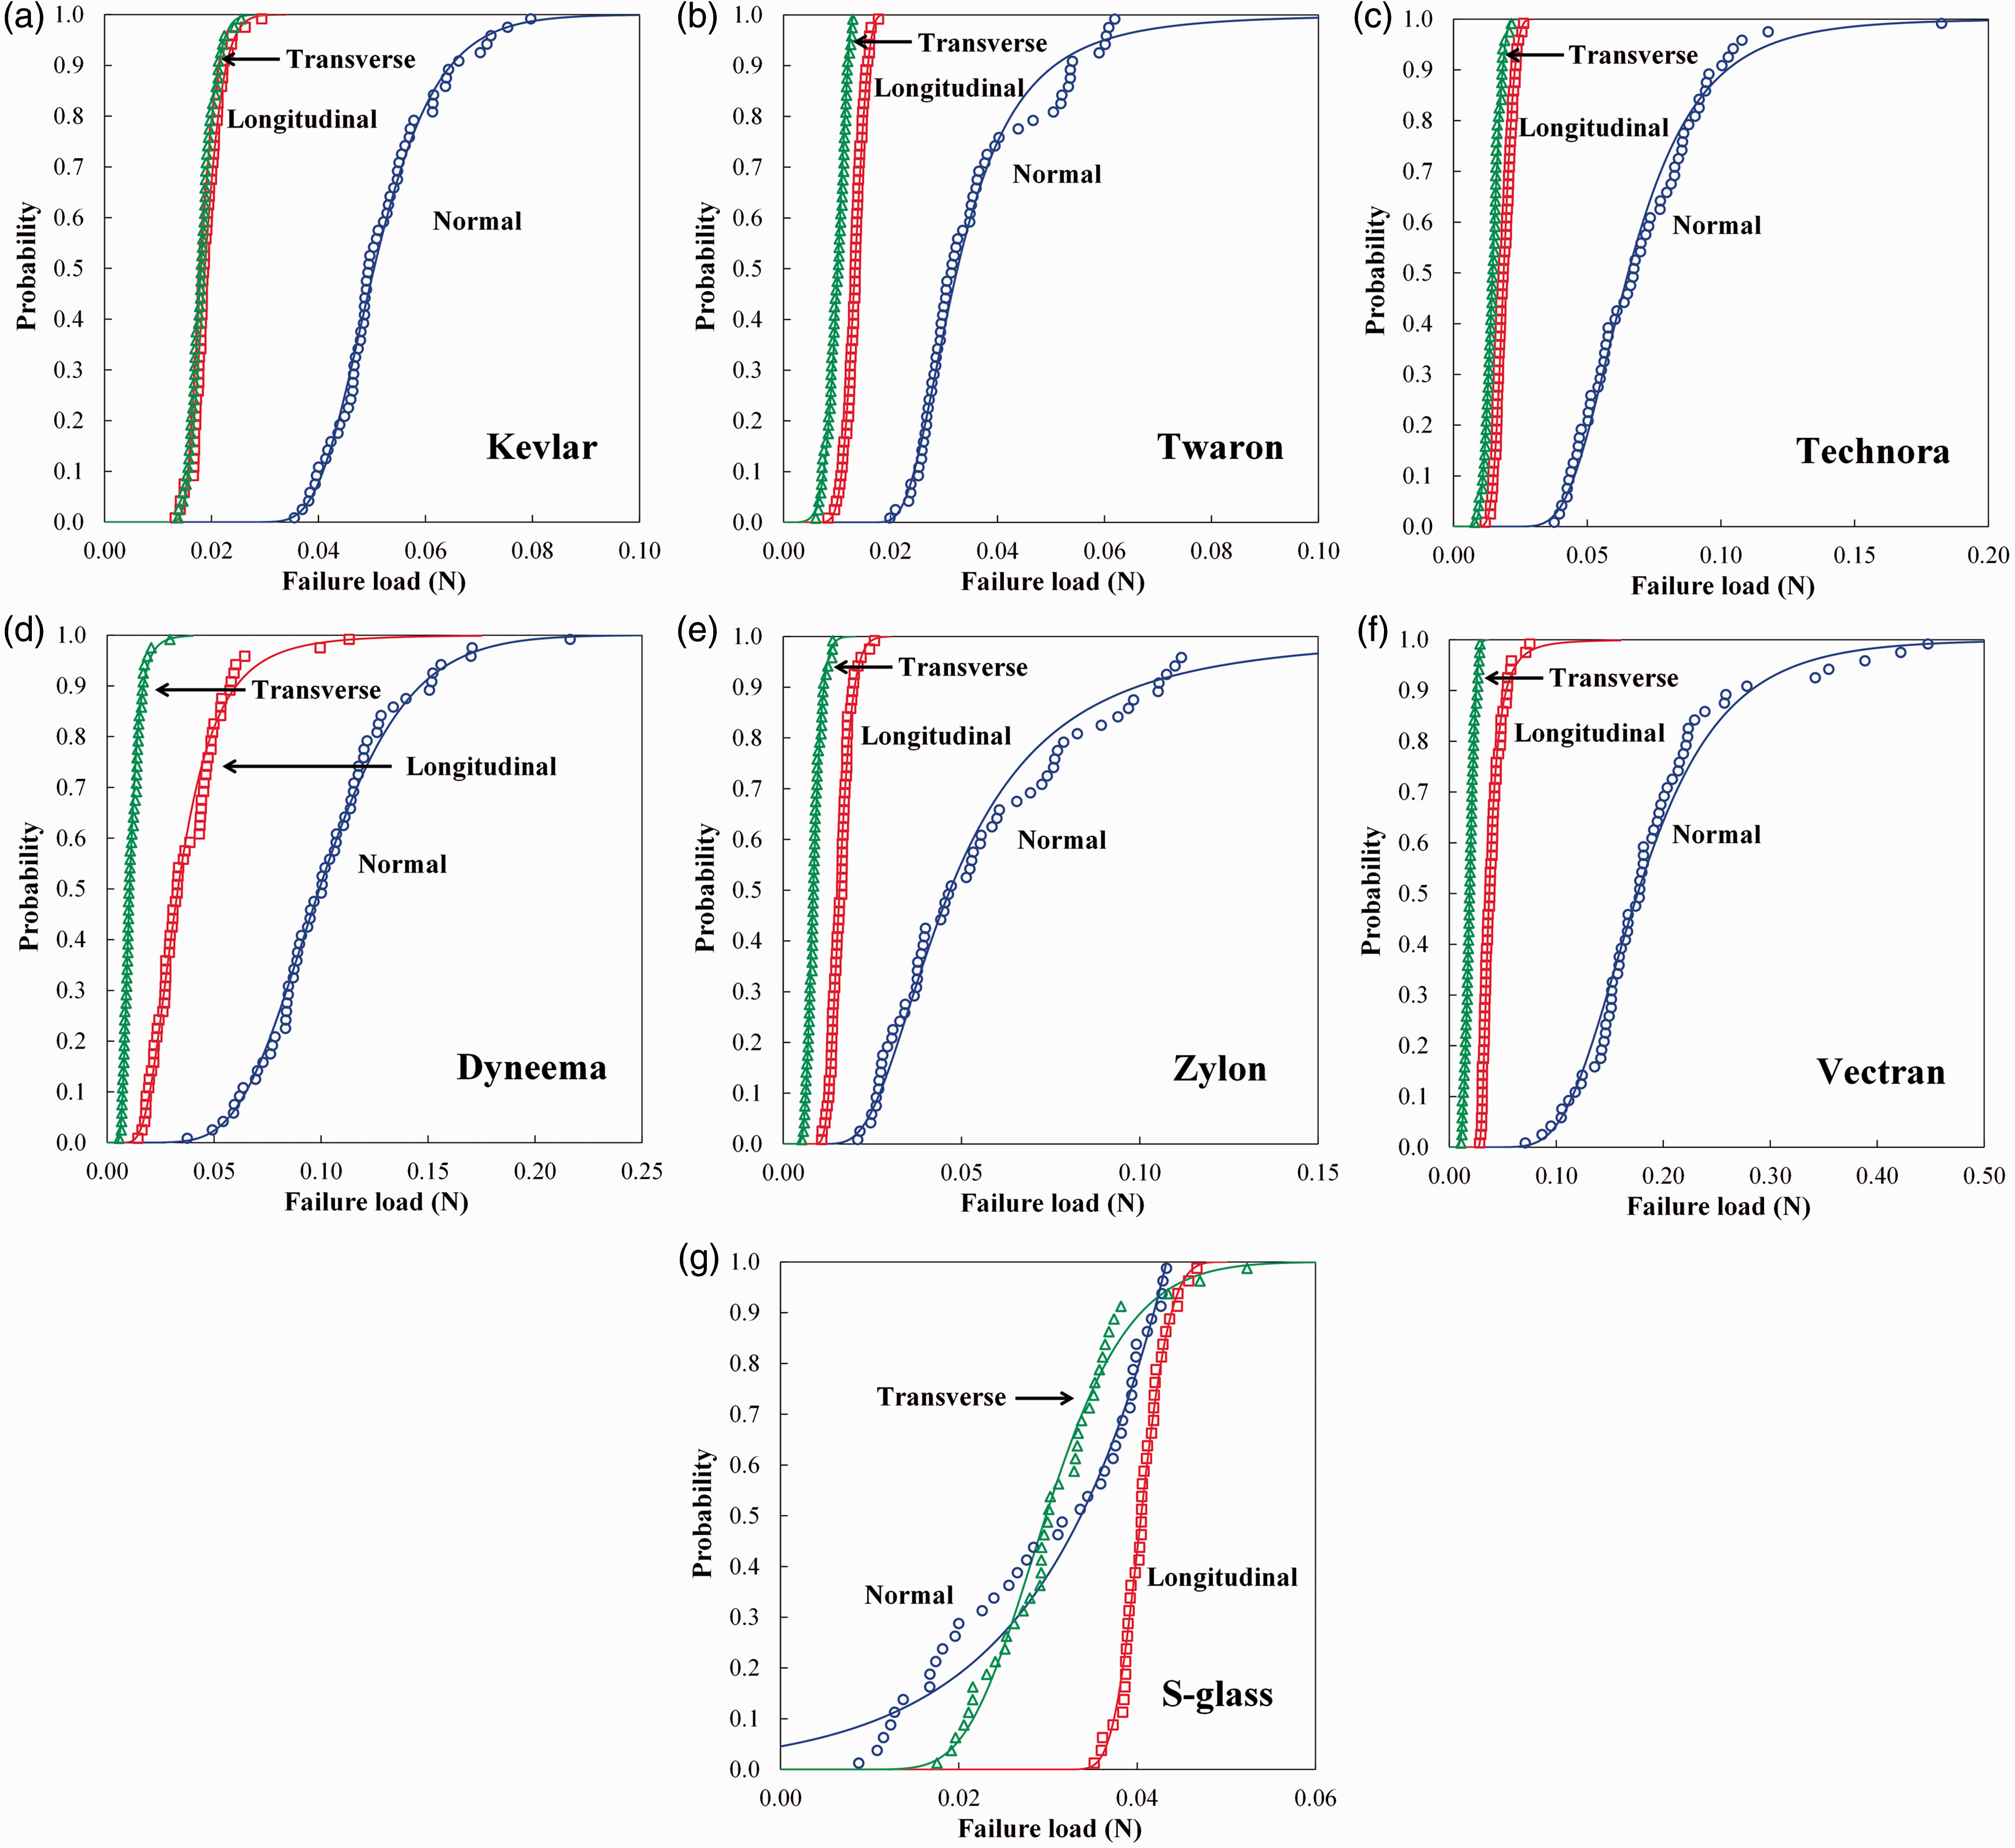
Probability plots for all fibers as a function of failure load. Solid lines indicate GEV distributions fit to the data. (a) Kevlar, (b) Twaron, (c) Technora, (d) Dyneema, (e) Zylon, (f) Vectran, and (g) S-glass.
Figure 4(g) gives probability plots for S-glass with corresponding GEV fits. The behavior of the S-glass fiber is considerably different from the organic fibers. S-glass fibers tested at normal and transverse incidence show considerable overlap within a relatively narrow load range, and fibers tested at normal incidence failed at lower loads than fibers tested at longitudinal incidence (compared at a similar probability of failure). These observations indicate that the cut response of S-glass is less sensitive to changes in cutting orientation, as compared to the organic fibers. Explanations for these behaviors will be presented in the Discussion. The GEV fit for S-glass fibers fails to capture the data tail associated with samples that fail at very low loads, evident by visual inspection of Figure 4(g).
Normalization of nominal cut response
Figure 5 presents a series of GEV distribution curves for all nominal cut data after scaling by fiber diameter via the blade stress, as defined in equation (3). Tables 4 and 5 summarize the blade stress statistics and GEV parameters for each fiber and orientation. As expected, the average blade stresses at normal incidence are significantly higher than stresses seen at the angled orientations. The exception to this observation is S-glass, which yields comparable mean blade stresses at all three orientations and appears relatively insensitive to cutting orientation.
Generalized extreme value (GEV) distribution curves for normalized cut data for each fiber and cutting orientation. (a) Normal, (b) longitudinal, and (c) transverse cutting orientations. Summary of blade stress statistics for each fiber by orientation SD: standard deviation; CV: coefficient of variation. Summary of estimated generalized extreme value parameters for blade stress for all fibers and orientations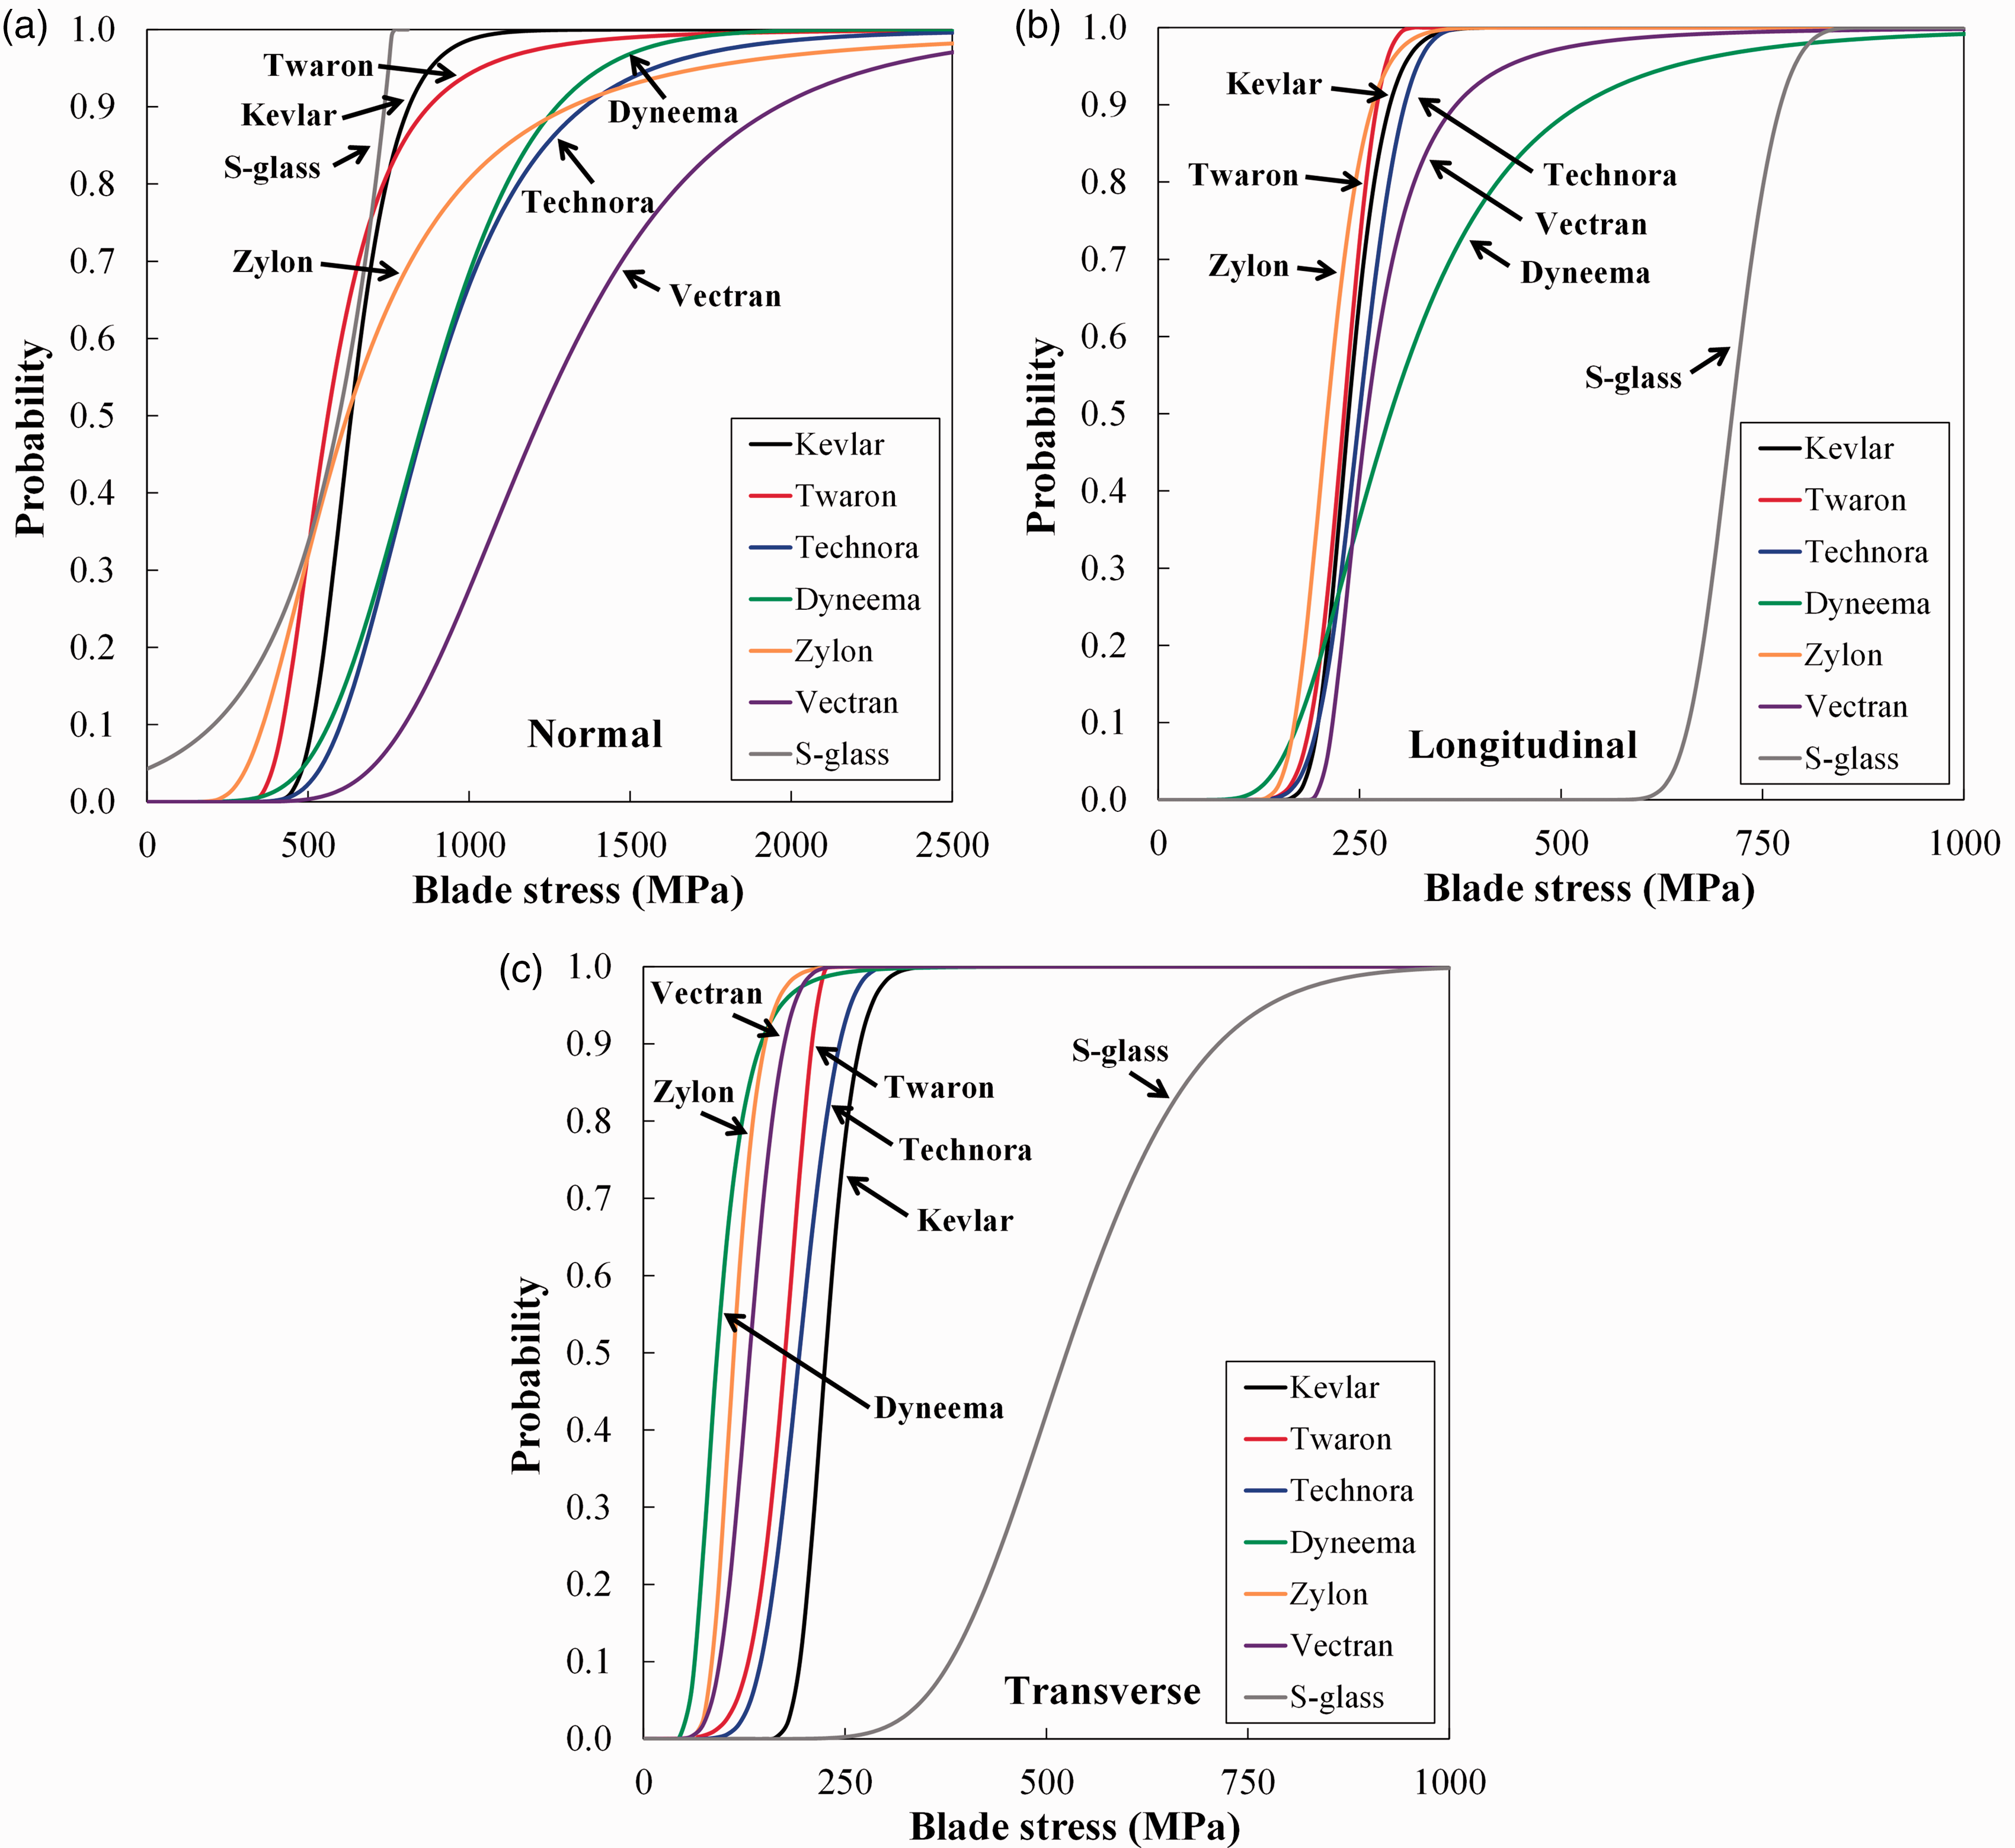
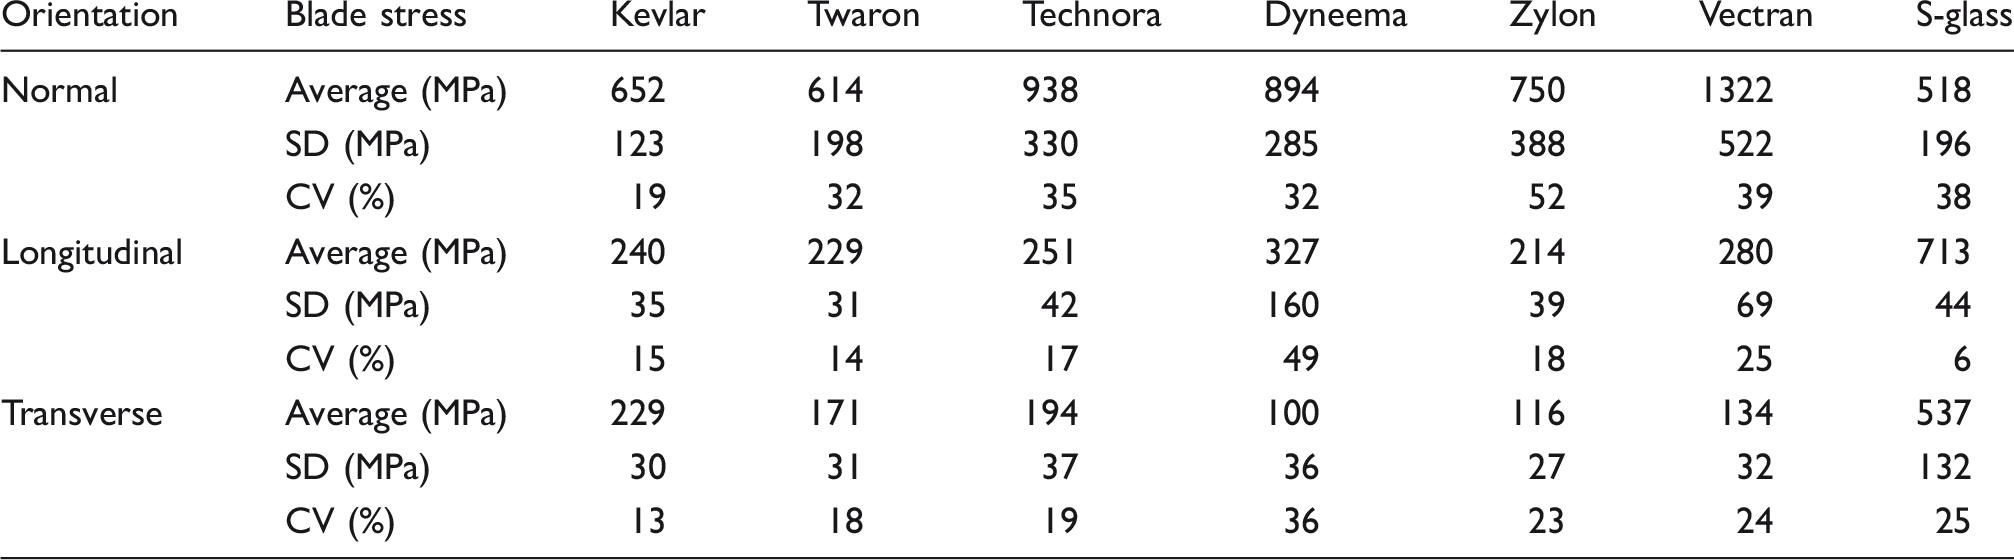
Average blade stresses observed in S-glass at longitudinal and transverse incidences are at least twice as large as those calculated for the organic fibers, but show relatively low blade stress levels at normal incidence. Vectran yields the highest average blade stress among all fibers at normal incidence. At longitudinal incidence, Dyneema shows the highest blade stress for organic fibers at 50% failure probability and above. For transverse incidence, Kevlar provides the highest blade stress of the organic fibers, while Dyneema generally provides the lowest.
The Vectran and Zylon data sets show unusually high variability at normal incidence, relative to the other organic fibers. At longitudinal incidence, the Vectran and Dyneema fibers show high variability while, at transverse incidence, only the Dyneema shows somewhat higher variability. The variability in blade stresses seen in S-glass is comparable to most organic fibers at longitudinal incidence, but is much larger than the variability observed in organic fibers at transverse incidence.
Post-failure microscopy
Figure 6 presents SEM micrographs of each fiber type at all three cutting orientations. Prior to testing, all fibers have relatively smooth cylindrical surfaces, with small populations of surface debris and some hints of the underlying fibrillated structure for the organic fibers. After cut testing, the organic fibers share common features, including splitting, fibrillation, and local plastic flow. Kevlar and Dyneema fibers have a higher propensity to split and fibrillate, while Technora and Vectran tend to fail in a more localized manner. Splitting and fibrillation is most common during longitudinal loading, while normal and transverse cutting is more likely to induce localized failure. In comparison, the inorganic S-glass fiber undergoes localized brittle fracture under all cutting actions, with no fibrillation or splitting.
Representative, post-failure scanning electron microscopy (SEM) micrographs of fibers tested at each cutting orientation. (a) Kevlar, (b) Technora, (c) Dyneema, (d) Zylon, (e) Vectran, and (f) S-glass.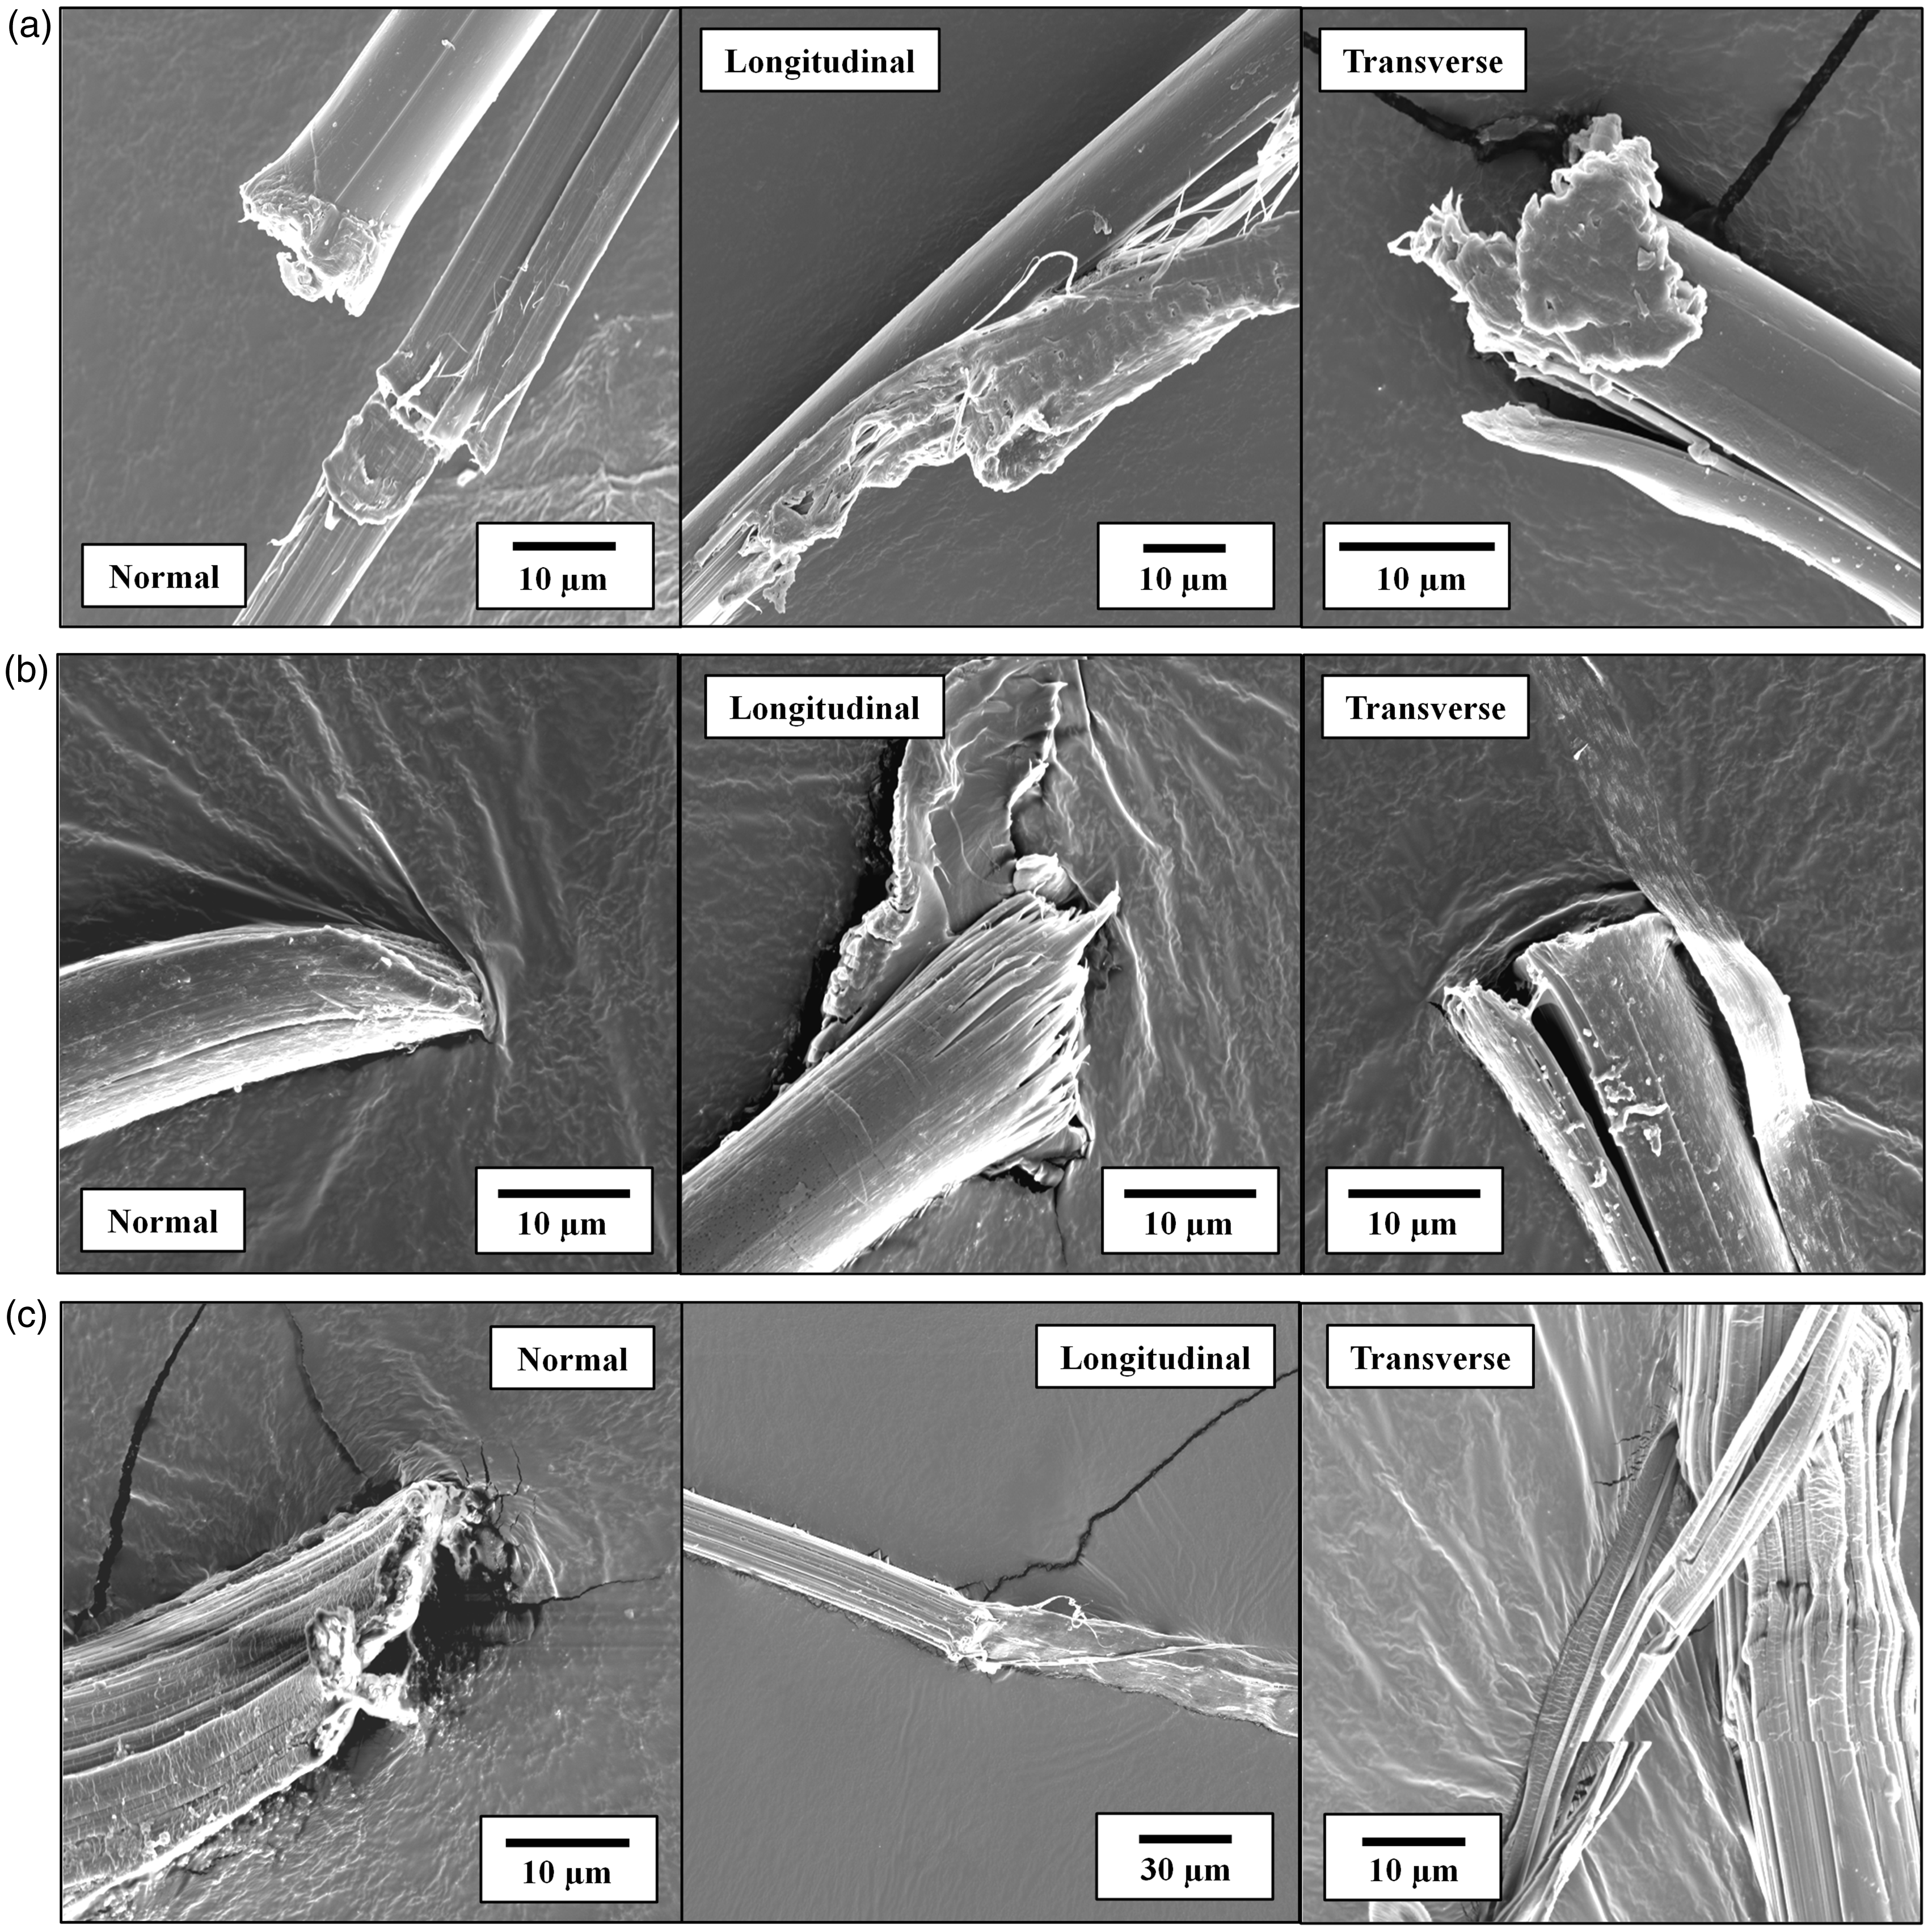
Discussion
Effect of cutting orientation
As shown in the nominal and normalized cut data, the cut response of organic fibers is highly dependent on cutting orientation. The highest failure loads and blade stresses were observed in fibers tested at normal incidence. A fiber loaded in this manner is subject to a complex loading state, dominated by localized transverse compression under the blade edge coupled with axial tension. Note that, in the present end-clamped test configuration, the fiber is placed under increasing tension as the blade is displaced downward. During initial blade penetration into the fiber, fibrils are failed due to the direct cutting action of the blade. As the load increases and the remaining fiber cross-sectional area decreases, local splitting or delamination of the fiber between fibrils is possible. Fibers like Kevlar appear to show larger delamination and less resistance to such splitting, while fibers like Technora appear to show more resistance to such splitting.
Significant decreases in average failure load and average blade stress were observed when organic fibers were tested at angled orientations. This strong directional dependence is associated with the highly anisotropic mechanical properties of highly oriented polymer fibers. In contrast to normal cut testing, in the longitudinal experiment a component of force is directed parallel to the fiber axis. Once the fiber surface is breached, the blade can take advantage of weak adhesion between fibrils, which may explain the peeling behavior observed in some post-failure micrographs taken at longitudinal incidence (Figure 6). In transverse cut testing, the blade edge travels laterally with respect to the fiber, which introduces new sections of the blade to the fiber cross-section (this sliding was visually apparent during testing). This transverse shearing action, combined with the reduced effect of blade dulling as the new blade edge is fed into the crack plane, is most likely responsible for the lower cut resistance for organic fibers at transverse orientation. Micrographs taken at transverse incidence generally show highly localized failure, with smearing and flaring of the polymer in the lateral direction (Figure 6). These images are consistent with the motion of the blade described above.
Unlike organic fibers, the cut response of the inorganic S-glass is relatively insensitive to changes in cutting orientation, as demonstrated by the failure loads and blade stresses reported in Tables 2 and 4. The isotropic structure of S-glass, lacking a fibrillar structure and weak interfibril cohesion, is responsible for this behavior. In cut testing, it is plausible that the advancing blade initiates a crack that propagates in the direction of blade travel until the fiber fails. This hypothesis is supported by the jagged, nearly orthogonal fracture surfaces observed by SEM (Figure 6(f). The larger failure loads and blade stresses observed in longitudinal cut testing may be explained by the increased distance through which the crack must travel. For a fiber oriented at 45°, this distance is 41% longer than the fiber diameter. Average failure loads and blade stresses observed in longitudinal cut testing were 37 and 38% larger, respectively, than values reported for normal cut testing. The high hardness and amorphous microstructure of S-glass may explain the relatively high failure loads and blade stresses recorded at the angled orientations.
Comparison of fiber types
Figure 7 graphically illustrates the mean blade stress values and standard deviations for all fiber types and orientations. For applications like knife stab or slash resistance, the transverse cutting action is a common loading mode and, due to the low resistance of fibers to this cutting action, is likely to be a determinant of limiting performance. Based on the transverse cutting data, S-glass fibers would seem best-suited for such applications, followed by aramids like Kevlar, while Dyneema would be less suitable. To our knowledge, S-glass fibers are not commonly used in cut-resistant textiles, perhaps owing to their poor resistance to normal loading and tendency to fail abruptly. A textile that combines S-glass with organic fibers, similar to cut-resistant textiles with co-mingled metal wires, could be an efficient cut-resistant material. For applications such as turbine blade confinement or ballistic impact by a sharp fragment, where normal cut loading is more probable, the data suggest that fibers like Vectran, Dyneema, and Technora would be more useful. Of course, many other fiber properties, such as wave speed and specific energy absorption, also contribute significantly to protection. Therefore, the more cut-resistant fibers might be hybridized with other fibers and textiles to optimize overall target response.
Comparison of mean and standard deviation of blade stress values for all tested fibers and cutting orientations.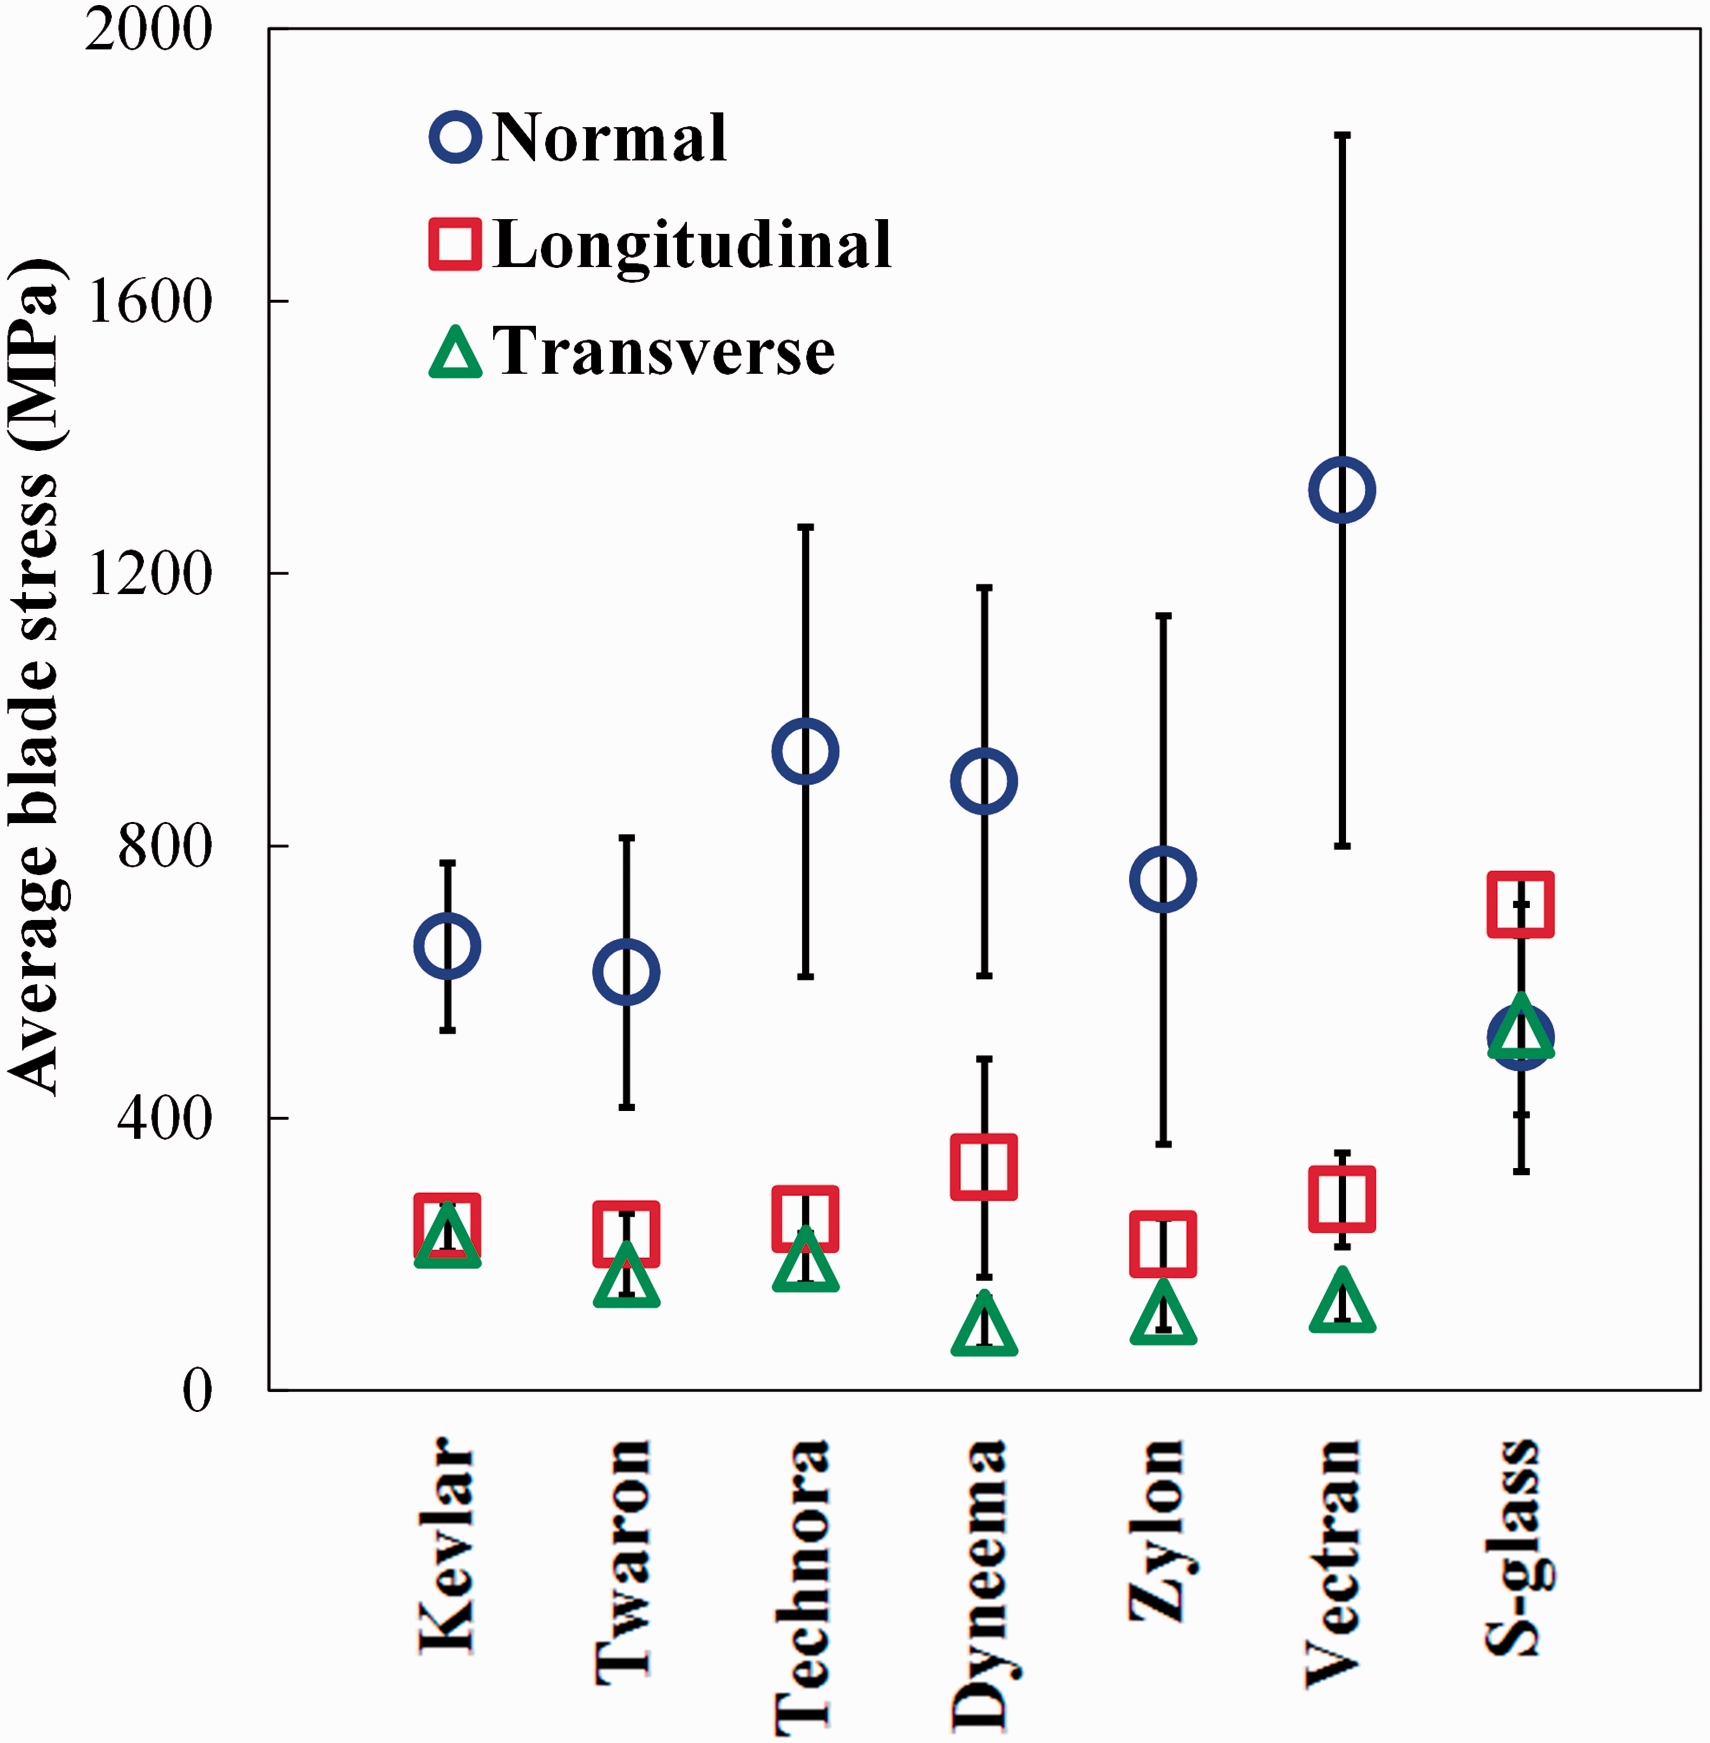
Blade stress values (in MPa) at 5, 50, and 95% probability of failure for all fibers and orientations
Comparison of cut strength data to other fiber and yarn results
The present data set agrees well with the broad trends of Mayo and Wetzel: 27 for organic fibers, normal incidence cut resistance is significantly higher than longitudinal and transverse cut resistance; in contrast, S-glass has similar cut performance under all orientations and significantly better cut resistance during longitudinal and transverse cutting compared to the organic fibers. As the present study includes many more data points for a given fiber type and orientation, the detailed comparative trends of the present study should be more accurate than Mayo and Wetzel. 27
Hudspeth et al. 22 reported the axial failure strains and failure angles of Kevlar KM2, Dyneema SK76, and Zylon AS-555 single fibers subjected to transverse loading with a razor blade. Using linear elasticity assumptions, fiber diameter values, and static force analysis, the Hudspeth et al. data can be converted into blade failure loads that can be compared to the present data set. These calculated, resolved average failure loads for the Hudspeth et al. study were larger than the failure loads measured in the present study: our failure loads are 8% lower for Dyneema, 50% lower for Kevlar, and 58% lower for Zylon. Comparing the results in terms of blade stress, and noting that Hudspeth et al. report a blade tip radius of 2.3 µm, our blade stress values are 43, 67, and 76% lower. The differences in average failure load could be due to differences in fiber grade (for example, Kevlar 129 vs. Kevlar KM2) or blade hardness. The fact that the agreement is best for Dyneema, which is also the most transversely compliant fiber, would support the hypothesis that the difference in load values is caused, in part, by the use of a harder blade in the present study.
Shin et al. 21 tested the cut resistance of 500 denier Zylon AS, 400 denier Kevlar 29, and 375 denier Spectra 1000 (UHWMPE) multifilament yarns at normal orientation and a range of transverse orientations. Their data consistently show Zylon as the most cut-resistant material and Kevlar as the least cut-resistant material. In contrast, the present study indicates that, at normal incidence, Dyneema shows generally higher cut resistance than Kevlar or Zylon; while at transverse orientation, Kevlar has the highest cut resistance, with Zylon and Dyneema considerably lower. A multitude of factors could explain the differences in rankings for the Shin study versus the present study, including differences in fiber grade, blade material and sharpness, and different performance metrics (failure energy for Shin et al., and peak force or blade stress in the present study). We hypothesize that the most significant difference is between multi-filament and single filament failure progression. Multi-filament yarns contain hundreds of fibers that provide lateral constraint via contact and friction, and share loads as fiber failure progresses in series and parallel. Yarn spreading and fiber flow also add complexity to the failure process. Therefore, the results of the present study provide fundamental data on single fiber cut resistance, but additional material factors such as packing, friction, contact, and twist are necessary to completely capture cut behavior at larger material scales.
Origin of statistical variation in cut testing
Given the response distribution of our present results, and the imperfect agreement with prior cut studies, it is important to consider the factors that determine cut resistance of one individual fiber and a series of nominally identical fibers. Considering extrinsic factors, the details of the blade are most likely the leading contributor to cut resistance and dispersion. The present study uses blades with a nominal tip radius of 3.1 µm, with a variation of +/− 1 µm for five measurements along the length of a single blade. 27 Considering that the blade tip radii are comparable to the fiber diameter (9–24 µm in the present study), it would be expected that these blade tip variations are large enough to induce considerable variability in the cut response. Comparing the present blade to other blades, the Hudspeth et al. 22 study uses a blade with a nominal tip radius of 2.3 µm, and Shin et al. 21 report a blade tip radius of 2 µm, with neither of these studies reporting variability in blade tip radius. Therefore, achieving consistent quantitative cut resistance values between studies would not be expected, although rankings of material performance should be similar.
Considering intrinsic material parameters, fiber diameter can vary considerably along the length of a fiber, or from one filament to another filament, especially for UHMWPE. This diameter effect could explain the relatively high dispersion in the Dyneema cut resistance. Cut resistance is also a highly local failure mode, probing fiber response only within a few fiber diameters of the blade loading location. Therefore, any variations in fiber microstructure of flaw content over these length scales would result in changes in the measured fiber cut resistance. Given these variations, the present single fiber tests should be considered as population data for understanding the behavior of more complex multi-filament yarns and textiles, applied via averaging and weakest-link theories to predict the onset and progression of failure in these hierarchical materials.
Conclusions
This work has expanded on knowledge gathered in Mayo and Wetzel 27 by testing a statistically significant number of samples and identifying critical cutting orientations. In doing so, the GEV distribution was found to be a satisfactory model for relating failure load and blade stress to the probability of occurrence in populations of single fibers. Comparisons of post-failure micrographs between organic fibers and the inorganic S-glass suggest that the characteristic failure mechanisms are strongly related to fiber microstructure. Delamination is common in organic fibers, owing to their weak inter-fibrillar bonds.
While this study has addressed the statistical nature of fiber cut testing, there are still voids in knowledge that should be addressed in the future. Multi-scale models used to predict cut behavior in fabrics would benefit from more rigorous studies relating fiber, yarn, and fabric cut response, and to provide clarity on the detailed combinations of directional tension, shear, and compression that are experienced locally by individual fibers during a system-level stab and cut testing. It is clear from comparisons of fiber and yarn data that increases in structural hierarchy have a marked effect on cut resistance trends. In addition, studies that vary loading rate and blade edge geometry would be insightful. The present study only investigated single fiber cutting at a quasi-static rate, but cut, stab, and puncture events usually occur at intermediate and high rates. Furthermore, studies that relate fiber cut response and blade geometry would be instrumental in designing fabric-based protective garments capable of defeating a variety of weapons. Such a study might also probe the effect of blade sharpness.
Footnotes
Acknowledgements
The authors would like to thank JPS Composites, DSM Dyneema, CSR, Inc., Kuraray America, Inc., and Owens Corning for supplying the fibers used in this study; American Cutting Edge, Inc. for supplying the blades used in this study; and Dr. Matthew Hudspeth (Sandia National Laboratory) for useful discussions regarding comparison of experimental data sets.
Declaration of conflicting interests
The authors declared no potential conflicts of interest with respect to the research, authorship, and/or publication of this article.
Funding
The authors disclosed receipt of the following financial support for the research, authorship, and/or publication of this article: This work was supported in part by an appointment to the Postgraduate Research Participation Program at the US Army Research Laboratory administered by the Oak Ridge Institute for Science and Education through an interagency agreement between the US Department of Energy and USARL.