
Abstract
The structures of melt-blown nonwoven fabric, including the fiber volume fraction and fiber orientation, are decided by the melt-blowing conditions, such as the die-to-collector distance (DCD), air suction and air flow rate. In this study, the effects of these melt-blowing conditions on the structure of melt-blown fabric was investigated by X-ray micro computed tomography with a resolution of 1 µm/voxel and a measurement area of 1 mm2. The structural profile along the thickness direction of the fabric was also analyzed. Obtained averages of fiber diameter and basis weight were almost identical to the results of scanning electron microscopy measurements and tests following the standard of International Organization for Standardization. Samples produced with insufficient air suction showed larger deviation of basis weight on the 1 mm2 scale compared with those produced with sufficient air suction. The fiber volume fraction changed steeply around the fabric surface, which was attributed to surface roughness. Insufficient DCD increased the fiber diameter and surface roughness, and decreased the thickness of the fabric. The fiber volume fraction gradually decreased from the collector side to the die side for fabrics with sufficient DCD. The fibers were oriented along the machine direction rather than the cross-machine direction for all layers and samples, and orientation profiles corresponded to the zero-span tensile strength of corresponding samples.
Keywords
Melt-blowing is a process used to produce nonwoven fabrics consisting of microfibers. In melt-blowing, a melt extruded from a die is blown and thinned by high-velocity hot air, and then solidified by cooling in ambient air while exhibiting a vibration in the transverse direction (whipping). The resultant fibers are collected on a wire screen with the aid of air suction (AS), and bonded together by a combination of entanglement and thermal adhesion. 1
The structure of melt-blown nonwoven fabrics is largely decided by the fiber lay-down pattern, which is influenced by the manufacturing conditions. Because the fiber motion in the whole die-to-collector region can describe the lay-down pattern, much research has been performed to understand the fiber motion during melt-blowing. The whipping in a single-orifice melt-blowing device was measured online using high-speed strobe photography,2–5 and Chhabra and Shambaugh 3 reported that a longer distance from the die and a higher air flow rate (AFR) increased the whipping amplitude and decreased its frequency. The fiber motion in a multiple-orifice melt-blowing line was also observed by Breese and Ko; 6 they found that the motion of a single fiber was interfered with by collision with neighboring fibers. Moreover, Bresee and Qureshi7,8 reported that the fiber motion near the collector was strongly controlled by the air flow divergence. Several theoretical models that predict fiber motion and thinning along the melt-blowing line have been developed.3,9–11 Furthermore, these models11,12 have been extended to predict fabric structure, including the diameter and orientation of fibers, the porosity and mass of fabrics, and their variation at every location.13–15 However, few studies evaluating the structure of melt-blown nonwoven fabrics have been published; 16 moreover, the three-dimensional (3D) microstructure of melt-blown nonwoven fabrics has never been reported.
One important 3D microstructural parameter is the structural profile along the thickness direction, because it influences various fabric properties such as bending rigidity, air permeability and water diffusion. Thus, several methods have been developed to evaluate the structural profile along the thickness of fibrous materials. For example, the fiber orientation profile along the thickness of paper was analyzed by Fraunhofer diffraction of a He-Ne laser using a sheet-splitting method 17 and confocal laser scanning microscopy using a fluorescent dye. 18 A Digital Volumetric Imaging Microimager® (Microscience Group Inc., CA, USA) has been used to investigate the effect of a water jet on fiber transfer along the thickness of hydroentangled nonwoven fabrics.19–21 However, these methods are destructive or require sample pretreatment, which may change the original structure.
X-ray micro computed tomography (XCT or µCT), which is nondestructive and does not require sample pretreatment, has also been used to analyze the microstructure of fibrous materials, including yarns,22,23 and knitted 24 and nonwoven fabrics.25–31 For example, fiber volume fractions and orientations in nonwoven fabrics have been quantified using XCT,25,26 and their effects on permeability 27 and their changes during tensile deformation28–30 have been studied. Furthermore, some of the research has focused on the structural profile along the thickness direction. For example, Thibault and Bloch 31 used XCT to investigate the porosity profile of papermaker felt. Hou and Acton 32 quantified the density gradient of tampons using XCT. Ishikawa et al. 33 analyzed the profile of fiber volume fraction and the orientation of needle-punched nonwoven fabric using XCT by separating individual fibers. These studies indicate that XCT is a powerful technique for the analysis of the structural profiles of fabrics along the thickness direction.
In this study, we investigate the microstructure of melt-blown nonwoven fabrics using XCT. In particular, the profiles of fiber volume fraction and in-plane fiber orientation in the thickness direction are evaluated. The effects of die-to-collector distance (DCD), AS, and blowing AFR on the microstructures of the fabrics are studied. This knowledge will enable to be useful for imparting specific properties to melt-blown nonwoven fabrics.
Methods
Melt-blowing
Polyethylene terephthalate (BELLPET TK3, Bell Polyester Products, Inc., Yamaguchi, Japan) pellets were used for melt-blowing. The intrinsic viscosity and melting point of the pellets were 0.65 dl/g and 255℃, respectively. The pellets were dried under vacuum at 120℃ for 12 h prior to use.
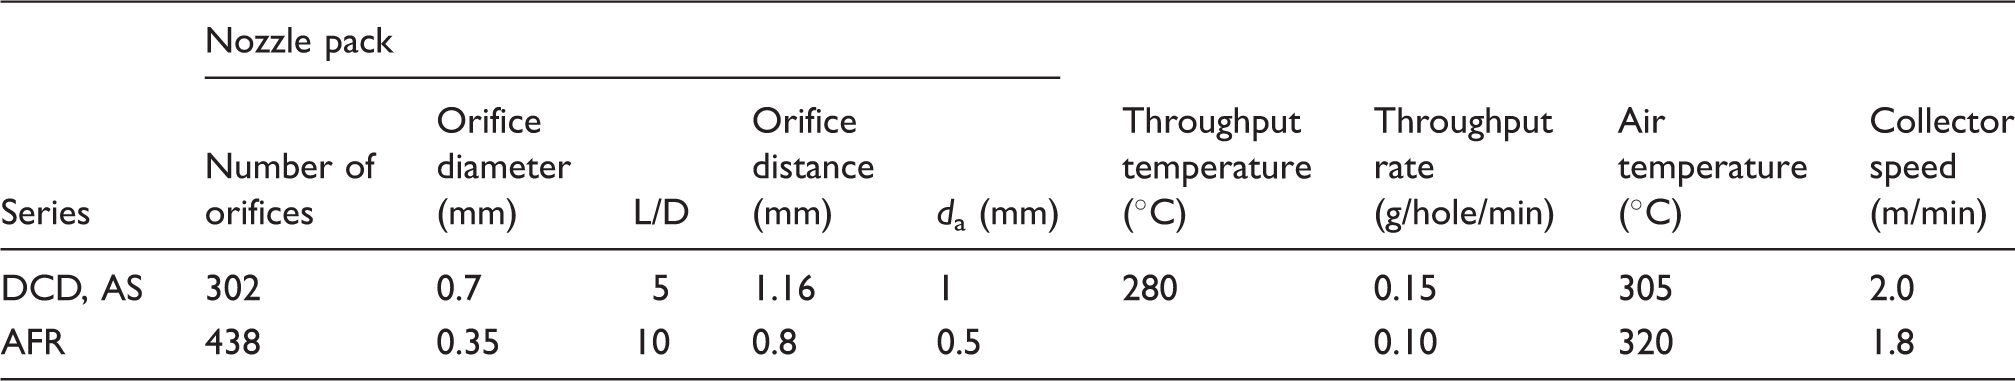
Three series of melt-blown samples were obtained by changing the DCD, AS and AFR. A pilot-scale melt-blowing apparatus (MB-0300, Nippon Nozzle Co., Ltd, Kobe, Japan) was used in this study. Schematic images of the apparatus and nozzle pack are shown in Figure 1. The nozzle used had a width of 400 mm and an angle (α) of 60°, and the setback distance (ds) was set at 0 mm. Other melt-blowing conditions for each series of samples are listed in Tables 1 and 2. Here, the AFR series was produced with a nozzle having a smaller orifice diameter than that for the DCD and AS series. This is because we intended to focus on the effects of fiber diameter in the AFR series. For this purpose, fibers with a uniform diameter are preferable and can be achieved by fiber solidification prior to whipping, namely, by using a nozzle with a small orifice diameter. In the DCD series, we intended to study the effects of fiber solidification. In this case, a longer distance to the solidification point is preferred; thus, a nozzle with a large orifice diameter was selected.
(a) Schematic of the melt-blowing apparatus and (b) enlarged view of the nozzle pack. Here, da, ds and α are the air gap distance, setback distance and nozzle angle, respectively. DCD is the die-to-collector distance. Melt-blowing conditions for each series of samples AFR: air flow rate; AS: air-suction fan rotation speed; da: air gap distance; DCD: die-to-collector distance; L/D: ratio of nozzle length to its diameter. Melt-blowing conditions, basic parameters and fabric parameters determined by scanning electron microscopy (SEM) and X-ray micro computed tomography of each sample AFR: air flow rate; AS: air suction fan rotation speed; bwISO: basis weight measured by ISO test; bwXCT: basis weight measured by XCT; DCD: die-to-collector distance; dSEM: fiber diameter measured by SEM; dXCT: fiber diameter measured by XCT; ΦISO: bulk volume fraction of fiber measured by ISO test; tISO: thickness measured by ISO test; tXCT: thickness measured by XCT; XCT: X-ray micro computed tomography.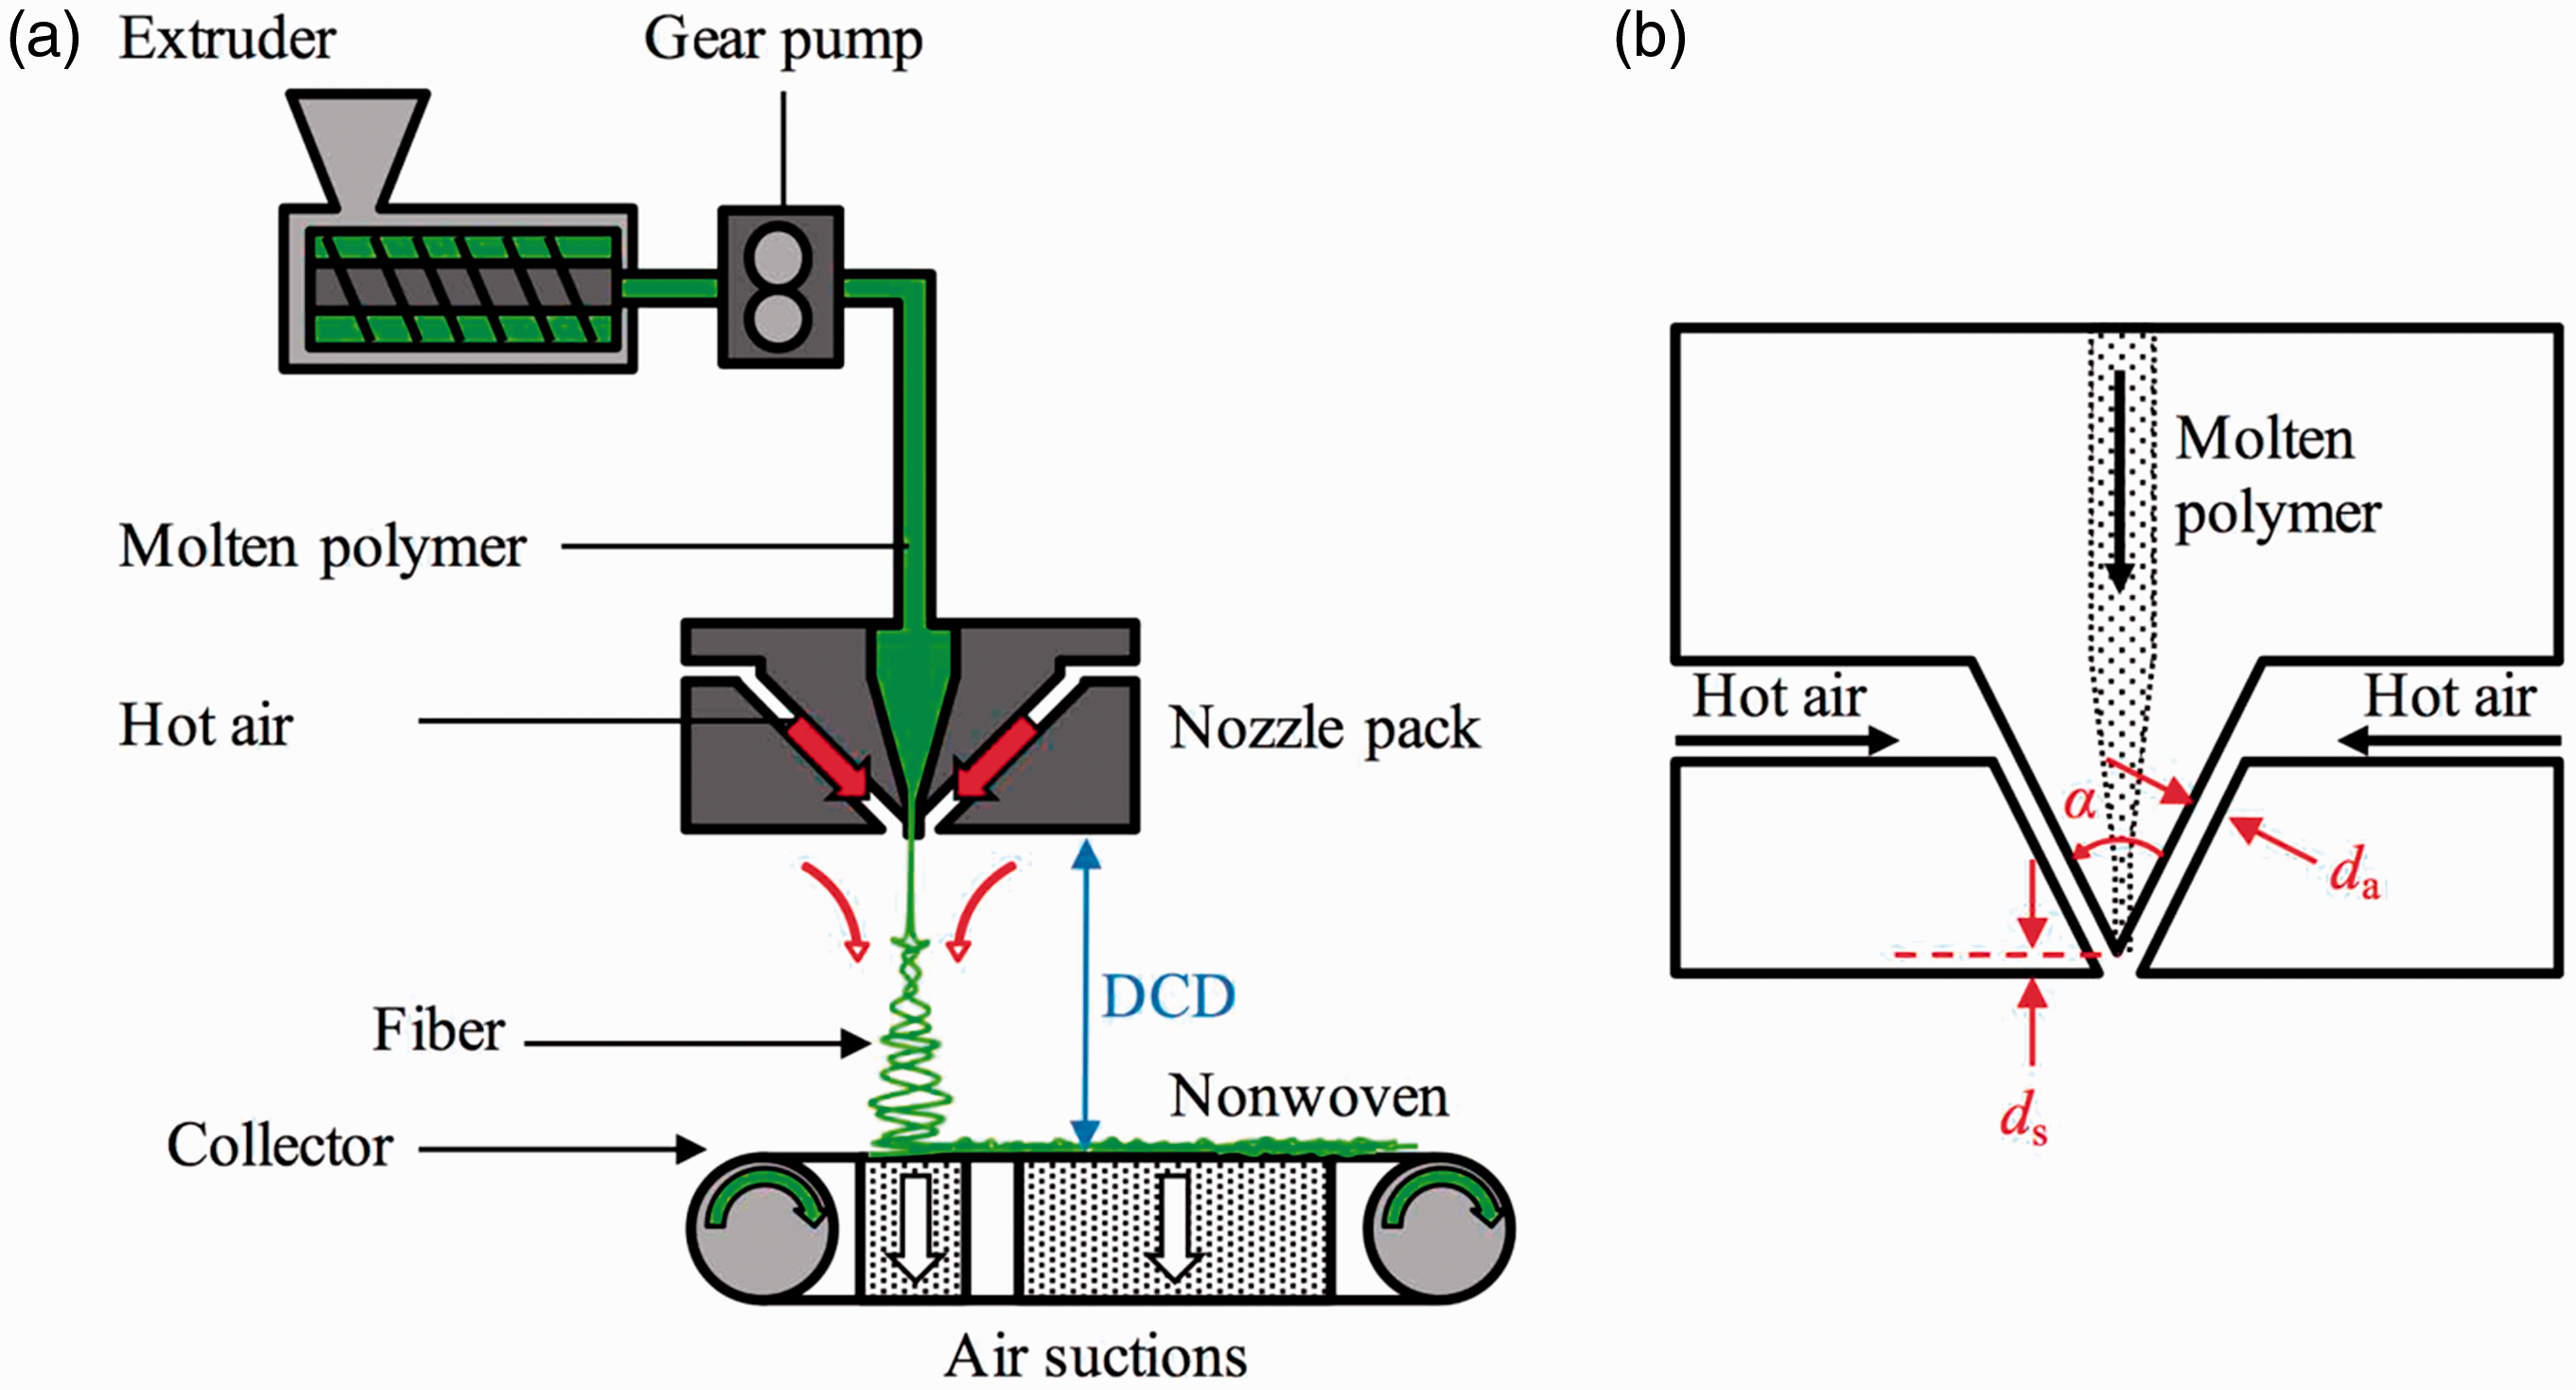
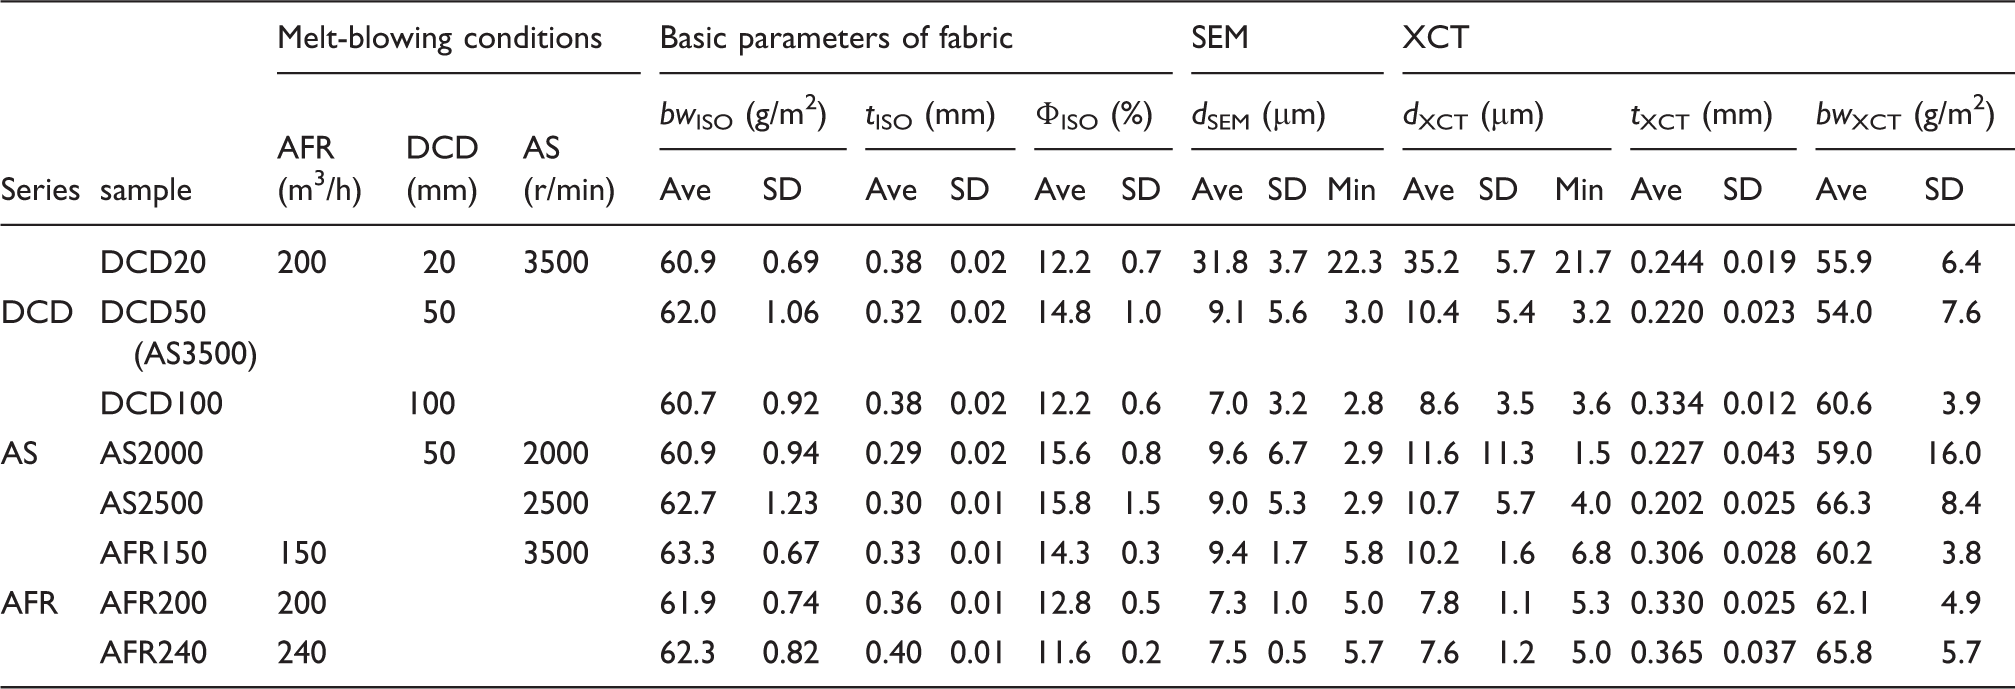
The basis weights (bwISO) and thicknesses (tISO) of the obtained melt-blown samples are listed in Table 2. Here, bwISO and tISO were measured according to ISO (International Organization for Standardization) 9073-1 and ISO 9073-2, respectively. The bulk volume fraction of fibers (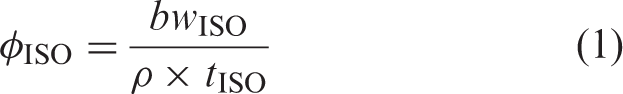
Scanning electron microscopy
The samples were observed by scanning electron microscopy (SEM) (VE-9800, Keyence, Osaka, Japan). Four specimens with dimensions of 10 × 10 mm coated with platinum were used for each sample. Images with a magnification range of 50–500 × were obtained at an accelerating voltage of 1 kV and a working distance of ∼ 10 mm. In all 20 images, 200 fibers were selected randomly and then their diameter (dSEM) was measured.
XCT
The samples were observed by XCT (Skyscan 1272, Bruker, MA, USA) using a device with a maximum resolution of 350 nm/voxel. Six specimens with dimensions of 10 × 10 mm were used for each sample. The specimen was mounted perpendicular to the stage by using adhesive tack. X-rays generated at 30 kV and 200 µA were irradiated onto each specimen without a filter. A total of 1922 transmission images with 2452 × 1640 pixels (1 µm/pixel) were obtained by rotating each specimen by 0.1°/image.
Grayscale tomographic images with 256 gradation were reconstructed by the software NRecon (Bruker). Here, brightness of 0 and 255 were set as the maximum of blank air and the maximum of the specimen, respectively. The tomographic images were then binarized using the software CTAn (Bruker) by thresholding at 1. Corresponding 3D and projection images were constructed using the software CTvol (Bruker) and CTAn, respectively.
From the binarized tomographic images that were parallel to the fabric surface, the fiber diameters (dXCT), fiber volume fractions of each tomographic image (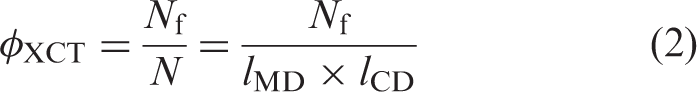
The in-plane fiber orientation of each 10 -µm thick layer was analyzed by two-dimensional fast Fourier transform of the projection image. The power spectrum I was converted into a polar coordinate I (r, θ) using the linear interpolation method proposed by Enomae et al.,
35
and averaged along r. The normalized intensity
Zero-span tensile test
Each zero-span tensile test (ZST)26,36 was performed from the CD to the MD with a step of 15°. Five specimens with dimensions of 50 × 50 mm were used for every direction of sample. Each specimen was gripped at the zero-gauge length by two clamps of the tension tester (AGS-1kNX, Shimadzu, Kyoto, Japan), which was equipped with a 1-kN load cell. The tensile test was performed at a cross-head speed of 10 mm/min.
Results and discussion
SEM
Relationships between the melt-blowing conditions and fiber solidification were investigated through SEM images. SEM images of each DCD sample are shown in Figure 2. Depending on the DCD, there was an obvious difference in the fiber contact points of these samples. Specifically, full fiber fusion was observed at the contact points for DCD20, some contact points were adhered for DCD50 and no adhesion was observed for DCD100. This indicates that the fibers are fully molten 20 mm from the die and solidified before arriving at 100 mm from the die under the experimental conditions of the DCD series. SEM images of AS2000 and AS2500 showed some adhered contact points, which are similar to those of DCD50 (AS3500), whereas no adhered contact points were observed for the AFR series.
Scanning electron microscopy images of die-to-collector distance (DCD) samples. The machine direction was vertical for all samples.
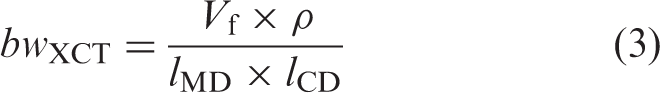
Histograms of dSEM for each DCD sample are presented in Figure 3. DCD20 displayed a symmetrical dSEM distribution with a single peak, whereas bimodal dSEM distributions, which consist of a narrow distribution at small dSEM and broad distribution at large dSEM, were observed for DCD50 and DCD100. AS2000 and AS2500 also showed almost the same bimodal distributions as that of DCD50 (AS3500), while a symmetrical distribution with a single peak was observed for the AFR series.
Histograms of the fiber diameter (dSEM) for each die-to-collector distance (DCD) sample. The fiber diameter was measured by scanning electron microscopy.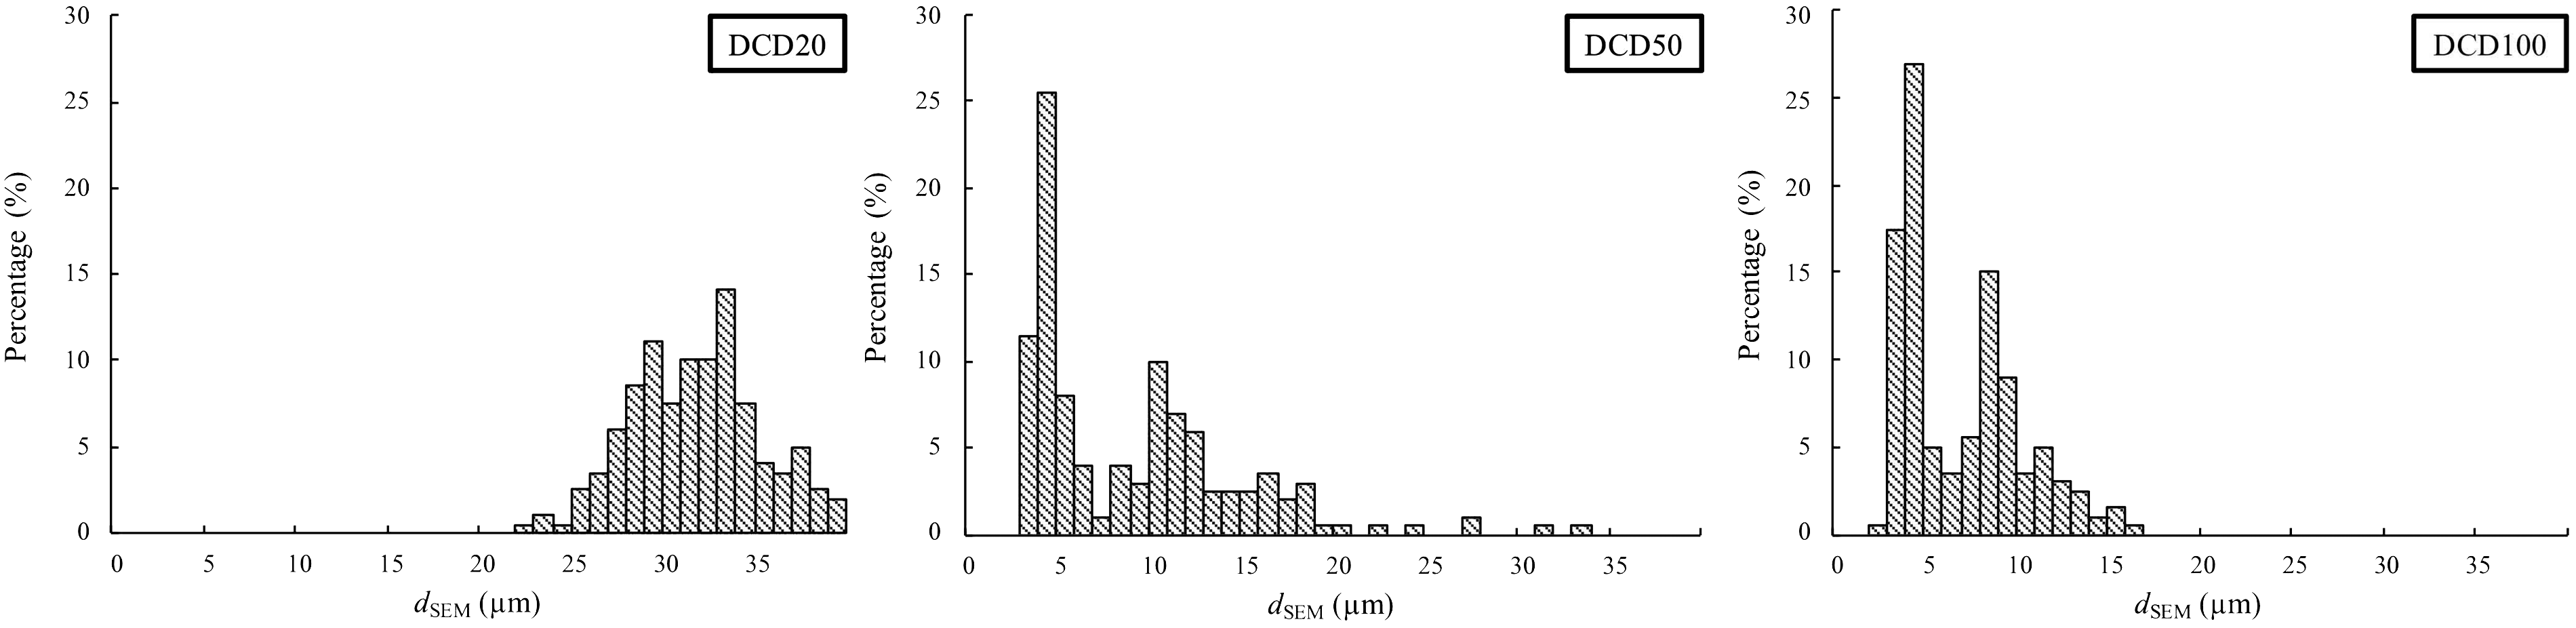
The averages and SDs of dSEM calculated for all samples are listed in Table 2. No obvious change of the average dSEM was observed for the AS series, whereas it decreased with increasing AFR from 150 to 200 m3/h and with DCD from 20 to 50 mm, and was almost saturated over the AFR and DCD ranges of each series. Smaller dSEM variations were observed for the AFR series and DCD20 in comparison with those of the AS series, DCD50 and DCD100.
The dSEM values were determined by the fiber elongation induced by an aerodynamic drag force applied between the fiber and hot air.37–39 Therefore, a smaller dSEM should be obtained with a larger AFR. The saturating trend of fiber diameter with AFR coincides with the results of Bresee et al. 39 In addition, the air drag force decreases along the melt-blowing line because of the decrease of relative speed between them, and almost vanishes 60 mm from the die.5,6 Fiber whipping, which was mainly observed over 50 mm from the die, has also been reported to cause fiber elongation.37–39 The smaller dSEM and larger diameter variations observed for DCD50 and DCD100 compared with those of DCD20 were probably caused by whipping because the fiber elongation induced by whipping has been reported to vary more than that induced by the air drag force.37–39 The smaller dSEM variation observed for the AFR series, despite showing the whipping, suggests that the fibers were solidified before the whipping. This coincides with the results of the SEM images, which indicate that the fibers are solidified before arriving 50 mm from the die under the experimental conditions for the AFR series.
XCT
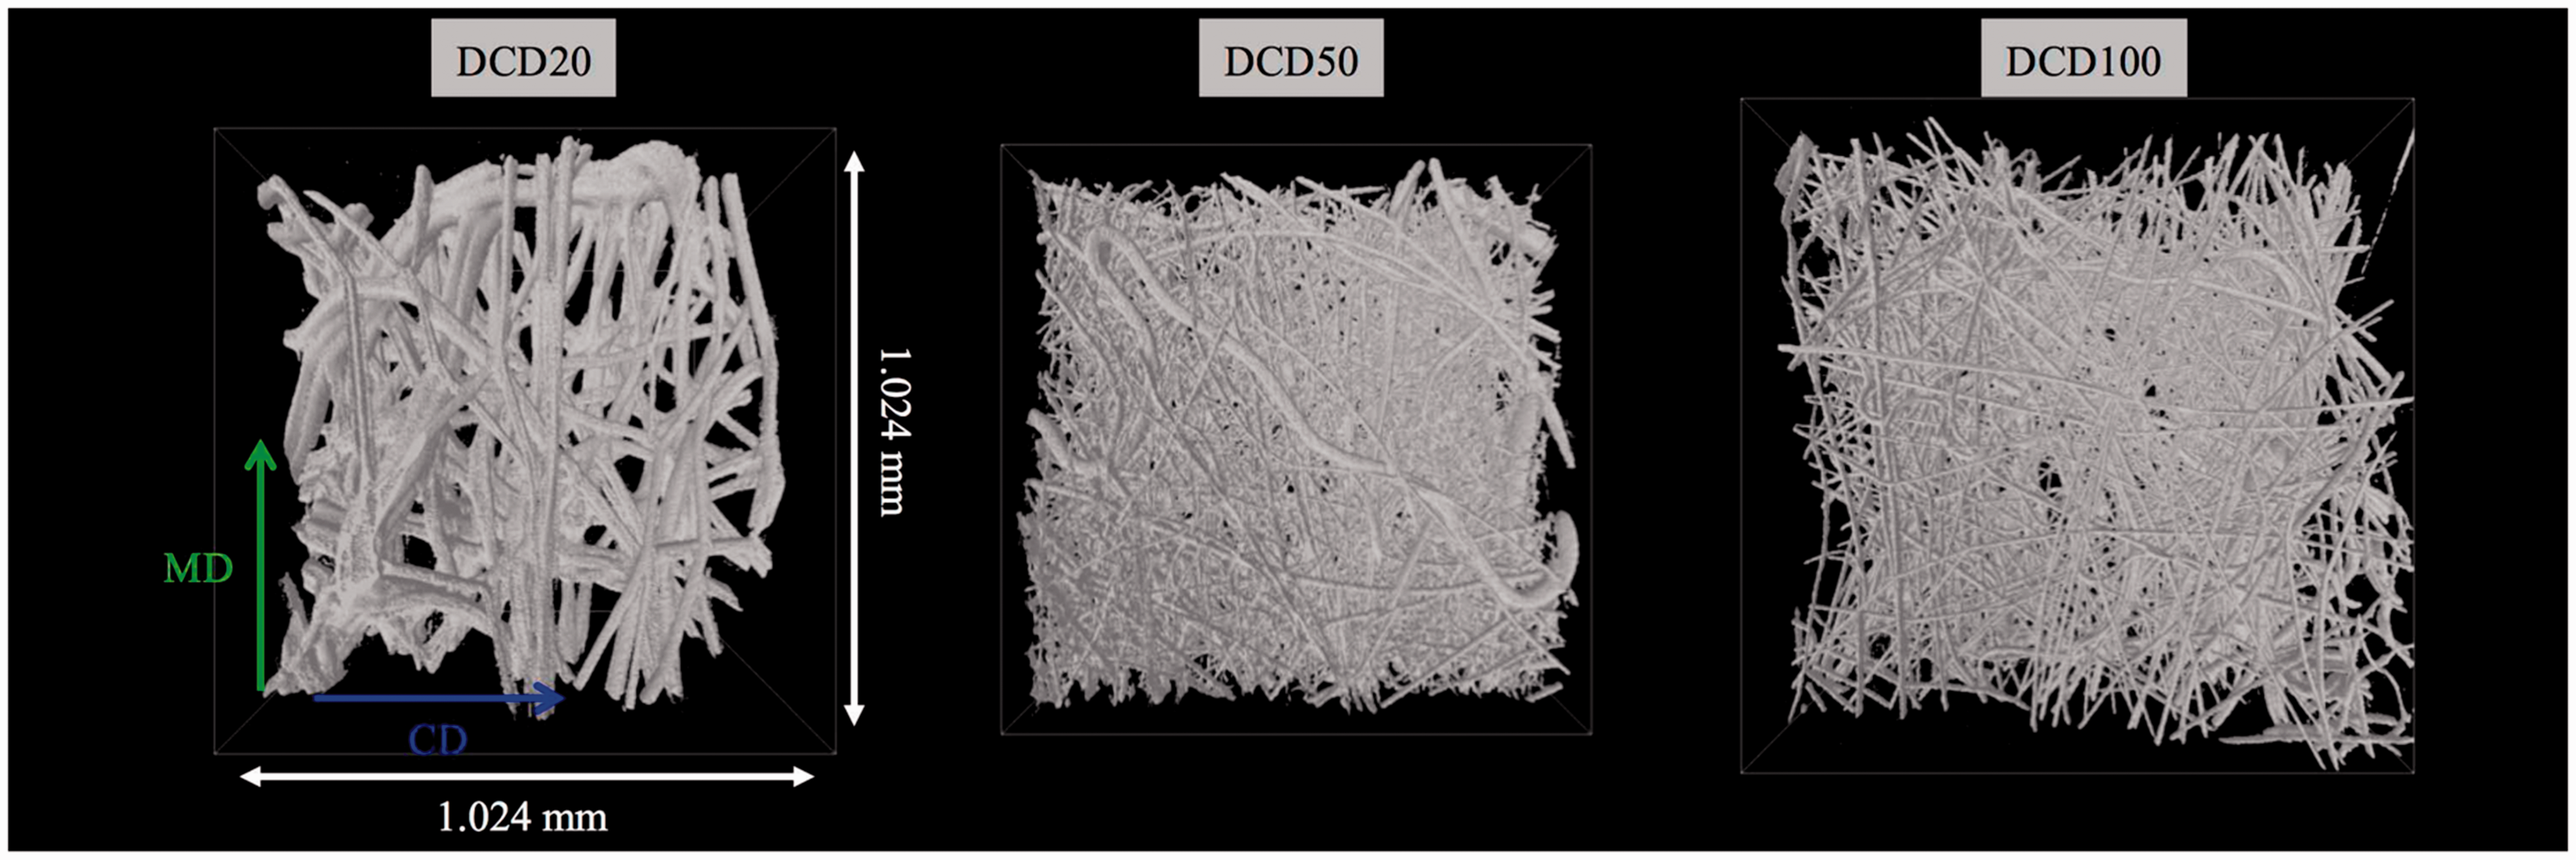
The quality of the images obtained by XCT was inspected for the DCD series. Tomographic images for three planes of DCD50 are shown in Figure 4(a)–(c). The fiber shape was clearly defined, and almost no notable noise or artifacts were observed following the binarization of the images. This indicates that the binarization and the set threshold level were suitable for the extraction of the characteristics of fibers in the fabric samples. Figure 5 depicts 3D images of the entire specimen within the volume of interest for each DCD sample obtained from the binarized images. For all DCD samples, the fibers were clearly visualized throughout each specimen without notable noise.
(a) Three-dimensional navigation image, and (b) and (c) tomographic images of each plane of the DCD50 sample; (b) shows 256-gradation grayscale images, whereas (c) depicts binarized images of (b) with a threshold level of 1. Top view of three-dimensional images for each die-to-collector distance sample. These images were obtained by the surface rendering of binarized tomographic images. CD: cross-machine direction; DCD: die-to-collector distance; MD: machine direction.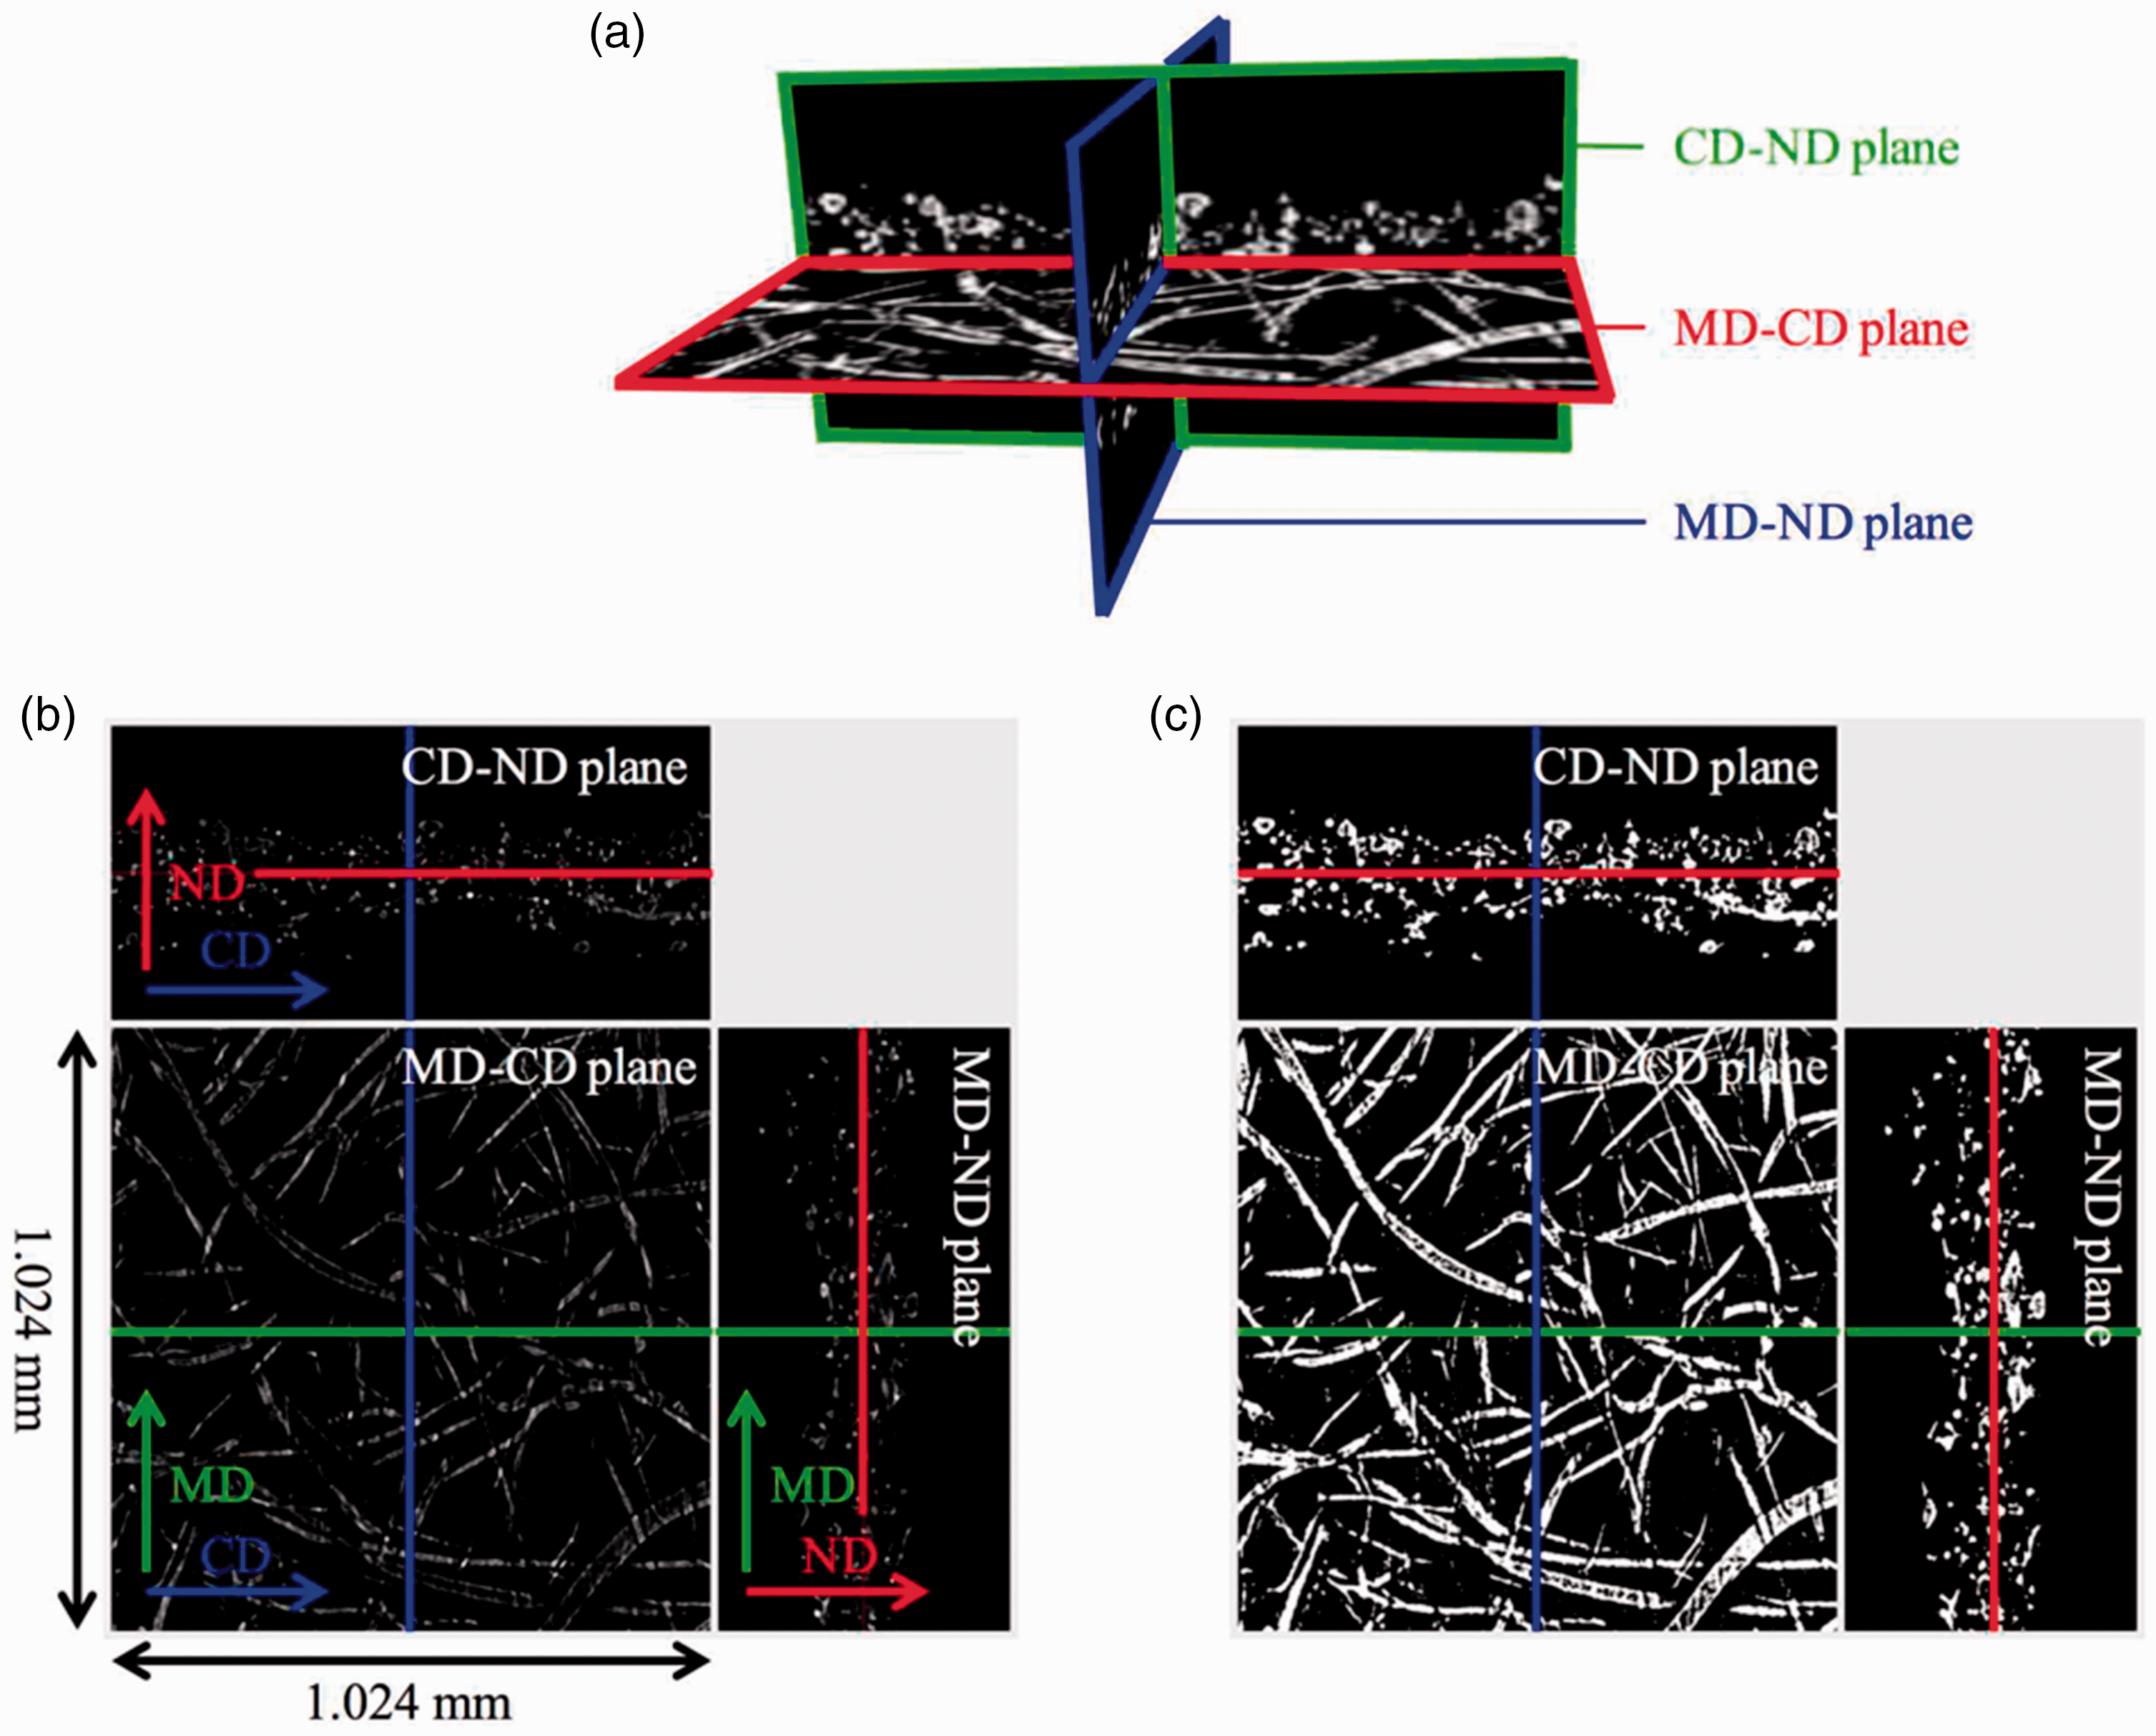
To determine the resolution of the XCT measurements, dXCT was compared with dSEM for each sample. The dXCT values listed in Table 2 were 1.5 µm (13%) larger than the corresponding dSEM values on average. In contrast, their deviation and minimum values of 3 µm were almost the same. This indicates that the resolution of XCT is larger than 1 µm but smaller than 3 µm. The SD of fiber diameter indicates that there is no marked difference between dXCT and dSEM.
Change of fiber volume fraction along the thickness direction of fabrics
Tomographic images of a typical specimen for each sample are shown in Figure 6(a). Here, we selected the origin of x as the location where we considered the sample to have contacted the collector, as indicated in the projection images in Figure 7(a). The projection images were obtained by projecting all MD–normal direction tomographic images along the CD with a maximum intensity for each pixel. Thus, they correspond to the entire specimen within the region of interest (1.024 × 1.024 mm) observed from the CD. A black area in the projection image means that there are no fibers in that region throughout the entire fabric length along the CD.
Binarized tomographic images as a function of x for (a) a typical specimen of each sample and (b) specimens of DCD50. Image dimensions are 1.024 × 1.024 mm. Examples of vacant space are included. Projection images of the machine direction–normal direction plane for (a) a typical specimen of each sample and (b) specimens of DCD50. Projection images were obtained by the projection of 1024 images along the cross-machine direction. The origin of distance from bottom (x) is indicated in each figure. The dashed lines represent xmin and xmax, which are the average position of the surfaces used for the distance normalization. MD: machine direction; ND: normal direction. AFR: air flow rate; AS: air suction fan rotation speed; DCD: die-to-collector distance.
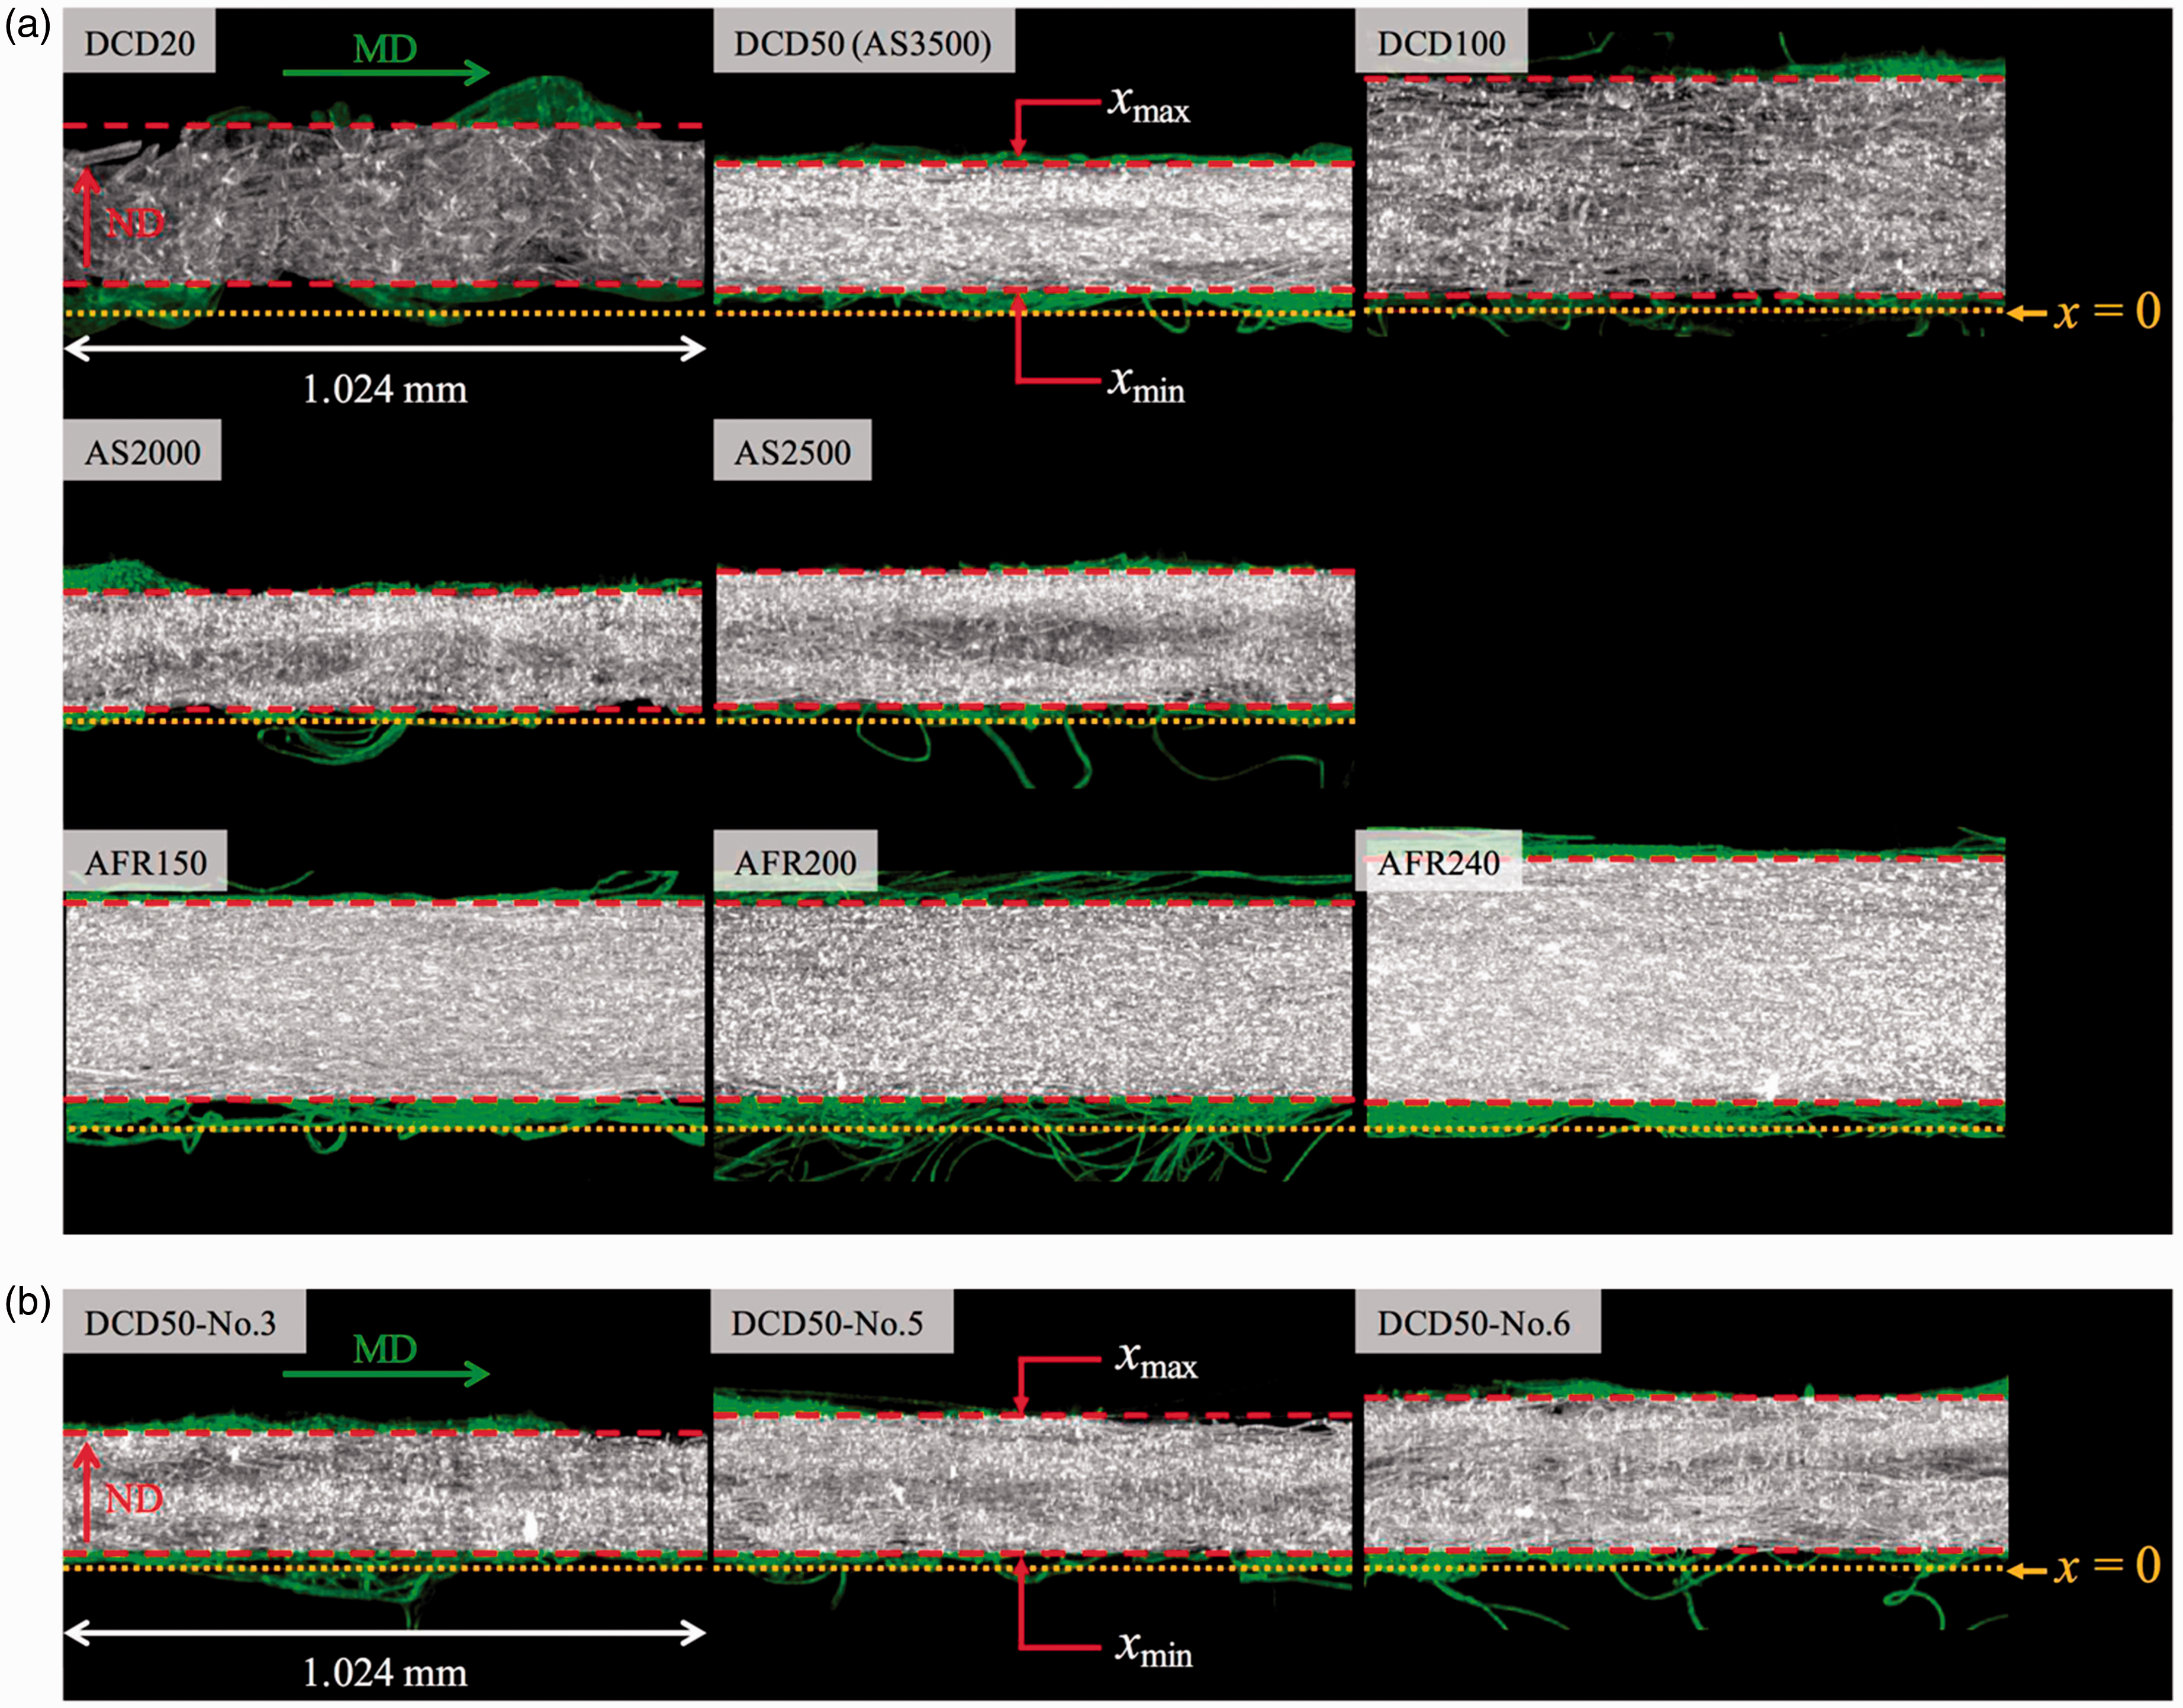
The tomographic images for the minimum and maximum x were almost vacant, whereas the images for the middle range contained uniformly distributed fibers. In the intermediate region, the fiber fraction changed gradually. The change of fiber fraction was not uniform; instead, it was affected by the change of vacant space. The change of vacant space in the tomographic image should correspond to the fabric surface roughness, that is, the fine irregularity of the fabric surface, as shown in the projection image.
The variation of structure between specimens was inspected. The tomographic and projection images of three specimens of DCD50 are presented in Figures 6(b) and 7(b), respectively. For each specimen, the length of x where the tomographic images were covered by uniformly distributed fibers was different. This indicates that there is variation of the fabric thickness between the specimens. The thickness variation between specimens was also observed in the projection images.
Figure 8(a) illustrates Profiles of the fiber volume fraction (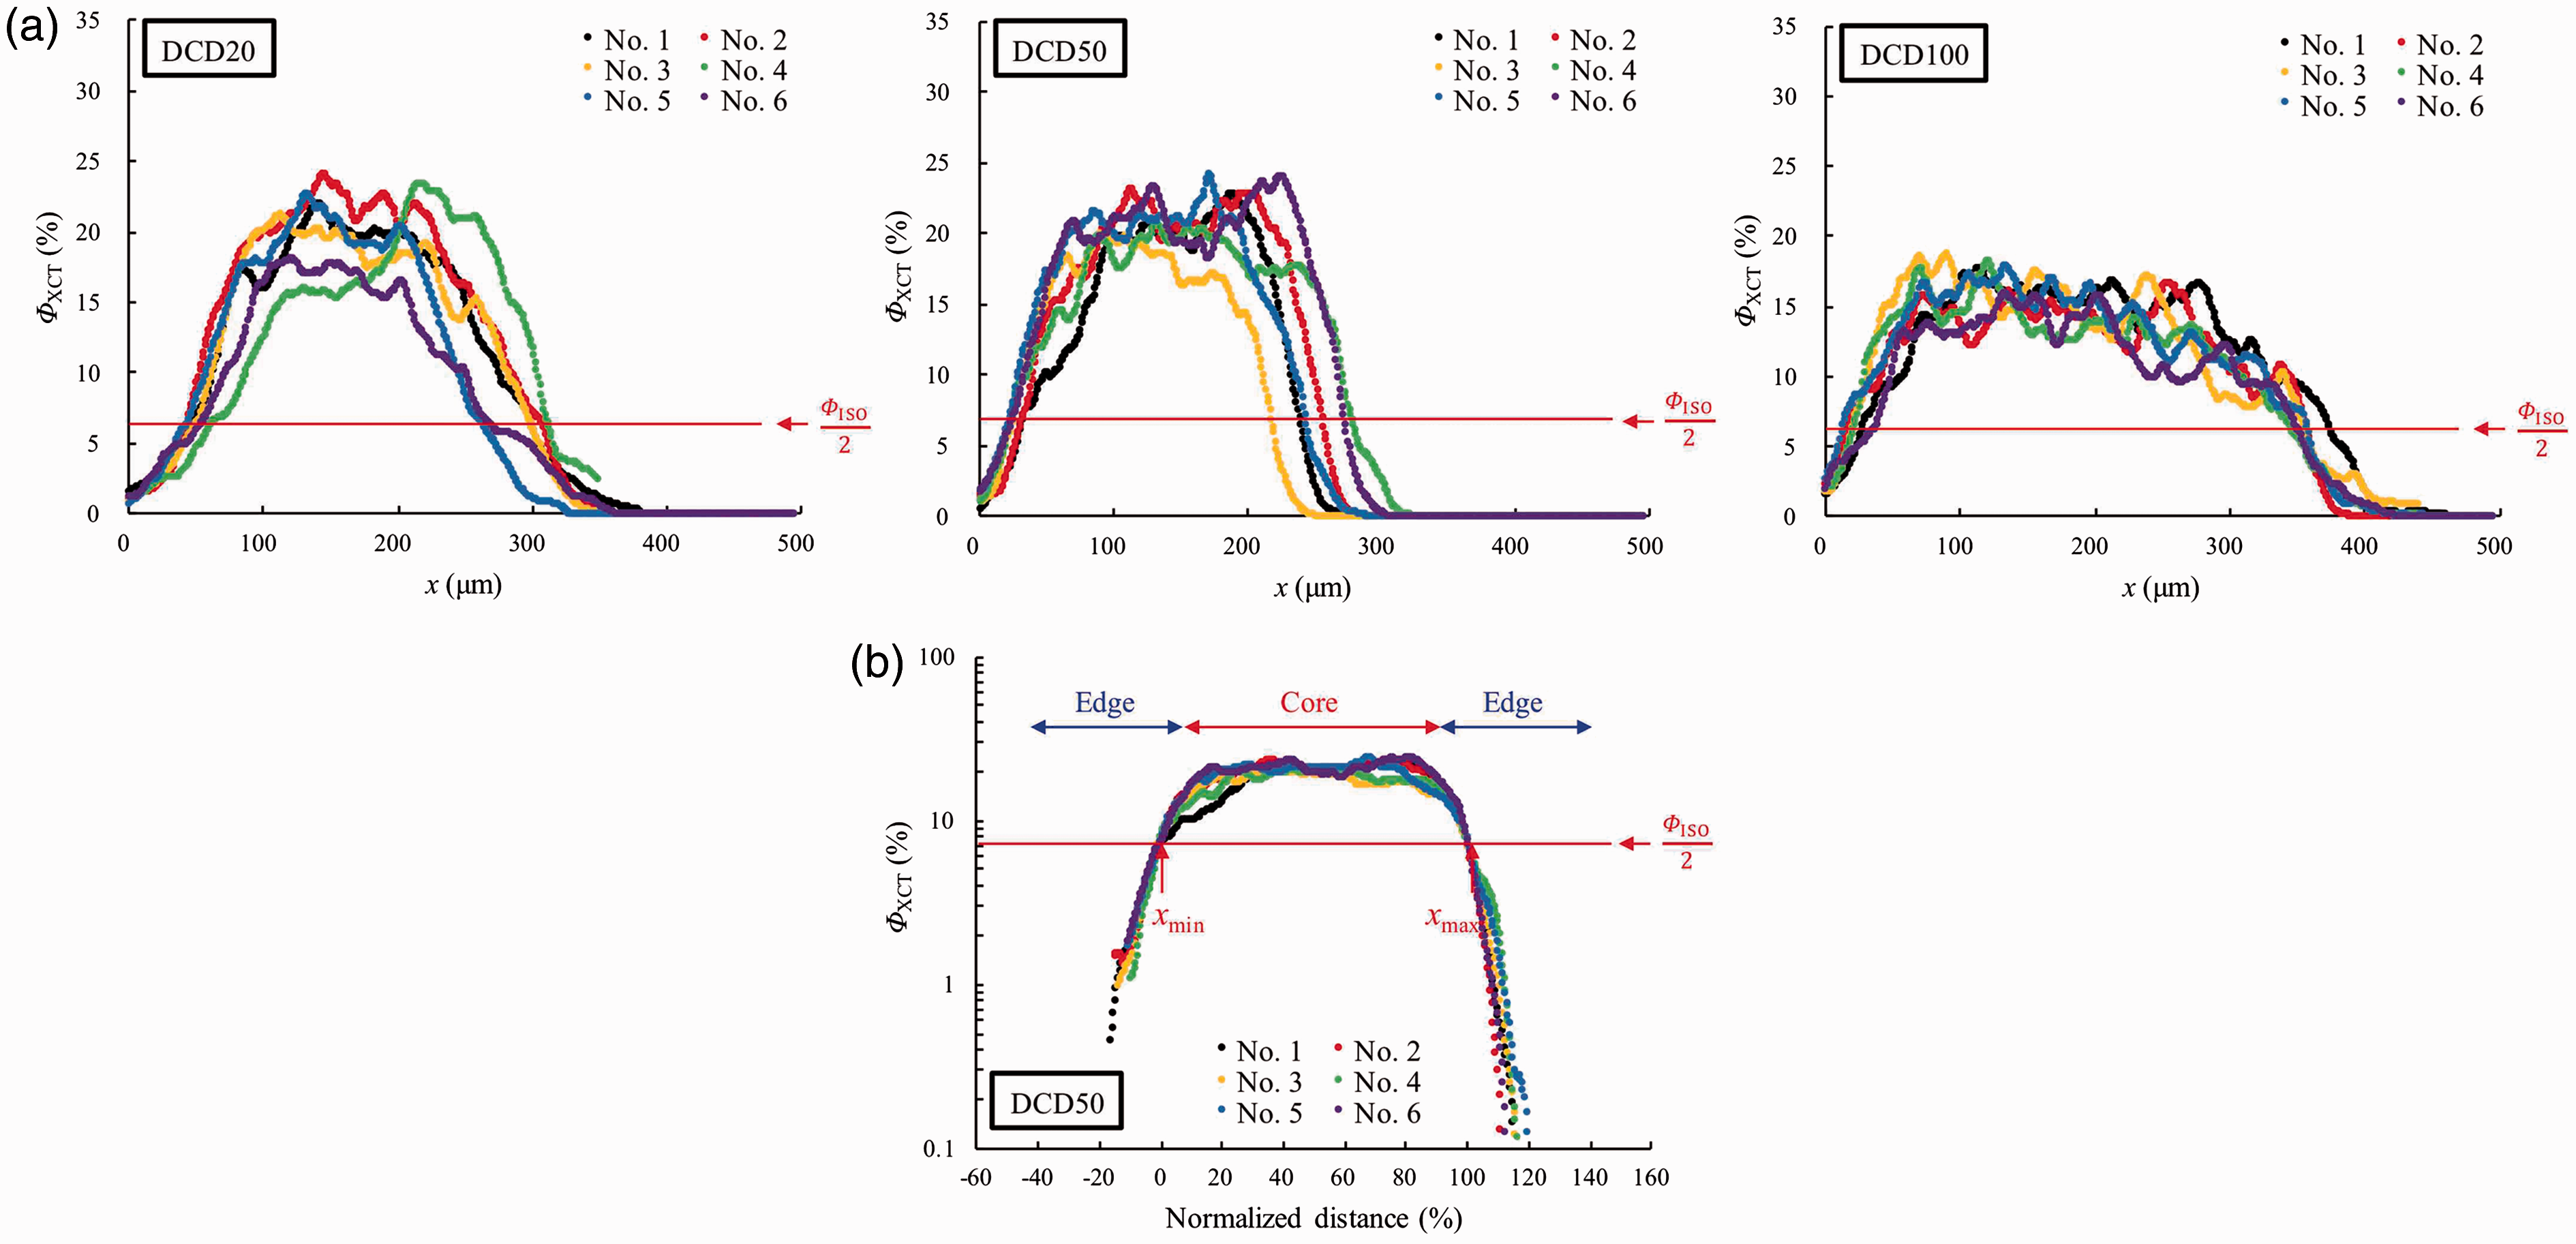
The normalized profiles for DCD50 are shown in Figure 8(b), where the logarithmic vertical axis was selected to verify the relative variation. Except at both edges, the profiles coincided with each other. This illustrates that the above assumption for the normalization is acceptable. The edge region is believed to correspond to the locations affected by surface roughness, because the vacant space caused by surface roughness should decrease
The profiles of the averaged Profiles of the averaged fiber volume fraction (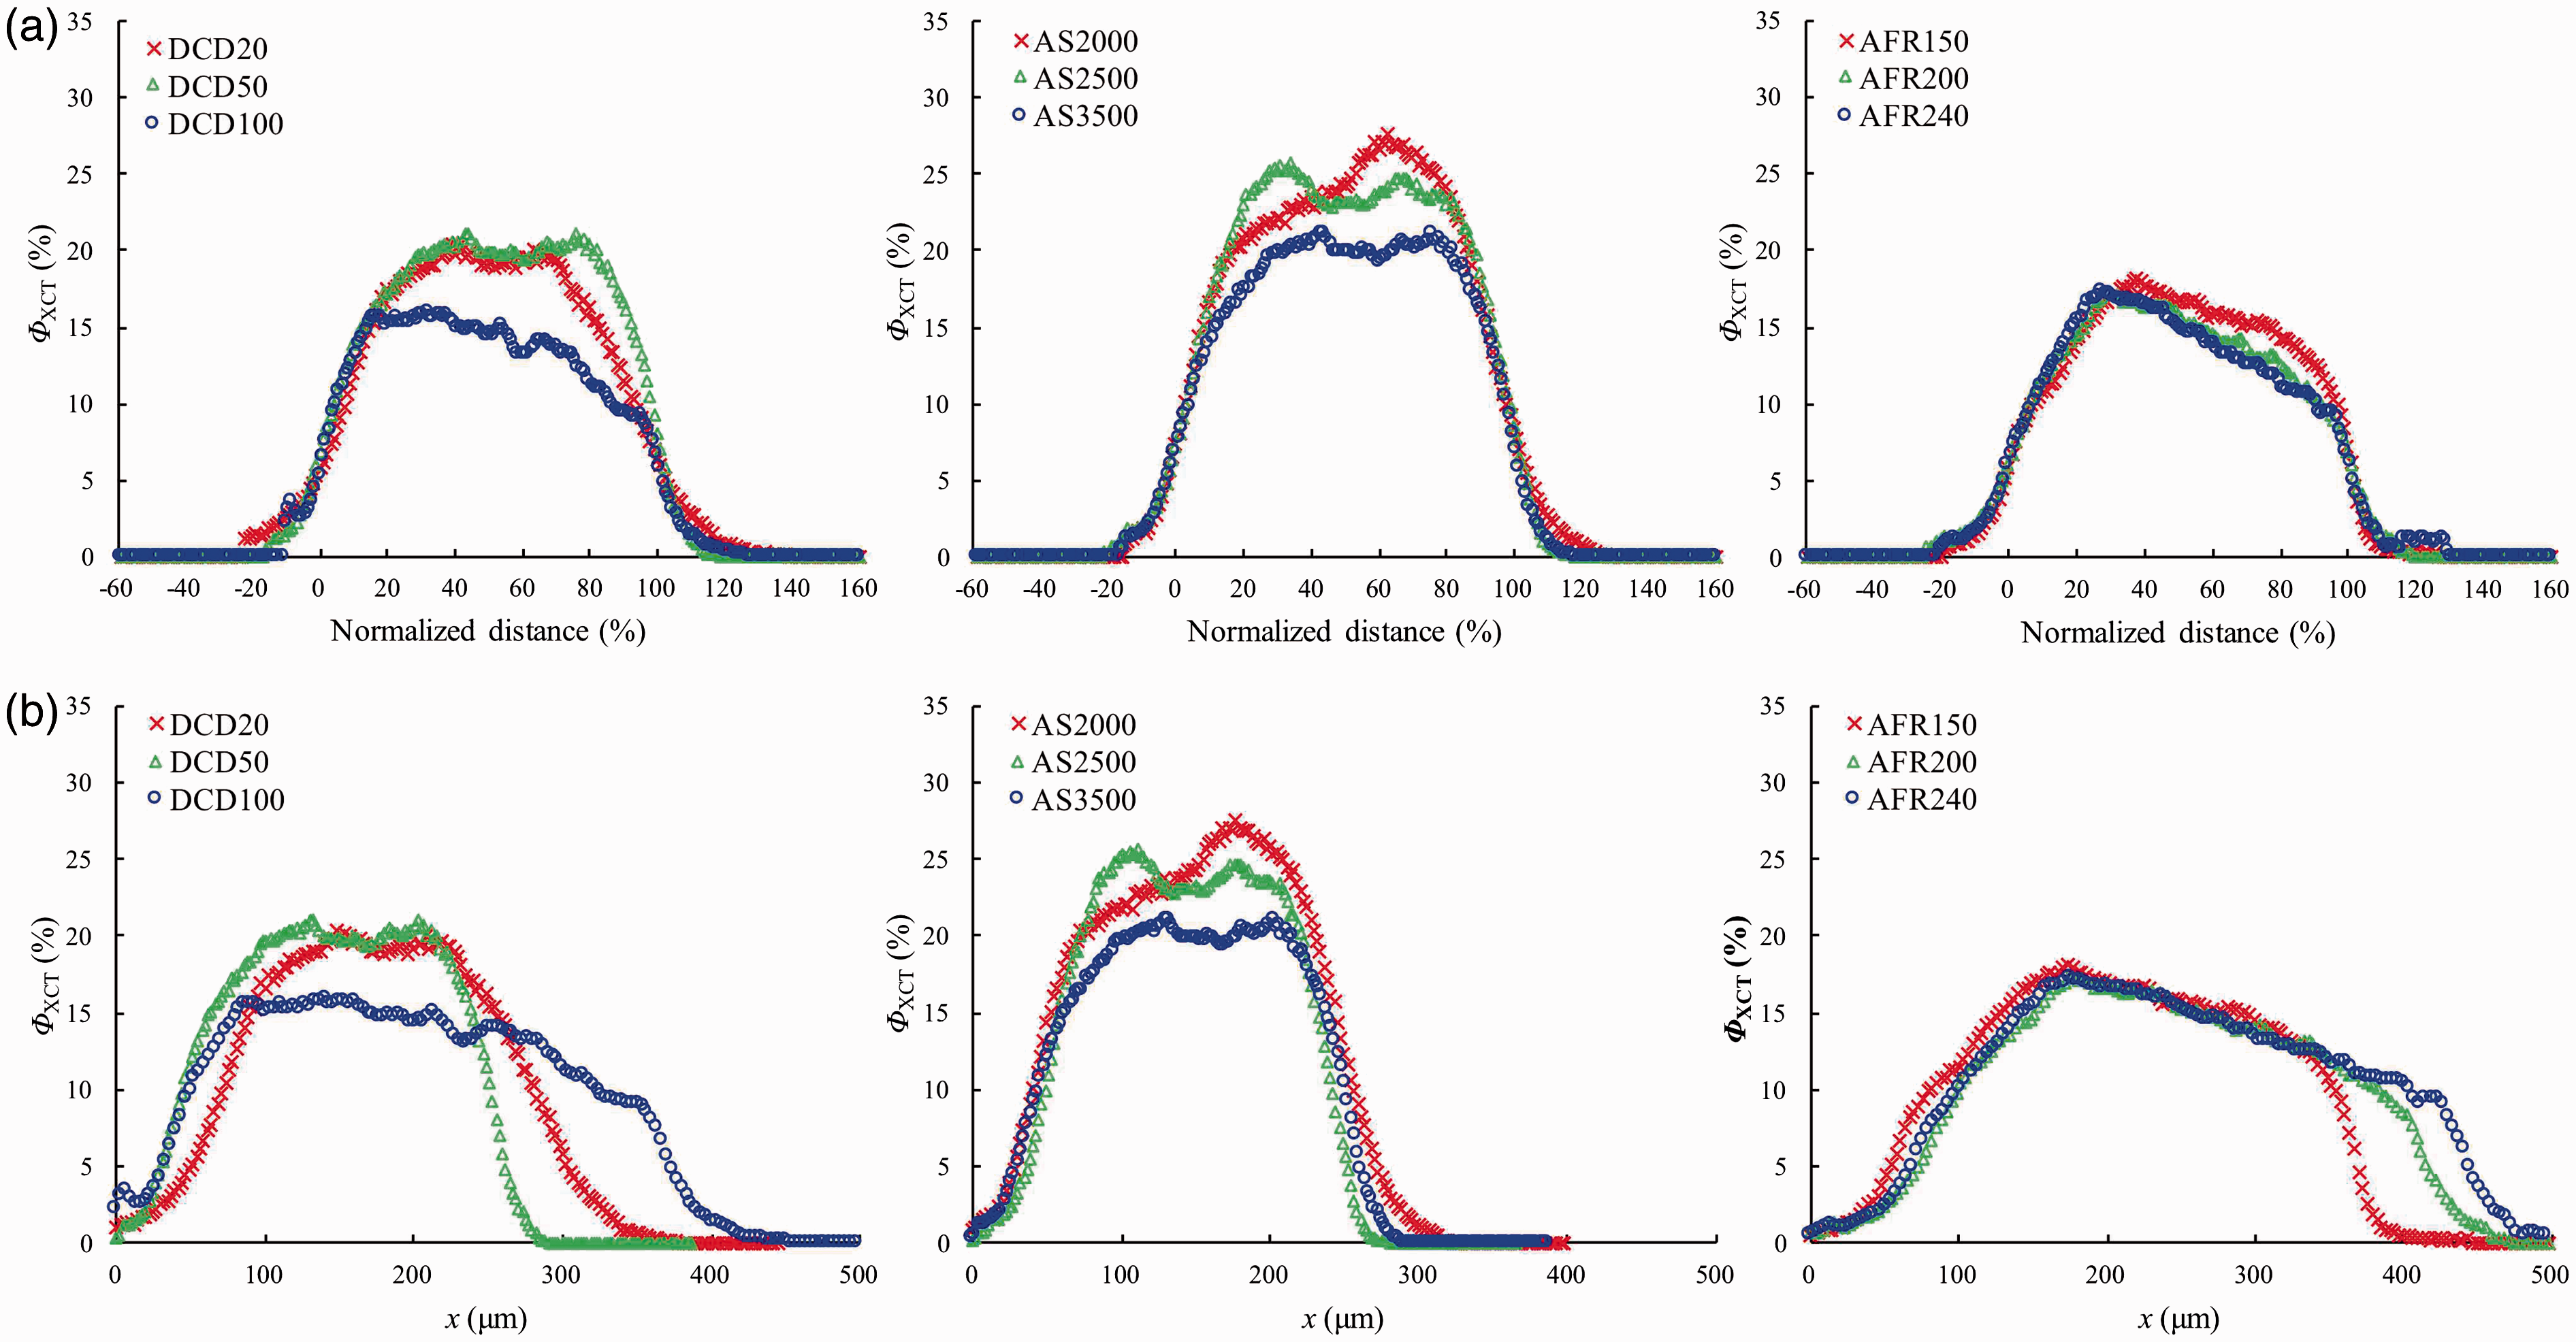
Basis weight and fabric thickness
Obtained bwXCT and tXCT values are listed in Table 2. There was no obvious difference observed between bwXCT and bwISO, confirming that the XCT analysis was quantitative. In contrast, the SD of bwXCT was much larger than that of bwISO. The larger SD of bwXCT is thought to be caused by the far smaller measurement area of 1.048576 mm2 than that of the ISO test of 10,000 mm2. The variation of the basis weight of nonwoven fabrics usually increases with decreasing measurement area. 1 The result in this study indicates that the basis weight, which is the amount of laid fibers in a unit area, varies considerably on a scale of 1 mm2, whereas it is averaged on the scale of the ISO test.
The deviation of bwXCT clearly increased with decreasing AS, particularly for the AS2000 sample. This can be explained by the equalization effect of AS. That is, more blown fibers are thought to be dragged to the lower fiber density region of the laid-down web by the AS because more air is suctioned through the region with lower fiber density. The larger bwXCT deviation of AS2000 than that of the other samples can be explained by the decrease of the equalization effect of AS.
All tXCT values were smaller than the corresponding tISO values for each sample. DCD20 showed a particularly large difference between these parameters. The difference between these values should be caused by the different measurement areas and definition of thickness; that is, tISO is the maximum thickness of an area of 100 mm2, whereas tXCT is the distance between the half fiber volume fraction points xmin and xmax, and has an area of ∼1 mm2. The larger difference between these values for DCD20 compared with those of the other samples is thought to be caused by its larger surface roughness, which was ascertained from the projection images in Figure 7(a). Because the period of surface fluctuation is almost the same as that of the collector mesh, the surface roughness should be caused by the collision of molten fibers with the collector.
The tXCT values increased with AFR, and a larger value was obtained for DCD100 than for the other DCD samples. Because the increase of tXCT exceeded the increase of bwXCT, the fiber volume fraction of the fabric should be decreased by increasing the AFR and DCD. The mechanism behind the larger tXCT and smaller fiber volume fraction with increasing DCD and AFR will be discussed in the next section.
Effects of melt-blowing conditions on the fiber volume fraction
The fiber volume fraction of a fabric is governed by melt-blowing phenomena, which are affected by melt-blowing conditions like the DCD, AS and AFR. Here, we focused on the four major factors governing melt-blowing phenomena—fiber thinning, solidification, collision with the collector and AS—to explain the effects of melt-blowing conditions on fiber volume fraction. These factors affect the fiber volume fraction as follows. Thinner fibers increase the fiber volume fraction, because thin fibers can be easily compressed on the collector by AS. Fiber collision with the collector before solidification increases the fiber volume fraction because fiber deformation and fiber fusion at the contact points occur more readily before solidification than after. Increases in fiber collisions and AS force both compress the fabric, increasing the fiber volume fraction.
The effects of melt-blowing conditions on the microstructure of melt-blown fabric can be explained by the above-mentioned factors. Insufficient DCD, like that of DCD20, caused fiber fusion at the contact points, which increased the fiber diameter, fiber volume fraction and surface roughness, as well as decreasing the thickness on the scale of 1 mm2. These results agree with the findings of Lee et al.,40–42 who reported increases of pore diameter, air permeability and fabric thickness with increasing DCD. Fusion at the contact point masks the effect of AS, whereas the volume fraction gradient observed for the fabrics with sufficient DCD should be caused by the gradient of AS force along the thickness direction. In addition, insufficient AS increases the basis weight deviation on the scale of 1 mm2. Interestingly, we did not observe previously reported effects that increased AFR leads to increased/decreased volume fraction and increased/decreased fiber diameter.16,42
Change of fiber orientation along the thickness direction of the fabric
Angular profiles of the integrated power spectra for the DCD series of samples are presented in Figure 10. The Angular profiles of integrated power spectra obtained by the fast Fourier transform of images of the machine direction–cross-machine direction plane, which were obtained by the projection of every 10th tomographic image with the maximum intensity projection method. Tensile loads obtained by the zero-span tensile test for each angle and their SDs are also plotted on the right-hand axis.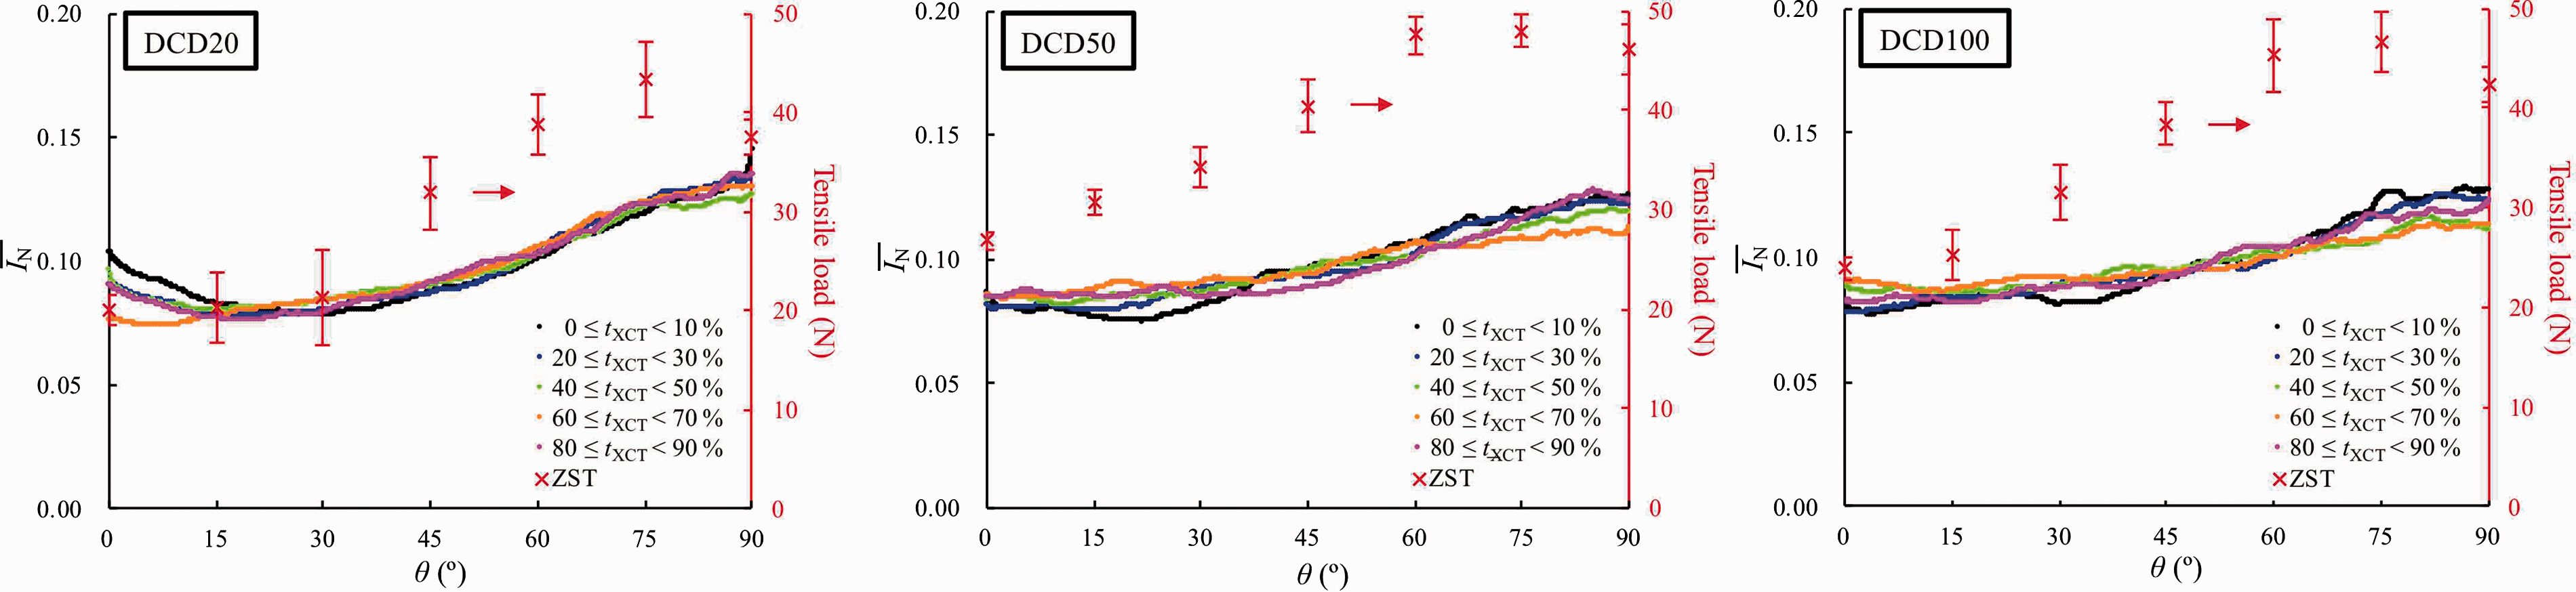
The tensile loads measured by ZST are also plotted in Figure 10. The smaller tensile loads obtained for DCD20 than those of the other DCD samples should be caused by the stress concentration at the fused contact points of fibers. In addition, the tensile load increased from 0 to 90° for all samples, like the integrated power spectra. The larger anisotropy of ZST than that of the integrated power spectra may be caused by the integration of power spectra along r to obtain
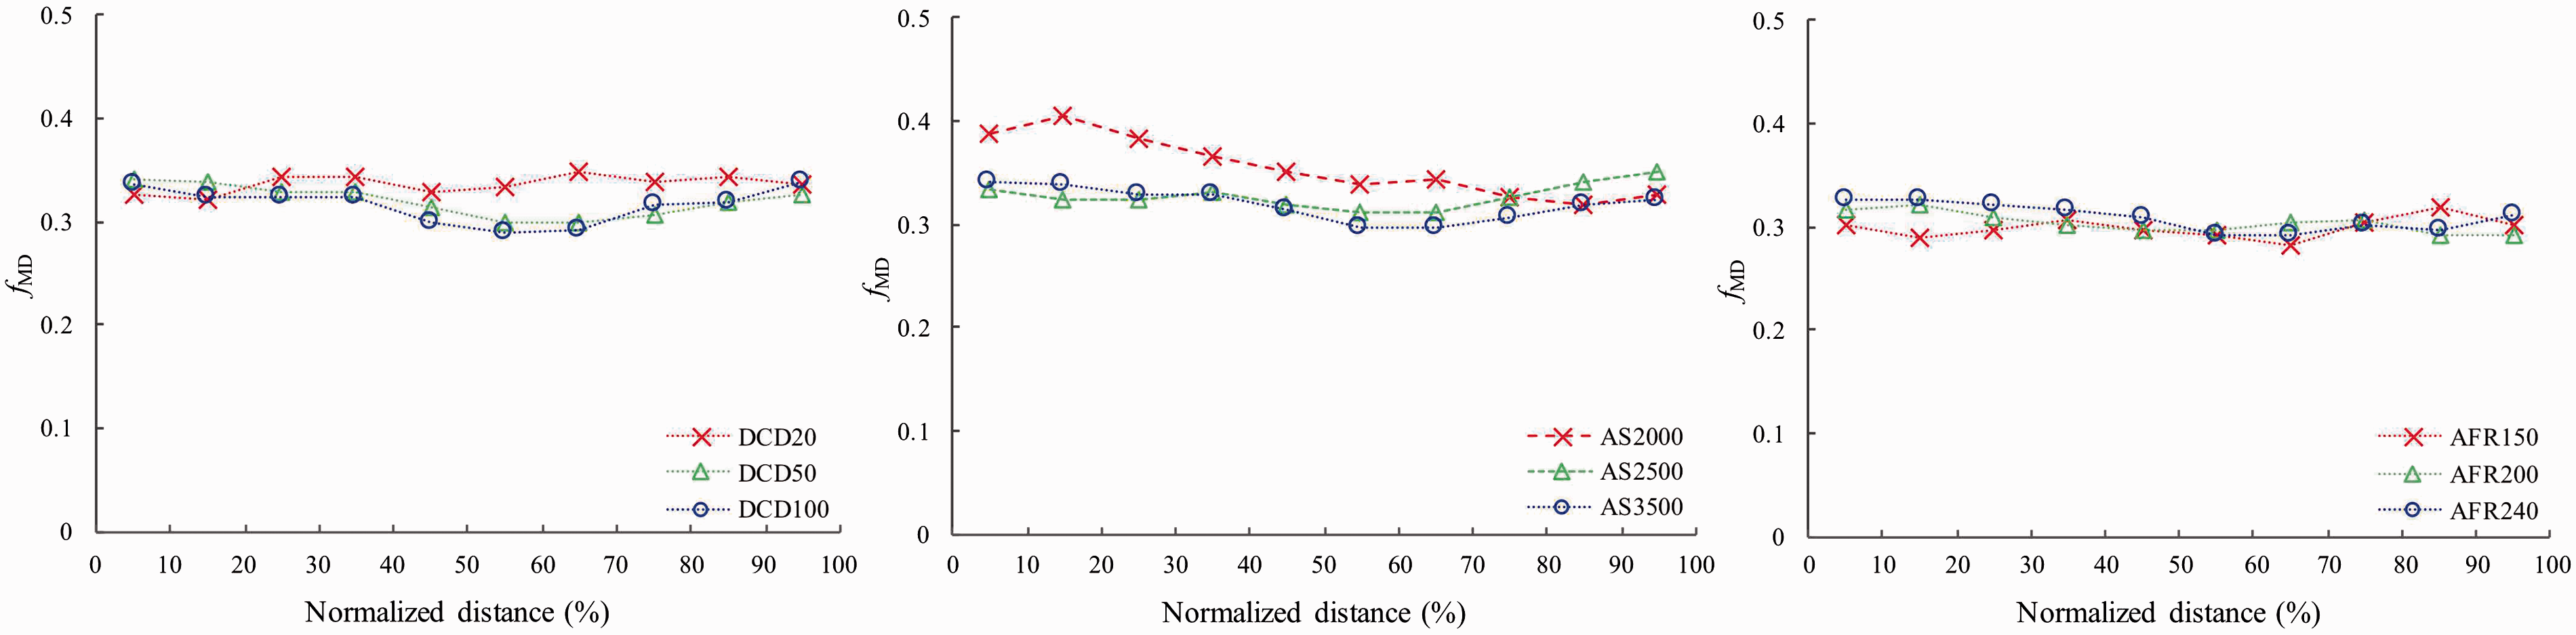
The Herman’s orientation factor (fMD) of the samples was obtained using equation (4)
44
from the angular profiles of integrated power spectra to evaluate the in-plane fiber orientation, as shown in Figure 11.
Herman’s orientation factor (fMD) obtained from the angular profiles of integrated power spectra as a function of normalized distance for each sample.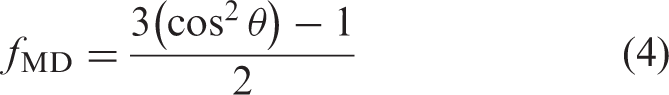
Here, fMD values of 1 and −0.5 correspond to perfect orientation along the MD and CD, respectively. The MD orientation for the core regions of DCD50 and DCD100 was a little lower than that of the edge regions. The lower MD orientation in the core region can be explained by fiber whipping, as illustrated in Figure 12. Previous research has revealed that fiber whipping has a larger amplitude in the MD than in the CD, and that the crossover frequency across the CD is much larger than that across the MD.3,5 The former and latter effects induce the MD and CD orientations of fibers, respectively. As shown in the top view of the fiber lay-down pattern in Figure 12(b), a fiber that travels far from the nozzle axis may increase the MD orientation of the edge region, whereas a randomly whipped fiber in the vicinity of the nozzle axis may decrease the MD orientation of the core region. Larger MD orientation was observed for the collector side of AS2000 than that for the other AS samples. This result can be explained by the increased fiber travel distance of whipped fibers to the upstream direction of the collector;
8
that is, weak AS may allow the fibers to orient more along the MD before their lay-down. However, orientation variation along the thickness direction was not clearly observed in this study. The orientation estimation using the power spectra may be insufficient to analyze the thickness variation of the lay-down pattern. If the fibers can be separated individually
33
by the improvement of XCT resolution, fiber orientation can be analyzed more accurately.
(a) Cross-machine direction view and (b) top view of the fiber lay-down model proposed for the melt-blowing process. The fibers were laid down with both machine direction and cross-machine direction whipping. The machine direction whipped fibers tend to be laid on the edge regions whereas the randomly whipped fibers tend to be laid on the core region.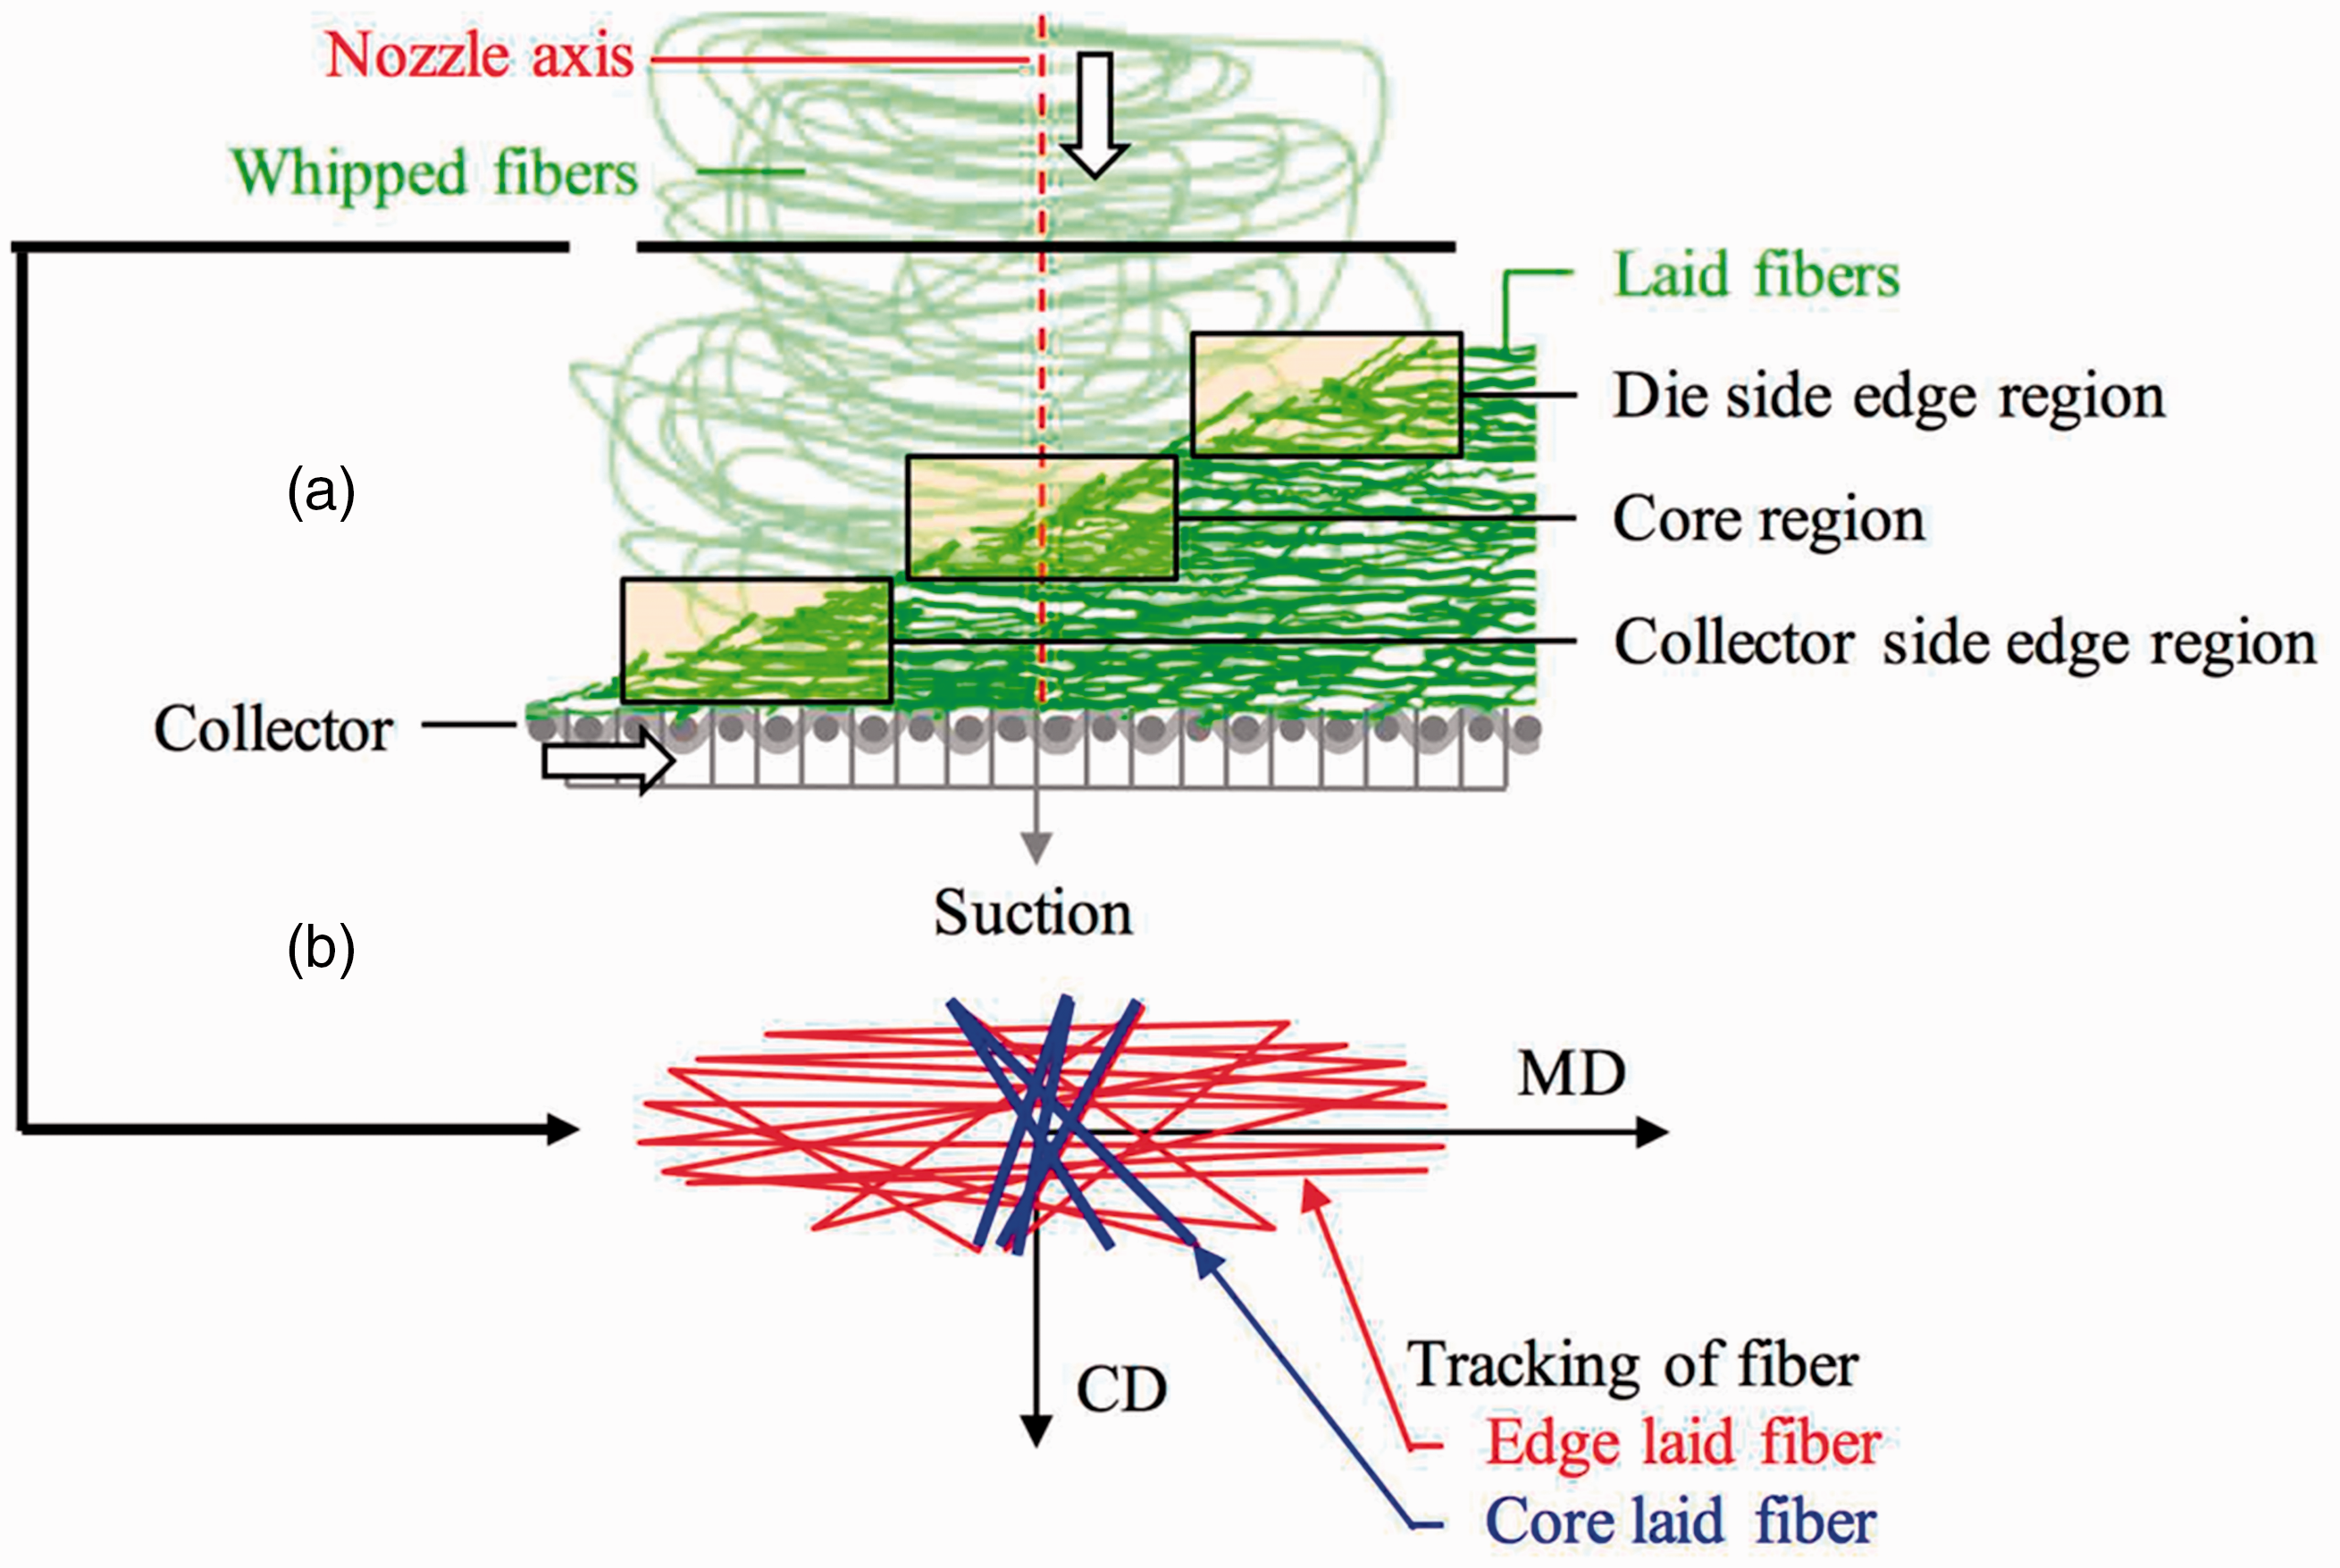
Conclusion
The structural profile along the thickness direction of melt-blown nonwoven fabrics was analyzed by XCT with a resolution of 1 µm/voxel. The effects of the DCD, AS and AFR on the fiber volume fraction profile and in-plane orientation of fabric samples was investigated. The obtained results are summarized below.
The averages of fiber diameter and basis weight obtained through XCT were almost identical to the results of SEM measurements and ISO standard tests; Insufficient AS increased the deviation of basis weight on the scale of 1 mm2; The steep change of fiber volume fraction observed around the surface of the fabric was attributed to the surface roughness on the 1-mm2 scale; Insufficient DCD increased the fiber diameter and surface roughness, and decreased the fabric thickness on the 1-mm2 scale; The fiber volume fraction gradually decreased from the collector side to the die side for the fabrics with sufficient DCD; The fibers oriented along the MD rather than the CD for all layers and samples, and the orientation profiles corresponded to the ZST.
Footnotes
Declaration of conflicting interests
The authors declared no potential conflicts of interest with respect to the research, authorship and/or publication of this article.
Funding
The authors received no financial support for the research, authorship and/or publication of this article.