
Abstract
The problem of the transmission mechanism of textile perception and the barrier to express textile cognition directly are the two major issues in the field of textile evaluation. In this study, an advanced biomedical imaging technology, functional magnetic resonance imaging, which is non-invasive and has a high temporal resolution and spatial resolution, was utilized to describe the features of brain perception in the brain mask areas under increased fabric contact pressures, and thus it was attempted to provide a new approach to express fabric comfort perception. As a result, we found that when fabric contact pressure increased from 0.5 to 1.5 kPa, both maximum activation intensity T Z and activation proportion K of the peak points were transferred from the postcentral gyrus in the SI to the amygdala, and were negative activations. Therefore, we drew the conclusion that both a lower and a higher fabric contact pressure (about 1 kPa of proper comfort fabric pressure) would produce a brain signal inhibitory effect on the SI and amygdala. The difference was the fact that the inhibition role on the SI was more obvious under a lower pressure, while the inhibition role on the amygdala was more remarkable under a higher pressure, which meant that the SI, particularly the postcentral gyrus in the SI, was likely to play a significant role in surface tactile perception of fabrics, while the amygdala might be related to the fabric oppressing sensation.
In this era of too much emphasis on industrialization, the textile comfort perception problem is a major issue that has always been ignored by the textile industry; the fabric comfort issue of the contact pressure is not only one of the most basic problems of the transmission mechanism of fabric comfort perception and a non-indirect representational problem in the textile evaluation area, but also a significant problem that should not be ignored in the actual application process of many industrial textiles, such as various functional textiles, protective textiles, and especially for biomedical textiles, which are utilized in the human body and body-shaped textiles with a high elasticity and high fabric pressure, and so on. However, various traditional evaluation methods of fabric comfort are limited to the textiles themselves, but ignore this important fact: the main body of comfortable expression is humans themselves, not fabric. Therefore, the best method to obtain a standard expression fitting for all groups is to start with the origin of perception, the brain.
Since the beginning of the 20th century, thousands of textile scholars have been trying to make full use of various psychological evaluation methods1–4 (also named subjective evaluation methods); physical evaluation methods, 5 which combine fabric tactile perception with textile pressure; psychophysical evaluation methods 6 by connecting psychological touch sensations with the physical mechanical properties of textiles; and physiological evaluation methods, 7 such as the EEG (Electroencephalogram),8–12 ERP (Event Related Potential),13,14 HRV (Heart Rate Variability), 15 ECG (Electrocardiogram), 16 EMG (Electromyography),17,18 etc. These four mainstream evaluation systems quantitatively describe the contact pressure comfort from the fabric.
In the past few decades, for the sake of simplicity and convenience, utilized the most original subjective evaluation on the wearing comfort of some new textiles has been utilized, such as smart clothing
3
and functional textiles.
1
What is more objective is to use the psychophysical evaluation method; thus, a series of mechanical measurement systems based on various measuring instrument for physical and mechanical properties of textiles, such as KES-FB (Kawabata Evaluation System - Fabric) test methods, were developed to objectively characterize the tactile properties of miscellaneous textiles, even porous polymeric materials, by simulating the dynamic contact processes during human skin contact with the materials and in consideration of different aspects of tactile sensations.
19
These measurement systems could measure the compression, bending, friction, and thermal transfer properties in one apparatus, such as the Fabric Touch Tester (FTT),
20
based on 13 fabric indices including bending performance, surface friction, surface roughness, compression, and thermal conductivity, five aspects that were exploited to measure fabric handle properties. However, all of them ignored the essence of fabric comfort perception, which is the human body itself; therefore, physiological evaluation methods have emerged at the right moment. What we needed to do was to explore and capture the most authentic fabric sensory origins accurately and quickly with advanced physiological instruments. No matter whether EEG, HRV, or ERP, all of them were trying to do that. However, in this topic, we set foot in a more advanced field of science and technology, which was fMRI (functional magnetic resonance imaging), due to its higher spatial resolution than EEG and ERP
21
and superior mechanism of the origin of fabric perception itself. Moreover, some of the subtle sensory information, such as light pressure to the forearm, which ERP could not capture, could also be picked up with fMRI.
22
Thereby, an exploration extremely close to the origin of fabric perception had begun.
In recent years, more and more research23–26 about human perception of fabric texture contact has proved that the brain areas associated with the perception of fabric contact are mainly located in the somatosensory cortex (including the primary somatosensory cortex SI and the secondary somatosensory cortex SII) and the insular cortex. In particular, a happy comfortable fabric contact perception was likely in the brain's high-level process area of SII, while an uncomfortable perception might be in the frontal lobe. Moreover, compared with comfort perception, uncomfortable perception was stronger. Another study 27 indicated that the Rolandic operculum in the SII was closely related to fabric surface texture perception, such as roughness. However, the present findings are consistent with the hypothesis that activation points at hairless skin stimulated by fabric occur more in the somatosensory area, especially in the SI, which is associated with the primary rough touch perception of the human body itself. A pleasant touch from glabrous skin, mediated by A-beta afferents, was processed in the somatosensory cortex and represented an analytical process dependent on previous tactile experiences. However, activation points, when fabric stimulation was applied to hairy skin, occurred more in the insula cortex, which was connected to human emotion processing.28,29 A pleasant touch from hairy skin, mediated by C-tactile afferents (also named CT afferents), was processed in the limbic-related cortex (including the orbitofrontal cortex and posterior insula) and represented an innate non-learned process.30,31 Moreover, studies have shown that rational perceptions were associated with contralateral cortex activation areas, while emotional imagination and emotion were associated with the ipsilateral cortex. 32 Moreover, the precuneus region, which is positively be related to happiness, 33 should also be considered in this subject because it might also be associated with a good sense stimulated by contact with textiles, such as a comfortable tactile impression. As for the human uncomfortable sensory, the largest research results showed that activation response appeared in the bilateral amygdala when human skin was accepting fabric contact pain stimulations.34,35
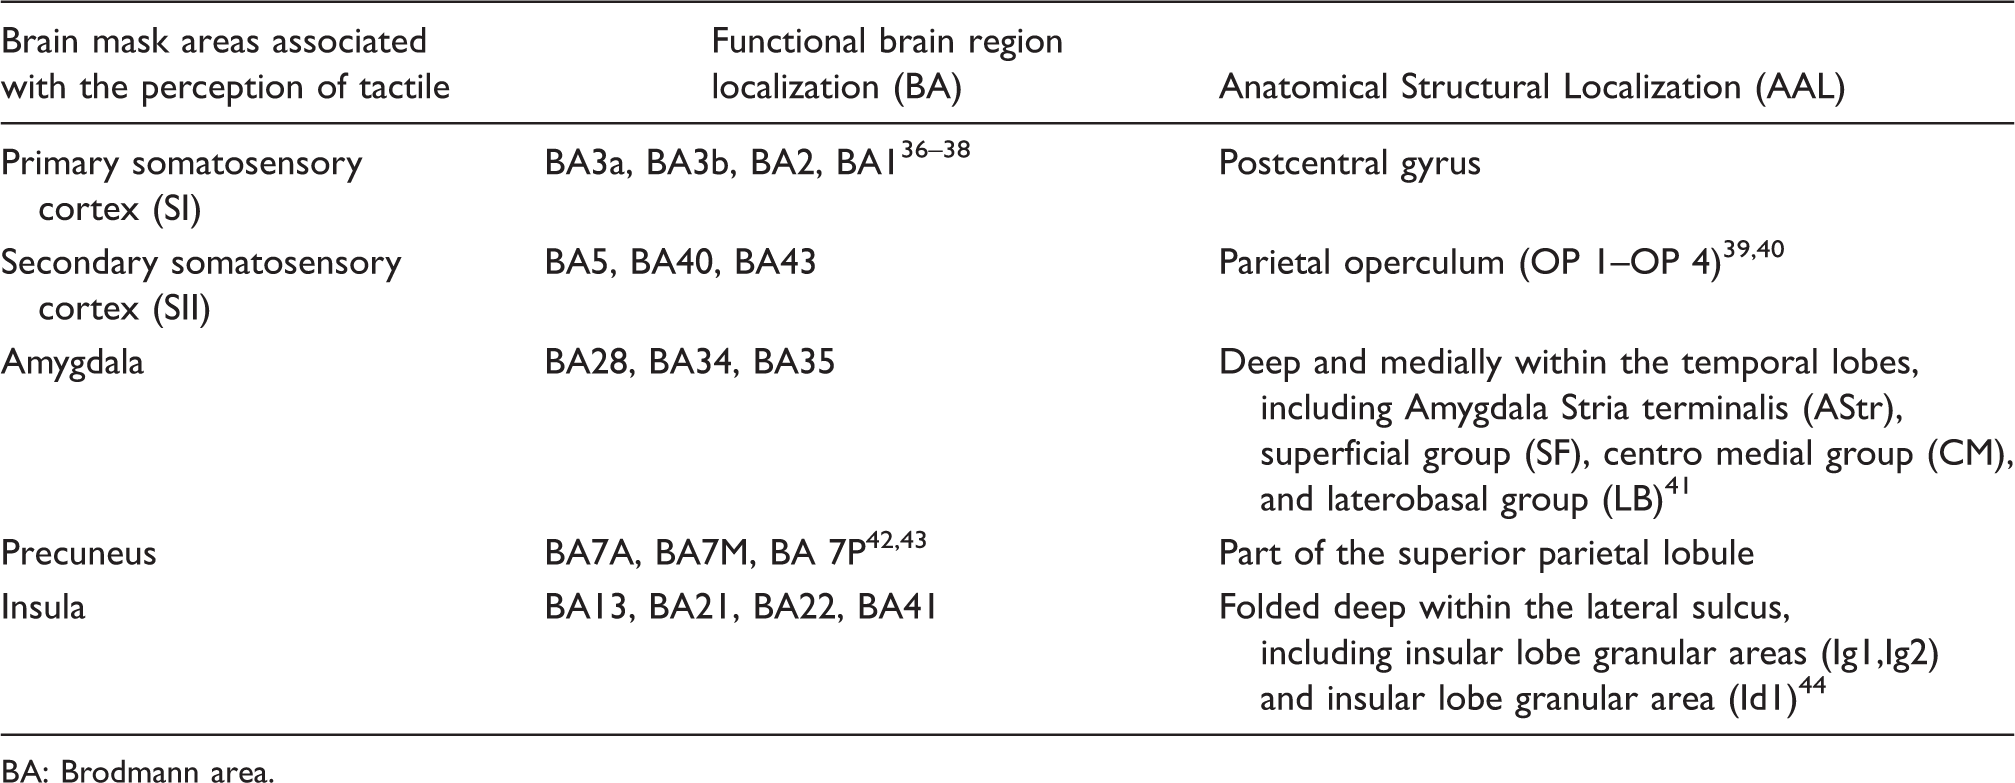
Therefore, in order to avoid interferences from external factors, such as all types of noises and the psychological effects on the brain analysis of perception, the five brain regions mentioned above, namely the SI, SII, amygdala, precuneus, and insula, which were considered to be possibly be related to the perception of fabric touch pressure, were ultimately selected as a brain mask, and we only analyzed the brain mask areas. Functional brain regions in the Brodmann areas (BAs) and anatomical structural brain regions in Anatomical Automatic Labeling (AAL) corresponding to each brain mask region are shown in Figure 1 and Table 1.
Brain mask areas. Locations in functional brain regions and anatomical brain regions corresponding to brain mask regions BA: Brodmann area.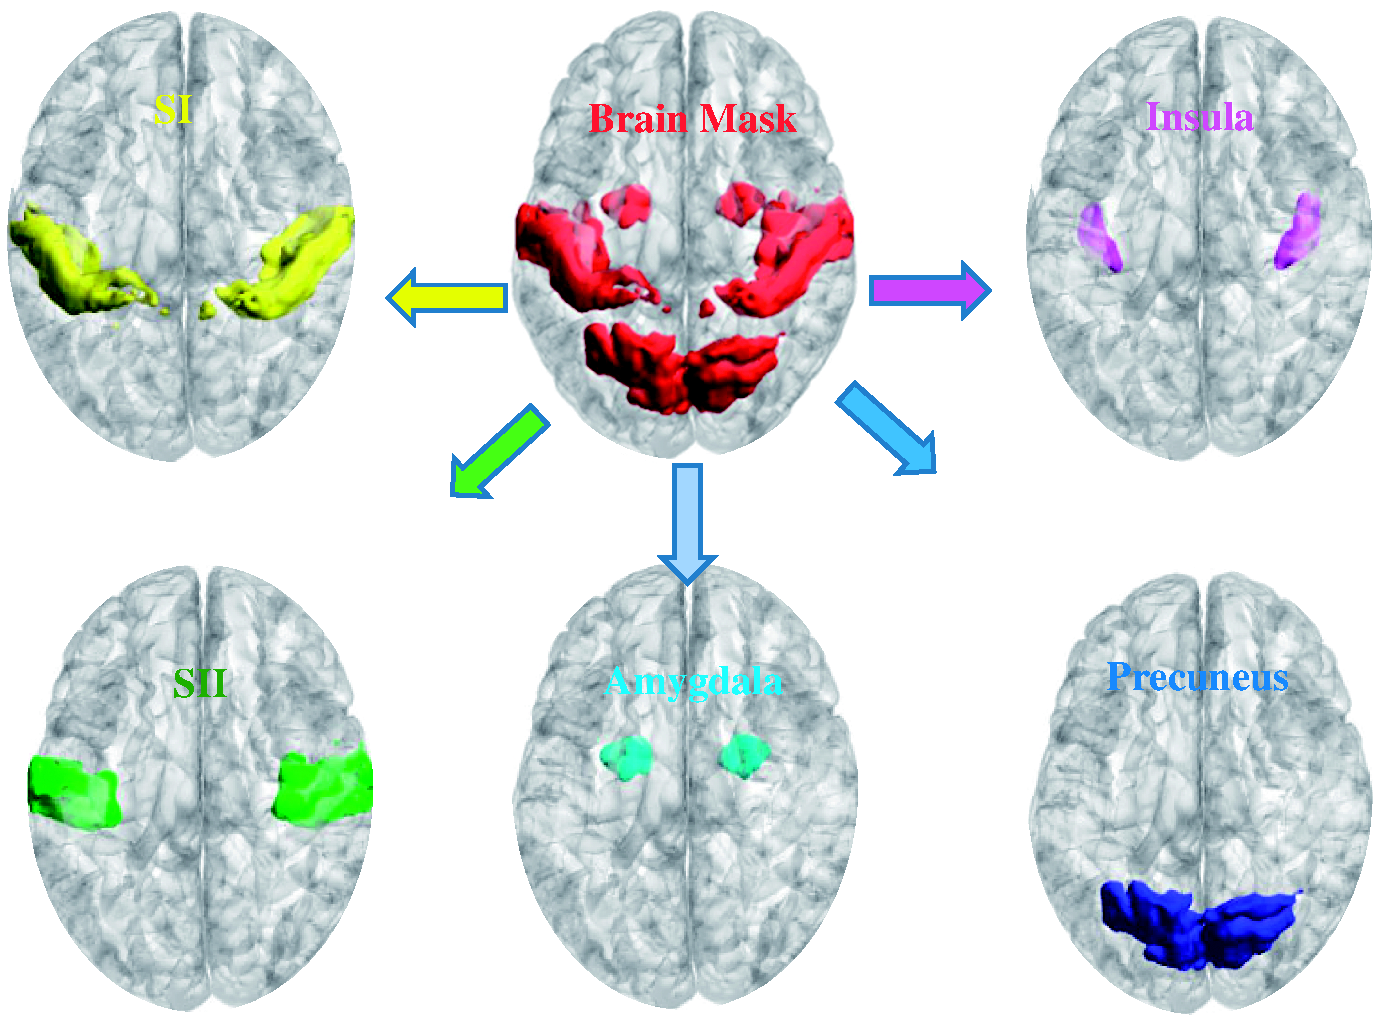
Materials and methods
Subjects
Six healthy female volunteers with similar age (mean = 25.3 ± 2yrs old, SD = 1.75) and BMI (mean = 20.6 ± 2 kg/m2, SD = 1.29) were recruited. They were subject to inquiry and examination to ensure they had no mental illness, neurological diseases, psychiatric history, or injury of brain tissue structure, with normal neural responses and conduction system, and that each part of the body had no metal implants, they were not pregnant, had no space phobia, and were without heart disease, epilepsy, restlessness, renal insufficiency, or any other psychological and physiological diseases. They were asked not taking any medication, and keep a normal sleep pattern and diet for the first three days. Moreover, due many cosmetics containing heavy metals, before fMRI experiments, all subjects were not allowed to wear make up, and all jewelry, tattoos (eyebrow tattoos), hair dye, etc., which might cause burns, were removed in advance.
Before the experiment, the subjects were aware of the principle of fMRI and the possible physiological reactions during the scanning process; the test could be terminated at any time if the subjects raised a leg to signal any physical discomfort. Furthermore, they were informed simply about the scanning procedure and signed an informed consent. The study was approved by the ethics committee of Donghua University.
Materials and instruments
One widely used corset on the market was selected as the experimental sample, whose effective area was 24.5 cm × 50 cm with widths of the hook face and loop face of 2.5 and 10 cm, respectively.
The clothing pressure test was conducted using an AMI3037 Air-pack Type Contact Pressure Measurement System, which ranged from 0 to 34 kPa, with output voltage 0–3.4 V, accuracy ± 0.2–0.45 kPa, manufactured by AMI TECHNO Co., Ltd in 2006.
fMRI experiments were conducted in collaboration with Ruijin Hospital of Shanghai Jiaotong University. Neuroimaging data was obtained from Ingenia 3.0T medical fMRI equipment manufactured by Philips Investment Co., Ltd, provided and supported by Ruijin Hospital. After locating the scanning position, three-dimensional (3D) scrambling GRE T1WI sequence structure image scanning was used to determine the high-resolution lateral anatomical structure diagram of each subject's entire brain from left to right, so as to prepare the individual brain to be standardized into standard space in subsequent data preprocessing.
The scanning parameters of structural images were the scanning interval TR (Inter-scan Interval) = 3 s, which referred to the time interval between acquiring a plane of one volume and the same plane in the next volume, TE (Time of Echo) = 30 s, double Angle of FA (Flip Angle) = 8°, View FOV (Field of View) = 256 mm × 256 mm, the gathering matrix of every level was 256 mm × 227 mm, the layer thickness was 3 mm, there was no interval between layers, there were 180 layers in total, and the total scanning time was 300 s.
The scanning parameters of the functional images were, using gradient echo and single excitation echo planar imaging technology, TR = 3 s, TE = 30 s, FA = 90°, FOV = 192 mm × 192 mm, the gathering matrix of every level was 96 mm × 96 mm, 3 mm with a thick layer of no layer interval, a total of 47 sagittal slices, and the slicing direction was horizontal. The pre-scanning time was 9 s, the actual scanning time of each sequence was 189 s, and the time for data analysis was 180 s.
Fabric contact pressure testing
Fabric contact pressure testing was performed in the constant temperature and humidity laboratory at Donghua University. Environmental temperature and humidity were about ±20℃ and ±65% relative humidity (RH), respectively. Each subject was tested after being in the laboratory 30 min to ensure that they had adapted to the temperature and humidity. As a result of the pressure of the sample being mainly distributed in the chest, waist, and abdomen, and according to the garment pressure comfort threshold tested and calculated on the lateral abdomen, middle shoulder, scapula, armpit, where the waistline and scapular line cross, abdomen, lateral empire line, and the anterior center of the waistline and underbust using nine measuring points by the psychophysical limit-step method, the underbust of 0.937 kPa tended to be the minimal value of the comfort threshold. 45 Cardiac indicators such as heart rate and HRV could be used as evaluation indicators of fabric comfort.46–48 Finally, the left liver point near the heart, which was located in underbust, was selected as the characteristic measurement point to measure the clothing pressure. Considering that the comfort pressure of the fabric at that point was about 1 kPa, we chose the pressure values of 0.5 and 1.5 kPa as the measurements. The experimenter marked each subject's body with the measurement point, then pasted pressure sensor film on the point; the participants were asked to put on each sample in turn and remain still in natural relaxation, and the pressures were measured by adjusting the length of the magic tape. Each pressure test lasted 1 min and the pressures were averaged.
fMRI experiments
A block design 49 experiment was adopted. The same three blocks were used in each time course sequence; for the former 30 s in one block, the subject was in a resting state and had no any fabric pressure applied, while in the latter 30 s in each block, clothing pressure was conducted. The block was repeated three times and the brain data was averaged for further analysis. fMRI experiments proceeded with fabric pressures of 0.5 and 1.5 kPa, respectively.
Before entering the scanning room, the subjects were required to wear loose-fitting clothes without metals, magnets, or significant wearing pressure. During the whole procedure of the experiment, the subjects closed their eyes and remained awake. They were required to concentrate on the experiment and not to think of other things that were not related to the stimulation of fabric pressure.
Results and discussion
After a series of brain imaging preprocessing operations, individual analysis and group analysis using SPM1250 (Statistical Parametric Mapping 12), two indicators were of significance in the results: activation intensity T Z and activation proportion K (%), which could represent the perception of stimulation of fabric quantitatively. 24 T Z was a ß value generated by the GLM (general linear model) in SPM12 that had no units, so we could use T Z to made comparisons between groups. Its actual meaning represented the difference between the average BOLD (Blood Oxygenation Level Dependent) signal in the pressure block and the rest block. The higher the absolute value of T Z was, the stronger the relative activation signal was. Positive T Z values represented positive activations, which indicated that fabric touch pressure increased the cerebral blood flow and neural activity in the local brain region. In other words, when the fabric stimulus was applied, oxygen uptake was far less than the increase in blood flow, which caused the concentration of paramagnetic deoxyhemoglobin to be reduced. On the contrary, negative T Z values represent negative activations. K referred to the number of activated voxels in this brain area, accounting for the proportion of activated voxels in the entire mask brain areas. The larger the K value, the greater the range of activated voxels in the brain region.
In the results, we conducted the most rigorous FWE (Family Wise Error) correction on the results of group analysis to ensure the probability of any false positive was within 5% by combining the results with the research practice of spatial perception information of the healthy human brain based on fMRI51,52 and research cases of contact thermal pain stimulation.
53
Moreover, as this subject was an exploratory study, in the case of low error rate, all activated brain areas also should be included as far as possible, so we finally put the threshold of the activated brain area cluster as zero, such that even a single activation point would also be shown in the results. Data with no stimulus activation point and data with significant artifacts were discarded in the analysis.
54
Eventually, positive activation maps under fabric contact pressure of 0.5kpa and 1.5kpa calculated and expressed by SPM12, AAL (Anatomical Automatic Labeling), Xjview and other brain imaging analysis software were shown in Table 3, Figure 2 and Figure 3.
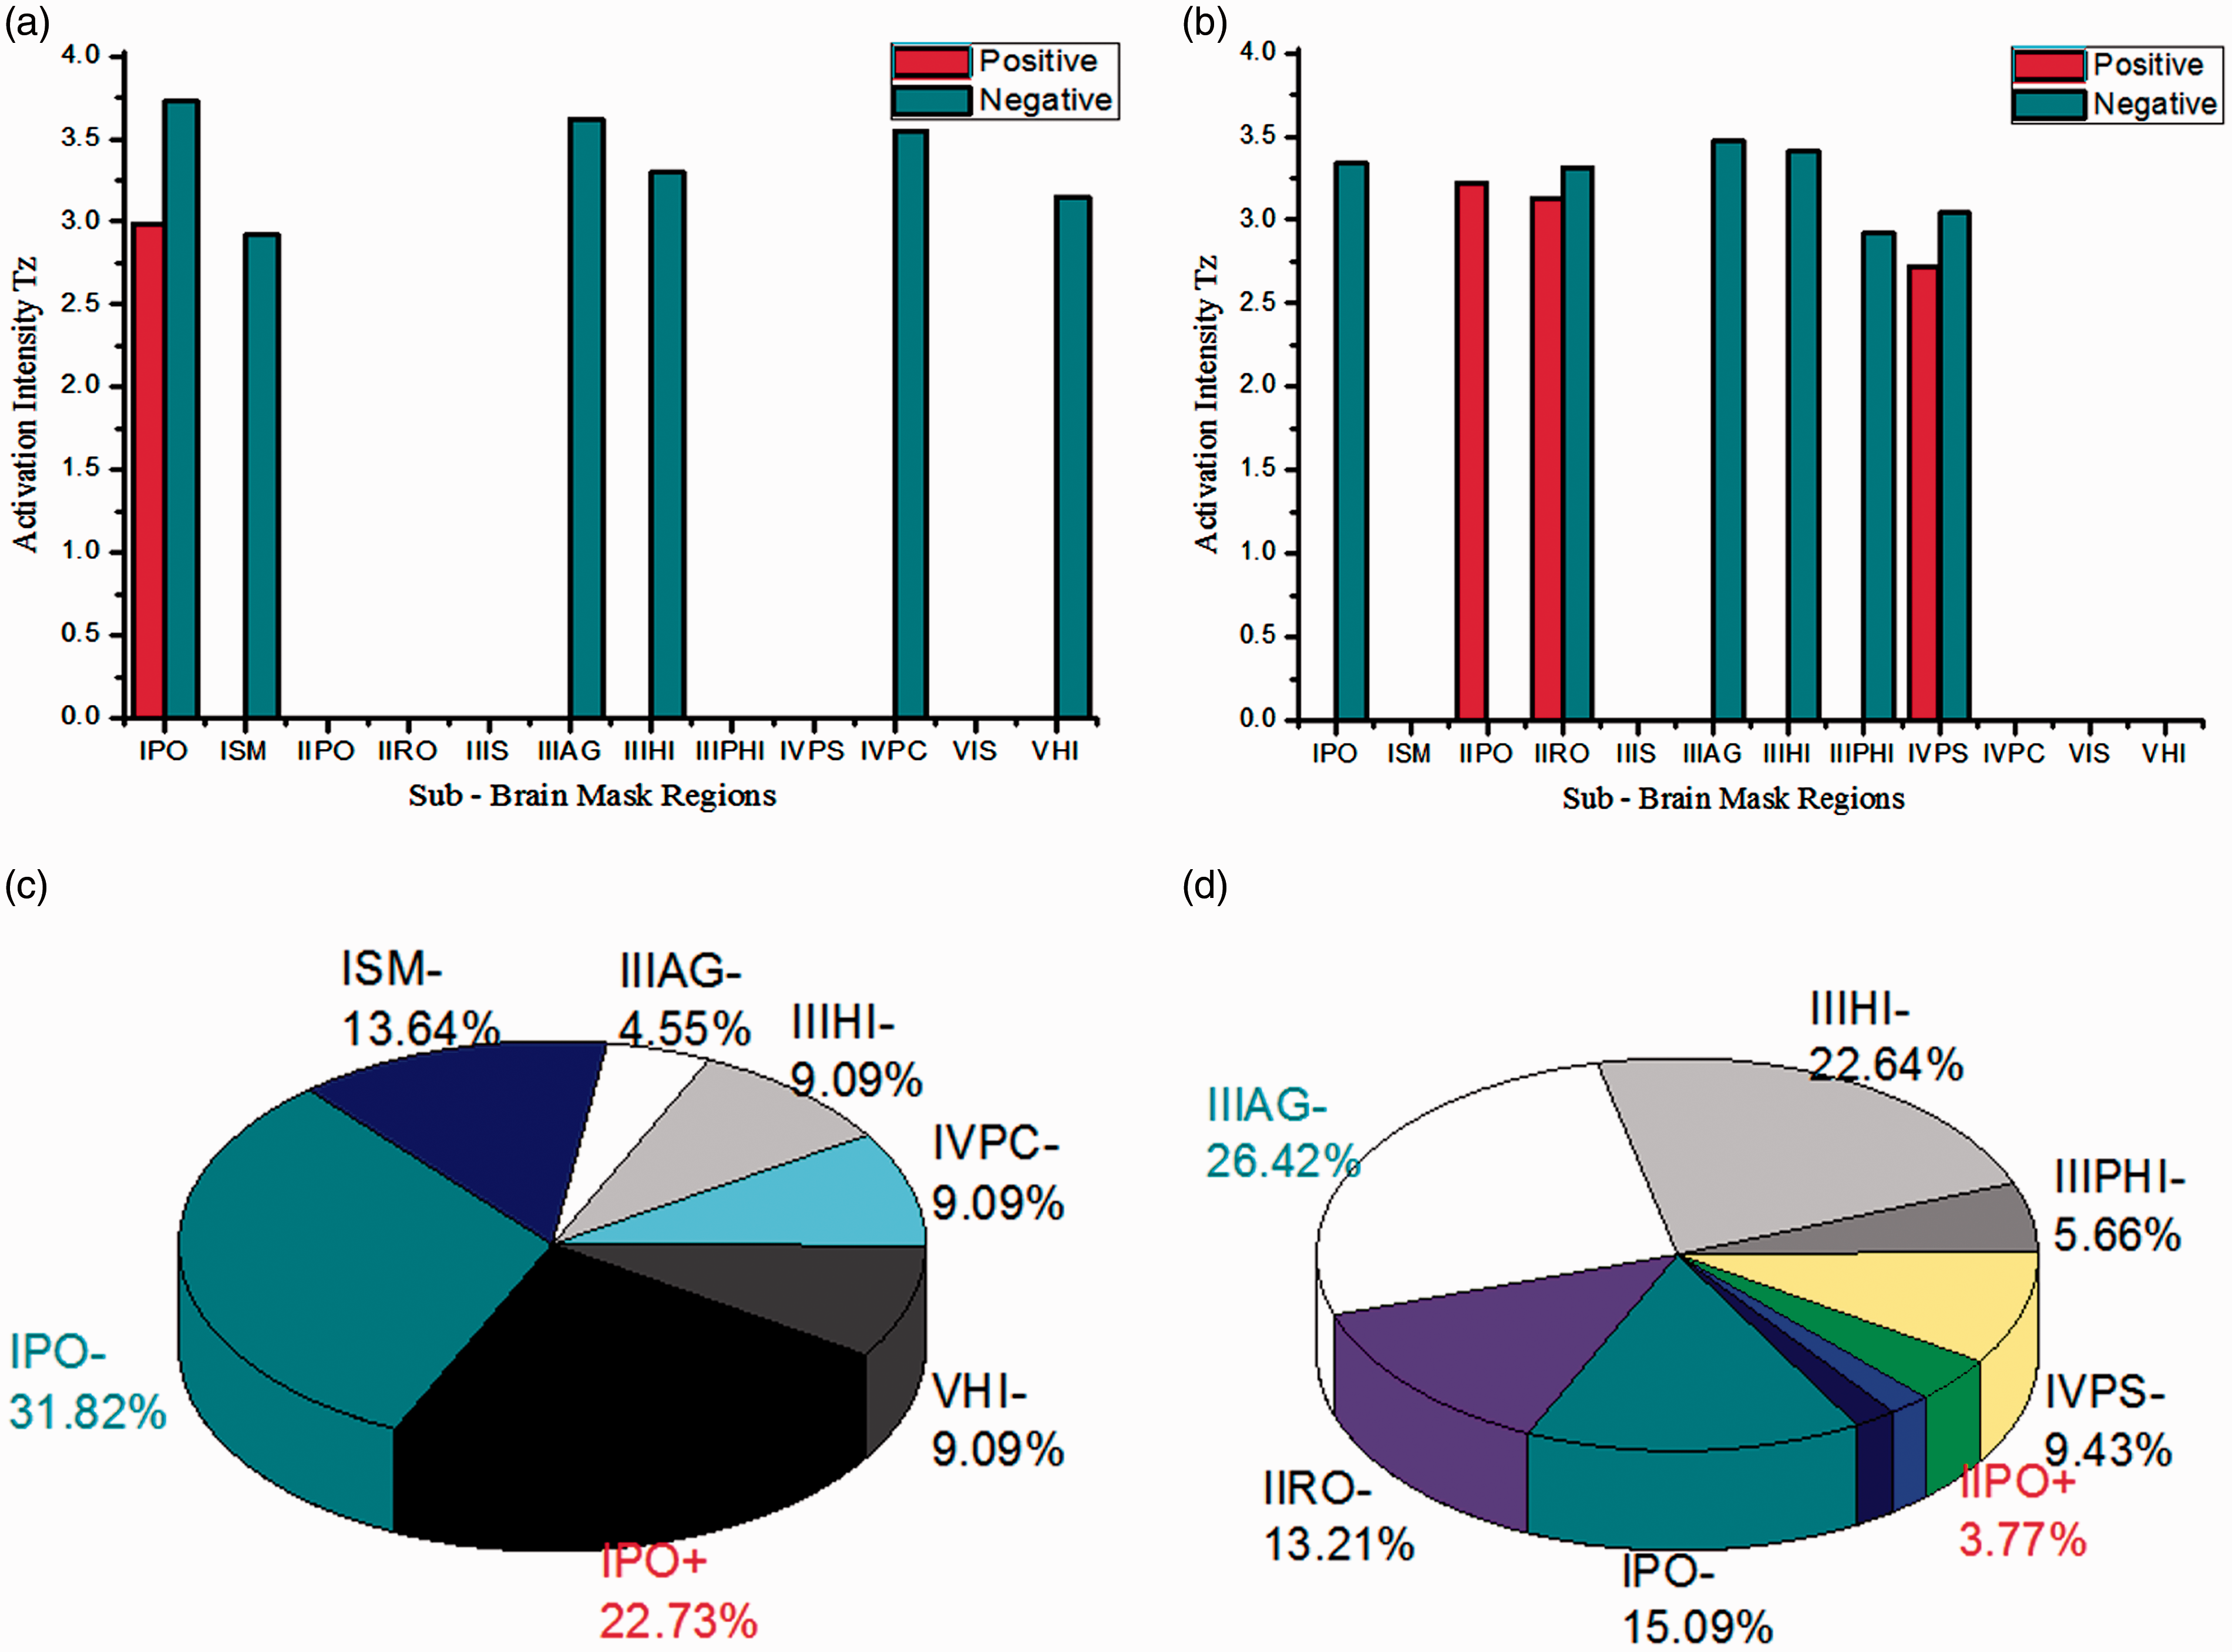
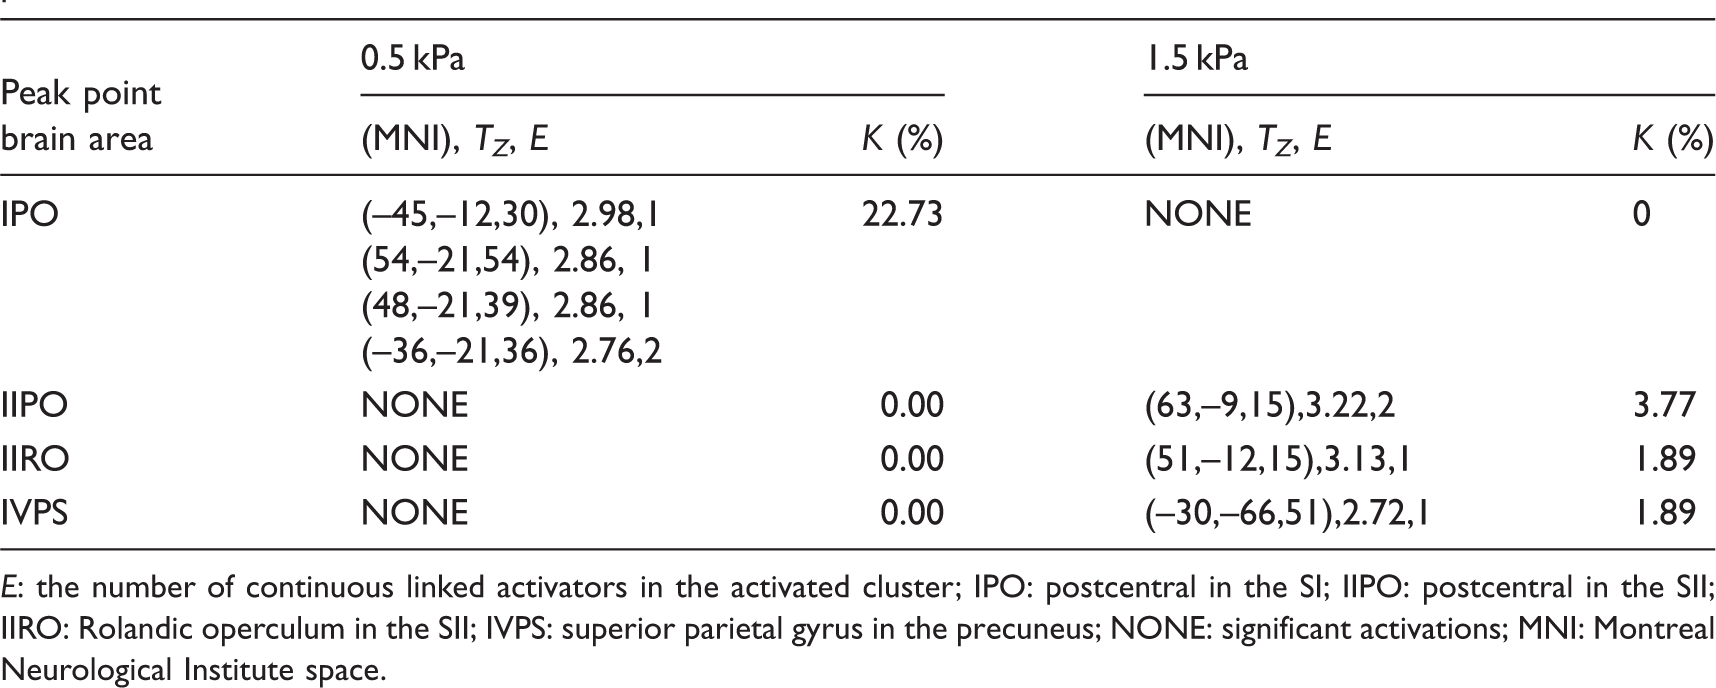
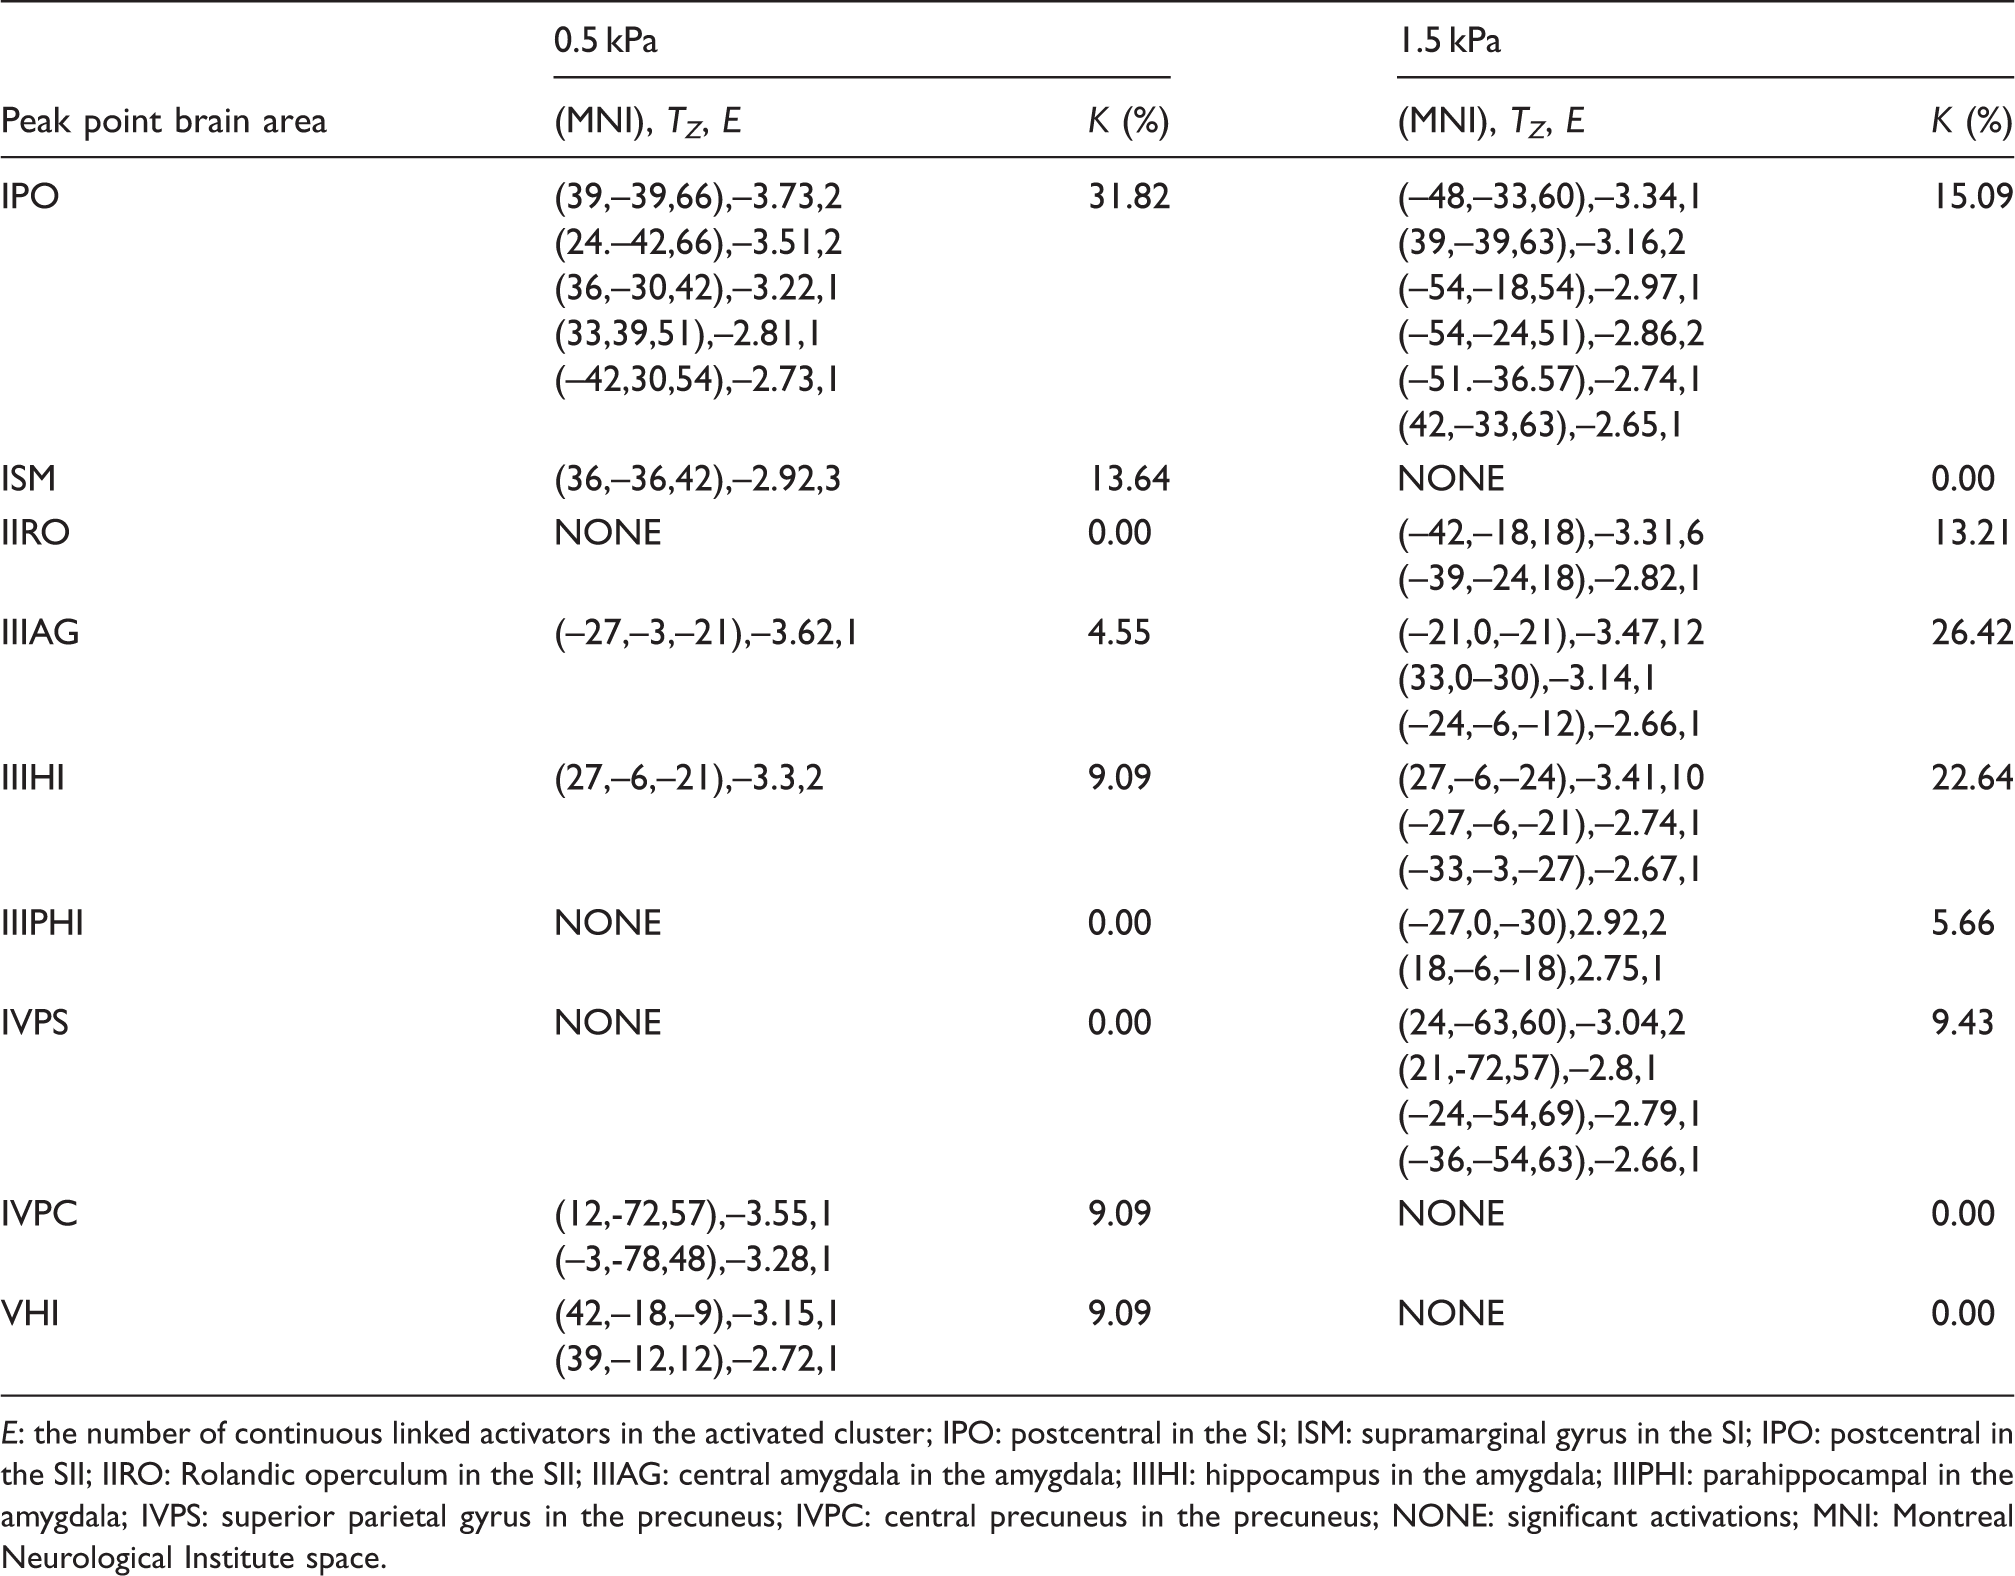
Positive activation maps under fabric contact pressures of 0.5 kPa (a) and 1.5 kPa (b). Negative activation maps under fabric contact pressures of 0.5 kPa (c) and 1.5 kPa (d). (The colored slices were in the mask, the slices in black and white correspond to color slices; color online only.) Histogram of activation intensity under fabric contact pressures of 0.5 kPa (a) and 1.5 kPa (b). Pie chart of activation proportion under fabric contact pressures of 0.5 kPa (c) and 1.5 kPa (d). (The blue font indicates the maximum negative activation, while the red font indicates the maximum positive activation; color online only.) Positive activation information table in the brain mask regions under the stimulations of fabric contact pressures of 0.5 and 1.5 kPa E: the number of continuous linked activators in the activated cluster; IPO: postcentral in the SI; IIPO: postcentral in the SII; IIRO: Rolandic operculum in the SII; IVPS: superior parietal gyrus in the precuneus; NONE: significant activations; MNI: Montreal Neurological Institute space. Negative activation information table in the brain mask regions under the stimulations of fabric contact pressures of 0.5 and 1.5 kPa E: the number of continuous linked activators in the activated cluster; IPO: postcentral in the SI; ISM: supramarginal gyrus in the SI; IPO: postcentral in the SII; IIRO: Rolandic operculum in the SII; IIIAG: central amygdala in the amygdala; IIIHI: hippocampus in the amygdala; IIIPHI: parahippocampal in the amygdala; IVPS: superior parietal gyrus in the precuneus; IVPC: central precuneus in the precuneus; NONE: significant activations; MNI: Montreal Neurological Institute space.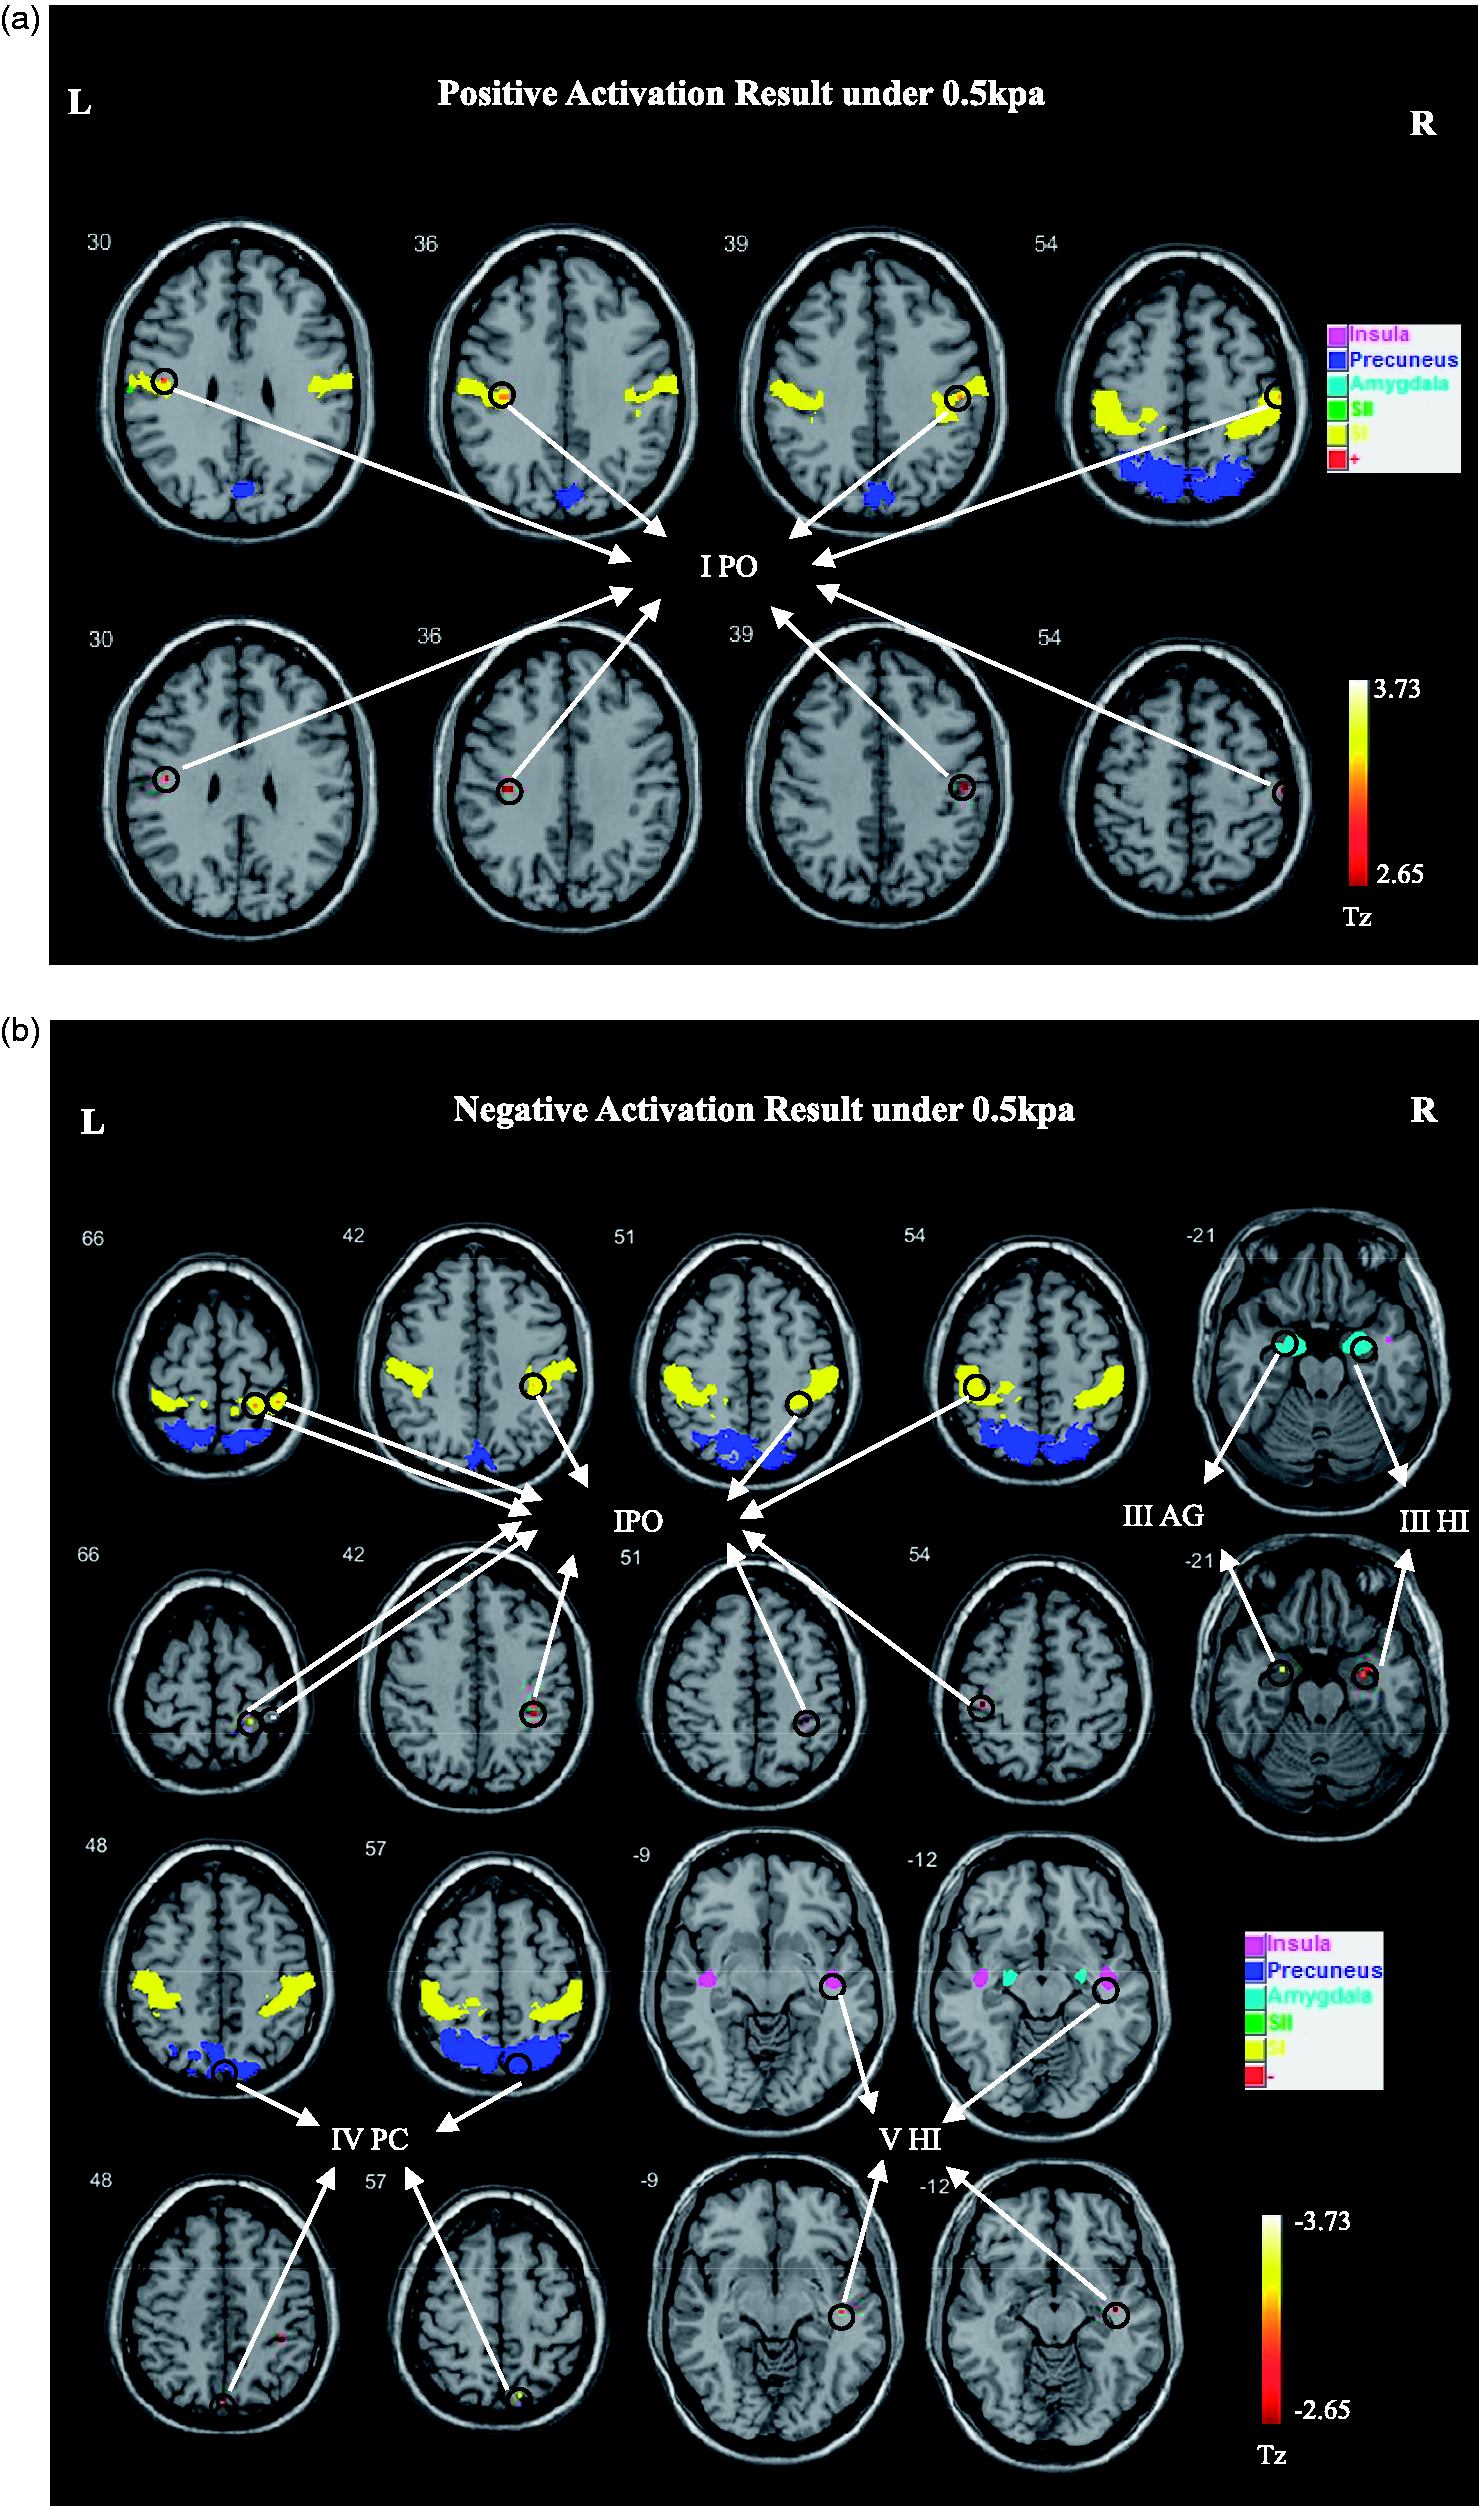
Activation results under fabric pressure of 0.5 kPa
As can be seen from activation results of the brain mask areas (SI, SII, amygdala, precuneus, and insula) under the action of 0.5 kPa fabric pressure, as shown in Figures 2(a), 2(b), 3(a), and 3(b) and Tables 2 and 3, compared with the maximum negative activation peak point intensity T Z (–3.73) and the maximum negative activation proportion (31.82%) located in the IPO (in the SI), the small number of positive activations in the IPO (T Z = 2.98, K = 22.73%) were almost negligible. That was, under the surface texture sensory contact with low pressure, the SI brain area was significantly activated, and the degree of negative activation (including T Z and K) was more significant than that of positive activation.
Activation results under fabric pressure of 1.5 kPa
As can be seen from Figures 2(c), 2(d), 3(c), and 3(d) Tables 2 and 3, when the fabric contact pressure increased to 1.5 kPa, very few positive activations were found, but large areas of negative activation were found in the amygdala, SI, SII, and precuneus, and the intensity and proportion of negative activation decreased successively. Both the maximum negative activation intensity peak point (T Z = –3.47) and the maximum proportion of negative activation (K = 26.42%) were located in the IIIAG (in the amygdala), while for the IIPO the maximum positive activation intensity was 3.22 and the maximum positive activation proportion was just 3.77%.
Comparison of activation results between fabric contact pressures of 0.5 and 1.5 kPa
From the perspective of T Z and K, under the effect of 0.5 kPa fabric stimulation, the maximum negative T Z was –3.73 and the maximum negative K was 31.82%, while under the effect of 1.5 kPa, the maximum negative T Z and K decreased to –3.47 and 26.42%, respectively. That is, compared with 0.5 kPa, under pressure stimulation of 1.5 kPa, both of the maximum activation points were negative, while the difference was that the maximum activation degree was reduced.
According to the activation location, the brain area where the maximum negative activation intensity was located transferred from the IPO to the brain area of the amygdala. That is, when the pressure increased, the negative activation in the SI area went down, while the maximum negative activation was obtained in the amygdala area.
Discussion
Under the effect of 0.5 kPa fabric stimulation, why was the maximum activation point located in the SI region?
In the early 1990s, many researches proved that in contact with electrical stimulation55–57 and thermal pain stimulation,58–60 the SI would appear to have different degrees of meaningful activation responses, and with the increase of repetitions, the SI brain regions activated will gradually weaken. The first time inhibitory effects of noxious stimuli in SI activity were identified was in a monkey's brain. Later, Apkarian et al. 59 showed that blood flow in the human SI also decreases when human skin is stimulated by heat, because the presence of pain reduced tactile perception. However, another explanation was the inhibition of SI tactile activity by noxious stimuli might happen at lower levels of the neuraxis rather than through a direct inhibitory influence at the level of the SI. The inhibition was related to the stimulation of the C fiber.60,61 Light touch-sensitive C fibers (also known as c-low-threshold mechanosensitive nerves) were first discovered in rodents in 1939 by Zotterman, 62 a third class of C fiber afferents that code for the pleasurable properties of touch – CT afferents or CTs. CTs only exist in human hairy skin,30,63 and play a critical role in the tactile emotional response, especially for signals of pleasant aspects of gentle touch.64,65 If the C fibers were inhibited, it may represent a bad feeling or discomfort feeling. Garzon et al. 66 used fMRI to observe the influence of the tactile stimulus intensity in SI cortical responses, and it was also found that the SI cortical representation of a tactile stimulus with fMRI was modulated for the intensity of the stimulus applied. All of these researches acknowledged the somatotopic organization of SI pain responses, and the SI had a downward-modulating effect on tactile perception, described as a “touch gate” by Apkarian et al. 67 In this project, under the fabric pressure of 0.5 kPa, high levels of negative activation in the SI reflected that too mild a fabric contact pressure could also produce a discomfort feeling in the brain and this discomfort might well be caused by macrogeometric properties of the fabric surface, because functional brain regions involved in the macrogeometric properties of fabric (such as pliability) are located in the SI, and the perception of microgeometry of the fabric surface (such as roughness and glutinousness) is located in the SII. 68
Why did the maximum point transfer from the SI to amygdala when the pressure increased to 1.5 kPa?
From the viewpoint of the neural physiological mechanism, the transmission routes of nociceptive information and somatosensory information were different, serial information from the somatosensory were integrated automatically after transmitting from the somatosensory area SI to the posterior parietal cortex SII (posterior parietal cortical areas) and insula (insular cortex), again by the insula to the amygdala (including the amygdala, Perirhinal cortex, and hippocampus), 26 while nociceptive information in the SI and SII represented parallel processing, 69 but all of them ended at amygdala, so there was no doubt that the amygdala is a very important brain area in reactions to tactile perception. A large number of studies in molecular biology, imaging, and pharmacology have provided evidence for the involvement of the amygdala in pain perception. 70 In acupuncture stimulations,71,72 nonverbal sad auditory stimulations,73,74 terrible visual stimulations,75,76 contact thermal pain stimulations,34,35 and other pain sensory stimulations, the human amygdala all showed strong and extensive negative active regions. Many studies 77 have shown that for the brain areas involved in pain information processing, which included the contralateral SI, bilateral SII, bilateral insula, amygdala, etc., touch intensity ratings correlated significantly with the BOLD response in the right hemisphere (contralateral) SI, right insula, and bilateral SII, especially for the right SI, while ACC (anterior cingulate cortex) activity, which innervated mostly the basolateral and central amygdala nucleus, 78 was correlated with emotions. 79 Neugebauer and Li 80 believed that there were three types of neurons in the central amygdala that may be related to the emotional response of pain. The first type of neuron is the nociceptive specific neuron (NS), which is excitatory to injurious stimuli. The second category of neuron is the inhibited neuron (INH), which has an inhibition performance to noxious stimulation, while the third type of neuron is the low threshold neuron (LT), which responds to both harmful and non-harmful stimuli, but more strongly to harmful stimuli. In this study, the amygdala area was strongly inhibited under fabric pressure of 1.5 kPa, which might be related to the INH.
Why was there a significant increase in the negative activation range of the amygdala but a slight decrease in activation intensity as fabric pressure increased?
According to Tanimoto et al., 81 the central amygdala was directly connected to the spinal cord and brain stem through the spinal cord–(trigeminal)–brachial nucleus–amygdala pathway, which was involved in the transmission of visceral pain. Visceral sensory information could also be passed on to the nucleus of the lone bundle, which had a fibrous connection to the central amygdala. So, the central amygdala was quite possibly to responding to physical noxious stimulation. That is, neurons in the central amygdala might respond to damaging mechanical or thermal stimulation on the surface or deep tissue of the skin, and especially on the deep tissue, the response would be stronger. That was why the negative activation scope in the amygdala under 1.5 kPa was much larger than that under 0.5 kPa; the relatively slight decrease in activation intensity might just be because the excessive increase of activation areas caused the average activation intensity to decrease slightly. Meanwhile, the negative activation of the amygdala under 1.5 kPa also suggested that the amygdala was associated with the uncomfortable perception of the compression of the fabric on the deep skin tissue.
Why did the maximum negative activation under both kinds of pressure and the maximum negative activation intensity and negative activation ratio decrease with the increase of pressure?
The so-called negative activation referred the BOLD signal under pressure being smaller than that under the static state, 82 which was caused by the imbalance of oxygen supply and oxygen consumption. 83 Under the excessive fabric pressure, the local cerebral blood flow decreases and the rate of oxygen consumption was higher than the rate of oxygen supply, which would inevitably lead to the reduction of neural activity and negative activation in brain imaging. Under the effect of too small fabric pressure, the speed of cerebral blood flow increased slowly, but the oxygen consumption of nerve activity was too large, resulting in the oxygen consumption being greater than the oxygen supply, which also inhibited the nerve activity and presented negative activation. Under the effect of the two types of contact pressure in this subject, the maximum activation point was located at the negative activation point, which indicated that in these two cases, the brain areas of the mask were mainly dominated by the inhibition of neural activity. What is more, negative neural activities always represent negative induced emotions, such as depression, 84 loneliness, 85 unpleasantness, 86 visual discomfort/pain, 87 thermal discomfort, 88 etc. The difference was that the negative feeling under too little a fabric pressure was due to excessive oxygen consumption, while that under too high a fabric pressure was due to insufficient oxygen supply. However, all of these told us that these two fabric pressures caused discomfort contact. However, the decreases of both the negative activation intensity and negative activation proportion were only because the decrease of oxygen supply caused by the increase of pressure was not as large as the increase of oxygen consumption caused by the increase of neural activity. That is, the degree of pressure increase was too small, and the inhibiting effect of fabric compression on the amygdala was not strong, not being as strong as the inhibiting effect in the SI caused by fabric surface discomfort. As proven previously, the human body was only beginning to feel a little discomfort under the 1.5 kPa of fabric pressure. 89
Conclusion
Both fabric contact pressures of 0.5 and 1.5 kPa, which were slightly lower and higher than comfort fabric touch pressure (about 1 kPa), respectively, would produce negative activation on the SI and amygdala; the difference was that the neuroinhibition role on the SI was more obvious under the former pressure, while the neuroinhibition effect on the amygdala was more remarkable under the latter pressure, which meant that the SI might play a significant modulating role related to macroscopic surface tactile perception of fabrics, while the amygdala was probably the characteristic brain region associated with fabric oppressing perception. This is not only of great theoretical significance for establishing the origin of fabric comfort perception, but also of practical significance in the evaluation and perception of biomedical textiles and body sculpting clothing with high elasticity and touch pressure.
Future research
In the future, the SI and amygdala may be viewed as regions of interest to further quantitatively analyze the correlations among physical and mechanical properties of fabrics, the fabric pressures, and the brain signals of characteristic brain areas. By observing the response of the characteristic brain regions to judge the human body's true perception of fabric sense of touch quantitatively, a new and more realistic evaluation system of fabric perception will be derived based on the connection between fabric performances and brain perceptions to replace the existing indirect textile evaluation system. Furthermore, a model of textile exposure pressure-comfort fitting for various crowds with different ages and genders could also be established to popularize the technology using a large number of fabric physical and mechanical property tests and fMRI tests. Similarly, this advanced technology may also be extended to the thermal and wet comfort evaluation system of textiles.
Footnotes
Declaration of conflicting interests
The authors declared no potential conflicts of interest with respect to the research, authorship, and/or publication of this article.
Funding
The authors disclosed receipt of the following financial support for the research, authorship, and/or publication of this article: This work was supported by the China Scholarship Council, Exemplary Projects of the Research on Mechanism of Body Injury in the Disaster Environment and Research and Development of Rescue Protection Technology and Equipment (Grant Number 2016YFC0802800) and the Shandong Provincial Natural Science Foundation, China (Grant Number ZR2017BEM041).