
Abstract
In order to overcome the shortcoming that a fabric defect detection method can only fit into a certain type of fabric, this paper presents a novel method by integrating the idea of the integral image into the Elo-rating algorithm (IIER), which can detect the defects of various types of fabric speedily. Firstly, the golden sub-blocks are extracted from defect-free images. The whole images are divided into many sub-blocks, and the integral images of these sub-blocks are obtained. Next, the R sub-blocks are randomly selected from these integral sub-blocks, and each block is assigned an initial Elo point. Afterwards, the R sub-blocks are matched against all sub-blocks and the Elo points are updated after each competition. Finally, regions with bright defects accumulate high Elo points and regions with dark defects accumulate low Elo points. Thus, the threshold value image can be obtained by thresholding the final Elo points, in which white, gray and black regions correspond to bright, dark-defect and defect-free regions, respectively. The performance of the proposed method is evaluated on databases of three categories of fabric, namely raw fabric, yarn-dyed fabric and patterned fabric. The experimental results show that the IIER is a universal algorithm, which has high detection rate for different types of fabrics; in particular, the average correct detection rate can reach 100% for dot-patterned fabric. In addition, the detection time can be significantly reduced comparing with the Elo-rating algorithm (ER). Particularly for star-patterned fabric, the average detection time per image is 24.18 seconds less than the ER.
In the textile industry, fabric defect detection plays an important role in the product quality control process. Due to different kinds of fabric defects, textile enterprises are faced with huge losses. It is estimated that the price of fabrics will fall by 45–65% due to defects. 1 At present, most fabric inspection is carried out visually by human workers, which is not only costly, but is also inaccurate and unreliable due to human error and visual fatigue. In order to reduce the loss and improve the quality, more and more textile enterprises pay attention to automatic fabric defect detection. However, the wide variety of fabrics to be tested, the diverse types of defects and the long detection time have brought great challenges for defect detection.2,3 The application of computer vision technology in fabric automatic vision detection4–6 not only provides an efficient, low-cost and accurate detection method to replace the labor force, but also expands the detection ability to cover a wider range of different fabric types.7–17
In recent years, several fabric defect detection algorithms have been proposed.18–38 These methods are used to detect potential patterns that are different from non-defective textures by analyzing image textures. Raheja et al., 18 Miao, 19 Bi et al. 20 and Zhu et al. 21 used the local mean and standard deviation of gray texture features or the gray co-occurrence matrix to detect fabric defects. Firstly, it is necessary to determine the image grayscale distribution. Then through the gray level-gradient co-occurrence matrix, the change rate of the image grayscale is calculated. According to the change rate of the image grayscale, it can judge whether there are defects or not. Although good detection results have been achieved, there is still room for improvement in the calculation and identification. Jing et al.,22,23 Jing, 24 Bissi et al. 25 and Wang et al. 26 used a Gabor filter to filter and extract the texture features of the defect texture, and used golden image subtraction or the principal component analysis (PCA) algorithm to segment the defect from the normal texture. Good results have been achieved in the detection of raw fabric, but the versatility of the algorithm needs to be further improved. Li et al. 27 and Ngan et al. 28 processed the sample image using the wavelet decomposition algorithm and reconstructed the new image using wavelet coefficients. The defect can be detected by subtracting the new image from the original image. The algorithm has a good effect on the detection of raw fabric and patterned fabric, but the detection of yarn-dyed fabric still needs further research. Cohen et al., 29 Hua et al. 30 and Yang 31 used the Markov random field model to transform the image texture into state space. In some cases, the estimated model parameters make the Markov covariance uncertain, resulting in detection failure. At the same time, choosing appropriate model parameters is also a problem. In addition, the computational amount of the algorithm is large and the real-time performance is poor. Leng et al., 32 Serdatoglu et al., 33 Kraoananthavaram et al. 34 and Anitha and Radha 35 used the independent component analysis algorithm to extract the texture and structure information from images. The structure information can be reduced by phase consistency. Then the template image can be distinguished from the input image features. Wang et al. 36 and Zhang et al. 37 treat a defective region as a salient region in fabric images. A novel fabric defect detection method, which is based on the saliency metric for color dissimilarity and positional aggregation, is proposed. In the method, the RGB color space of a given fabric image is first converted into the CIE L*a*b color space for feature representation. Then, the color dissimilarity and the positional distance between similar patches are jointly used to measure the defective values. The experimental results of several fabric images show that the proposed method has certain effectiveness. Tsang et al. 38 pioneered a novel fabric defect detection method based on the Elo-rating algorithm (ER). In the ER method, an image is divided into standard size sub-blocks with a start-up reference point. The Elo points of these sub-blocks are updated through matches between different sub-blocks. Any sub-blocks with defects will be shown in the resultant threshold value image: a white resultant image corresponds to a bright defect and a gray resultant image corresponds to a dark defect. The ER is a promising method for defect detection. However, the detection time is long, the efficiency is low and the defect detection of the algorithm in raw fabric and yarn-dyed fabric is not mentioned in the literature.
The existing methods in the above literature are effective in detecting defects of a certain type of fabric, but cannot be used to detect other types of defects, that is, they have poor universality. In view of this, this paper proposes a universal defect detection method based on the Elo-rating algorithm of the integral image (IIER). The advantages of the employed method are as follows.
By extending the ER to multiple types of fabric defect detection, including raw fabric, yarn-dyed fabric and patterned fabric, the versatility of the defect detection algorithm is improved. Through experiments, the selection method of two parameters, namely the number of randomly selected sub-blocks and the size of the sub-blocks, is summarized when the IIER is used in different types of fabric defect detection.
In the ER, repeated competitions are performed between sub-blocks, and each match is compared pixel by pixel. The amount of calculation is very large, and the detection time is very long. The introduction of integral image overcomes the fatal shortcoming of the traditional ER. The IIER used in this paper has achieved good detection results in different types of fabric defect detection, and the highest total average detection rate can reach 95%. Particularly in the detection of dot-patterned fabric, the average detection rate can reach 100%. In addition, the rapidity of defect detection is greatly improved by the algorithm. Particularly in the defect detection of star-patterned fabric, the average detection time is 24.18 seconds less than the ER.
The structure of this paper is organized as follows. In the second section, the traditional ER is introduced and its time-complexity is analyzed. In addition, the introduced integral image is described. In the third section, the proposed approach is described and its time is analyzed. Moreover, the influence of the use of integral image on the detection time is also introduced. In the fourth section, the influence of three parameters in the proposed algorithm on the experimental results is summarized. In the fifth section, the detection results and analysis of the experiment are provided to validate our method on three databases of real fabric images. Finally, the sixth section gives the conclusion.
Traditional Elo-rating algorithm
The ER was first proposed by Professor Elo,39–42 and is widely used in international chess, football, basketball and other sports. Tsang et al. 38 extended this algorithm to fabric defect detection for the first time. For the ER, an image is divided into many sub-blocks and each sub-block is considered as a player. There are two parts in the ER: the threshold value computation section and detection section. The threshold value computation section mainly calculates two threshold values. One is used to judge the win or loss of a sub-block match, and the other is used to judge whether there is defect or not in the sub-block. The execution process of the detection section is the same as that of the threshold value computation section.
The threshold value computation is as follows.
The golden sub-block Q with size of Slide Q on each pixel along each row on the defect-free image and all the sub-blocks on it are matched with Q. The score s of the match against the corresponding position is calculated after each move of the sliding process.
For any two sub-blocks
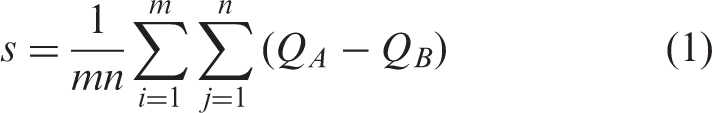
In Equation (1),
After the golden sub-block Q completes the matches with the whole defect-free image, a score matrix Repeat the above steps for k defect-free images and obtain k maximum Set the initial Elo point of The R sub-blocks are randomly selected from the divided After step 5 has finished, the updated Elo point matrix Repeat the above steps for k defect-free images (the parameter k refers to the number of defect-free images that need to be trained) and obtain k maximum
Detection
Carry out the same operation as the above steps 4–6 of the threshold value computation section in the tested sample to obtain an updated Elo point matrix According to the updated Elo point matrix
Time-complexity analysis of the traditional ER
The time-complexity of the ER is mainly reflected in the computational complexity of the algorithm. We take C2R2 raw fabric as an example for analysis.
Computational analysis of the threshold value section
The threshold value computation section is operated on defect-free images. It is assumed that the size of the defect-free image is 64 × 64, and the size of the golden sub-block is 7 × 4. For each sample, it can be divided into (64 – 7 + 1) × (64 – 4 + 1) = 58 × 61 = 3538 sub-blocks of size 7 × 4. Then the golden sub-block Q is used to slide the pixel by pixel on the defect-free image, and is matched against all sub-blocks in the defect-free image. For the match of any two sub-blocks, 7 × 4 = 28 operations are performed according to Equation (1). For a golden sub-block Q to compete with the 3538 sub-blocks of the whole image, 28 × 3538 = 99,064 operations are performed. In the ER, five defect-free images are selected for training, and a total of 5 × 99,064 = 495,320 operations are performed. Then, the R sub-blocks are randomly selected from 3538 sub-blocks, and are matched against the whole 3538 sub-blocks. The values of R are different for different fabric types. For C2R2 raw fabric, the value of R is 10. The R sub-blocks are matched against the other sub-blocks in five images, and a total of 10 × 5 × 28 × 3538 = 4,953,200 operations are performed. The more complex the texture feature and structure feature of the fabric, the larger the value of R will be, and the greater the computing times will be. Therefore, the total number of calculations in the threshold value section is 495,320 + 4,953,200 = 5,448,520 in the traditional ER.
Computational analysis of the detection section
The calculation of the detection section is similar to the threshold value computation section, but is operated on tested images. Therefore, the total number of calculations in the detection section is 10 × 28 × 3538 = 990,640 in the traditional ER.
Based on the above analysis, it can be seen that the calculation of the traditional ER is very considerable due to a great amount of comparison, especially if it is used in defect detection. For fabrics with a complex texture, structure and cycle, the calculation is larger. Therefore, we need to find a method to reduce the calculation amount of the ER. In the ER, when the golden sub-block Q or the random sub-block R slides pixel by pixel on the whole image, the operation is to first calculate the pixel difference of each point, and then sum, as shown in the previous equation (1). Deform Equation (1) to get Equation (2)
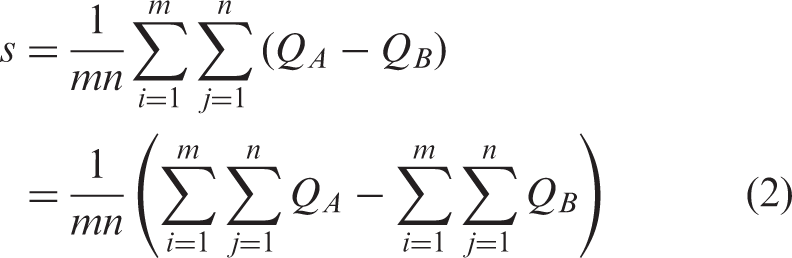
Each of the terms
Integral image
The simple representation of the integral image is that the pixel value of each point is equal to the sum of all pixel values before the point, which can be expressed by the following equation
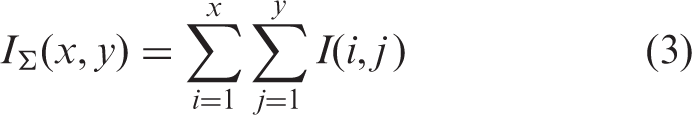
In Equation (3),
In Figure 1, the pixel sum of the region Q can be obtained by the integral images of points A, B, C and D, which can be expressed by the following equation
Integral image of the region Q.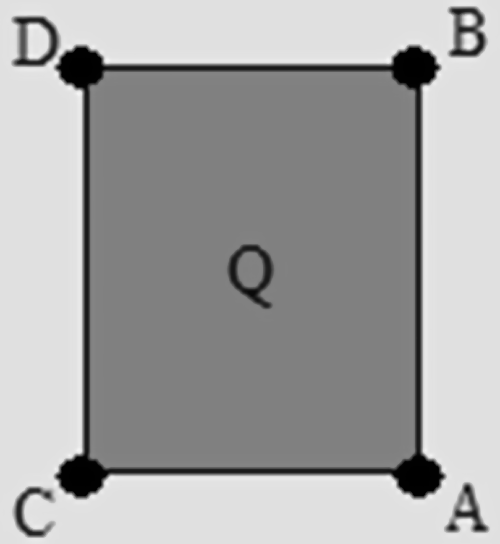

In Equation (4),
Elo-rating algorithm of the integral image
The proposed method, the IIER, is a new perspective for the detection of fabric defects. In the IIER method, the number of accumulated Elo points is used to judge bright defective regions, dark defective regions and defect-free regions of an image. The bright defects and dark defects for different types of fabric samples are shown in Figure 2. Among them, the first, second and third columns are defect-free samples, bright defect samples and dark defect samples, respectively.
The bright defects and dark defects for different types of fabric samples: (first column) defect-free samples; (second column) defective samples with bright defects; (third column) defective samples with dark defects.
In the long run, the Elo points accumulated is a fair indication of the player's performance. In fabric defect detection, sub-blocks of a fabric image are considered as the players and a match is regarded as the matrix operation between these sub-blocks. The IIER method shown in Figure 3 also involves two phases: the threshold value computation section and the detection section. The threshold value computation section is operated on defect-free images, which contain two threshold values. The first threshold value is used to determine the win or loss of a sub-block match. The second threshold value is used to determine whether there is defect or not in the sub-block. The detection section is performed on the tested images, and the execution process is the same as the threshold value computation section, while each sub-block is judged as to whether there is defect by the second threshold value obtained in the threshold value computation section.
Flow of the Elo-rating algorithm of the integral image.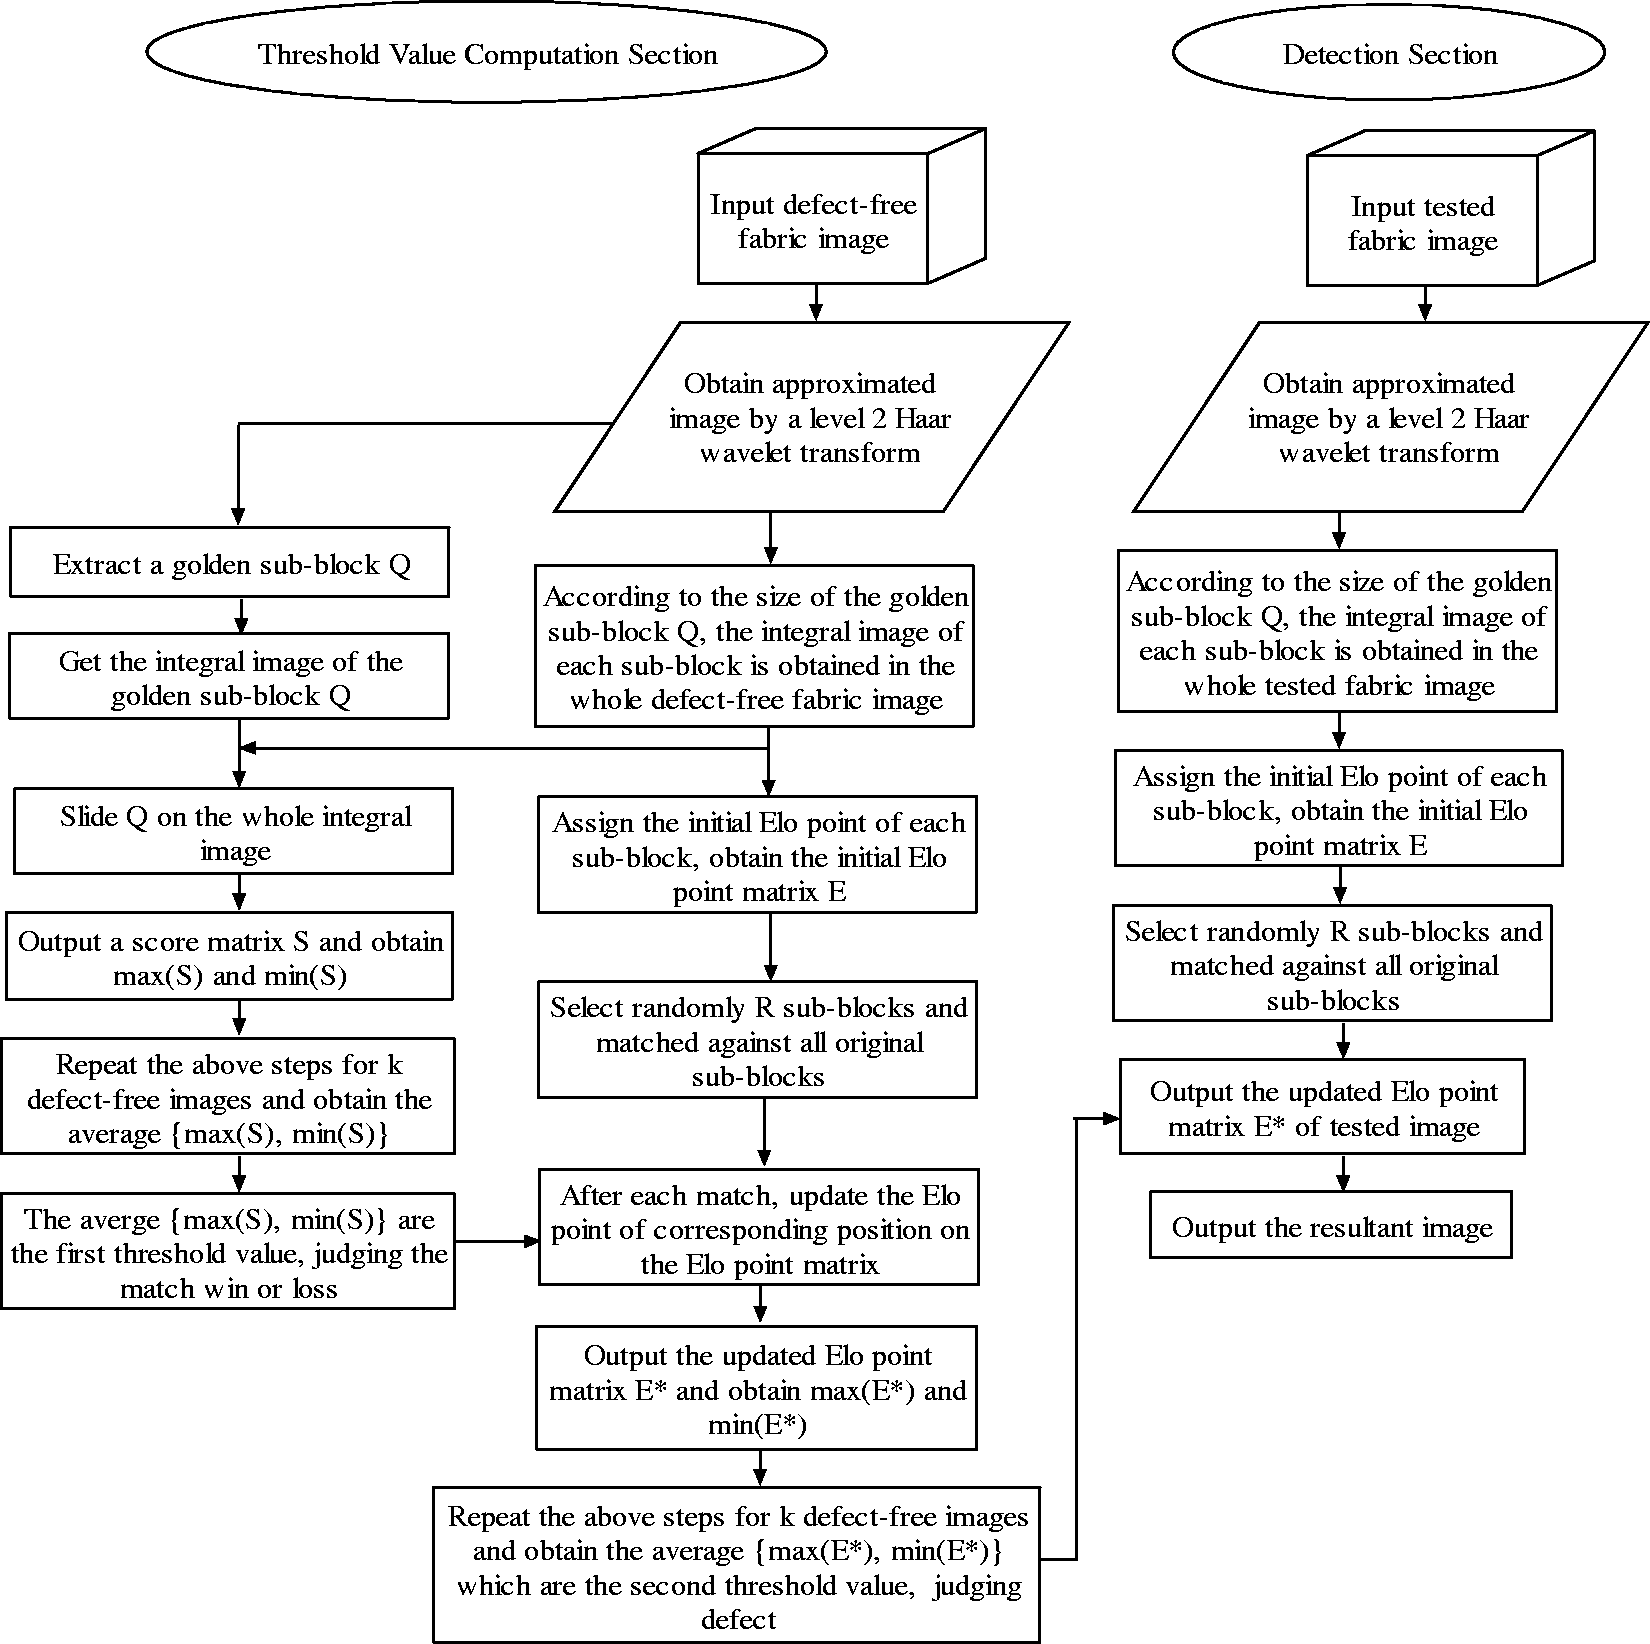
Threshold value computation
The first threshold value is used to judge the win or loss of each sub-block, and as the basis of the Elo points updating of each sub-block. The second threshold value is used to judge whether there is defect or not in each sub-block. It is the key to accurately detecting the defect. The specific process of the section is as follows.
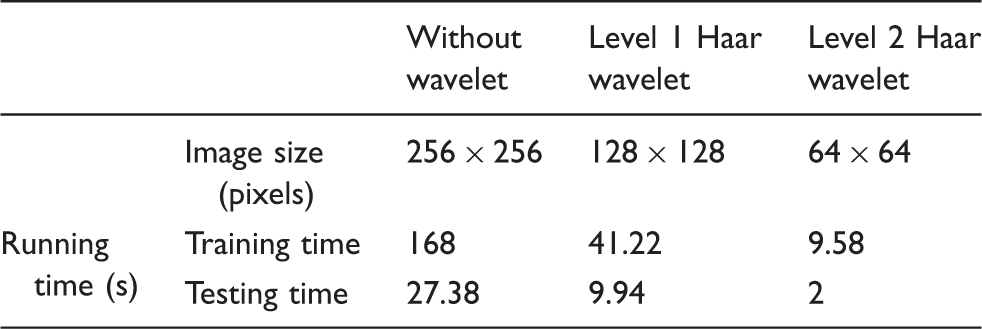
Perform a level 2 Haar wavelet transform on defect-free images to obtain corresponding approximated images of size Running time of different level Haar wavelet transforms
Then get the integral image The integral image of the entire approximate image is constructed. According to the size Slide 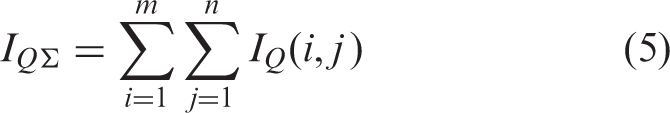
For the integral images of any two sub-blocks 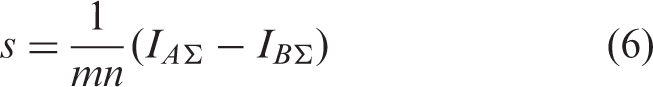
After 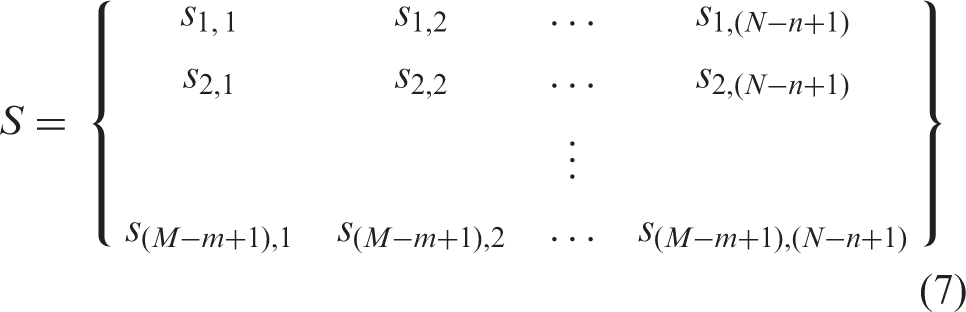
Then the maximum Repeat the above steps 1–4 for k (k = 5) defect-free images. Then the first threshold value judging the win or loss of each sub-block can be obtained as Equation (8)

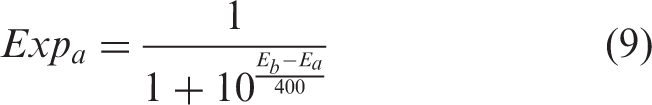
According to the first threshold values Assign the initial Elo point of each sub-block as 1000. Then a reference matrix of Elo points Assume that the initial Elo points of sub-blocks A and B are 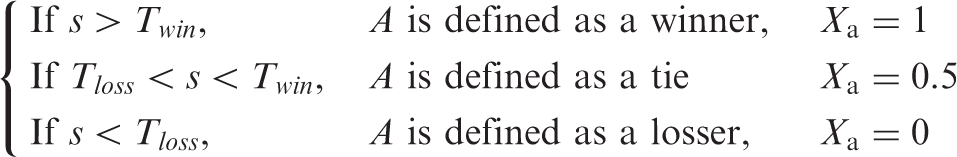

The R sub-blocks are randomly selected from the divided
The updating formula is as Equation (11), according to the position of sub-block
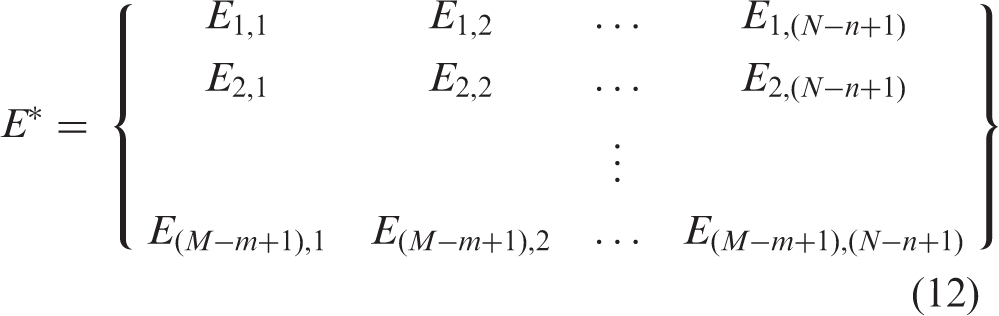
After step 7 has finished, the updated Elo point matrix Repeat the above steps 6–8 for k (k = 5) defect-free images. (The parameter k refers to the number of defect-free images that need to be trained.) Then the second threshold values judging defect can be obtained as Equation (13)


Detection
The detection section is implemented on the basis of the threshold value computation section, and it is only carried out on the tested sample. After obtaining the updated matrix of the tested sample, the second threshold values are used for threshold value segmentation. The specific process of the section is as follows.
Perform a level 2 Haar wavelet transform on the tested image to obtain the corresponding approximated image of size The integral image of the whole approximated tested image is constructed. The integral image is divided into a number of sub-blocks with the size Carry out the same operation as the above steps 6–8 of the threshold value computation section in the tested sample to obtain an updated Elo point matrix According to the updated Elo point matrix
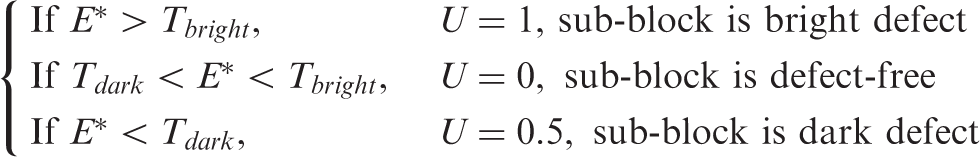
Consequently, the size of the final detection result image U is
Time analysis of the IIER
In order to more accurately compare the computational amount, this part uses the same fabric as above, namely C2R2 raw fabric.
Computational analysis of the threshold value section
The approximate image size of C2R2 raw fabric is 64 × 64, and a golden sub-block Q of size 7 × 4 is extracted. For each sample, it can be divided into (64 – 7 + 1) × (64 – 4 + 1) = 58 × 61 = 3538 sub-blocks of size 7 × 4. Firstly, to calculate the integral image of the golden sub-block Q, it is necessary to perform 7 × 4 – 1 = 27 calculations. Secondly, to obtain the integral image of the whole approximate image, it is necessary to perform 64 × 64 – 1 = 4095 calculations. Thirdly, the integral image of the 3538 sub-blocks according to the size of the golden sub-block Q is obtained in the whole integral image, for which it is necessary to perform (64 – 7 + 1) × (64 – 4 + 1) – 1 = 3537 calculations. Finally, the golden sub-block Q is matched against all sub-blocks of the whole integral image, for which it is necessary to perform (64 – 7 + 1) × (64 – 4 + 1) = 3538 calculations. Therefore, for an image, starting from the extraction of the golden sub-block Q to the completion of the competition, it is necessary to perform 27 + 4095 + 3537 + 3538 = 11,197 calculations. As with the ER, we still select five images for training, so a total of 5 × 11,197 = 55,985 calculations are required. Since the training image of the second threshold is the same as that of the first threshold, the corresponding integral image can be directly applied to the second threshold value. The R sub-blocks randomly selected on the integral image are matched against all the sub-blocks in it. If R is 10, 10 × (64 – 7 + 1) × (64 – 4 + 1) = 35,380 calculations are performed. Finally, in five images of training, the total number of calculations is 5 × 35,380 = 176,900. Therefore, the total number of calculations in the threshold value section is 55,985 + 176,900 = 232,885 in the IIER.
Computational analysis of the detection section
The calculation of the detection section is similar to that of the threshold value computation section. Firstly, the integral image of the tested image is obtained. Secondly, the integral image of the corresponding sub-block in the whole image is obtained according to the size of the golden sub-block. Finally, the R sub-blocks randomly selected from the whole integral image are matched against other sub-blocks in it. The total number of calculations in the detection section is 4095 + 3537 + 35,380 = 43,012 in the IIER.
The comparison of the computational amount (operand) between two algorithms
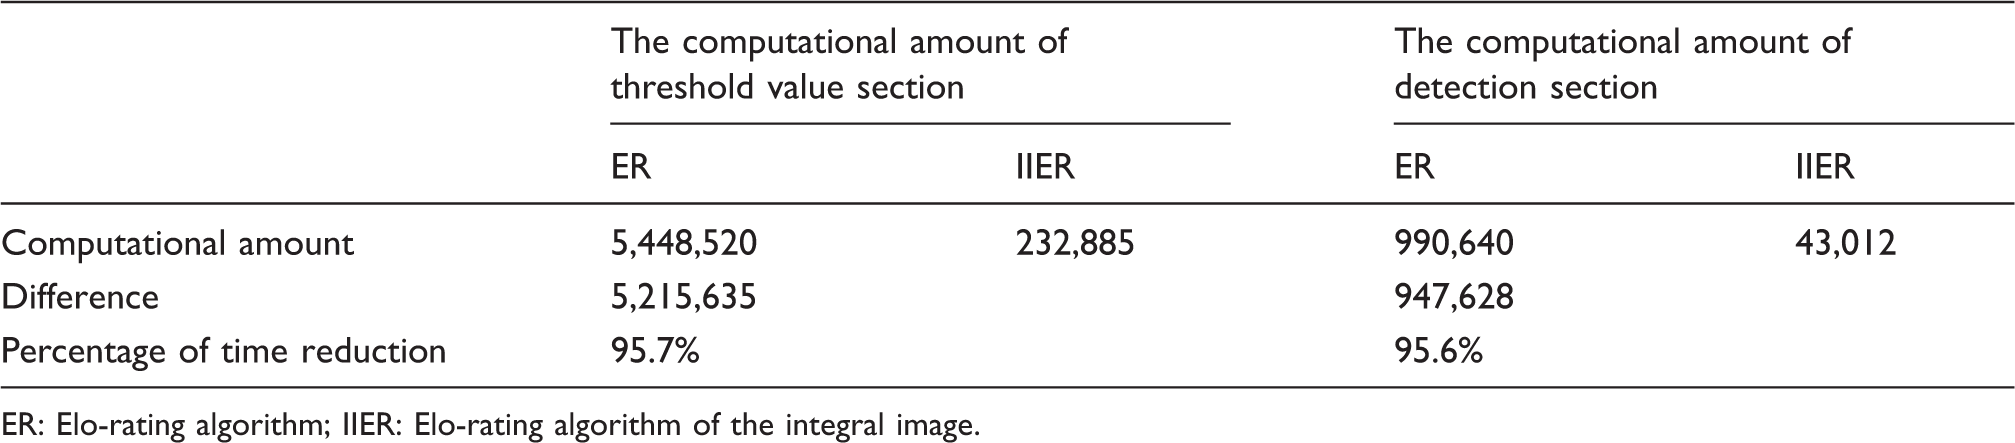
ER: Elo-rating algorithm; IIER: Elo-rating algorithm of the integral image.
The effect of the integral image on time
The average detection time of the Elo-rating algorithm (ER) and the Elo-rating algorithm of the integral image (IIER)
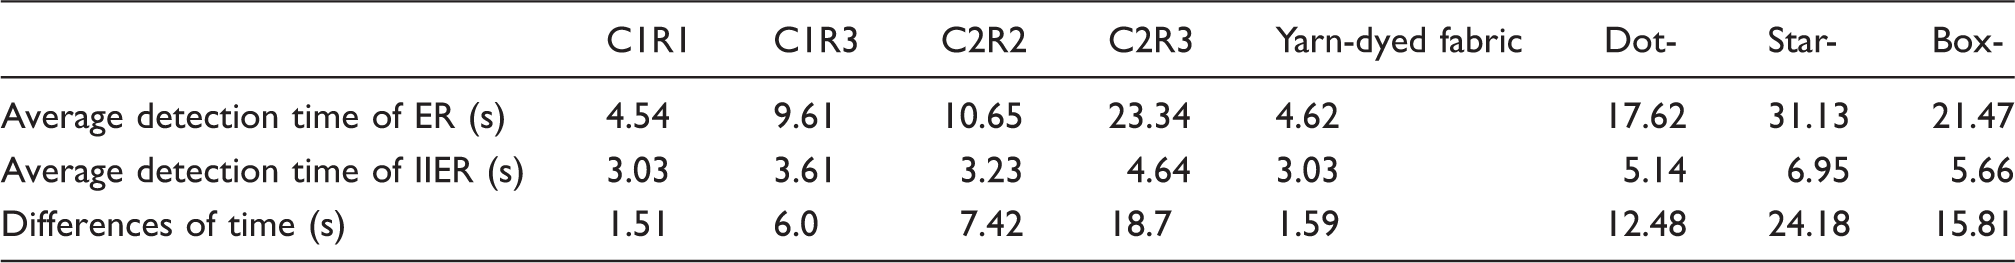
It can be seen from Table 3 that the average detection time of the two algorithms is significantly different. Both computation complexity and the average detection time all prove the superiority of the IIER. Since the IIER is compared and detected in the form of image blocks, and the operations of these blocks are independent of each other, the proposed algorithm has a promising result to meet real-time requirements in actual production by adopting parallel operations.
Parameter analysis
In the IIER, the selection of several parameters plays a key role in detecting defects accurately. The parameters are as follows: constant K, the number of sub-blocks R randomly selected and the size of sub-block
The selection of constant K
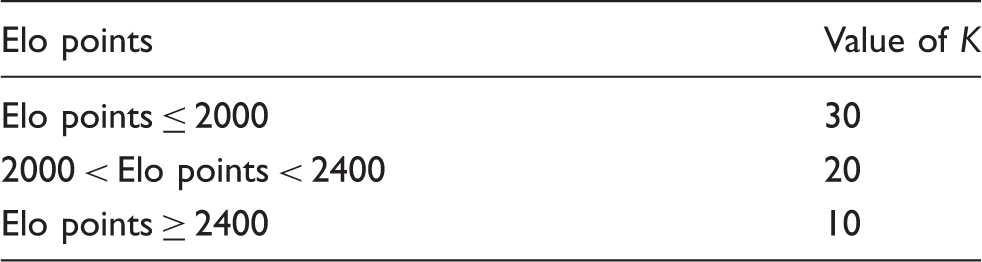
A greater K indicates that the closer match has more significant influence. Generally, K is in the range of 10–32, and the value of K is shown in Table 4. In the paper, the influence of K that changed the detection results is shown in Figure 4. The experiment proved that the value of K has no significant influence on the detection results. In some types of image detection, a smaller value of K will make the defect detection process incomplete. However, overall, the higher the value of K is, the better the detection effect is. Therefore, in this paper, K takes its maximum value of 30 in the allowable value.
The influence of K on the detection results: (first column) defective images; (second column) constant K = 10; (third column) constant K = 20; (fourth column) constant K = 30. The corresponding value of constant K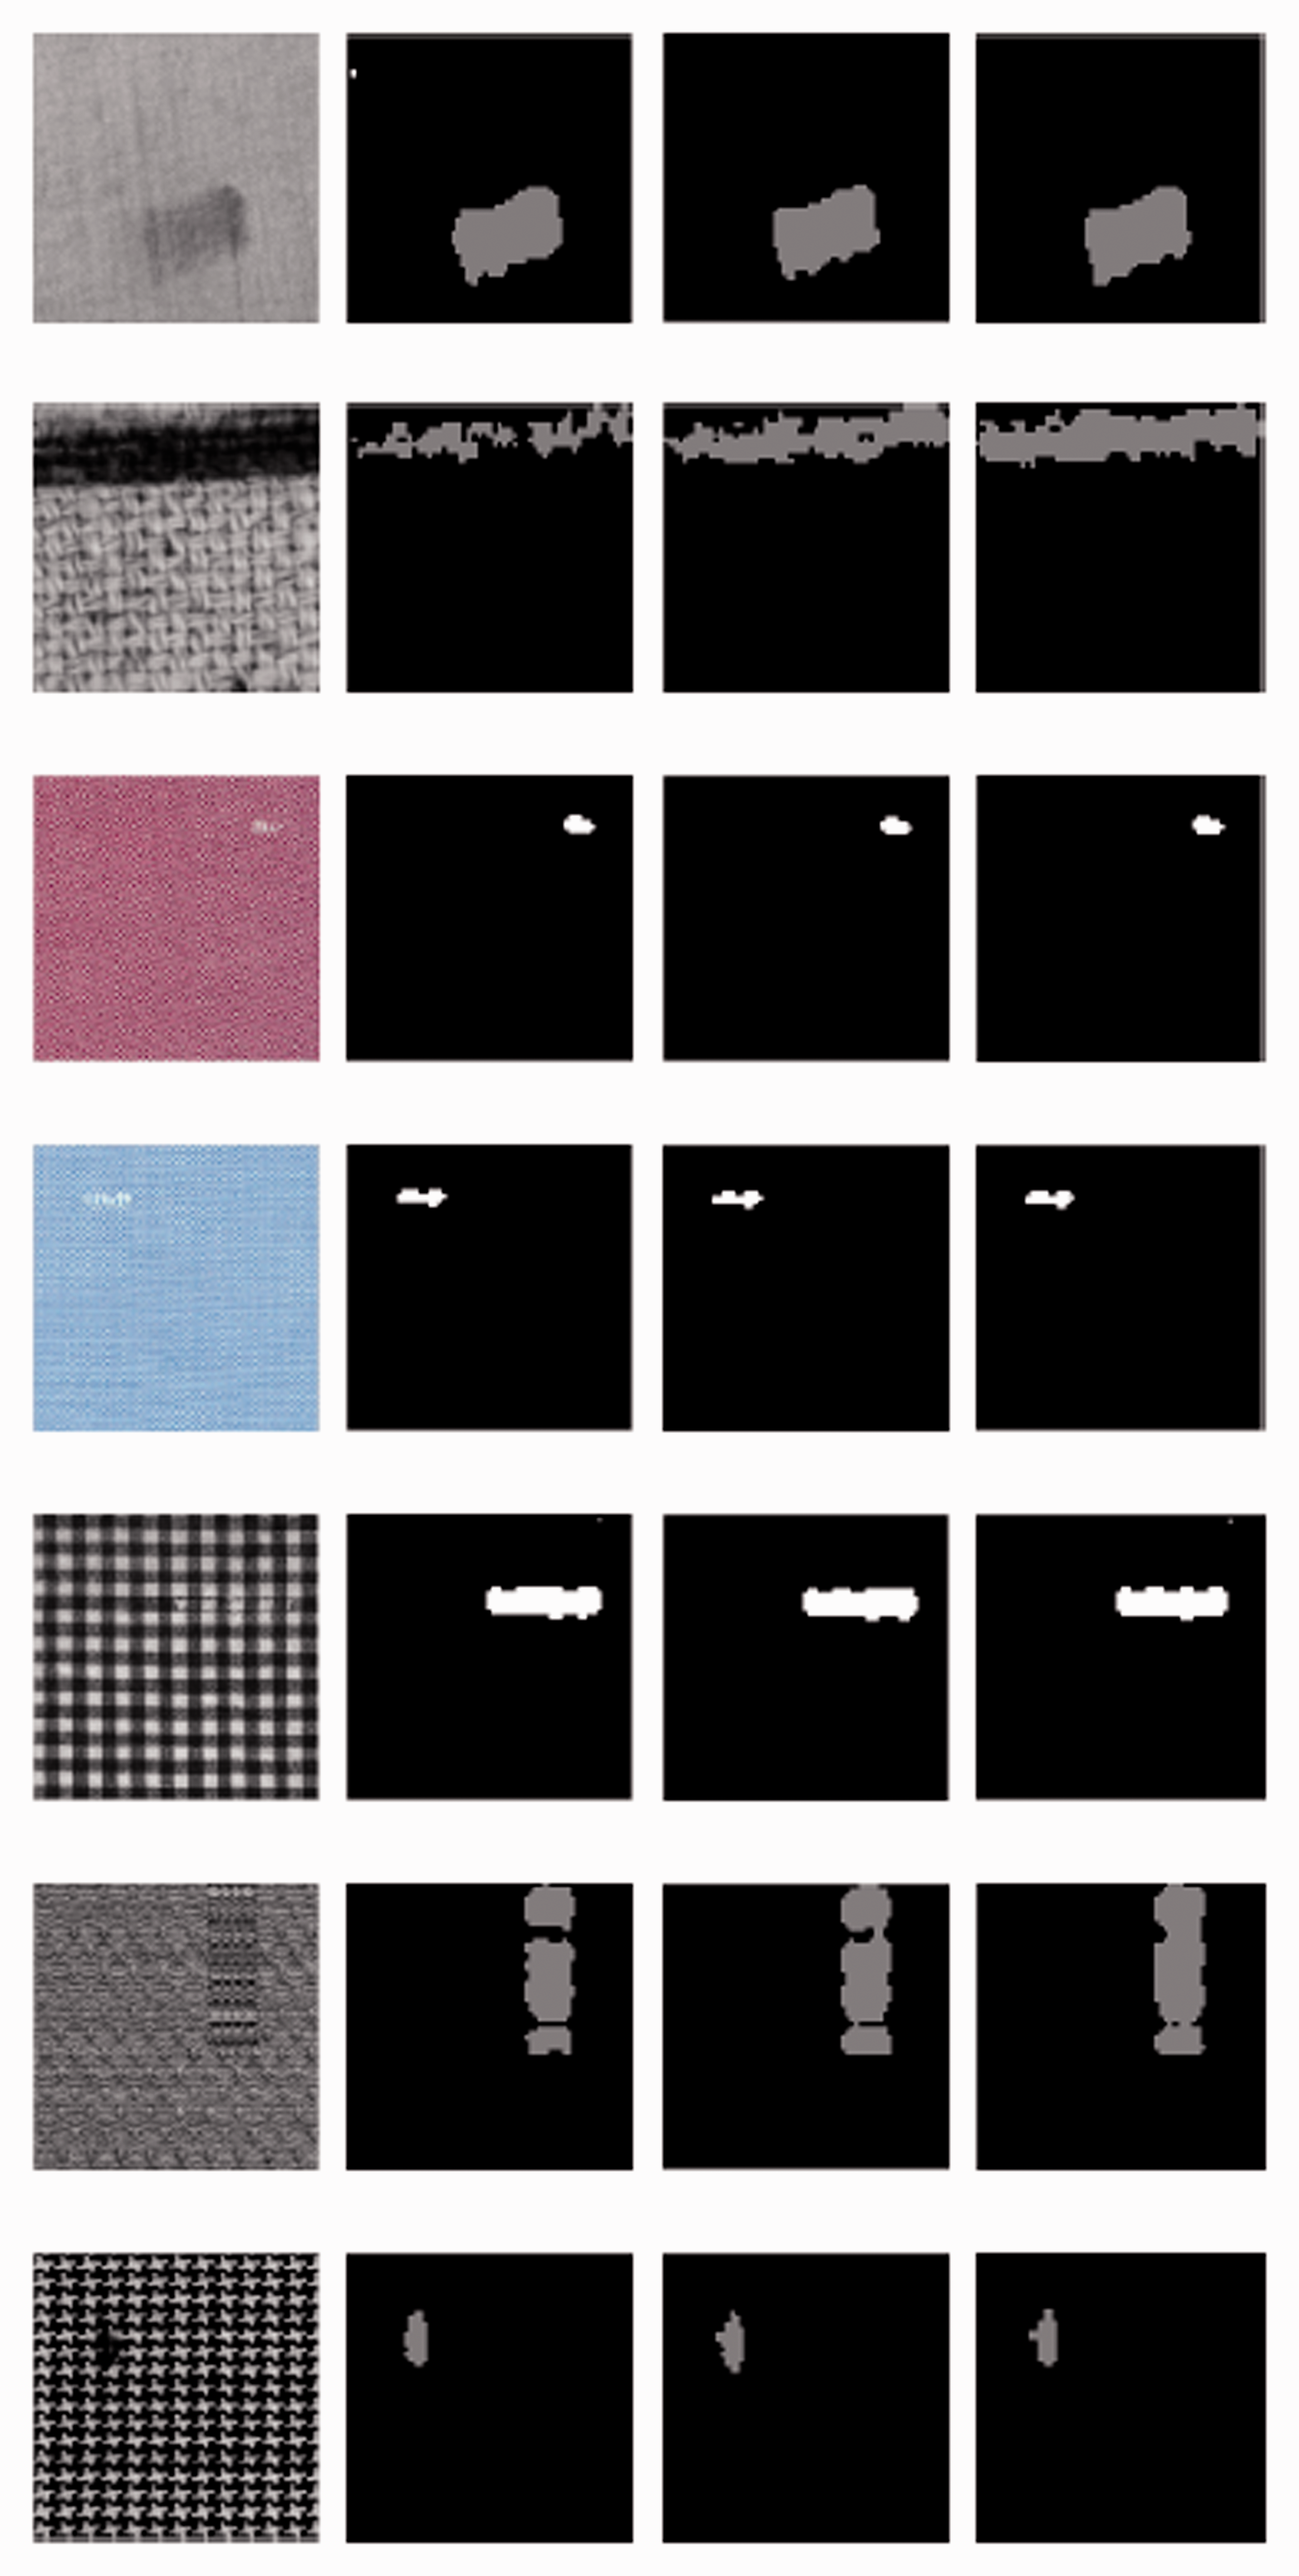
The selection of the number of sub-blocks R randomly selected
In the case of the certain size m × n of sub-blocks, the running time and detection success rate (DSR) of the algorithm are affected directly by the number of sub-blocks R randomly selected. Running time includes the training time used in the threshold value computation and the testing time used in defect detection. When the size of the sub-blocks is The influence of the number of sub-blocks R randomly selected on the running time and detection success rate.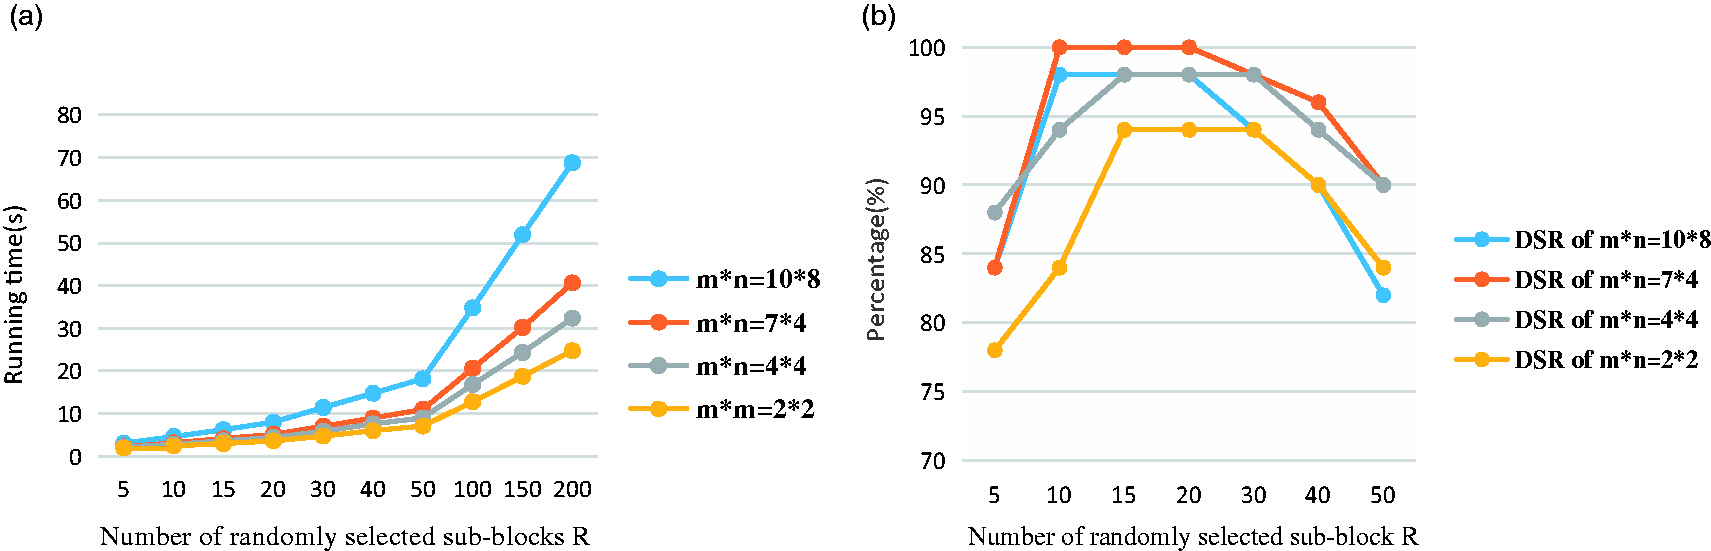
As shown in Figure 5(a), with the increase in the number of sub-blocks R randomly selected, the running time of the images of each size increases accordingly. When R is greater than 50, the running time increases rapidly, which has a great impact on the real-time detection. As shown in Figure 5(b), when the number of sub-blocks R randomly selected is equal to five, the DSR of each sub-block image is very low. However, when R is greater than or equal to 10 but less than 30, images of each size show a high DSR. When R is greater than 40, the DSR of images of each size is significantly reduced. To sum up, in order to achieve a high DSR and a short running time, it is appropriate to select the number of sub-blocks R randomly between 10 and 30.
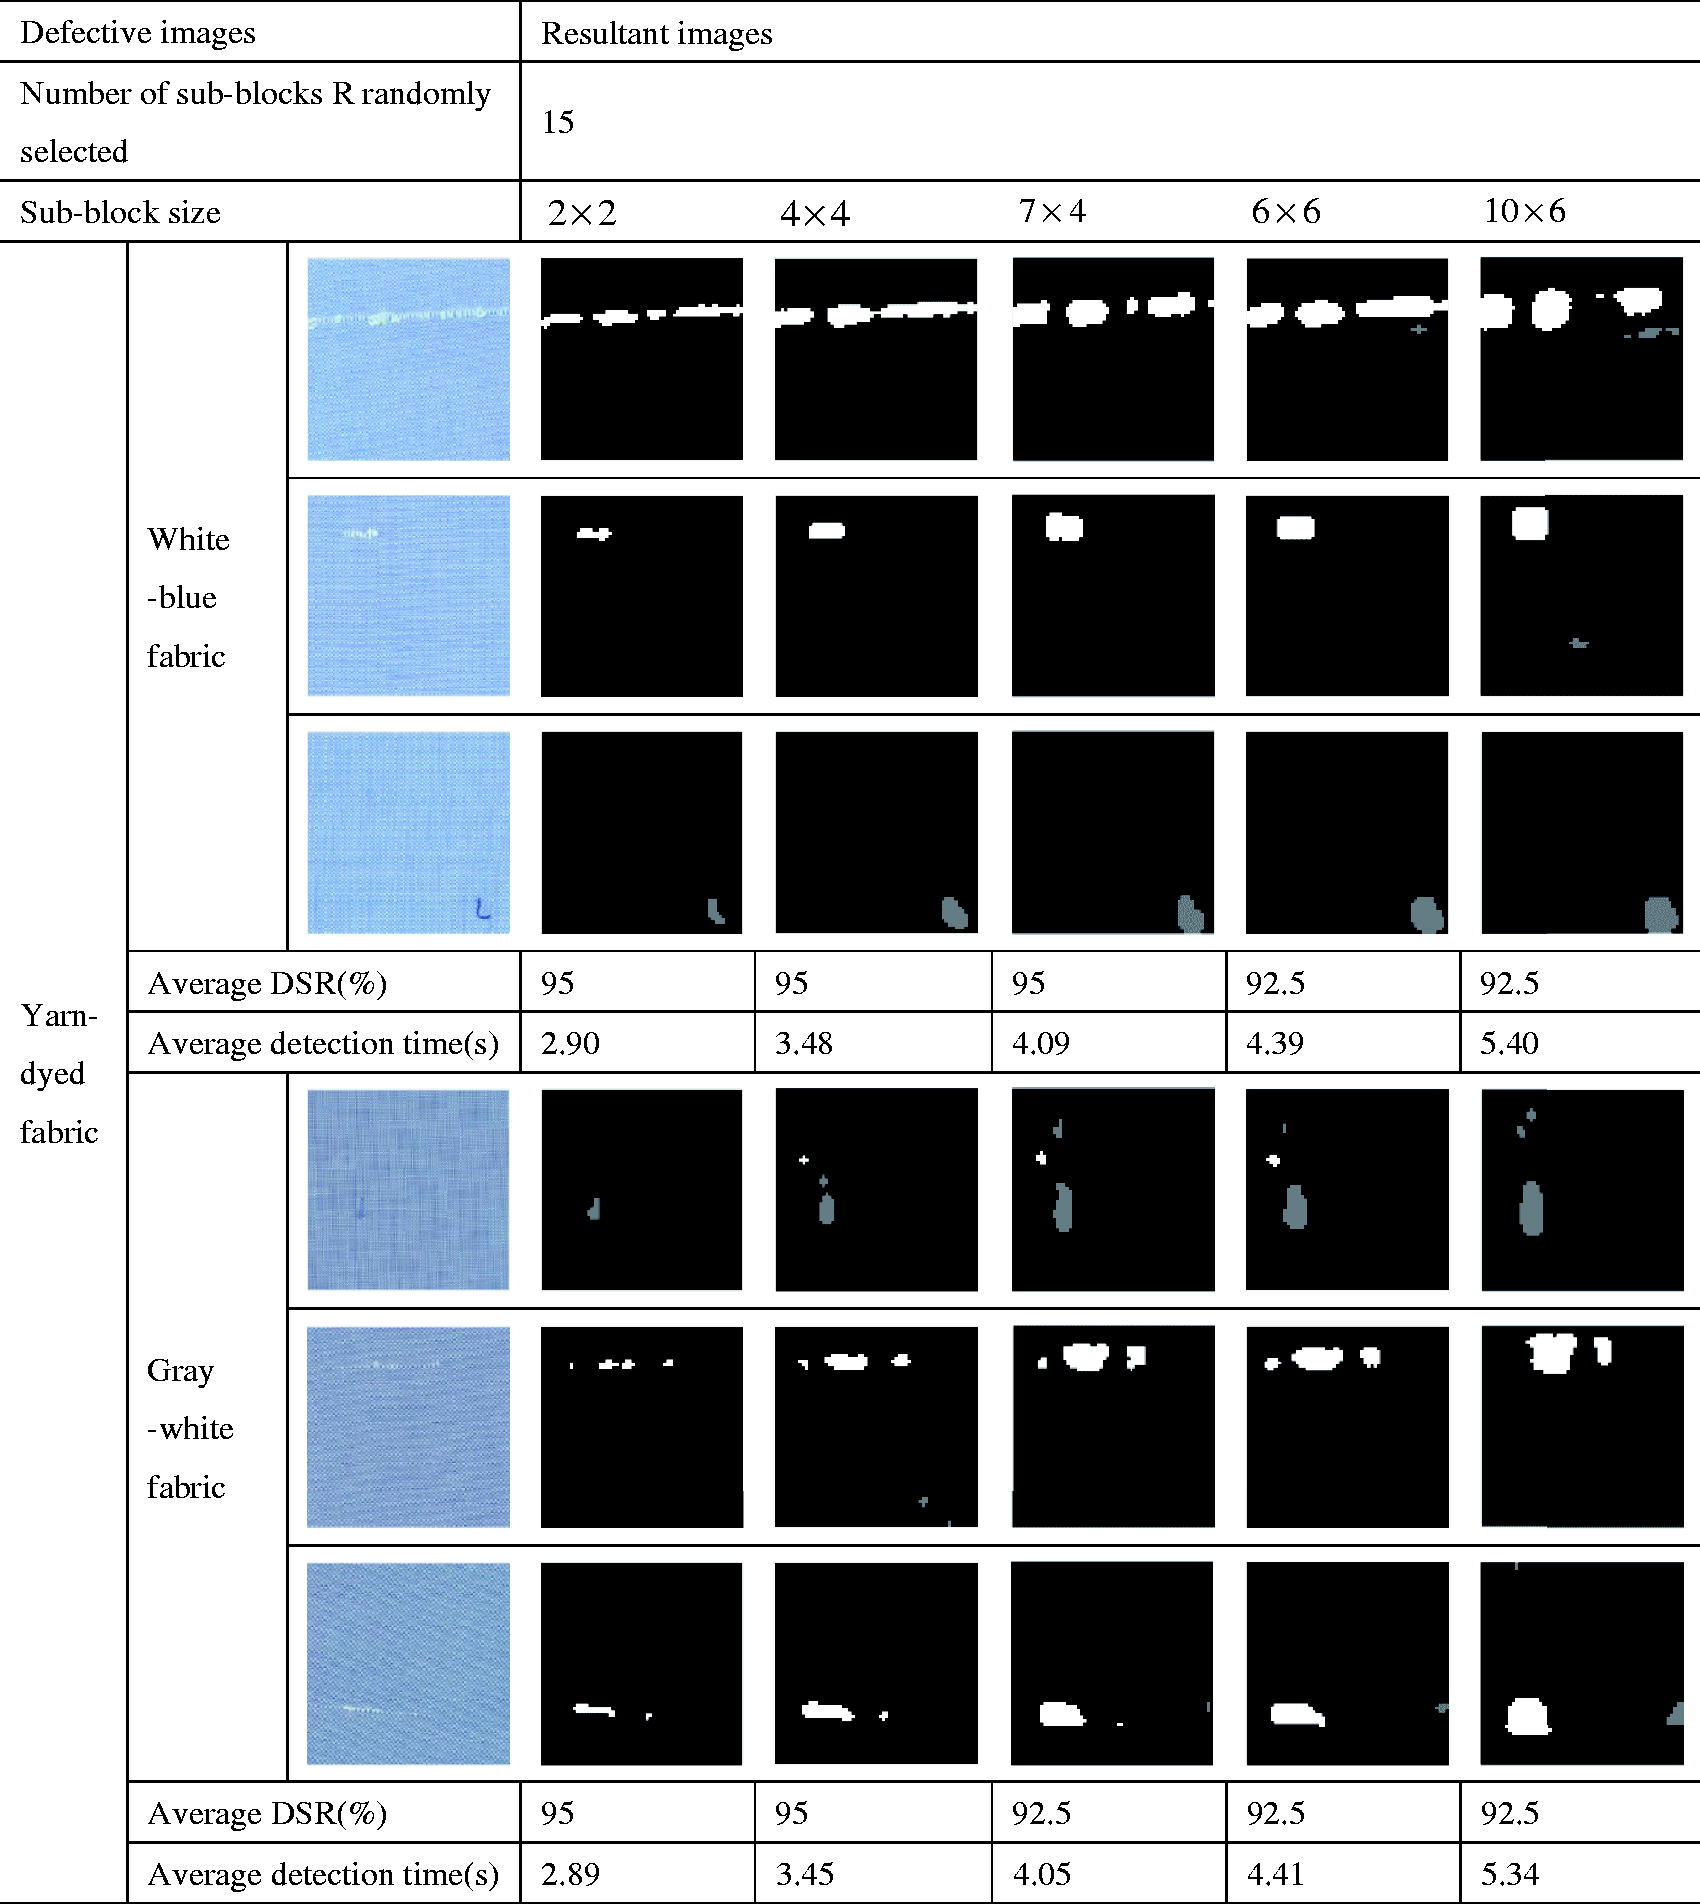
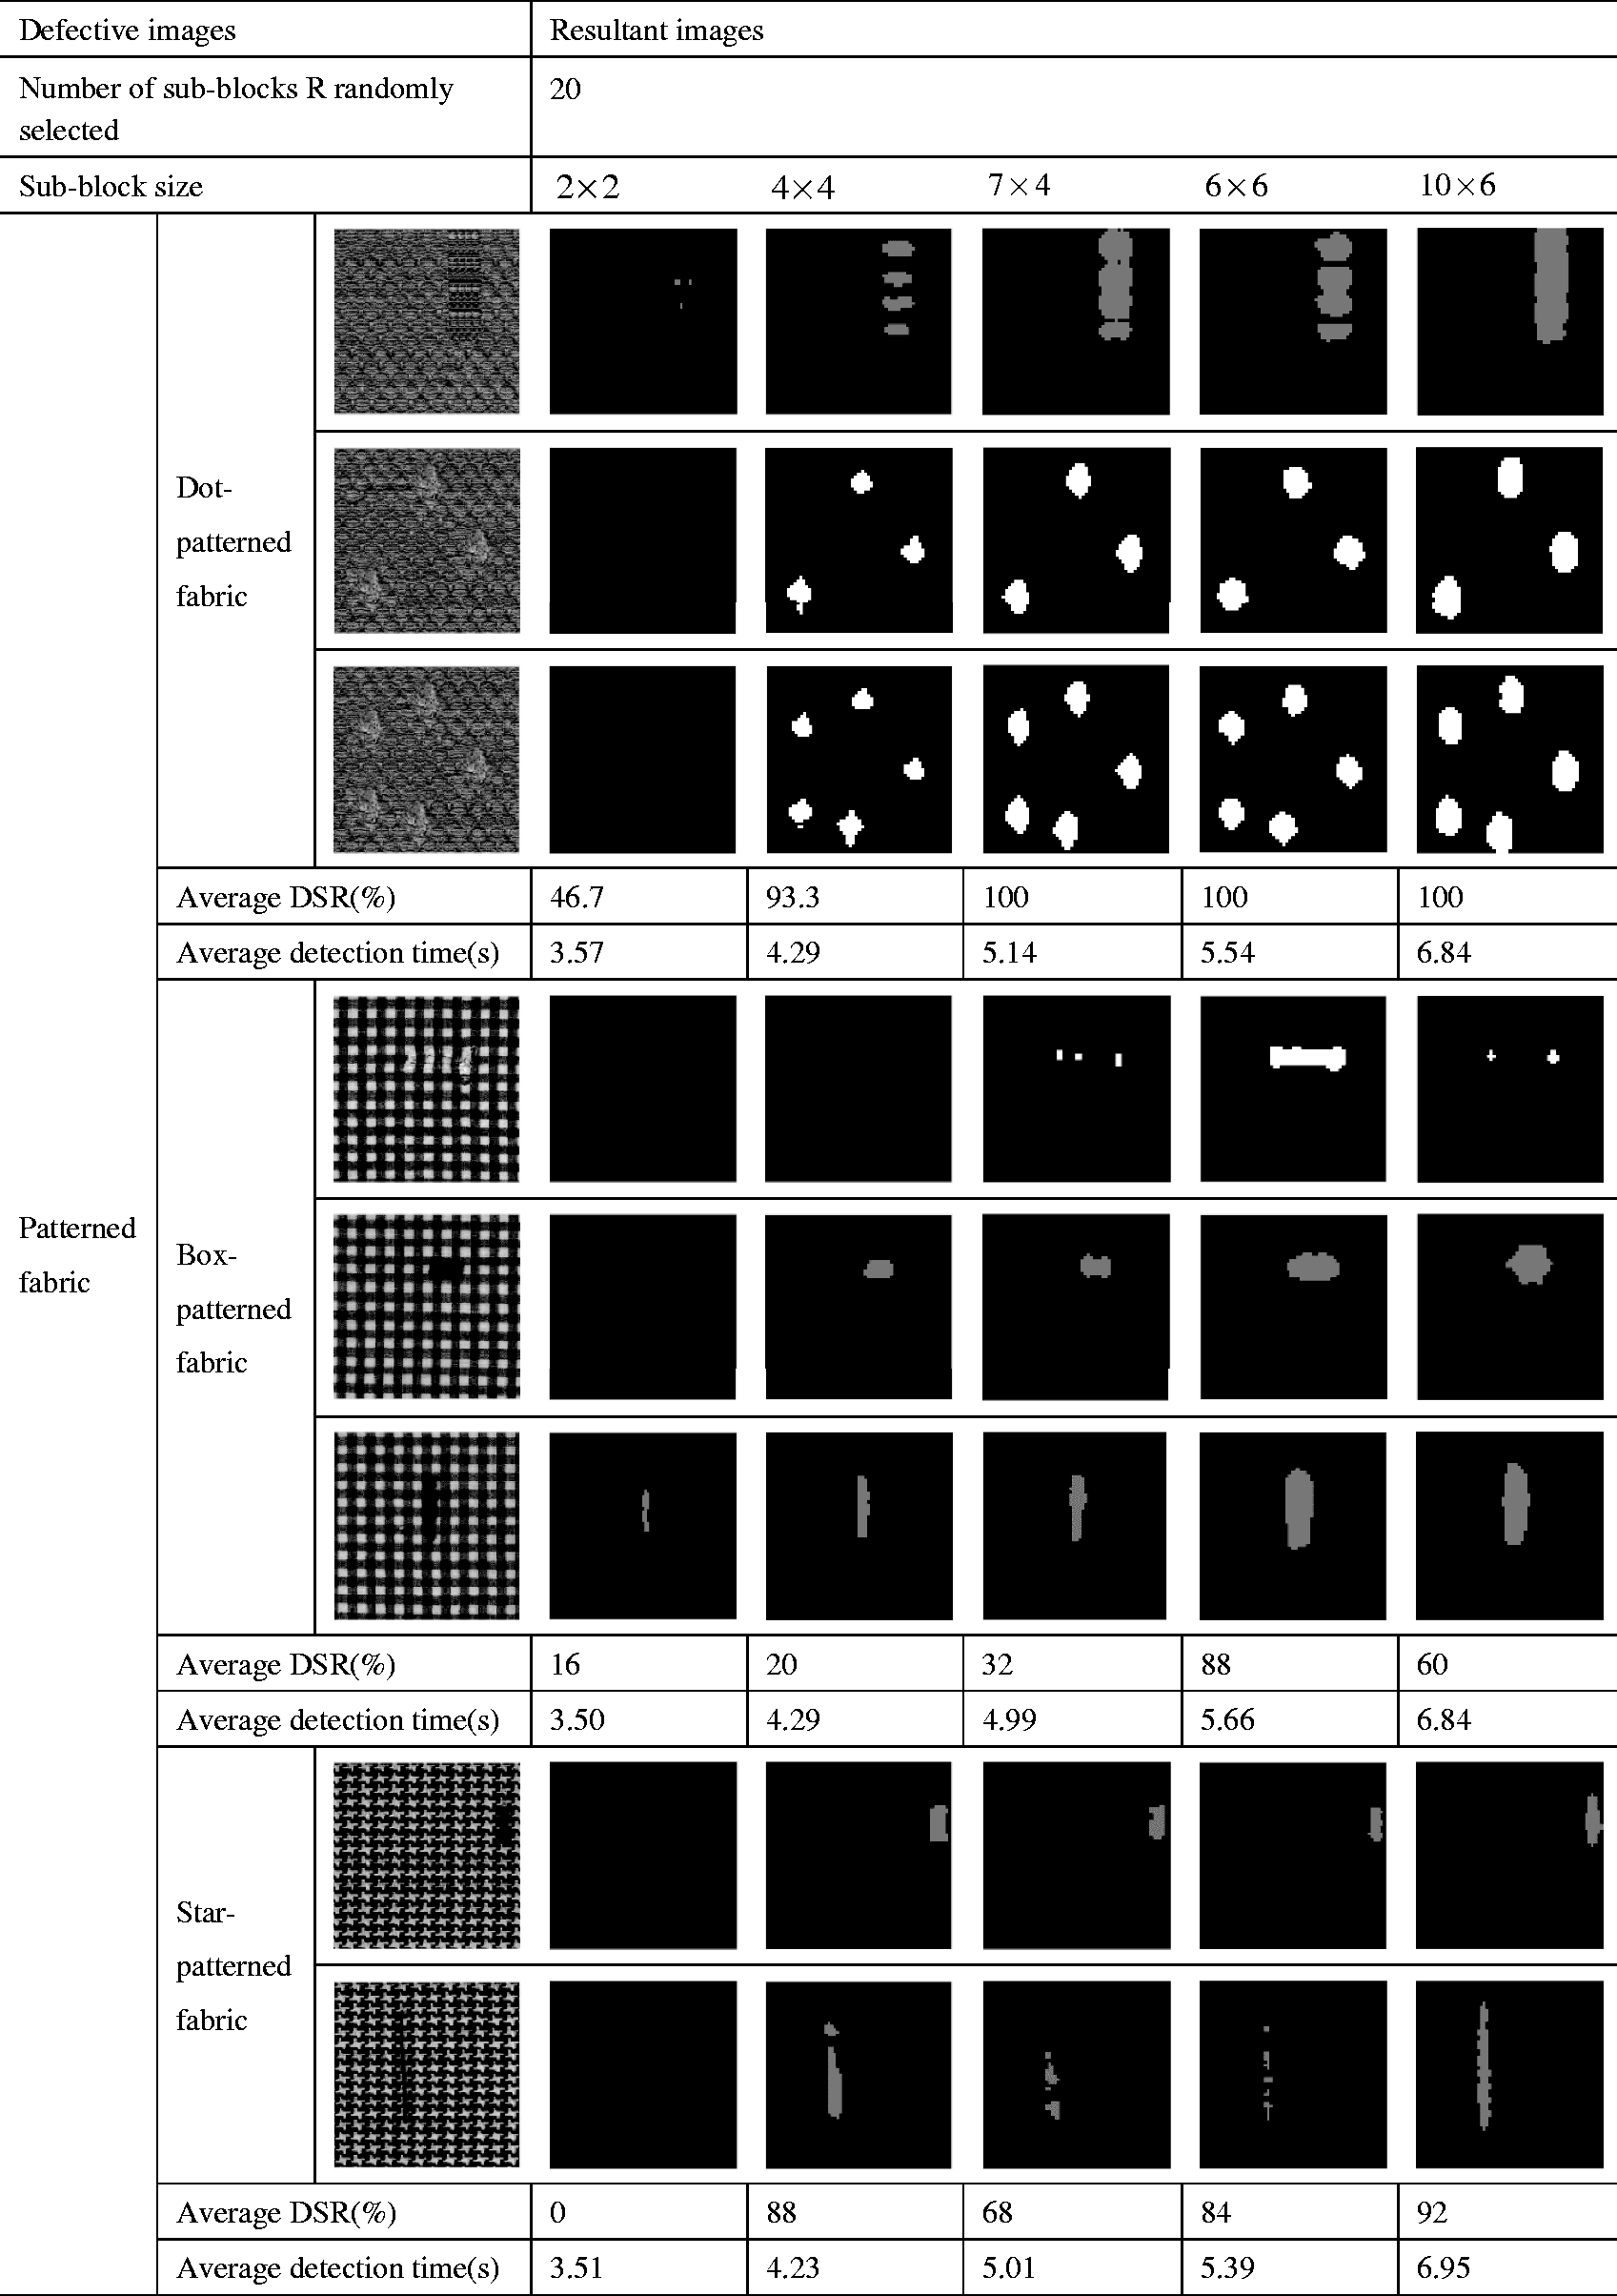
The number of sub-blocks R randomly selected for different types of fabrics is different. It is related to the texture, density and thickness of the yarn. However, it can be seen from previous experiments that the number of sub-blocks R randomly selected should be selected between 10 and 30 to meet the dual requirements of the running time and DSR. In Figures 6–8, we take five cases of R as 5, 10, 15, 20 and 30, respectively, to analyze the influence of the number of sub-blocks R on the detection results of three different types of fabric samples. The optimal parameter is the one with a high DSR and low running time.
The influence of the number of sub-blocks R randomly selected on the detection results of raw fabric. The influence of the number of sub-blocks R randomly selected on the detection results of yarn-dyed fabric. The influence of the number of sub-blocks R randomly selected on the detection results of patterned fabric.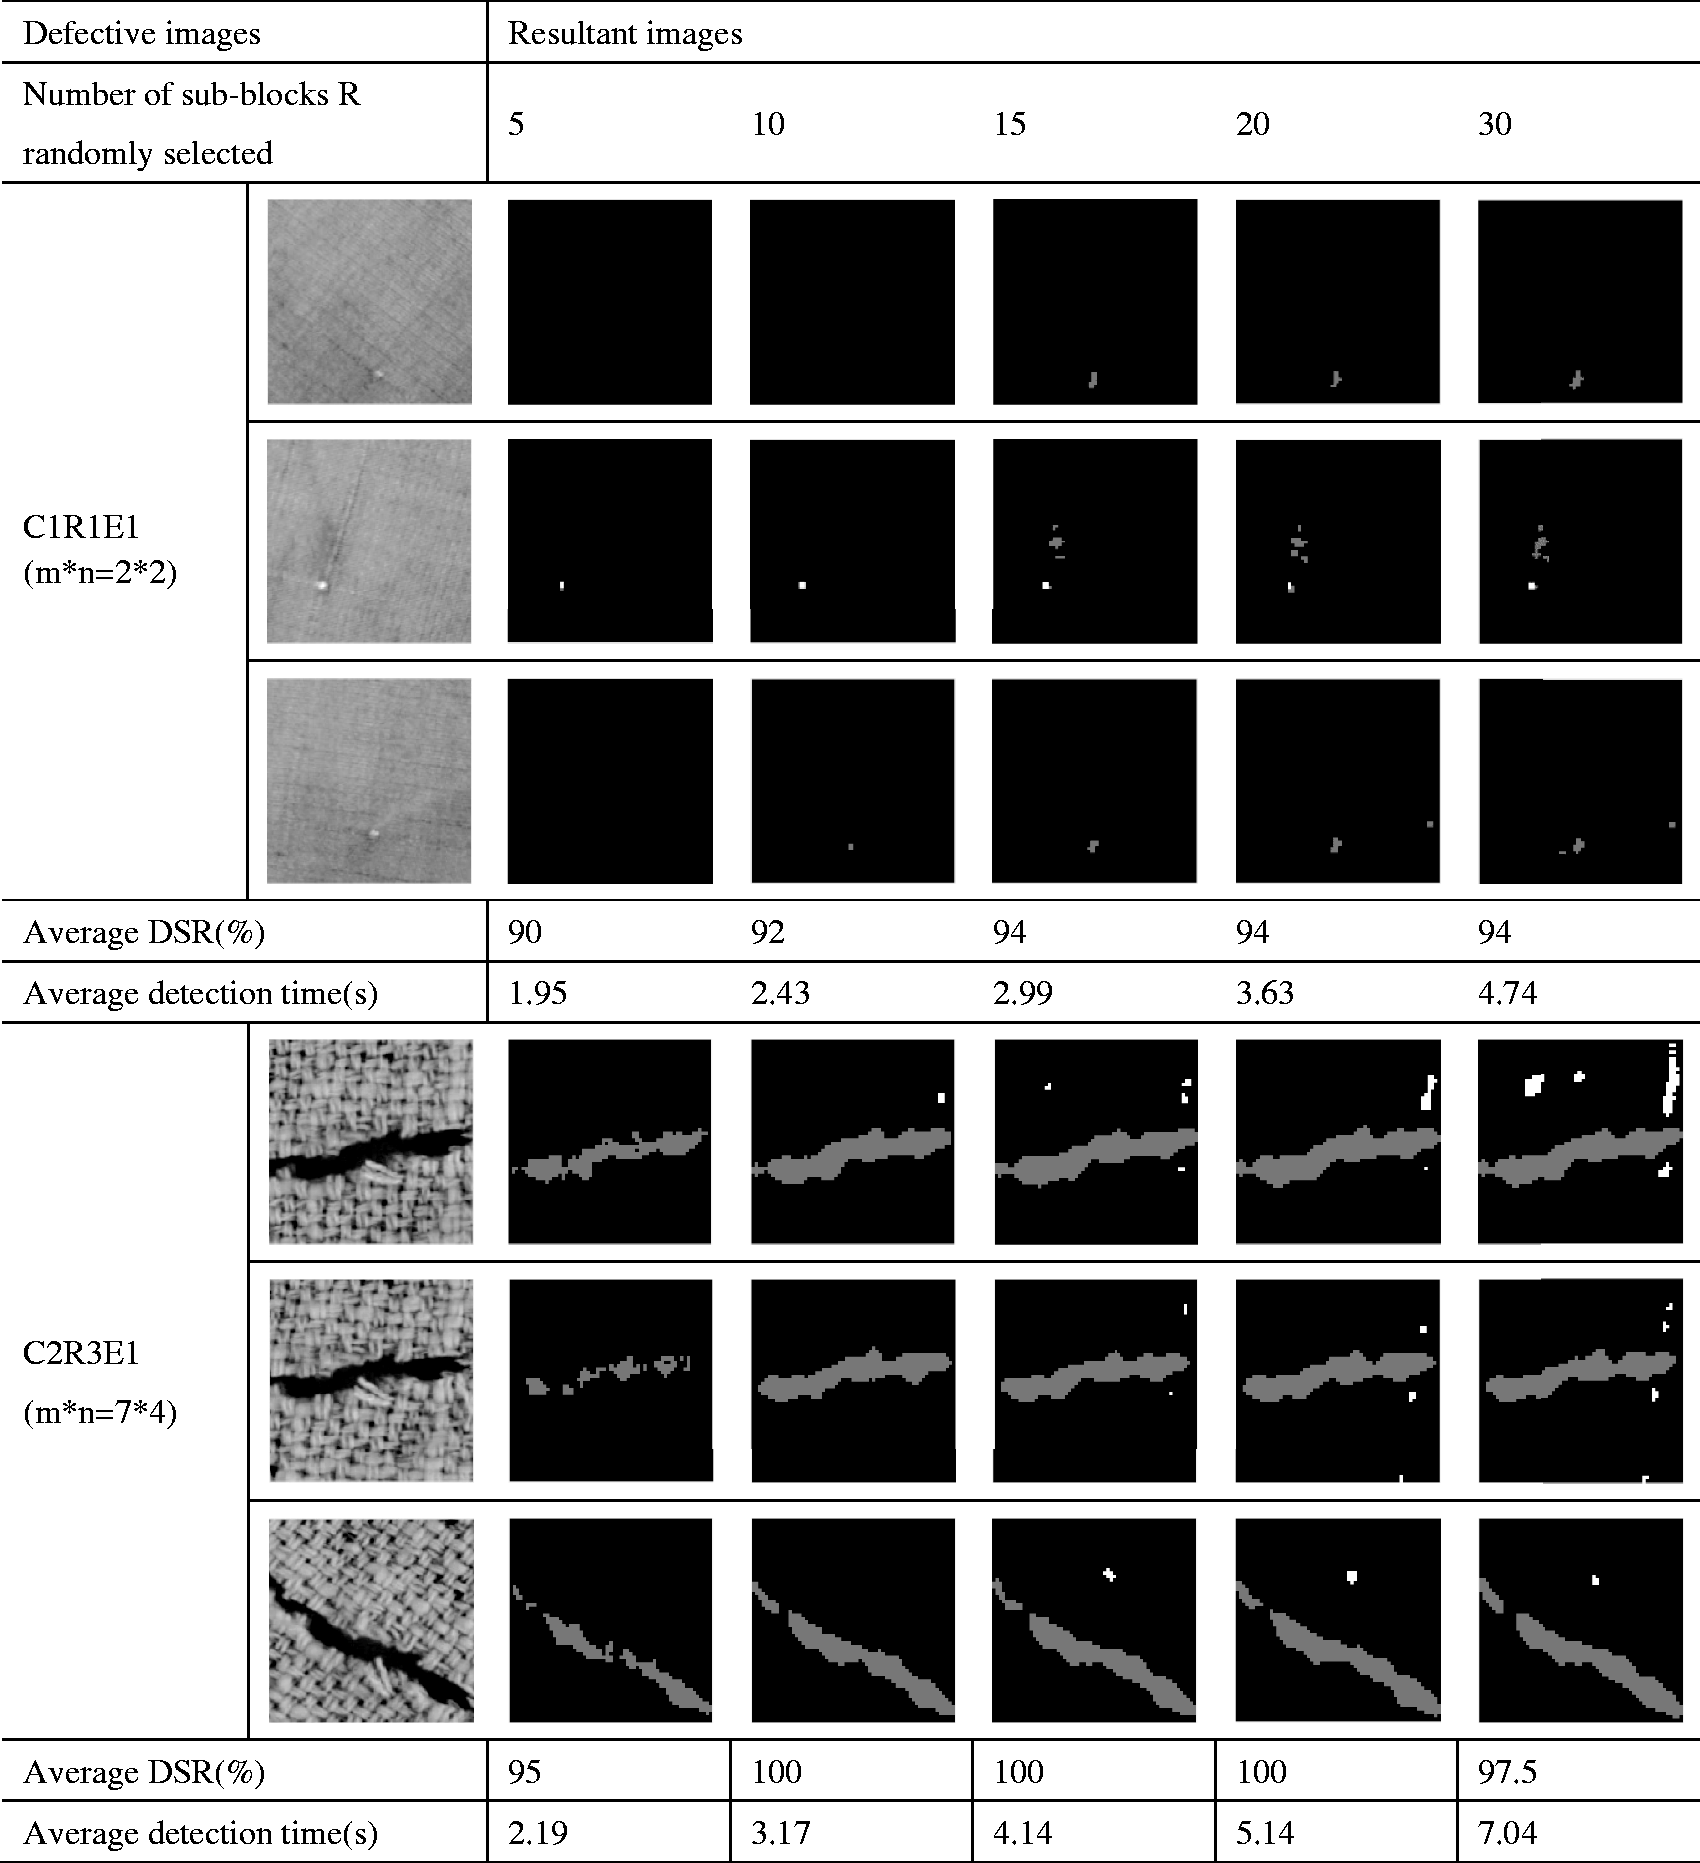
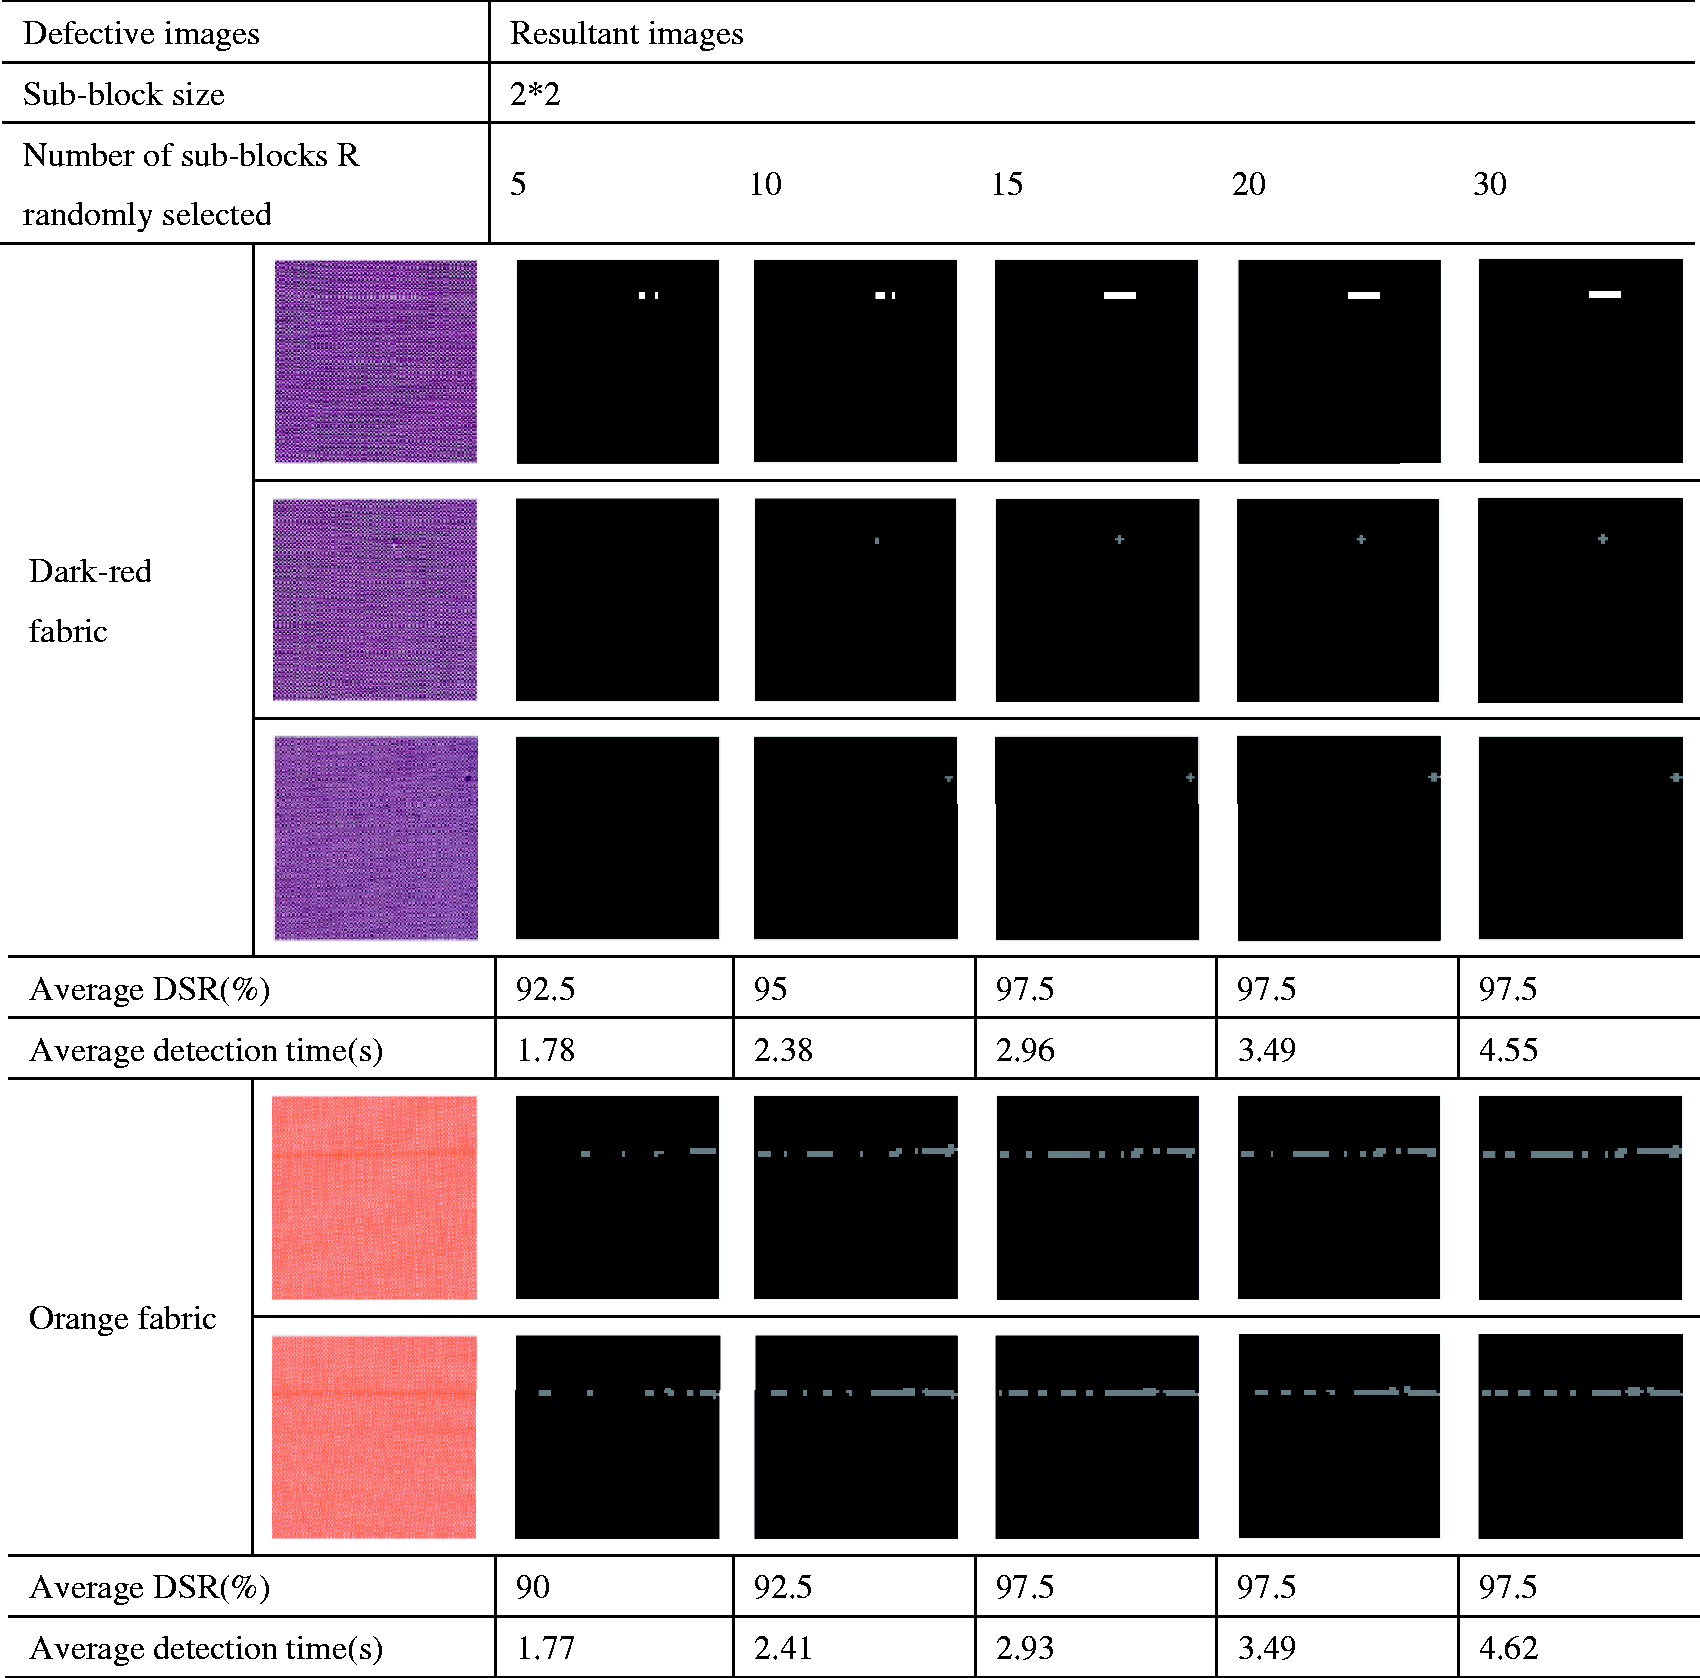
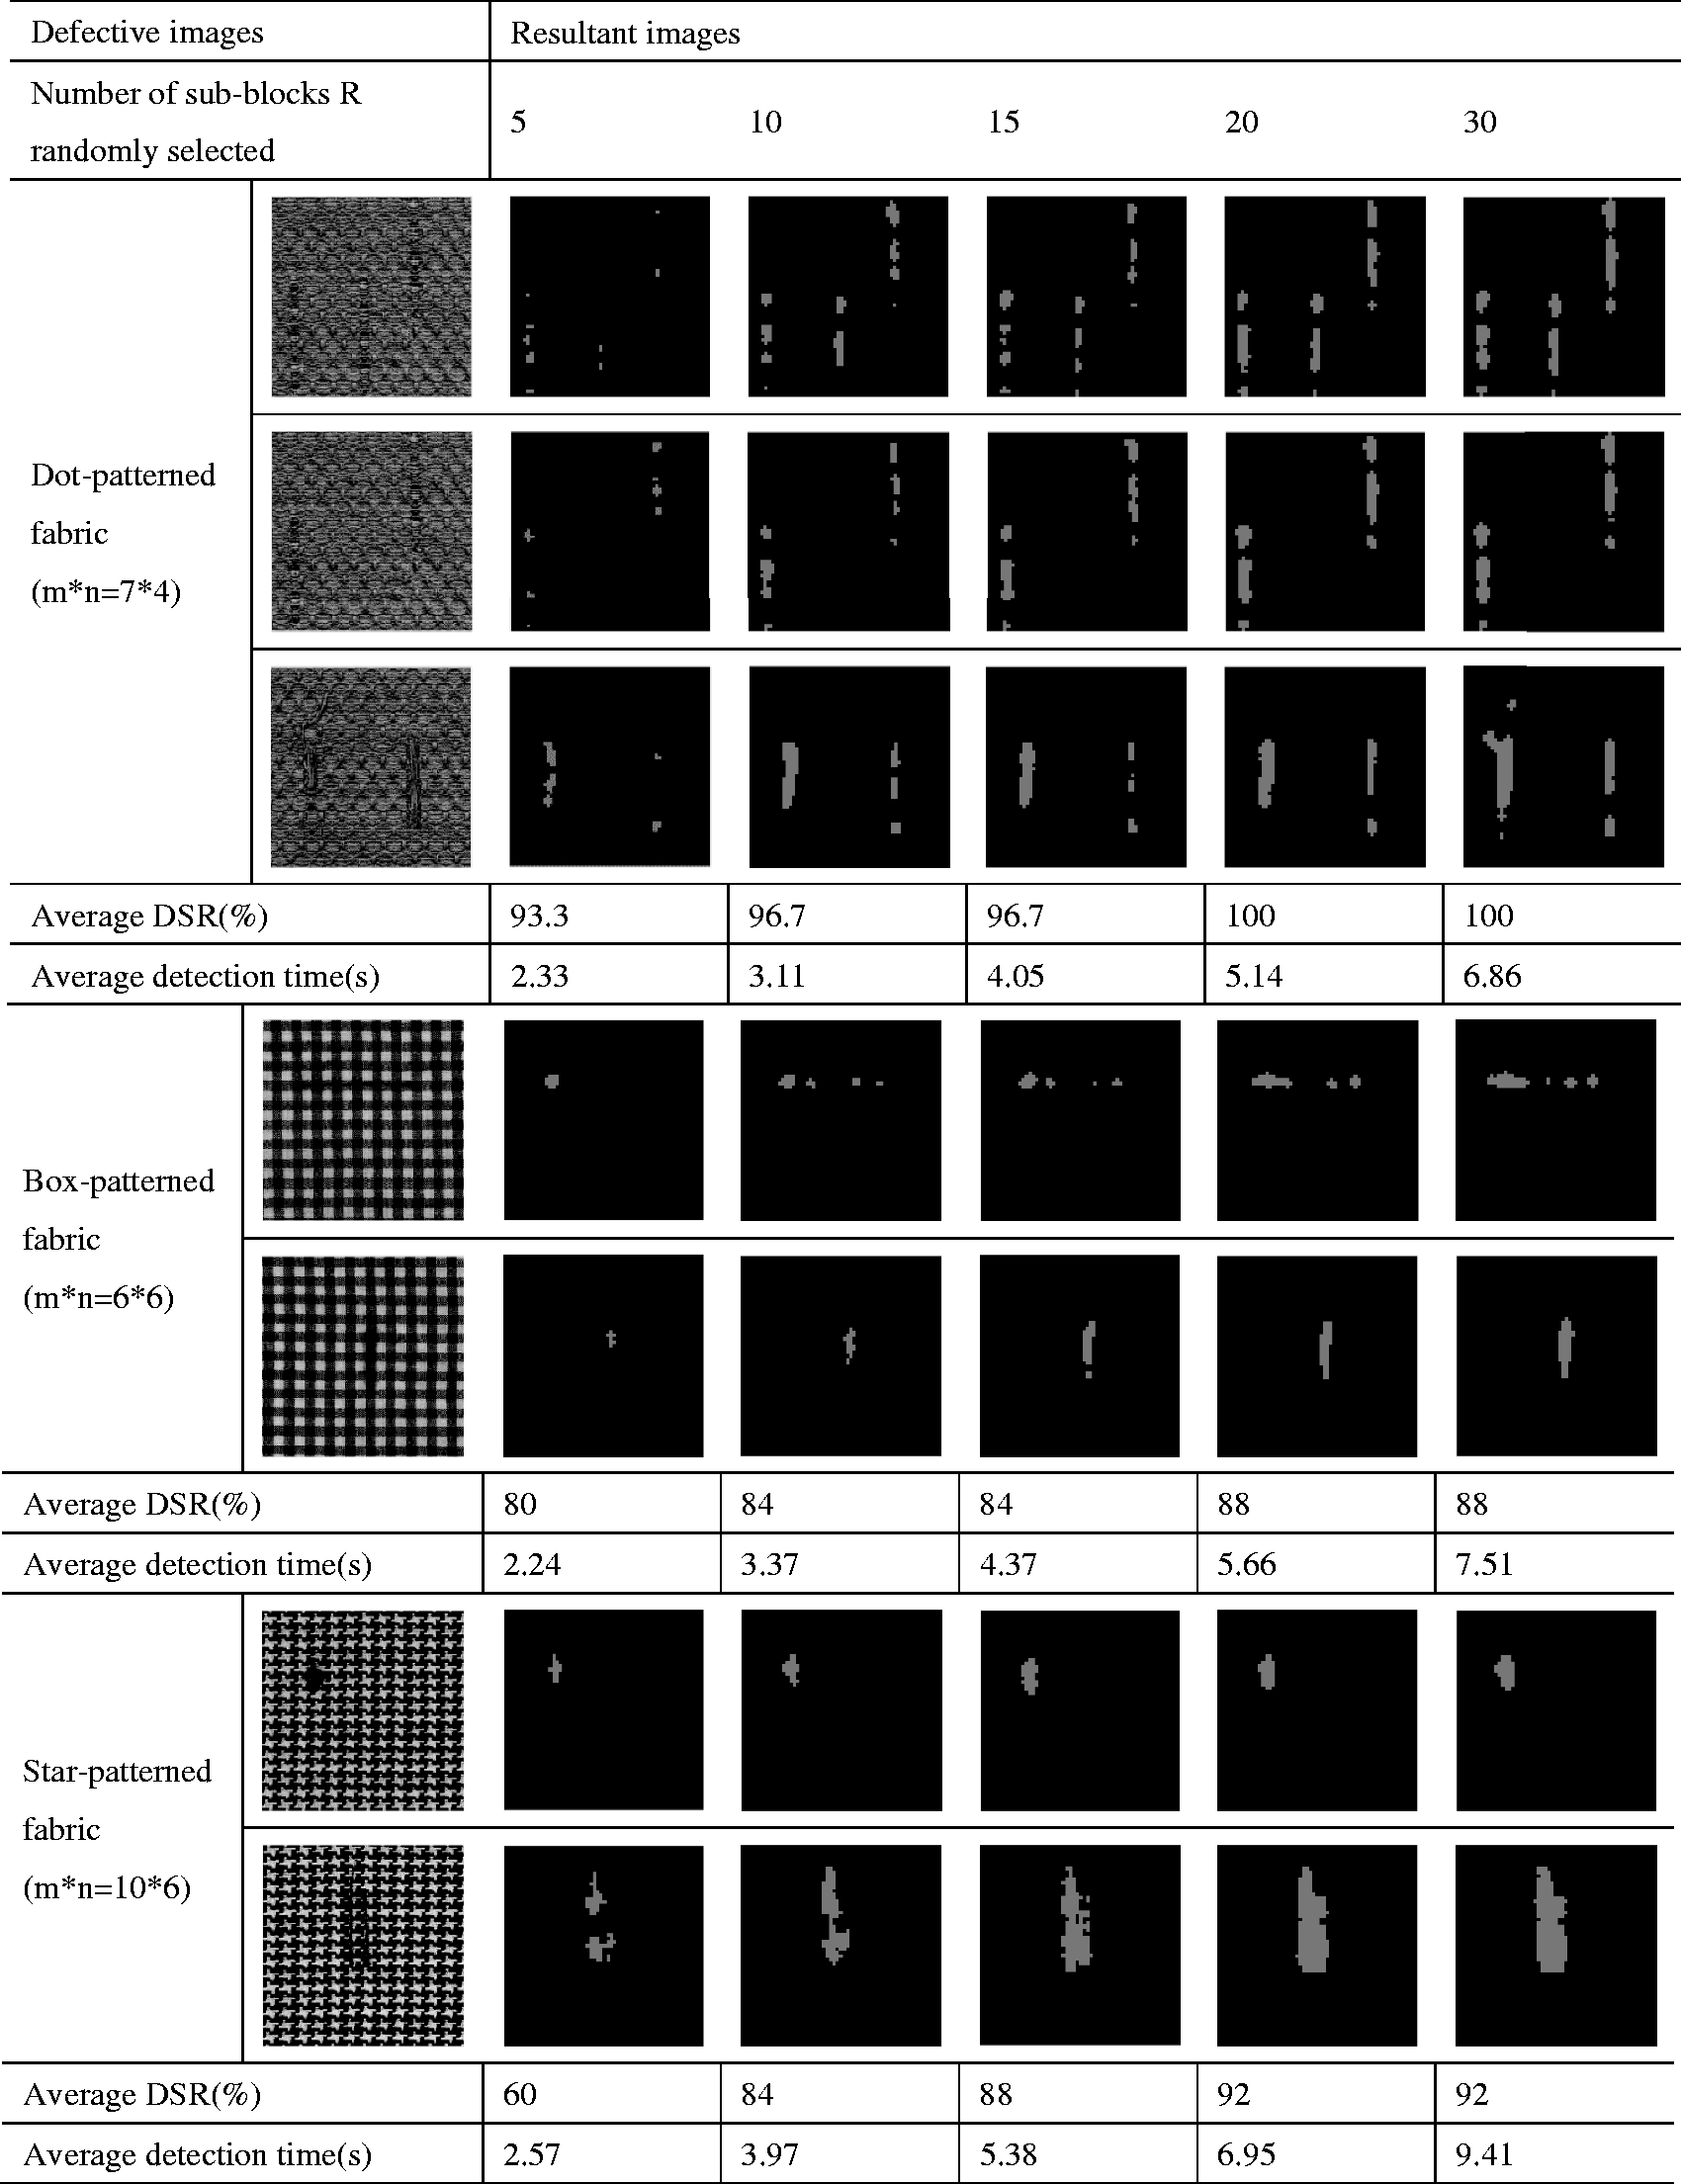
As can be seen from Figures 6–8, if the size of the sub-blocks of different types of fabrics is set to a fixed value, the number of randomly selected sub-blocks R will have a great impact on the detection results, and the defect area will increase with the increase of the number of sub-blocks R randomly selected. If the value of R is too small, the training process will have poor applicability and the outline of the detected defects will probably be incomplete. On the contrary, if the value of R is too large, the training process will be time-consuming, which affects the speed of detection. In addition, the detected defect area will be much larger than the actual defect, and the detection results cannot really reflect the real characteristics of the contour and shape of the reactive defect.
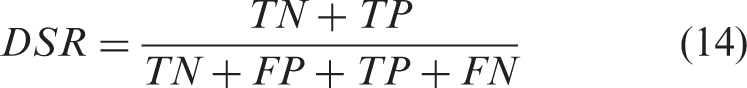
Definitions of TP, FP, TN, FN in defect detection
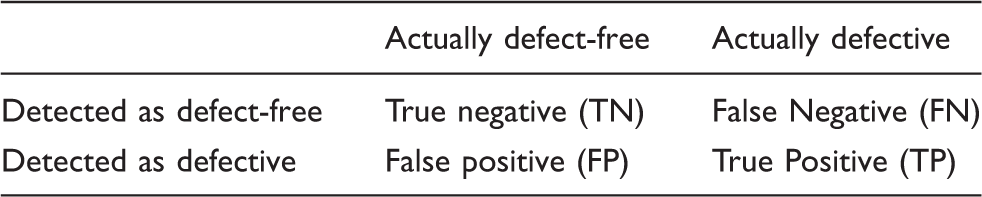
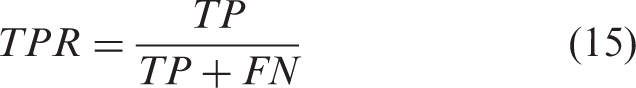
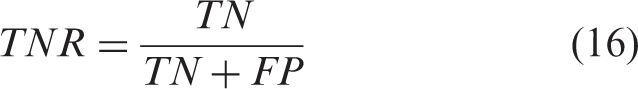
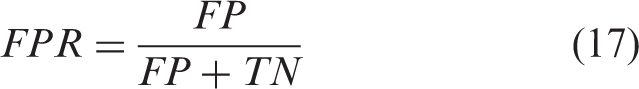
The DSR, TPR, TNR, FPR can be defined as Equations (14)–(17), respectively
In order to analyze the influence of the number of sub-blocks R randomly selected on the DSR, the C2R2 raw fabric is used as an example to analyze the relationship between the number of sub-blocks R randomly selected and the DSR, TPR, TNR and FPR. The reason for using the C2R2 raw fabric as an example is that the four types of defects included in the C2R2 raw fabric have the same parameter selection in the detection. The results are easy to compare.
The numerical results between the detection success rate (DSR), True Positive Rate (TPR), False Positive Rate (FPR) and True Negative Rate (TNR) versus randomly selected sub-blocks R
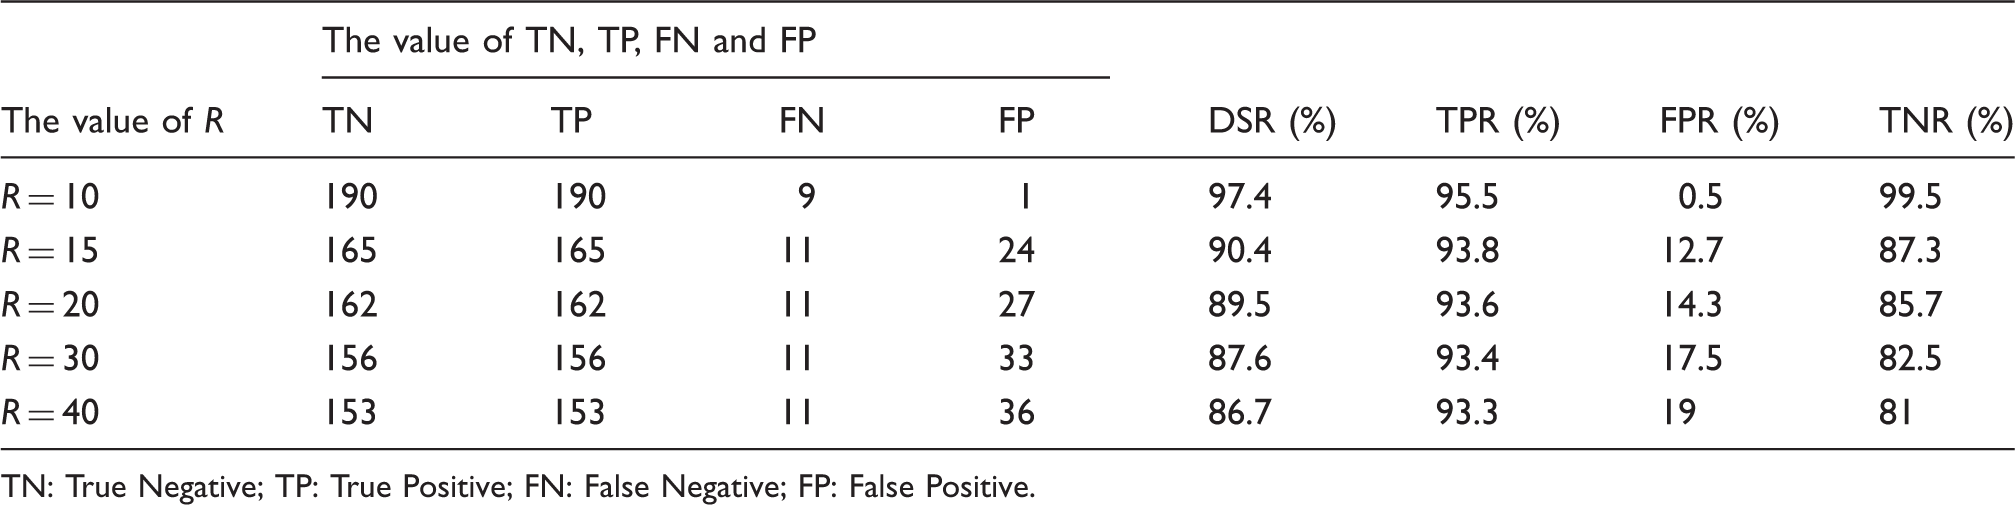
TN: True Negative; TP: True Positive; FN: False Negative; FP: False Positive.
The relationship between the DSR, TPR, FPR and TNR versus randomly selected sub-blocks R is shown in Figure 9. It can be seen from Figure 9 that when R is 10, the DSR, TPR and TNR are all particularly high. This shows that the detection effect is the best, which further proves that the parameters are selected properly.
The relationship between the detection success rate (DSR), True Positive Rate (TPR), False Positive Rate (FPR) and True Negative Rate (TNR) versus randomly selected sub-blocks R.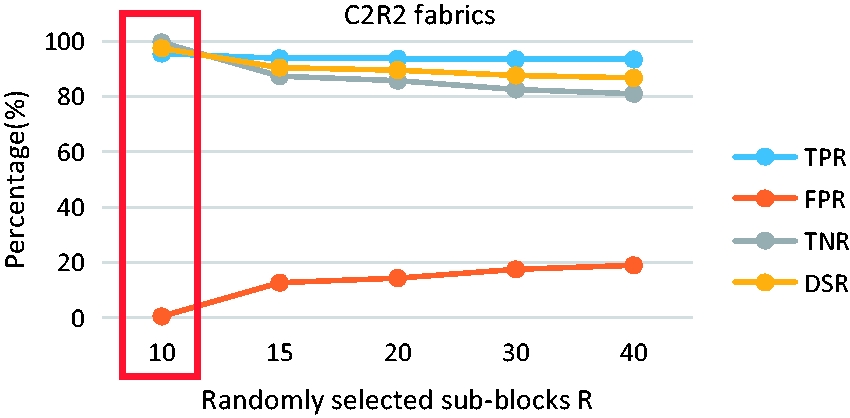
The selection of the size
of sub-blocks
Because different fabrics have different texture characteristics, for different fabrics and different defects, the selection of the size
In Figures 10–12, on the premise of a certain number of randomly selected sub-blocks R, we take five cases of The influence of the size of sub-blocks on the detection results of raw fabric. DSR: detection success rate. The influence of the size of sub-blocks on the detection results of yarn-dyed fabric. DSR: detection success rate. The influence of the size of sub-blocks on the detection results of patterned fabric. DSR: detection success rate.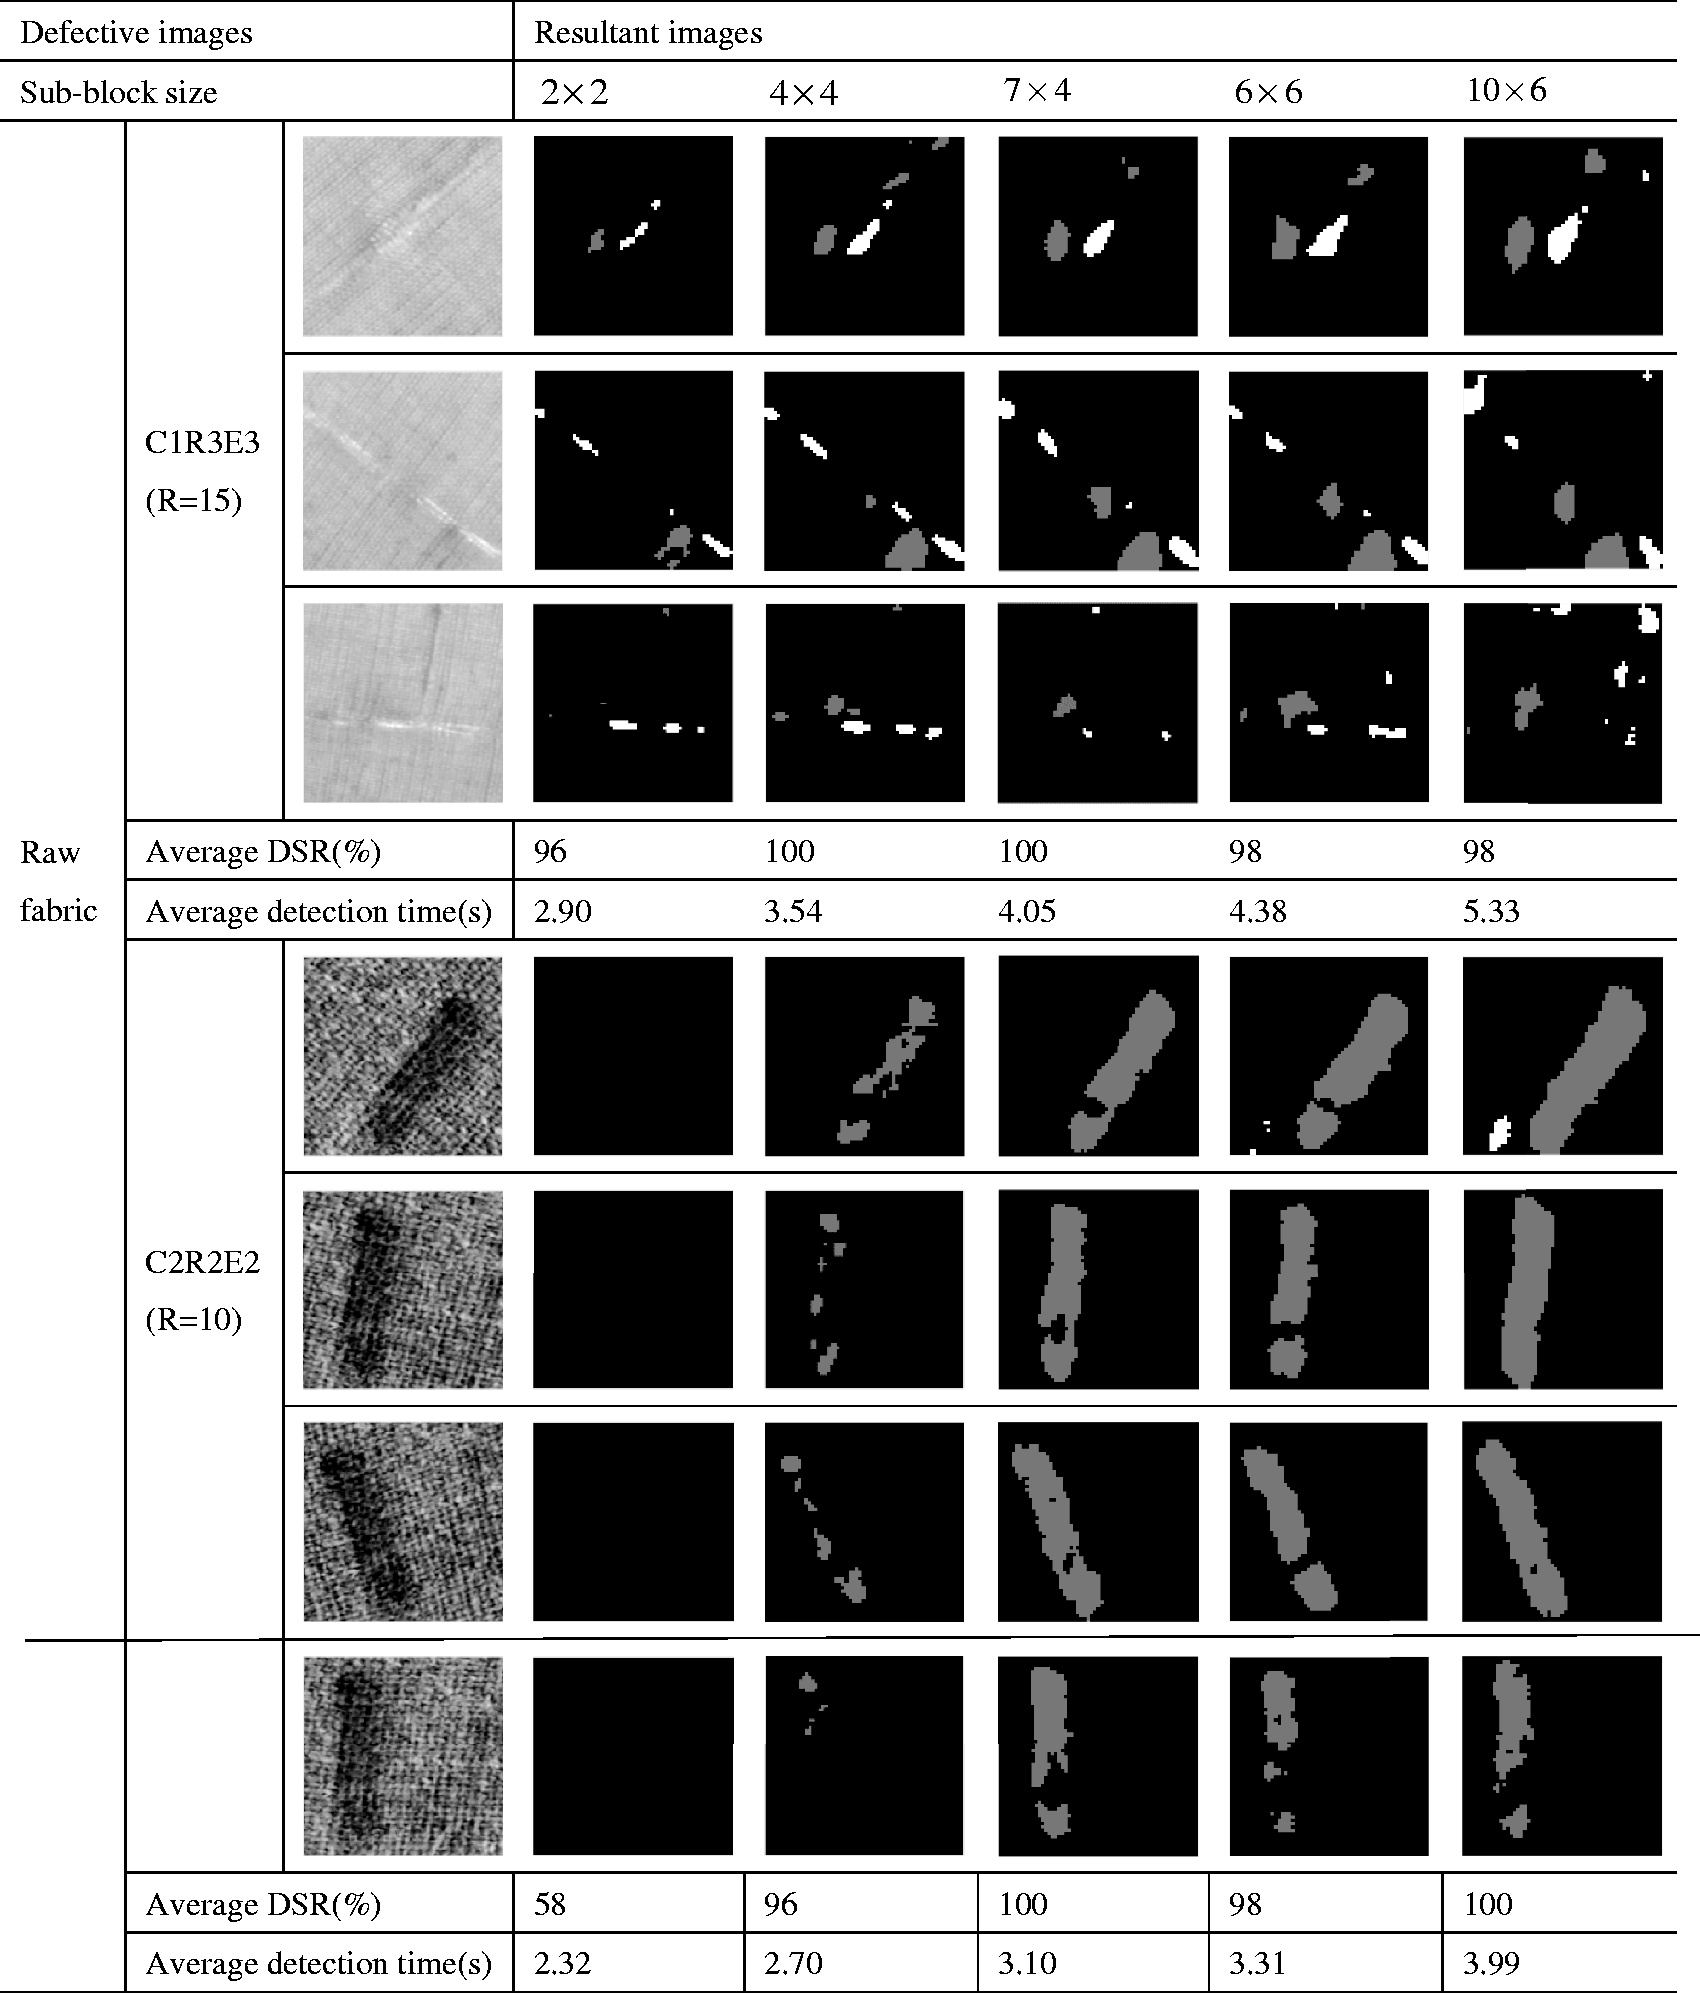
As can be seen from Figures 10–12, compared with the size of the texture unit of the sample itself, the sub-block size is too large or small to obtain good detection results. If sub-block size selection is not appropriate, not only can it not correctly reflect the original shape of the defect, but also it increases the probability of missed or false detection. Therefore, the sizes of the texture unit of different fabric samples determine the optimal size of the sub-blocks. Therefore, the selection of different fabric sub-block sizes is closely related to the size of the texture unit, density and yarn size of the fabric sample. The smaller the density, the finer the yarn, and the smaller the sub-block will be. Because small sub-blocks are enough to show the fine features of the fabric, if larger sub-blocks are selected, there is the possibility of false detection. On the contrary, the higher the density and the thicker the yarn, the larger the sub-block will be. Too small a sub-block cannot fully reflect the characteristics of the fabric, resulting in the possibility of missing inspection.
Figure 13 illustrates the DSR, TPR, FPR and TNR plots of the effect of the sub-block size The relationship between the detection success rate (DSR), True Positive Rate (TPR), False Positive Rate (FPR) and True Negative Rate (TNR) versus the size of sub-blocks for (a) dot-patterned fabrics, (b) box-patterned fabrics and (c) star-patterned fabrics.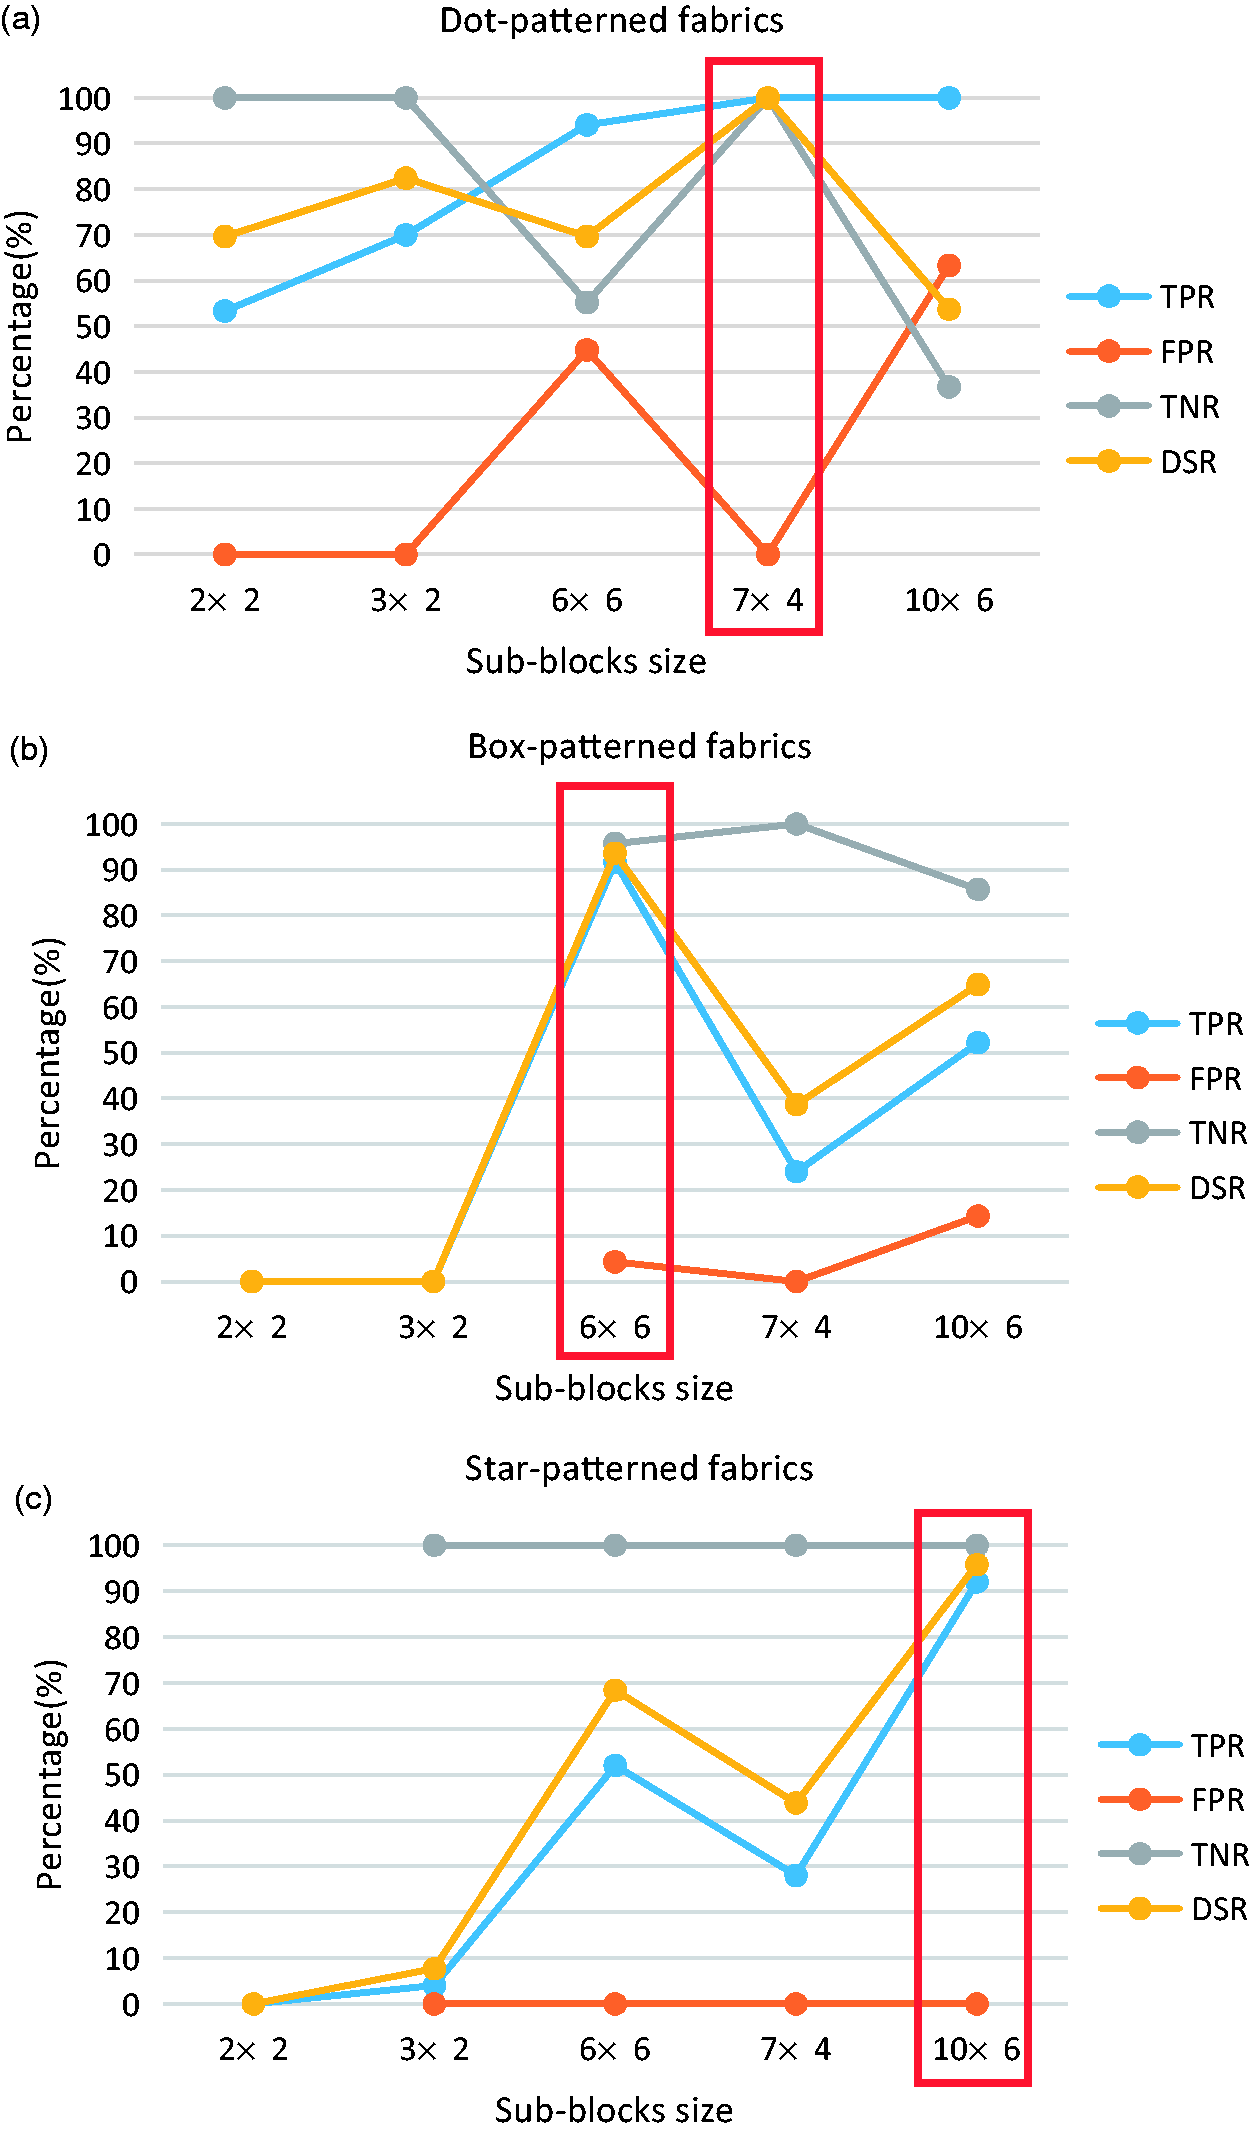
For the box-patterned fabrics, when
The experimental results show that the IIER proposed in this paper can not only detect the defect accurately, but also enhance the versatility greatly. In particular, the detection method greatly shortens the detection time and improves the rapidity of detection. The algorithm is effective for detecting raw fabric, and also has a good detection effect in yarn-dyed fabric and patterned fabric. It improves the disadvantage of poor versatility of the defect detection algorithm, and has very important research value.
Detection results and analysis
In this paper, the IIER method is applied to detect raw fabric, yarn-dyed fabric and patterned fabric. In this paper, the detected fabric images contain 1545 samples, with 1280 defective and 265 defect-free samples. Among them, the raw fabric images contain 1000 samples, with 800 defective and 200 defect-free samples. The yarn-dyed fabric images contain 450 samples, with 400 defective and 50 defect-free samples. The patterned fabric images contain 95 samples, with 80 defective and 15 defect-free samples. The sample size of the three types of fabric images is 256 × 256 pixels. The raw fabrics contain four types of defects (namely Hole, Oil Spots, Thread Errors, Objects on the Surface). The yarn-dyed fabrics contain several kinds of common defects (such as Belt Yarn, Knots, Thick Bar, Broken Warp, Broken Pick, Oil Stain and so on). The patterned fabrics contain six types of defects (namely Broken End, Hole, Netting Multiple, Thick Bar, Thin Bar, Knots).
The defect detection of raw fabric
In the experiment, the algorithm is used to detect the defect samples in the TILDA fabric sample database. The TILDA fabric sample database is a standard fabric defect sample database, which contains two groups of fabric samples, C1 and C2. Fabric group C1 contains fabric images of uniform texture with fine yarns and thin texture, so their fabric density is high, such as woven fabrics. Fabric group C2 contains fabric images of visible texture with thick yarns and grid-like structures; thus, their fabric density is small, such as knitted fabrics. Fabric groups C1 and C2 were composed of 400 defective samples and 100 defect-free samples, respectively. The defect types of C1 and C2 include Holes (E1), Oil Spots (E2), Thread Errors (E3) and Objects on the Surface (E4). The defect detection results of raw fabric are shown in Figure 14.
The defect detection results of raw fabric.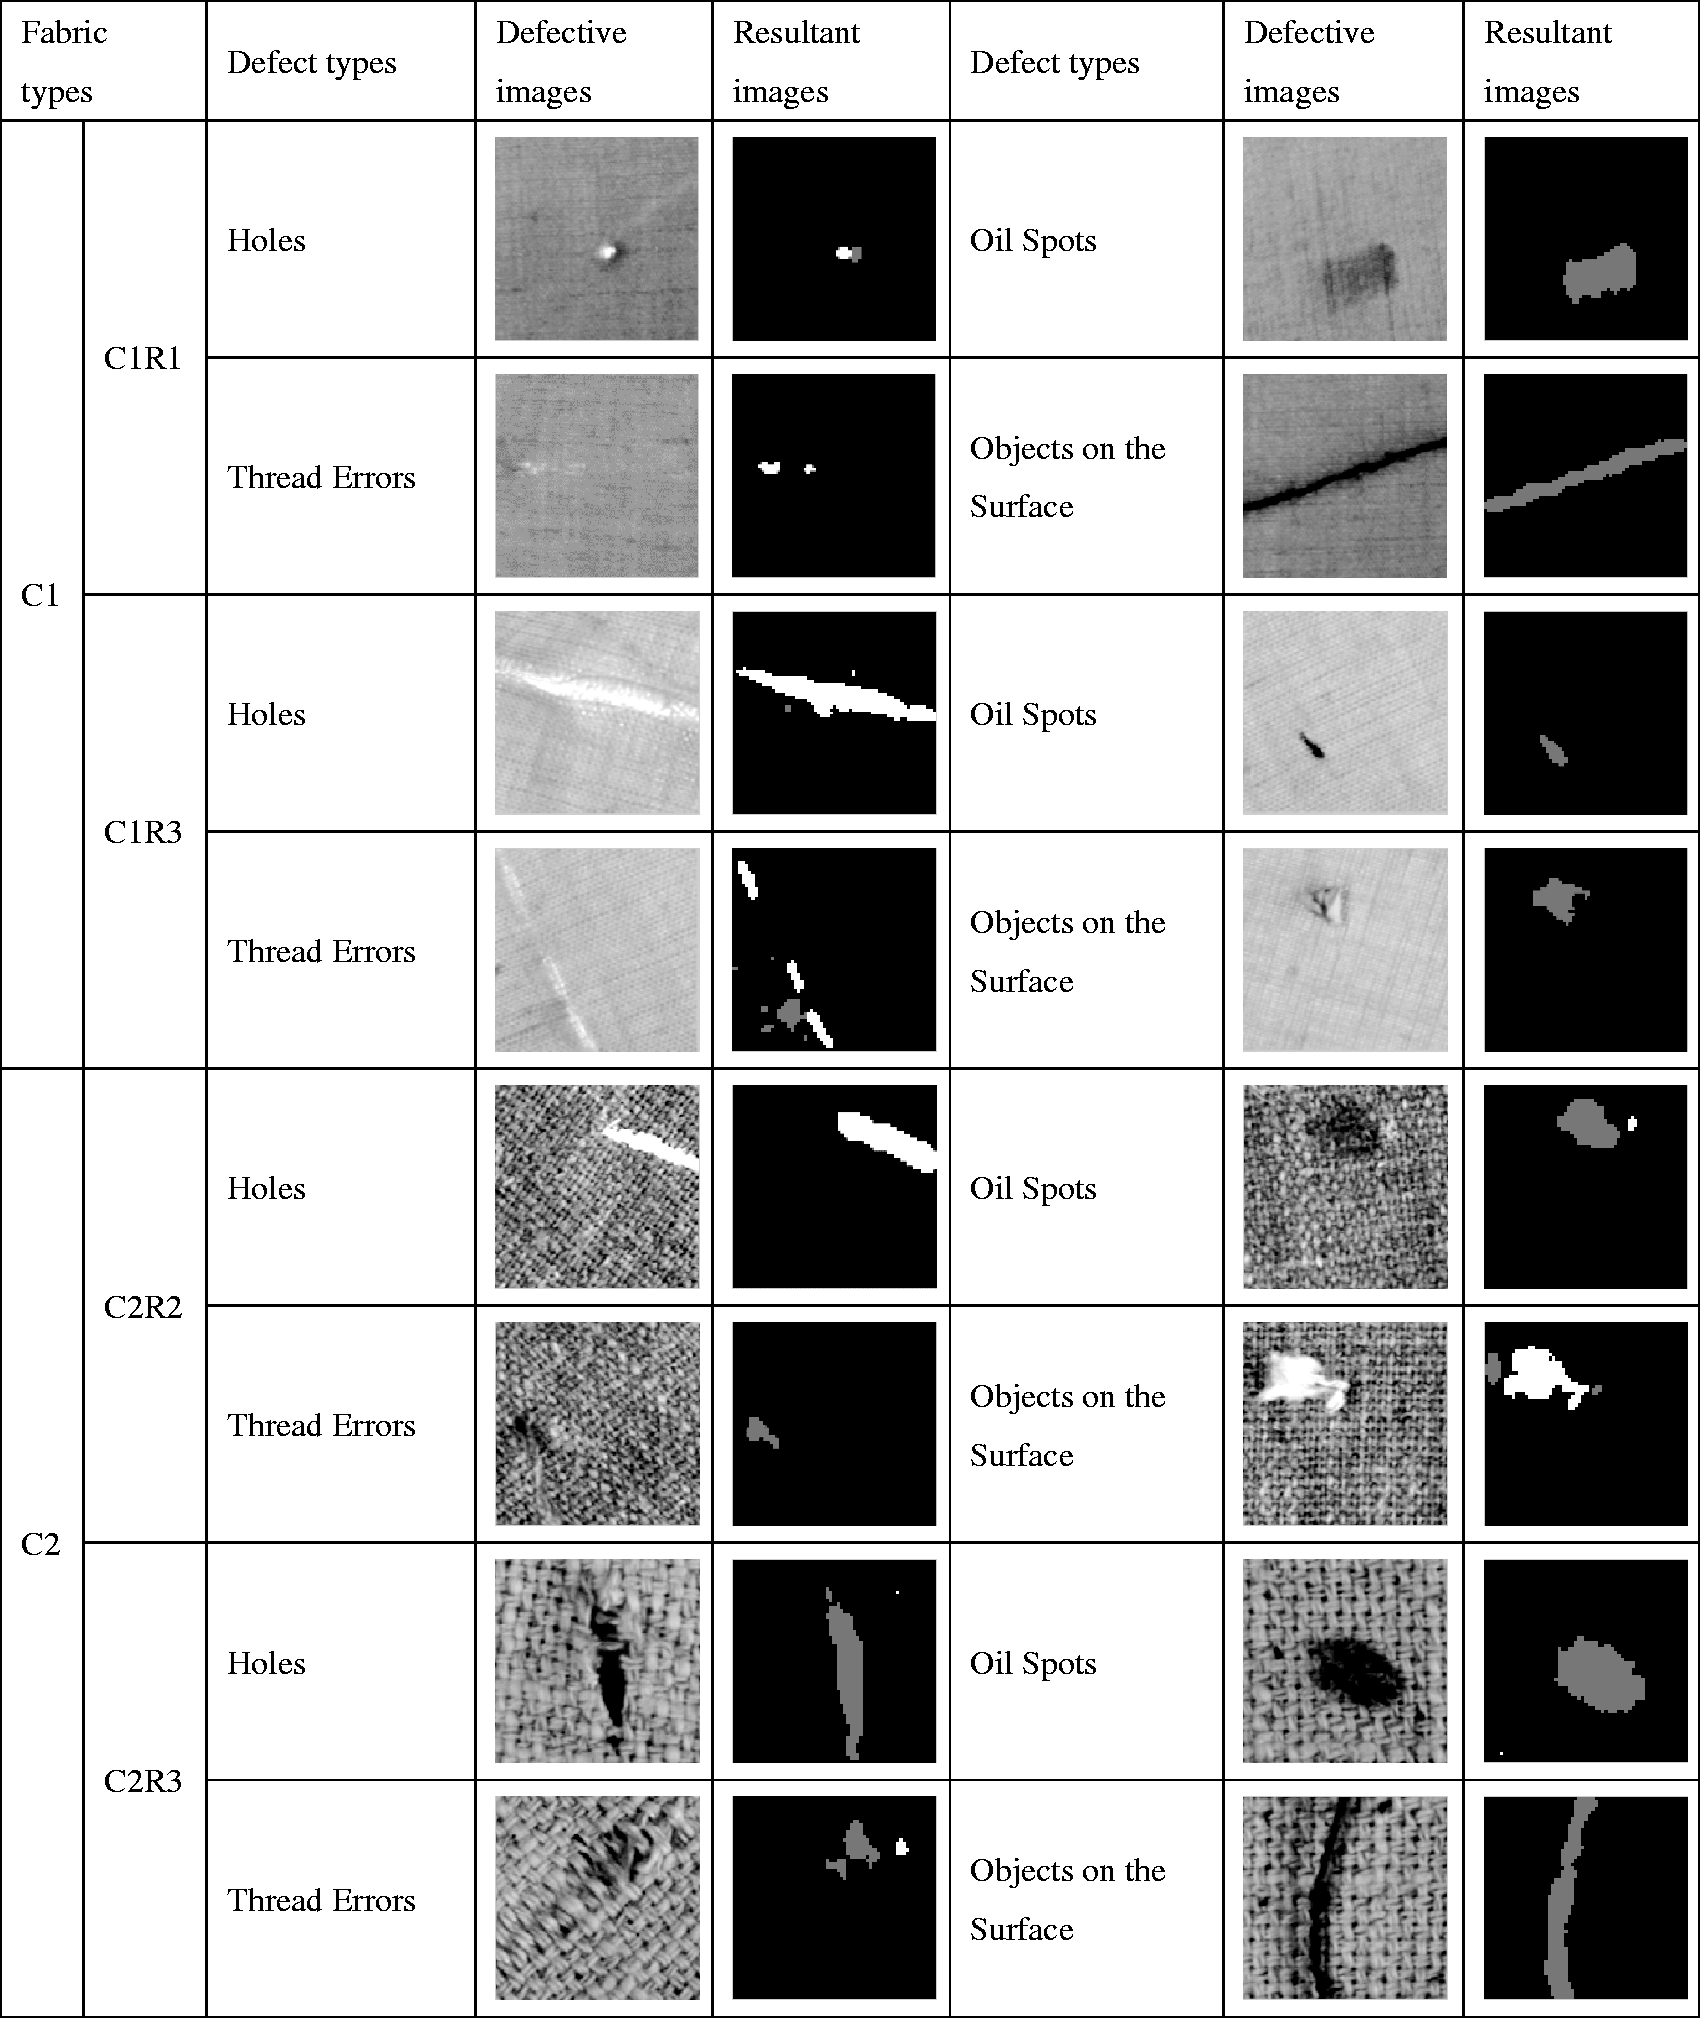
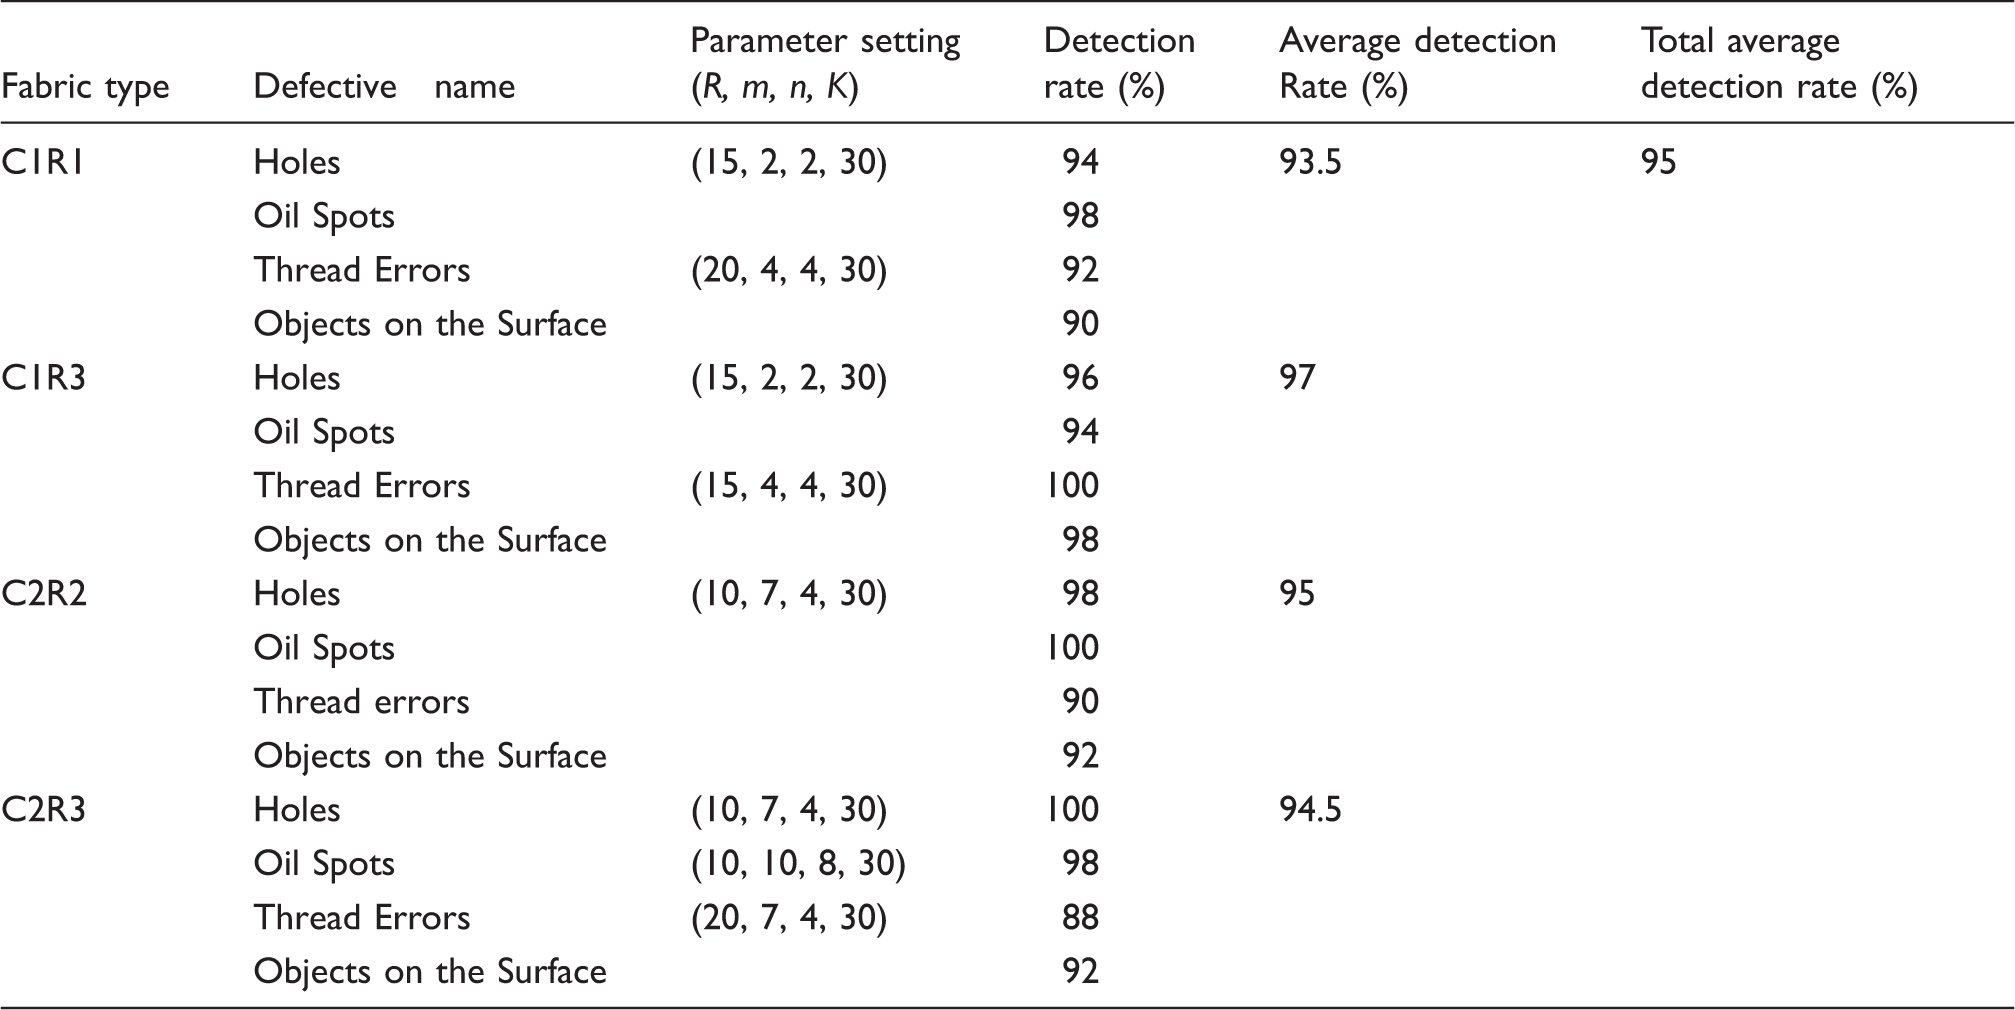
Defect detection rate of two groups, C1 and C2
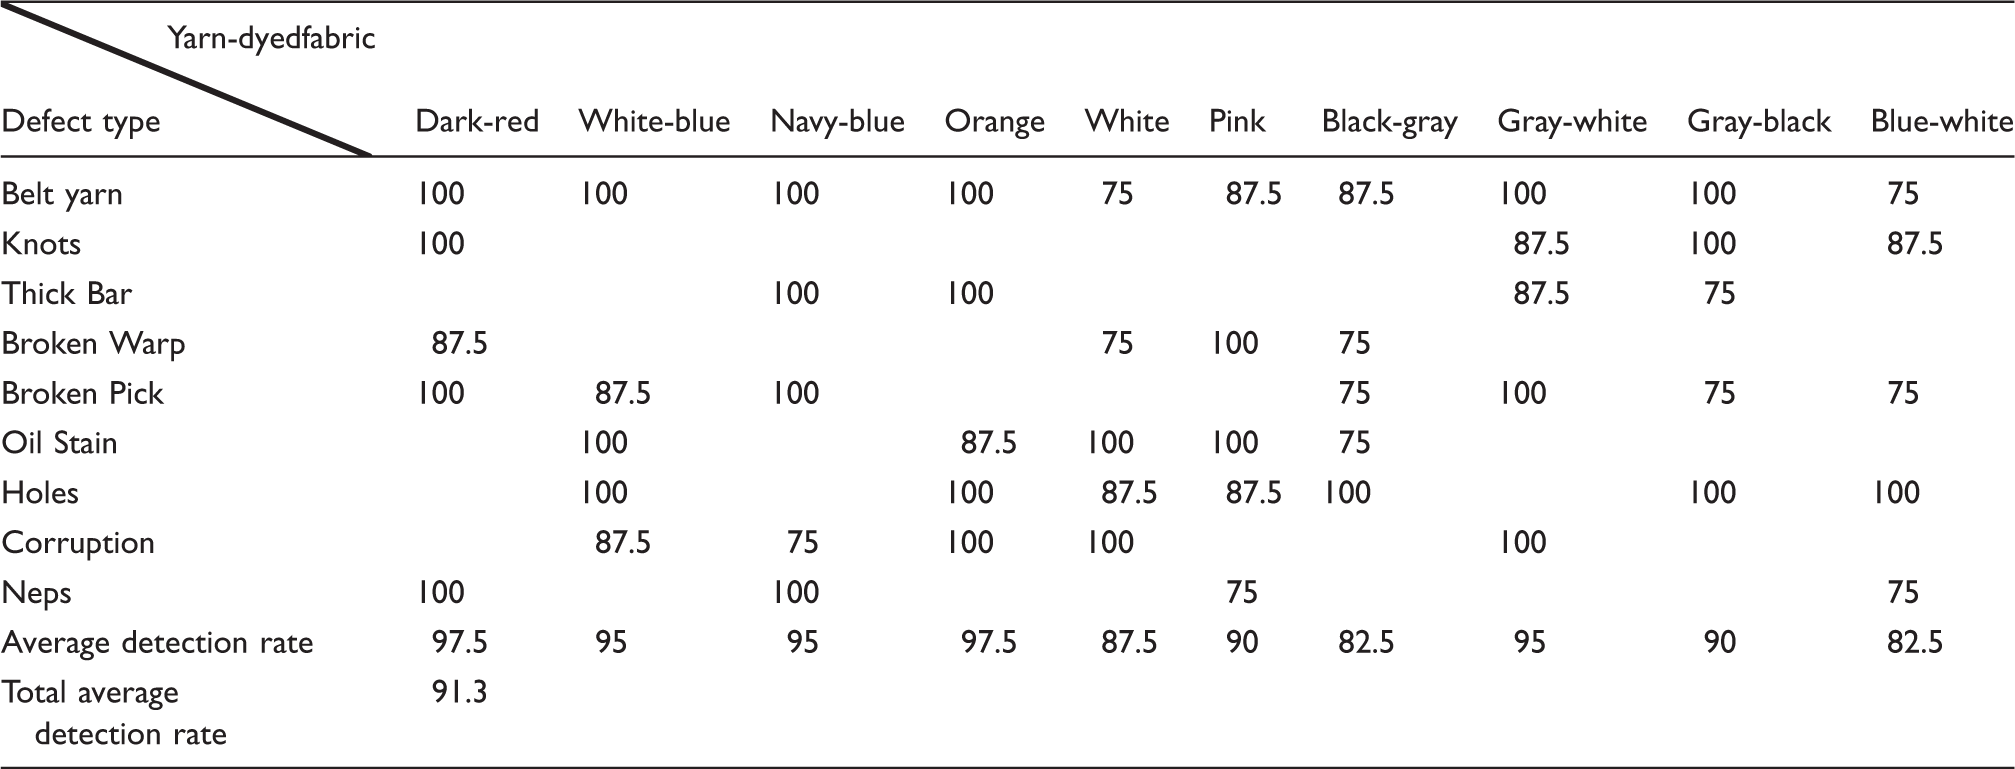
The defect detection of yarn-dyed fabric
In order to test the effectiveness of the algorithm, yarn-dyed fabric is used as the second type of detection objects. Fabric images with 10 different colors are detected, respectively, including dark-red, white-blue, navy-blue, orange, white, pink, gray-white, gray-black and so on. Since the yarns of the yarn-dyed fabric are relatively thin, yarn-dyed fabrics of different colors are close relatively in thickness, and the yarn density is also uniform. Therefore, in the use of the IIER to detect fabric defects, their parameters are selected consistently. The sub-block size The defect detection results of yarn-dyed fabric: (first, third and fifth columns) defective images; (second, fourth and sixth columns) detection results.
Defect detection rate (%) of yarn-dyed fabric
The defect detection of patterned fabric
Through the detection of two different types of fabric samples, it is proved that the IIER has good detection performance. In order to verify the versatility of the algorithm better, patterned fabric is selected as the third kind of detection object. The detected samples consist of three types of fabric: dot-patterned, star-patterned and box-patterned. Among them, star-patterned and box-patterned fabrics contain five kinds of defect types: Broken End, Hole, Netting Multiple, Thick Bar and Thin Bar. In addition to the five kinds of defect types above, dot-patterned fabric also includes the defect of Knots, a total of six kinds of defect types. Each kind of defect type includes five tested samples, so there is a total of 80 samples.
The repeated pattern is made up of repeated cells, and the patterned fabric is formed by translation and rotation of these cells. Considering the particularity of patterned fabric texture, the effective size of the sub-blocks is set based on the texture features of three different patterns of fabric and the size of their repeated cells in our experiments. The defect detection results of patterned fabric are shown in Figure 16. Among them, the first column shows the defective names, the second, fourth and sixth columns show the defective images and the third, fifth and seventh columns show the detection results.
The defect detection results of patterned fabric: (first column) defective names; (second, fourth and sixth columns) defective images; (third, fifth and seventh columns) detection results.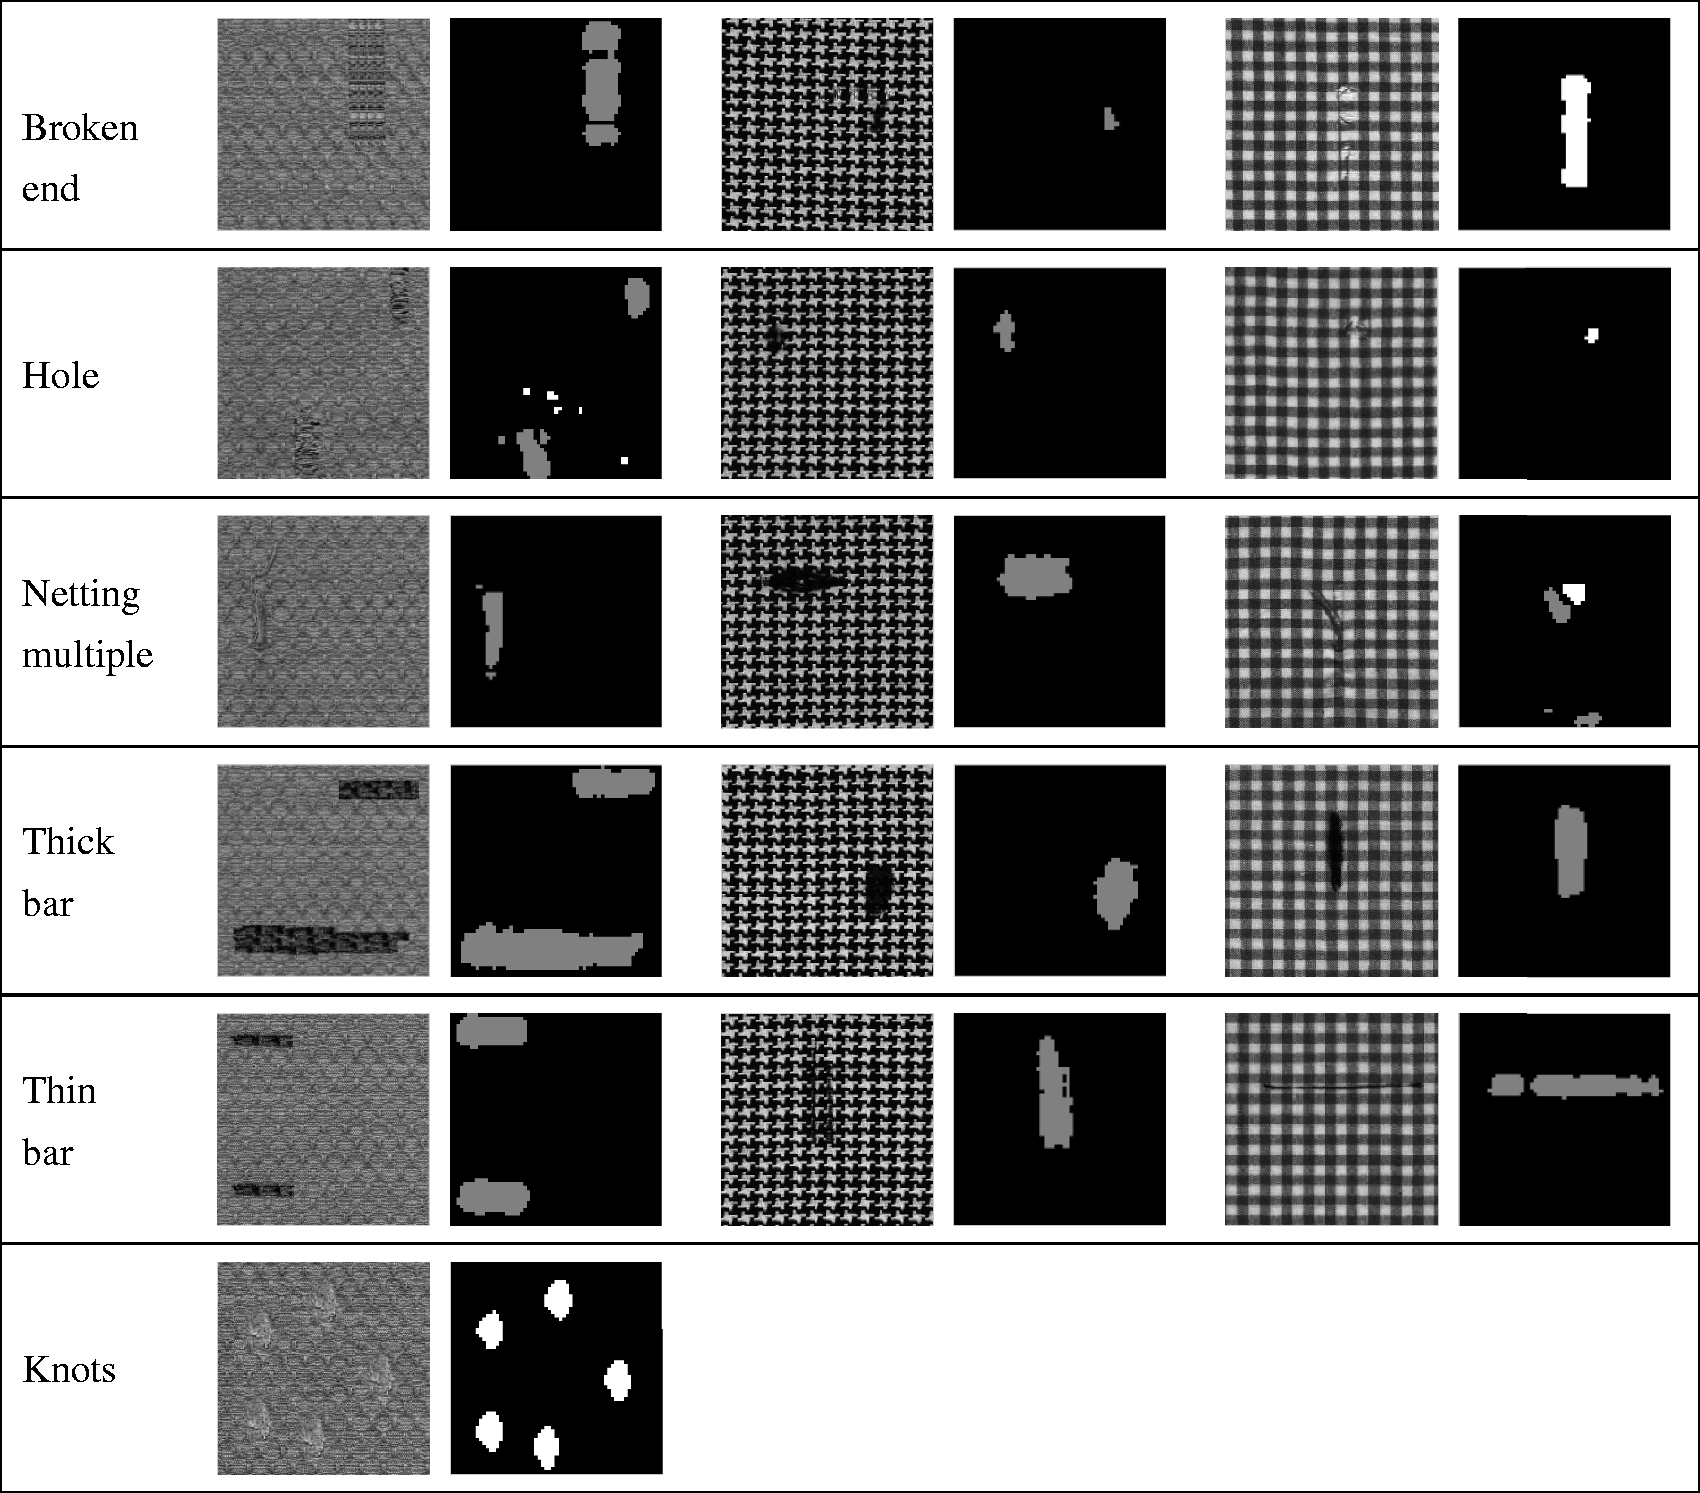
Defect detection rate (%) of patterned fabric
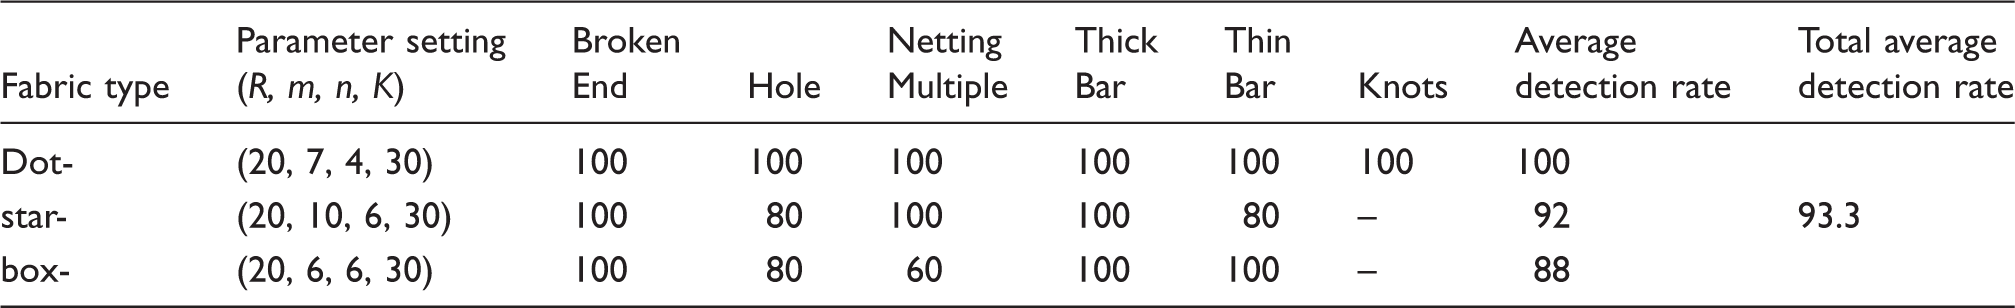
Through the statistical analysis of patterned fabric defect detection, the IIER has achieved ideal results in patterned fabric defect detection, which further proves that the algorithm has strong versatility and application value.
Results analysis and practical application
Results analysis
In this section, we compare the detection results of the proposed algorithm in this paper with those of other algorithms. In order to make a fair comparison, we only use the defect images employed by other algorithms for comparison. The results of the proposed method compared with other methods are shown in Figure 17.
The defect detection results analysis: (first column) defective sample names; (second column) defective images; (third column) detection results of the Frangi filtering method; (fourth column) detection results of the Expectation Maximization (EM) method; (fifth column) detection results of the Gabor method; (sixth column) detection results of the Vector Quantized Principal Component Analysis (VQPCA) method; (seventh column) detection results of the Elo-rating algorithm (ER) method; (eighth column) detection results of the Elo-rating algorithm of the integral image (IIER) method.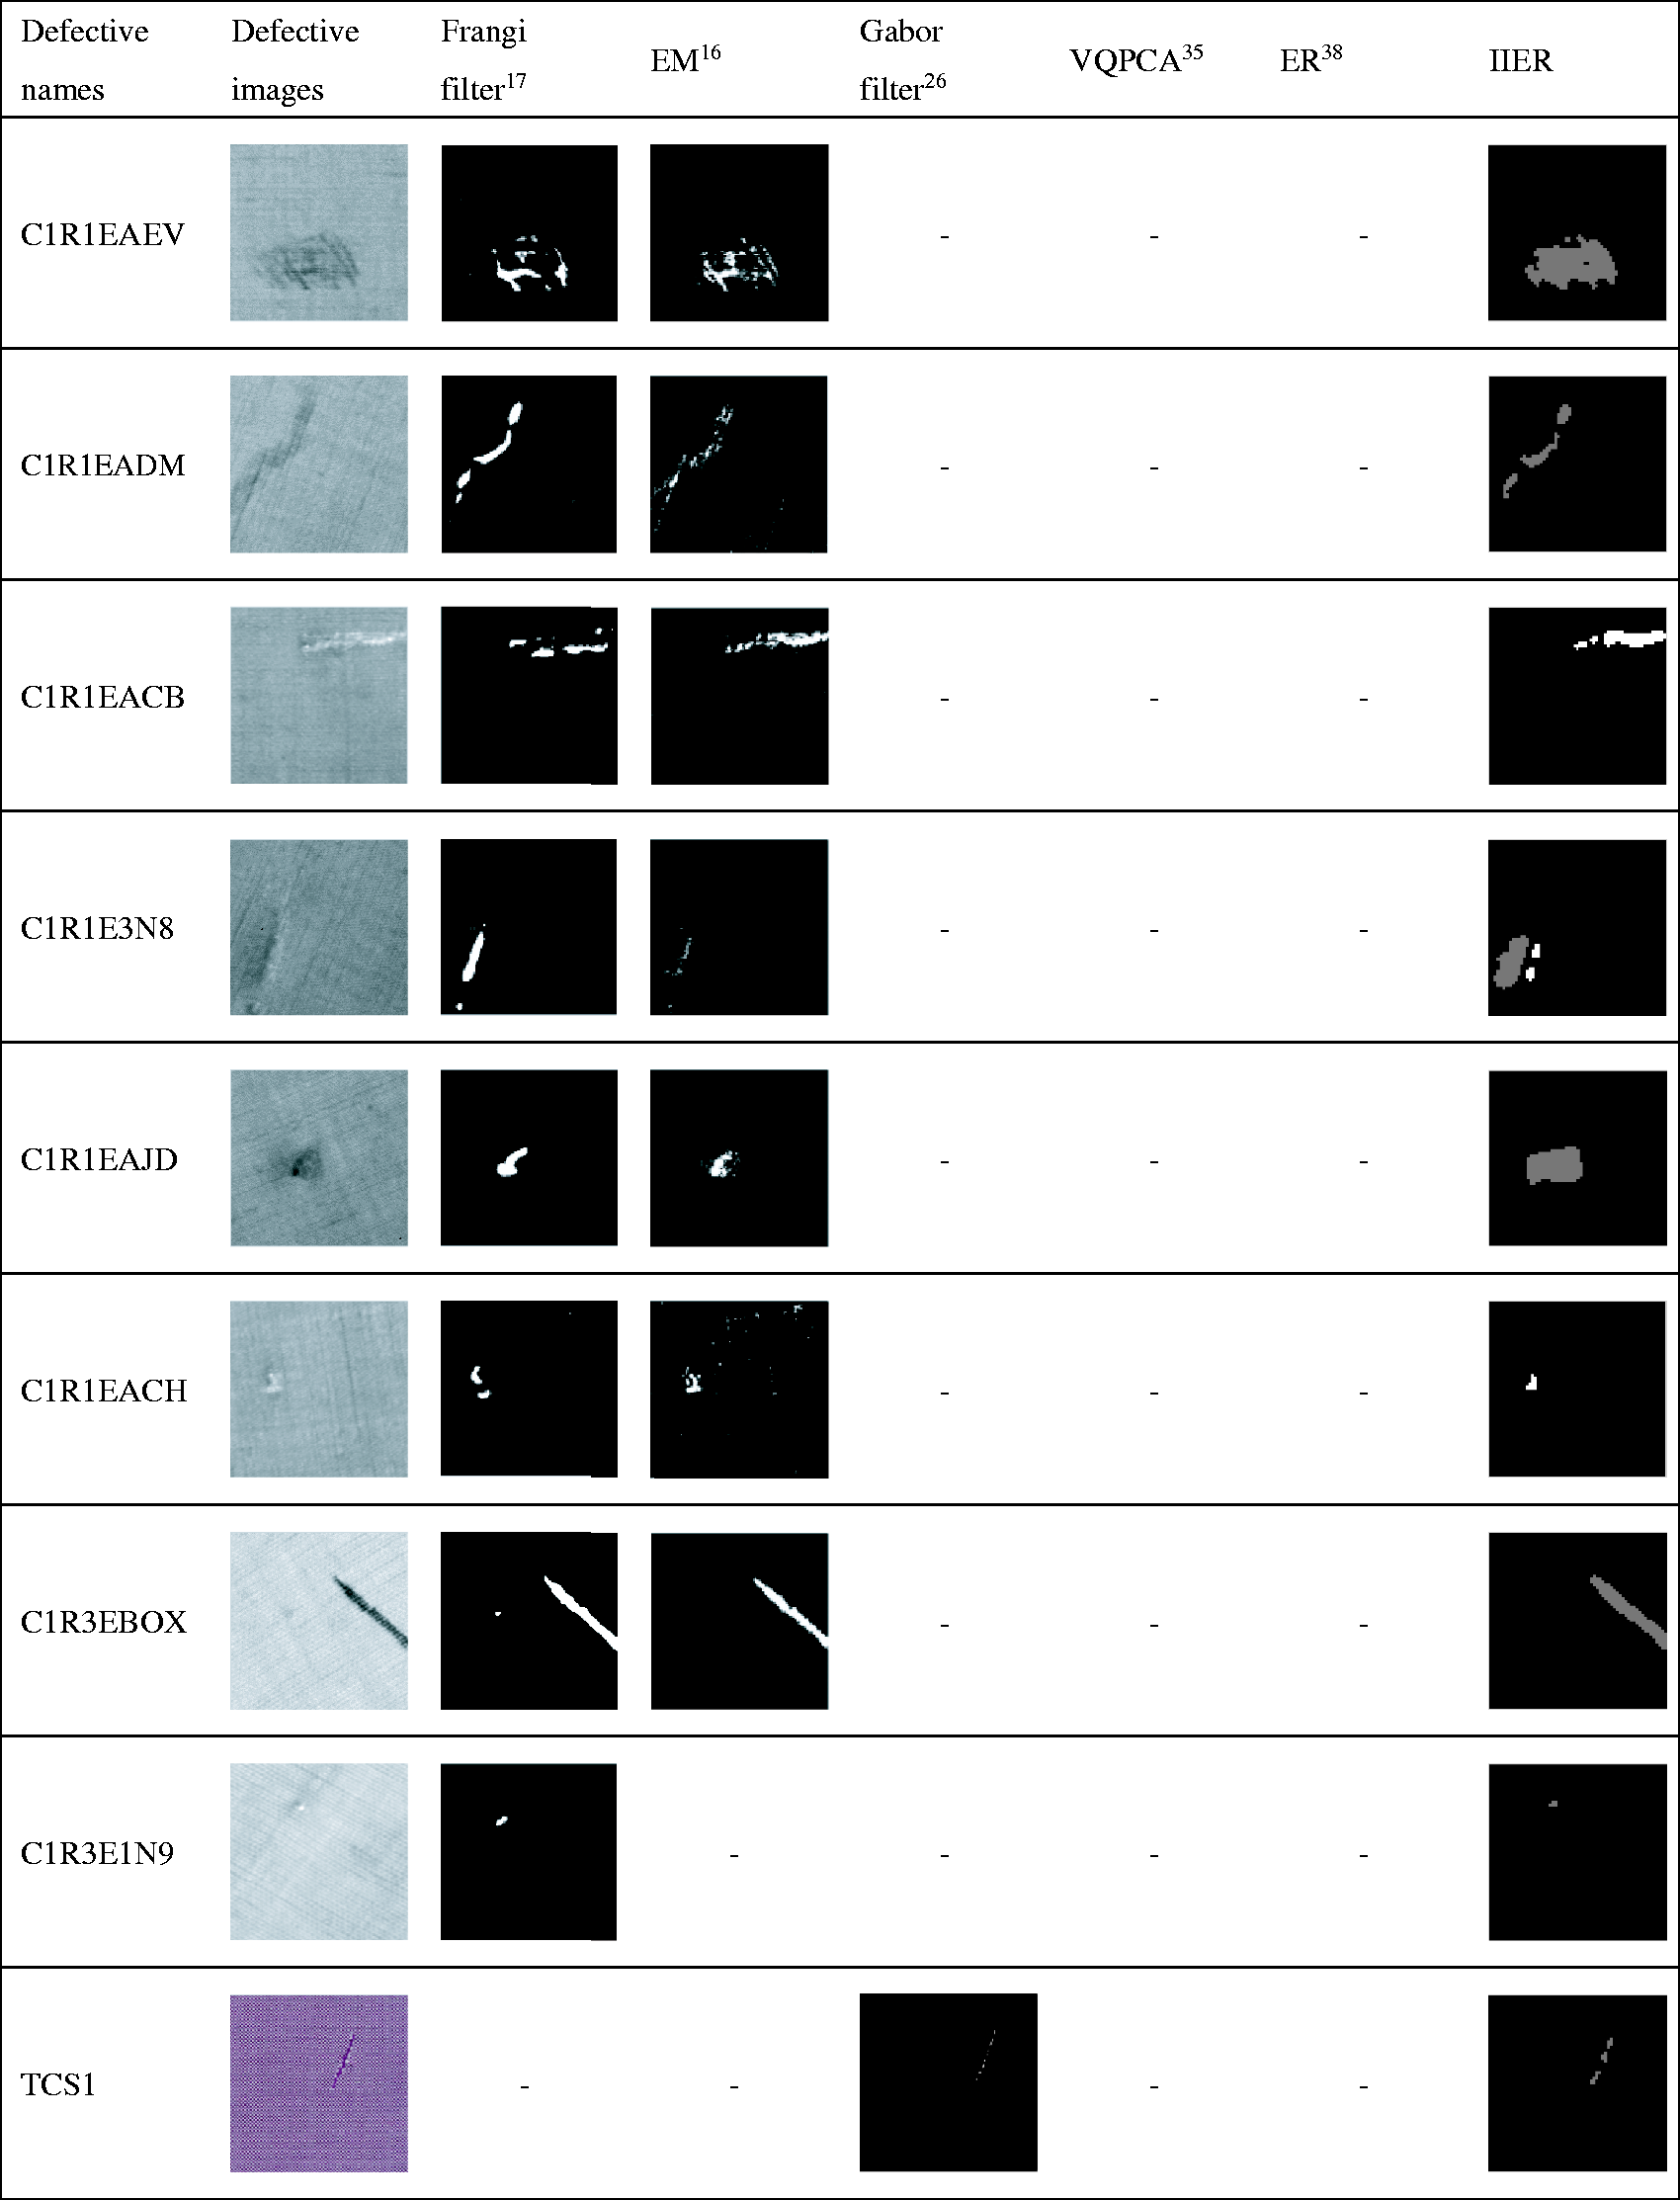
As can be seen from Figure 17, for the raw fabric, both the Frangi filter combined with the fuzzy C-means algorithm and the Expectation Maximization (EM) algorithm can detect defects accurately, but the outline of the defects detected are incomplete and even some noise may exist. In contrast, the IIER proposed in this paper is more prominent in the details of defects.
For yarn-dyed fabric, the Gabor filter is a commonly used method to detect the defects. However, its detection results are not satisfactory, especially for fabrics whose defects are not so obvious. The IIER is very good at defect detection.
For patterned fabric, we compared Vector Quantized Principal Component Analysis (VQPCA), the traditional ER and the IIER. It can be seen from the detection results that there is much noise in the detection process of the VQPCA algorithm. The ER and the IIER have similar detection results. However, the IIER is much better at showing the details of the defects. In addition, in the previous section we also mentioned that the IIER takes less detection time than the ER.
In general, the proposed IIER has achieved good detection results for each type of fabric defect, while other algorithms have their respective strengths and shortcomings; this proves the proposed algorithm has a strong universality.
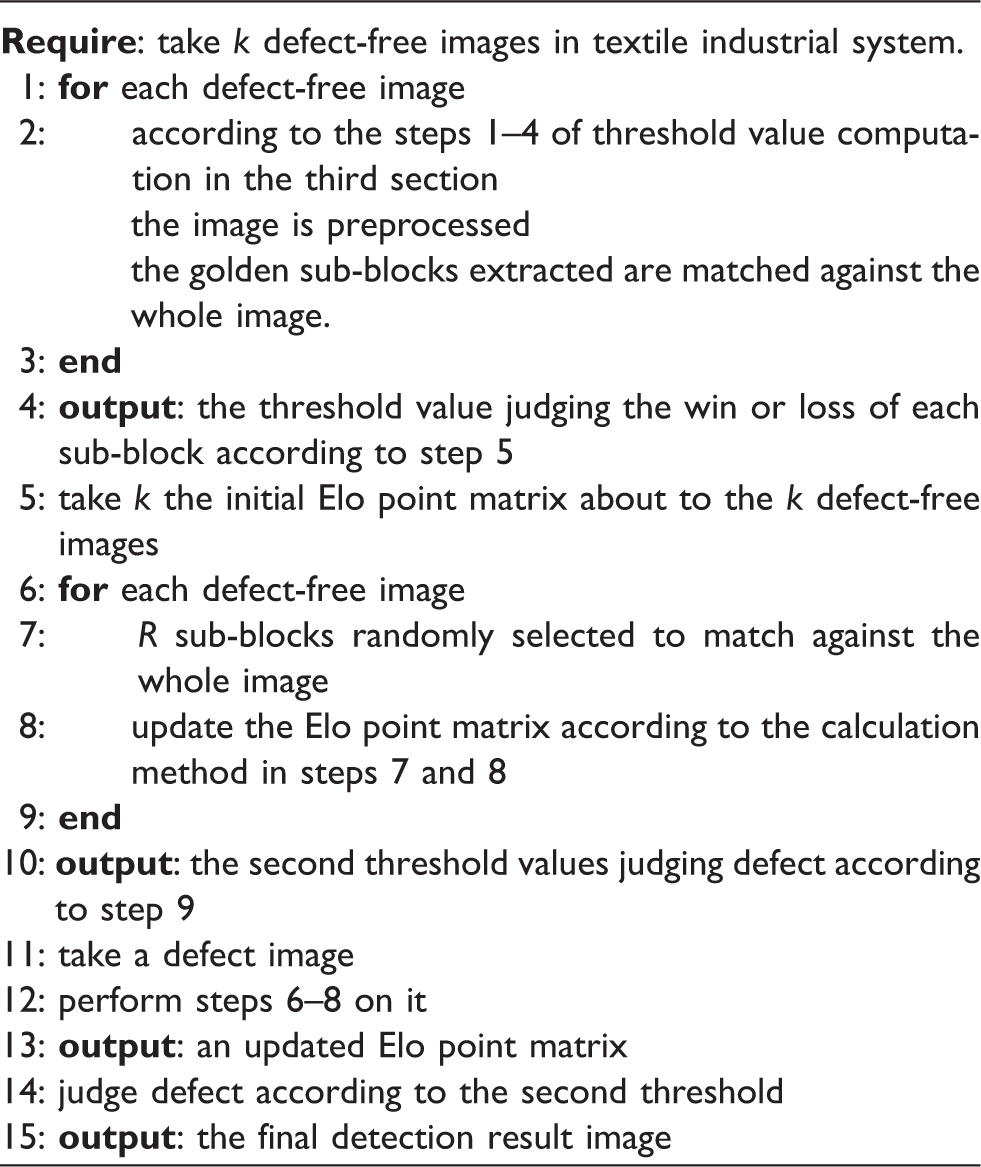
Practical application
The detection process of the IIER
Conclusion
A new algorithm for the automatic detection of fabric defects named the IIER is proposed in this paper, in which the defect detection is similar to carrying out fair matches. The algorithm is helpful to improve the quality control of fabric products. The addition of the integral image provides the possibility to improve the speed of defect detection. The algorithm also depends on the setting of two parameters: the number of sub-blocks R adaptive selected and the size
Footnotes
Declaration of conflicting interests
The authors declared no potential conflicts of interest with respect to the research, authorship and/or publication of this article.
Funding
The authors disclosed receipt of the following financial support for the research, authorship, and/or publication of this article: This work was supported by the Key Project “Heterogeneous feature structure fusion and modelling for human action recognition” of the Natural Science Foundation of Shanxi Province of China (Grant No. 2017JZ020) and the Science and Technology Project “Automatic defect detection for web offsetting based on machine vision” of the Xi’an Bureau, Shanxi, China (Grant No. 2017080CG/RC043 (XALG020)).