






Abstract
Textile products with a faded effect achieved via ozonation are increasingly popular nowadays. In order to better understand and apply this process, the complex factors and effects of color fading ozonation are investigated via process modeling in terms of pH, temperature, water pick-up, time (of process) and original color (of textile) affecting the color performance (K/S, L*, a*, b* values) of reactive-dyed cotton using the Extreme Learning Machine (ELM), Support Vector Regression (SVR) and Random Forest (RF), respectively. It is found that the RF and SVR perform better than the ELM as the latter were very unstable in the case of predicting a certain single output. Both the RF and SVR are potentially applicable, but SVR would be more recommended to be used in the real application due to its balancer predicting performance and lower training time cost.
Increasingly, textile products with a faded effect, worn look or vintage style are attracting a growing number of young customers' attention and have gained a considerable share of the fashion market. 1 The faded effect, however, generally is achieved by chemical treatments (hydrogen peroxide/chlorine bleaching, for example), which are not only highly water- and power-consuming, but also release a wide range of toxic substances to the environment. 2
Ozone is an excellent gaseous oxidant with an environmentally friendly nature that can be rapidly decomposed into O2 after its application without emitting additional pollution. It is able to react with a large number of organic and inorganic substances in water due to a series of intermediates or by-products, such as hydroxyl radicals (which react with no selectivity), may be generated in the reaction between ozone and water. 3 More significantly, ozone could be applied directly in the form of gas without a water bath to color fade the target products (with water content), which can dramatically decrease the water consumption in the sector. Therefore, it is regarded as a perfect alternative to traditional oxidizing agents and bleaching agents. 4 In recent years, studies regarding color fading dyed textiles using ozone, namely ozonation, instead of the conventional processes have been increasingly reported.1,5–8
The decolorization of dyes in ozonation, in short, could be attributed to the simultaneous oxidation of direct ozone and (but more of) indirect free radicals (which are generated from the decomposition of ozone) with the unsaturated organic compounds and the chromophoric organic system, for example, the chromophore groups of azo. This has been investigated in our previous works with the mechanism, effects and alternative possibilities of ozonation in the application of fading dyed textiles.9–11 Not only was the prominent role of ozone in the use of textile processing reported, but we also found that color fading ozonation of textiles is affected by many interdependent different factors, ranging from the properties of textile material to the setting of the color fading process. How these factors affect the color fading process separately has been reported, while to understand their overall impacts simultaneously, the complex and nonlinear relationship between the factors of material properties as well as the technical parameters of ozonation and color fading effects must be taken into consideration. To the best of our knowledge, the simultaneous effects of multiple factors on color fading ozonation of textiles have been barely systematically investigated. In recent years, researchers have tended to address similar issues via process modeling.12–16 However, unlike the traditional works that are limited in using analytical models based on physical or chemical laws, we propose intelligent techniques that can learn from data, which are more practical and suitable to be applied in this study.
The Artificial Neural Network (ANN) is a widely used artificial intelligence approach in the textile sector.
17
It is inspired by the bionic simulation of the human brain that interconnects numerous neurons in different hidden layers to process the complex information of a specific input–output relation.
18
In particular, the Extreme Learning Machine (ELM) is a novel algorithm for single-hidden layer feedforward neural networks (SLFNs, the structure of which is illustrated in Figure 1), which randomly chooses the input weight matrix ( Structure of an Extreme Learning Machine network.
The Support Vector Machine (SVM) is a popular machine learning tool for classification and regression based on statistic learning theory, first identified by Vladimir Vapnik 21 and his colleagues in 1992. Support Vector Regression (SVR) is the most common application form of the SVM. A typical feature is that instead of minimizing the observed training error, SVR minimizes the generalized error bound so as to achieve generalized performance. In addition, it only relies on a subset of the training data as the cost function for building the model neglects any training data that is close (within a threshold ε) to the model prediction.22,23 The excellent use of SVR has been made for predicting yarn properties,24,25 PU-coated cotton fabric qualities 26 and wool knitwear pilling propensity, 27 which simultaneously have proved the potential of SVR in the application of textile process modeling.
The Random Forest (RF) is a predictive model composed of a weighted combination of multiple regression trees. It constructs each tree using a different bootstrap sample of the data, and different from decision tree splitting, in which each node uses the best split among all variables, the RF uses the best among a subset of predictors randomly chosen at that node. 28 In general, combining multiple regression trees increases predictive performance. It makes an accurate prediction by taking advantage of the interaction of variables and the evaluation of the significance of each variable. 29 Kwon et al. 30 successfully developed a surface defect detection method based on the RF to inspect the fabric surface. Venkatraman and Alsberg 31 predicted the important photovoltaic properties of phenothiazine dyes using the RF, which paves the way for rapid screening of new potential dyes and computer-aided material design. To the best of our knowledge, none of the works have ever studied the ELM, SVR and RF simultaneously in an investigation regarding textile applications, and their applicability is not clear in this area.
Reactive-dyed cotton is one of the most important textile products in the sector. 32 Therefore, this study aims at modeling color fading ozonation in order to predict the color properties of ozone faded reactive-dyed cotton using different artificial intelligent techniques ranging from the ELM and SVR to the RF with a corresponding optimization process to comparatively find their potential applicability in reactive-dyed cotton color fading ozonation process modeling.
Brief overview of the Extreme Learning Machine, Support Vector Regression and Random Forest
Extreme Learning Machine
The ELM is an algorithm of SLFNs that randomly chooses the input weight matrix (
As the input weights (
Support Vector Regression
Compared with neural networks, SVR assures more generalization on the foundation of structural risk minimization, and generally performs better with fewer training samples. When we have training data {(xl, yl),…,(xl, yl)} ∈ ℝn × ℝ for the SVR model, the targeted function g(x) should be as flat as possible and has ɛ deviation in maximum from the actual targets yi for all the training data in the form of
This is a feasible optimization problem when the function g(x) actually exists and approximates all pairs (xi, yi) with ɛ precision, and slack variables
As the dual variables
This is a so-called Support Vector expansion. In the SVM training algorithm, the next necessary step is to make it nonlinear, which was suggested to be achieved by a mapping ∅ (x) from ℝn to a higher dimensional feature space using the kernel function
It is different from the linear case, as w means the flatness is no longer explicitly given. In this nonlinear case, the optimization problem refers to finding the flattest function in feature space, rather than in input space. The standard SVR is
There is also an optimization process (using leave-one-out, LOO) of the parameters of γ, λ and p in the toolbox from where γ ∈ {2−5, 2−3,…, 215} and λ ∈ {2−10, 2−8,…, 210} (two positive regularized parameters controlling the bias-variance trade-off), p ∈ {2−15,2−13,…, 23}(=
Random Forest
The RF is an ensemble-learning algorithm depending on the bagging method that combines multiple independently constructed decision tree predictors to classify or predict certain variables.
29
In the RF, successive trees do not rely on earlier trees; rather, they independently use a bootstrap sample of the dataset, and therefore a simple unweighted average over the collection of grown trees {h(
Experimental details
Material
Desized gray cotton fabrics ( 3 /1 twill; 325.7 g/m 2 ; supplied by Shunfu, Hubei, China) was dyed by three bifunctional fluorotriazine azo reactive dyes, namely Reactive Blue FL-RN (RB-RN), Reactive Red FL-2BL (RR-2BL) and Reactive Yellow FL-2RN (RY-2RN) (provided by Color Root, Hubei, China; commercial quality, purity of dyes: 92%,), respectively. Sodium hydroxide and hydrogen chloride (analytical grade, supplied by Sinopharm Limited, China) were used in the ozonation.
Apparatus
The ozone employed in this work was generated by a corona discharge ozone generator, CF-G50 (Guolin, China) that was fed by pure and compressed dry oxygen (≥99.9%, 1 MPa, 12 L/min) from an oxygen cylinder. Ozone flowed to the reactor (made of glass; the structure is shown in Figure 2), and in each single color fading ozonation experiment, samples were distributed evenly on the sample desk (made of an air-permeable steel net). Ozone was imported with a gas flow of 2 L/min and a dosage of 137 ± 3 mg/L/min (tested by an ultraviolet (UV) meter NS-xmd614, Naishi, China) throughout the treatment. The exhaust from the reactor was collected and decomposed by a heater (≥230℃) before evacuating to the atmosphere.
The reactor setup of ozonation.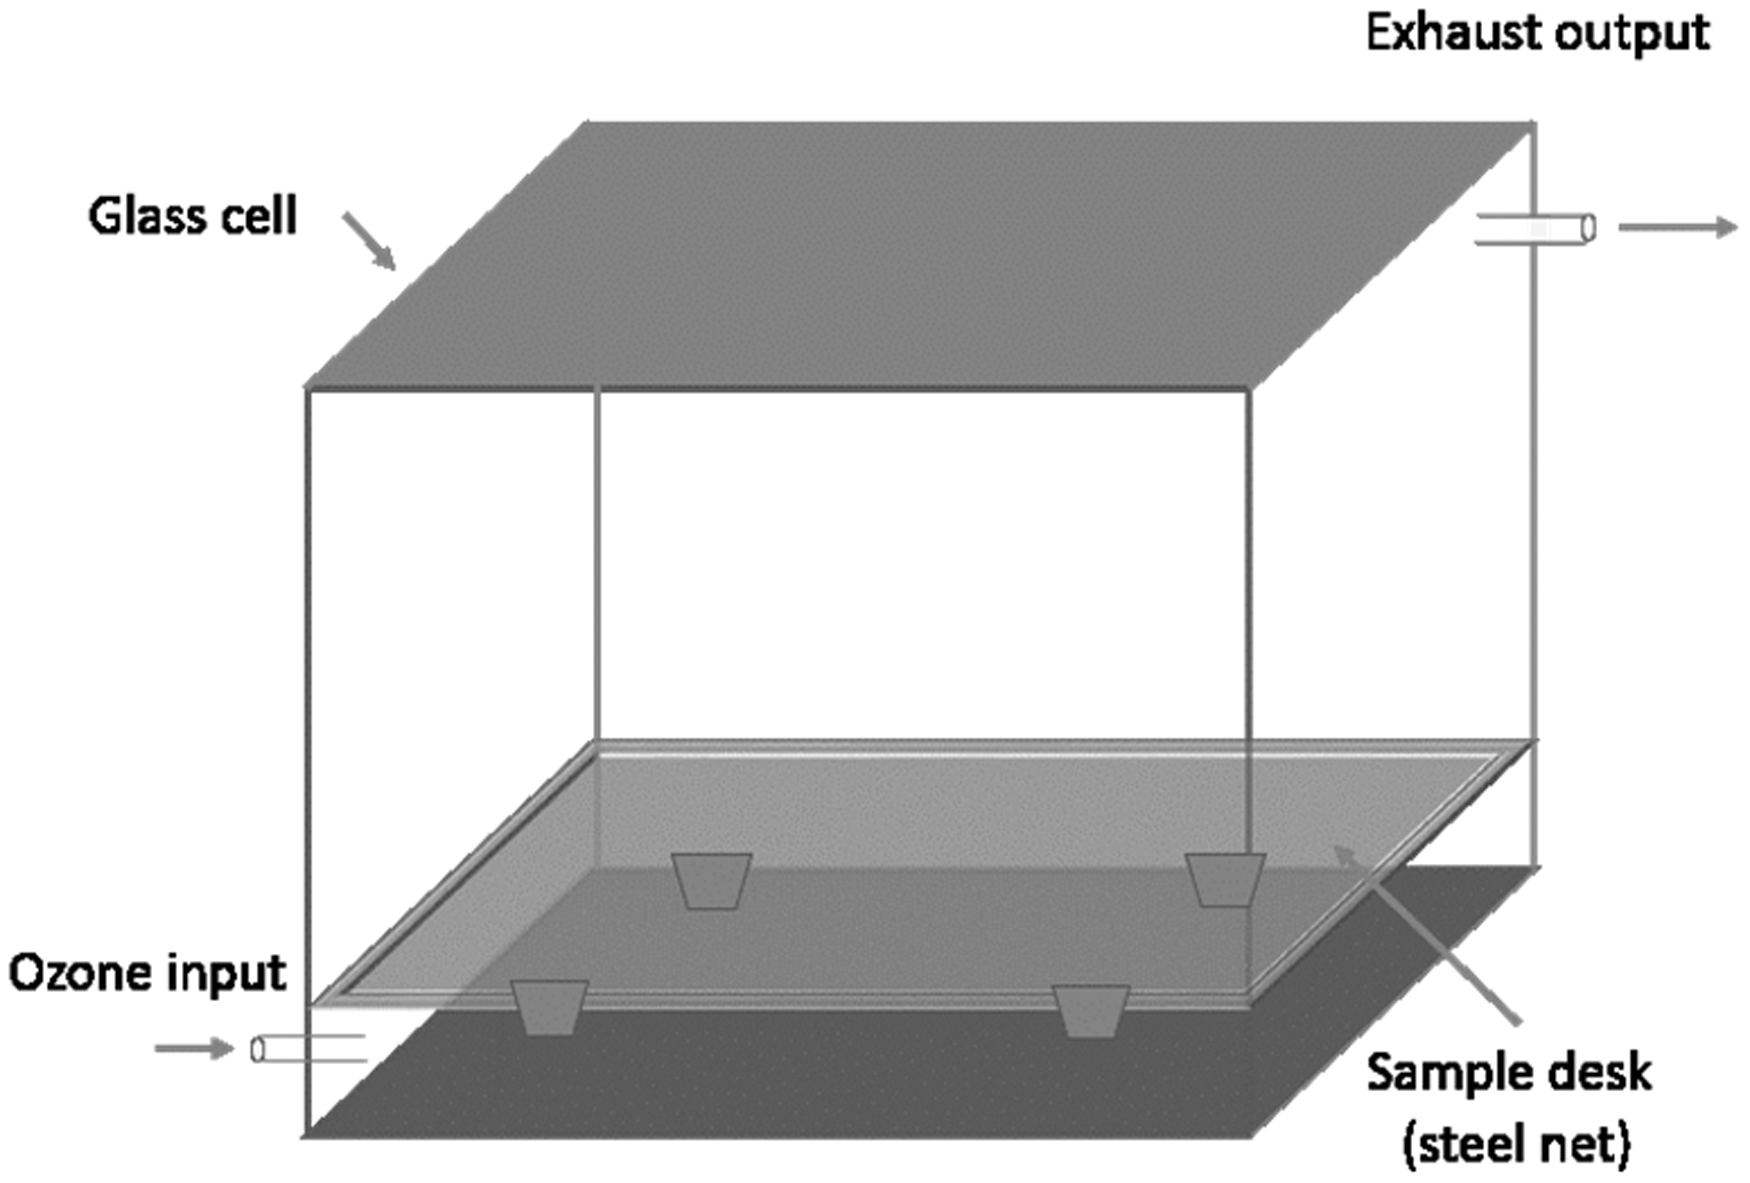
Methods
Ozonation processes
Three dyed cottons in different colors were treated respectively by the color fading ozonation using the following steps: wetting the fabrics by deionized water (pH = 7, or using sodium hydroxide and hydrogen chloride, respectively, when a specific pH is required) to obtain a certain pick-up water content. After ozone treatment, the samples were rinsed with deionized water before naturally drying.
Ozonation at different pH values (1, 4, 7, 10, 13) and temperatures (0℃, 20℃, 40℃, 60℃, 80℃) with variable pick-ups (water content of the samples, 0%, 75%, 150%) for different treatment times (0, 5, 10, 15, 20, 25, 30, 35, 40, 45, 50, 55, 60 min) was investigated in the three dyed cotton fabrics (blue, red, yellow, 612 fabrics samples in total). Besides the pH, which was set up depending on the method mentioned above (using sodium hydroxide and hydrogen chloride, respectively, in the water pick-up step), the temperature of ozonation was controlled by a water bath around the reactor (including the inlet tubes), and the pick-up of samples was calculated by Equation (26).
Analytical details
On the basis of the Kubelka–Munk theory, 41 it is known that the K/S value is able to indicate the color depth of samples, while the L* a* b* values (or CIELab), an international standard widely used for color measurements, are capable of illustrating the color variation of textile samples. Normally, the color of the final textile product agreeing with specific K/S and L* a* b* values is within the acceptable tolerance of the consumer. 14 Consequently, these values (an average of four measurements from different parts and both sides of each sample, within a relative error of 0.3%), tested with a Datacolor 110 spectrophotometer (Datacolor, USA), were used to characterize the color variation of dyed textiles in the color fading ozonation.
Modeling structure
In the present study, the ozonation process model is expected to be capable of predicting (or outputting) the color qualities of ozone treated samples in terms of K/S and L*, a*, b* values by giving five variables including not only the specific color of treated fabric but also the process parameters of pH, temperature, pick-up and treatment time. In other words, the anticipated model of color fading ozonation of reactive-dyed cotton realizes the complex and unclear relation of color fading ozonation parameters and its effectiveness on reactive-dyed cotton fabric in certain respects.
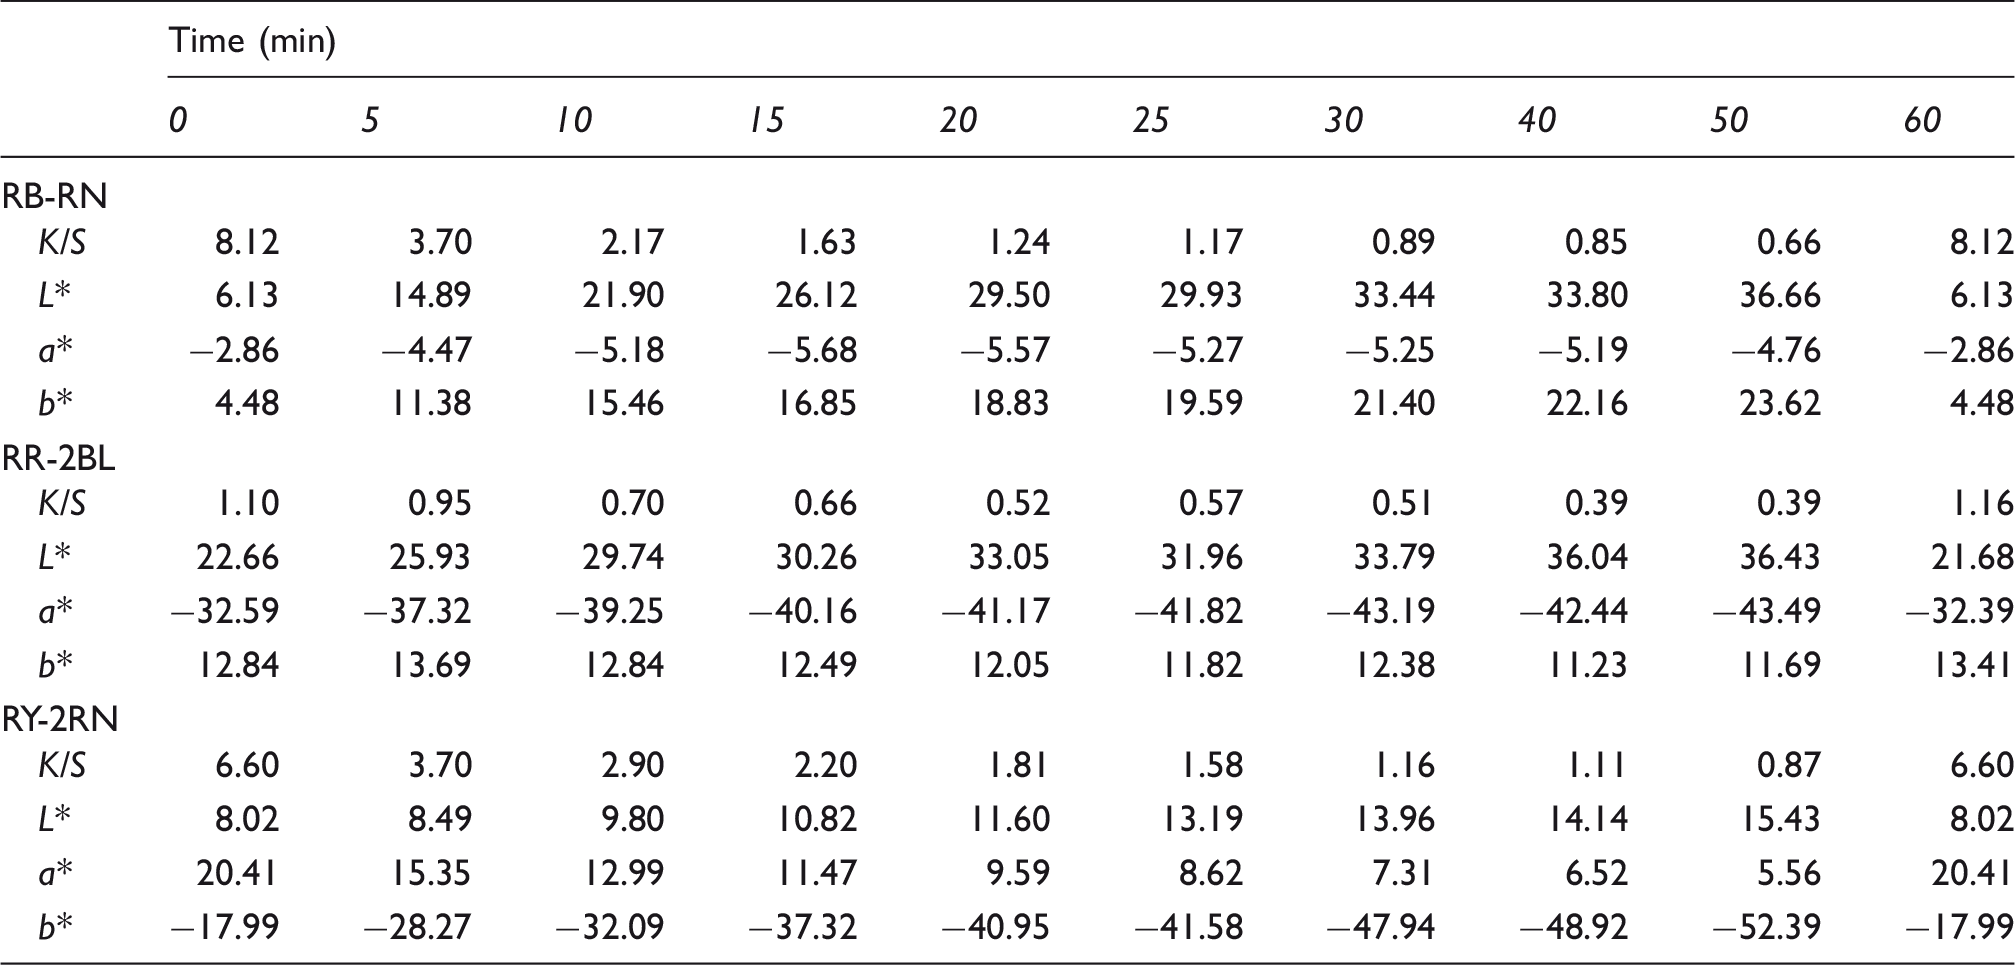
For instance, the real samples used in the ozonation, particularly at pH 7, 20℃ with 150% pick-up over different times from 0–60 min can be observed in Figure 3. The corresponding K/S, L
*
, a
*
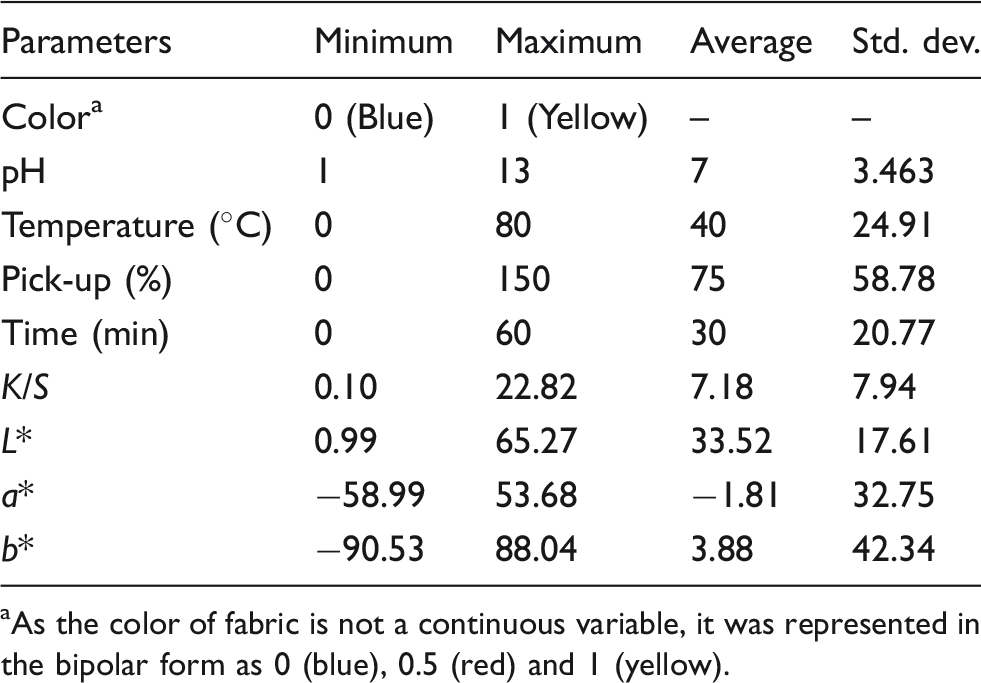
, b* values of the exhibited samples are listed in Table 1. It is clear that none of the treated samples has an obvious difference from the others in regard to color properties as treated by different ozonation processes, which on the other hand apparently revealed how complex the process parameters are in influencing the color of dyed cotton fabric in ozonation. Table 2illustrates the variation, including the minimum, maximum, average and standard deviation of the dataset we used in the process modeling.
Illustration of the (a) front side and (b) back side of real ozone treated cotton samples. K/S, L*, a*, b* values of the samples shown in Figure 3 The maximum, minimum, average and standard deviation of ozonation parameters As the color of fabric is not a continuous variable, it was represented in the bipolar form as 0 (blue), 0.5 (red) and 1 (yellow).
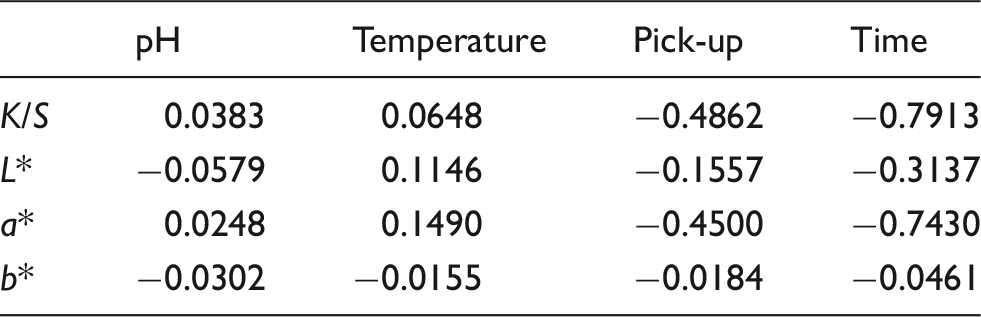
The Spearman's correlation coefficients of the data for modeling
K-fold cross-validation (k = 10) was used in the process modeling. This is a popular statistical approach for estimating predictive models. Taking k = 10 as an example as it was the value used in the modeling study, 459 training sets of data were divided randomly and equally into 10 disjoint folds, nine folds of which were split into the training subset, while the remaining one fold was used as the validating subset. This procedure was repeated 10 times with a varied training and testing dataset at each time to validate the trained models. In order to evaluate the performance of the models in validation, the mean square error (MSE) was used based on
The development and construction of the models were carried out using MATLAB R2015b software for the multi-output ELM and MLS-SVR, but R studio for the MRF on a laptop (Core i7-4710, 2.5 GHz, 16 GB RAM). All of the original data was regularized in the range of [0, 1] before using.
Results and discussion
Modeling training
ELM models
ELM models with hidden nodes from 1 to 200 activated by Sigmoid, Sine and Hardlim functions are investigated (the corresponding validation MSE is illustrated in Figure 4, with a detailed demonstration of the trained ELM models possessing nodes from 1 to140 in detail). The overfitting situation of the ELM activated by Sigmoid and Sine is easy observe and starts from those with nodes around 100. More specifically, it is noted that Sigmoid trained ELM models performed similarly to those trained by Sine, since the MSE of these models both dropped as well as minimized at those with around 50 nodes (MSE ≈ 0.052), followed by a dramatic enhancement. In contrast, the validation MSE of Hardlim activated models performed generally stably with the growing number of nodes in the ELM model, but strictly with a minimum of MSE ≈ 0.069 (larger than Sigmoid and Sine) at that with 97 nodes, which can be seen in Figure 4. Similar comparative results of the use of these activation functions in the ELM can be found also in the work of Singh and Balasundaram.
42
Validation mean square error (MSE) of Extreme Learning Machine models activated by different functions.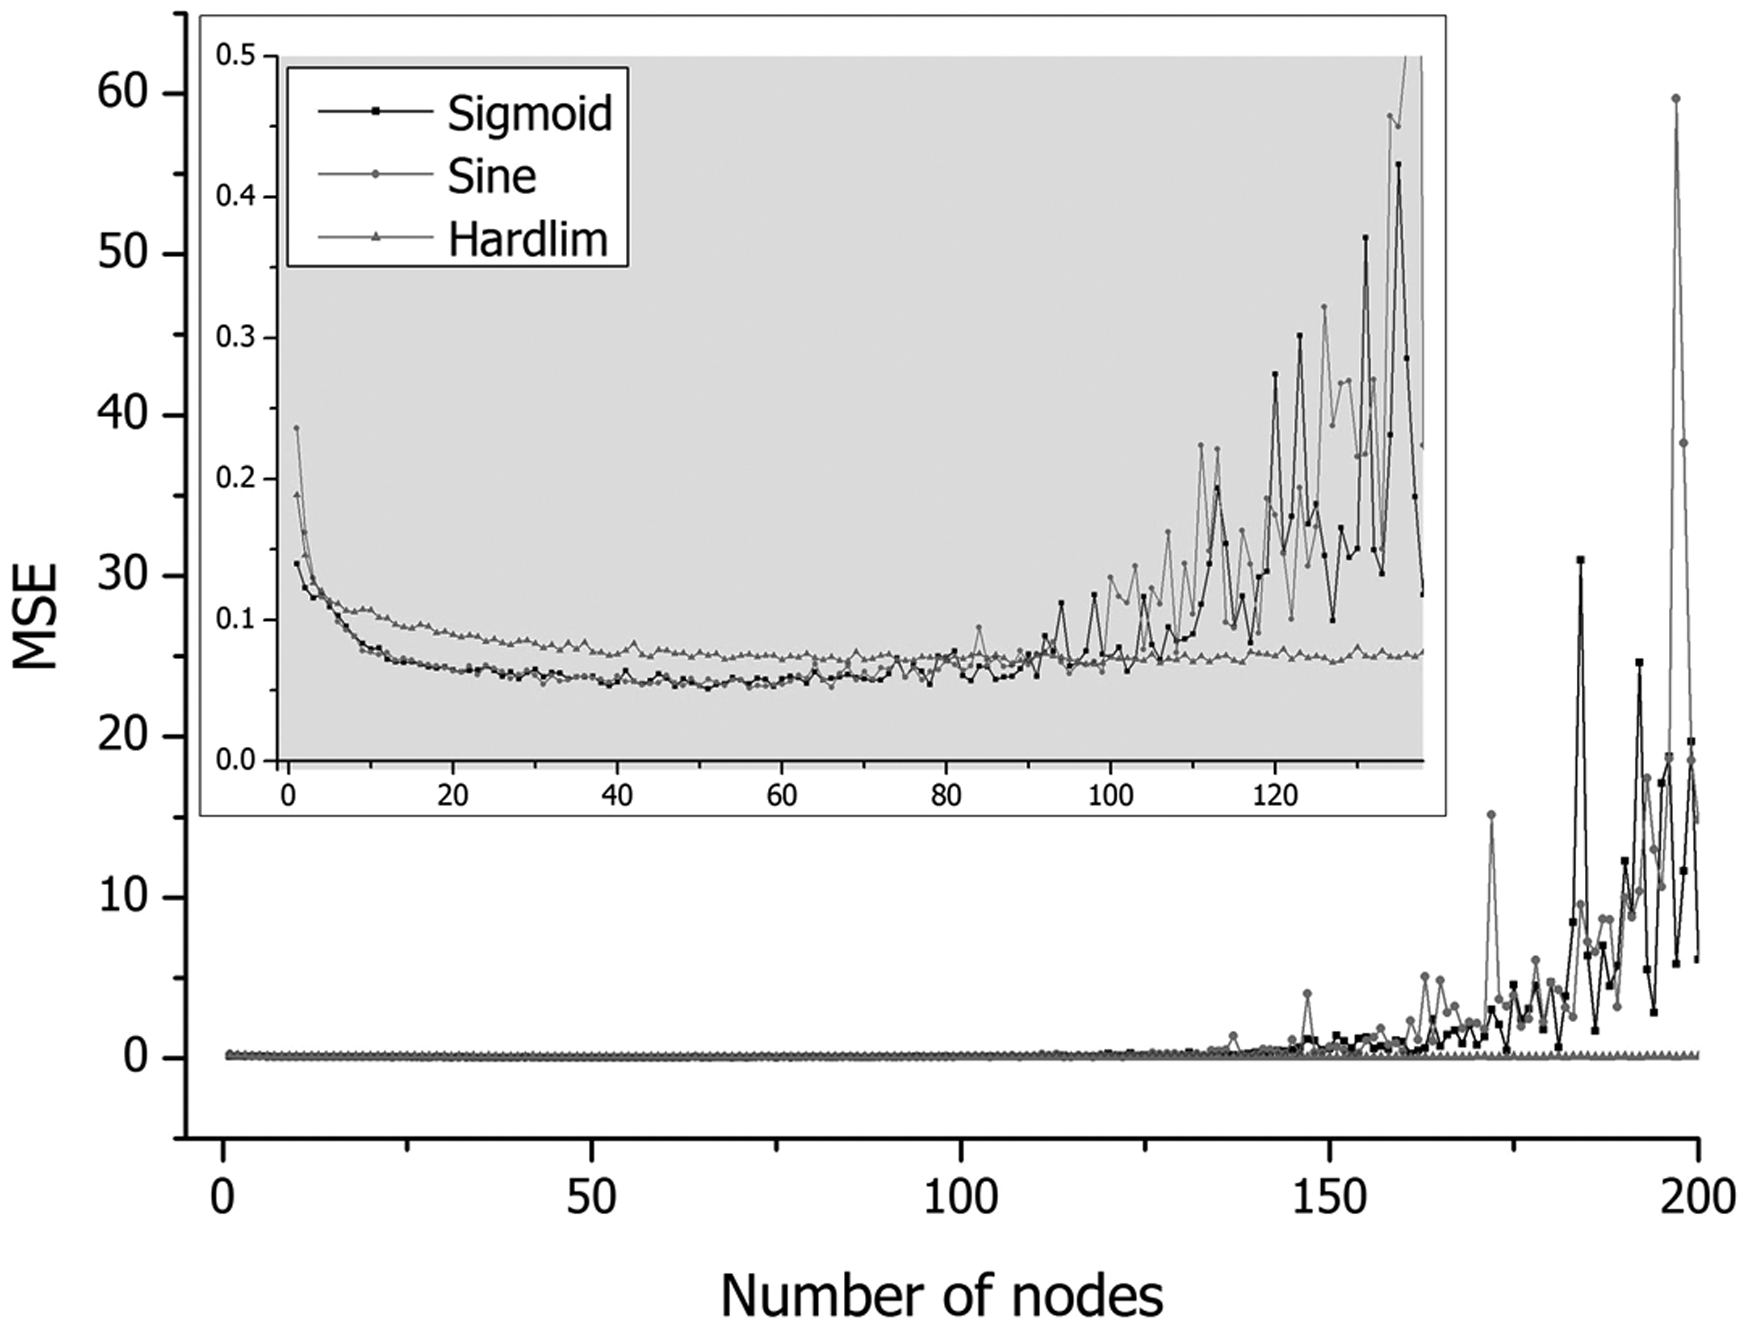
The use of activation functions in an ANN is to convert an input signal of the node to an output signal by mapping the nonlinear properties. It is very important for an ELM model to learn and achieve the complicated mapping of input and output data by activating the nodes with a certain activation function. A graph of the activation functions we used is given in Figure 5. It is noted that Sigmoid and Sine have much in common with their S-shaped curve and both are infinitely differentiable functions, which make them easy to understand and apply. However, on the other hand, it may also result in their similar proximity and disadvantage in the ELM models, as we can see their similar performance variation and the overfitting situation with the increasing nodes in Figure 4. Hardlim performed the least compared with Sigmoid and Sine in terms of their activated ELM models in this issue, probably is owing to their oversaturation.
Activation functions of the Extreme Learning Machine.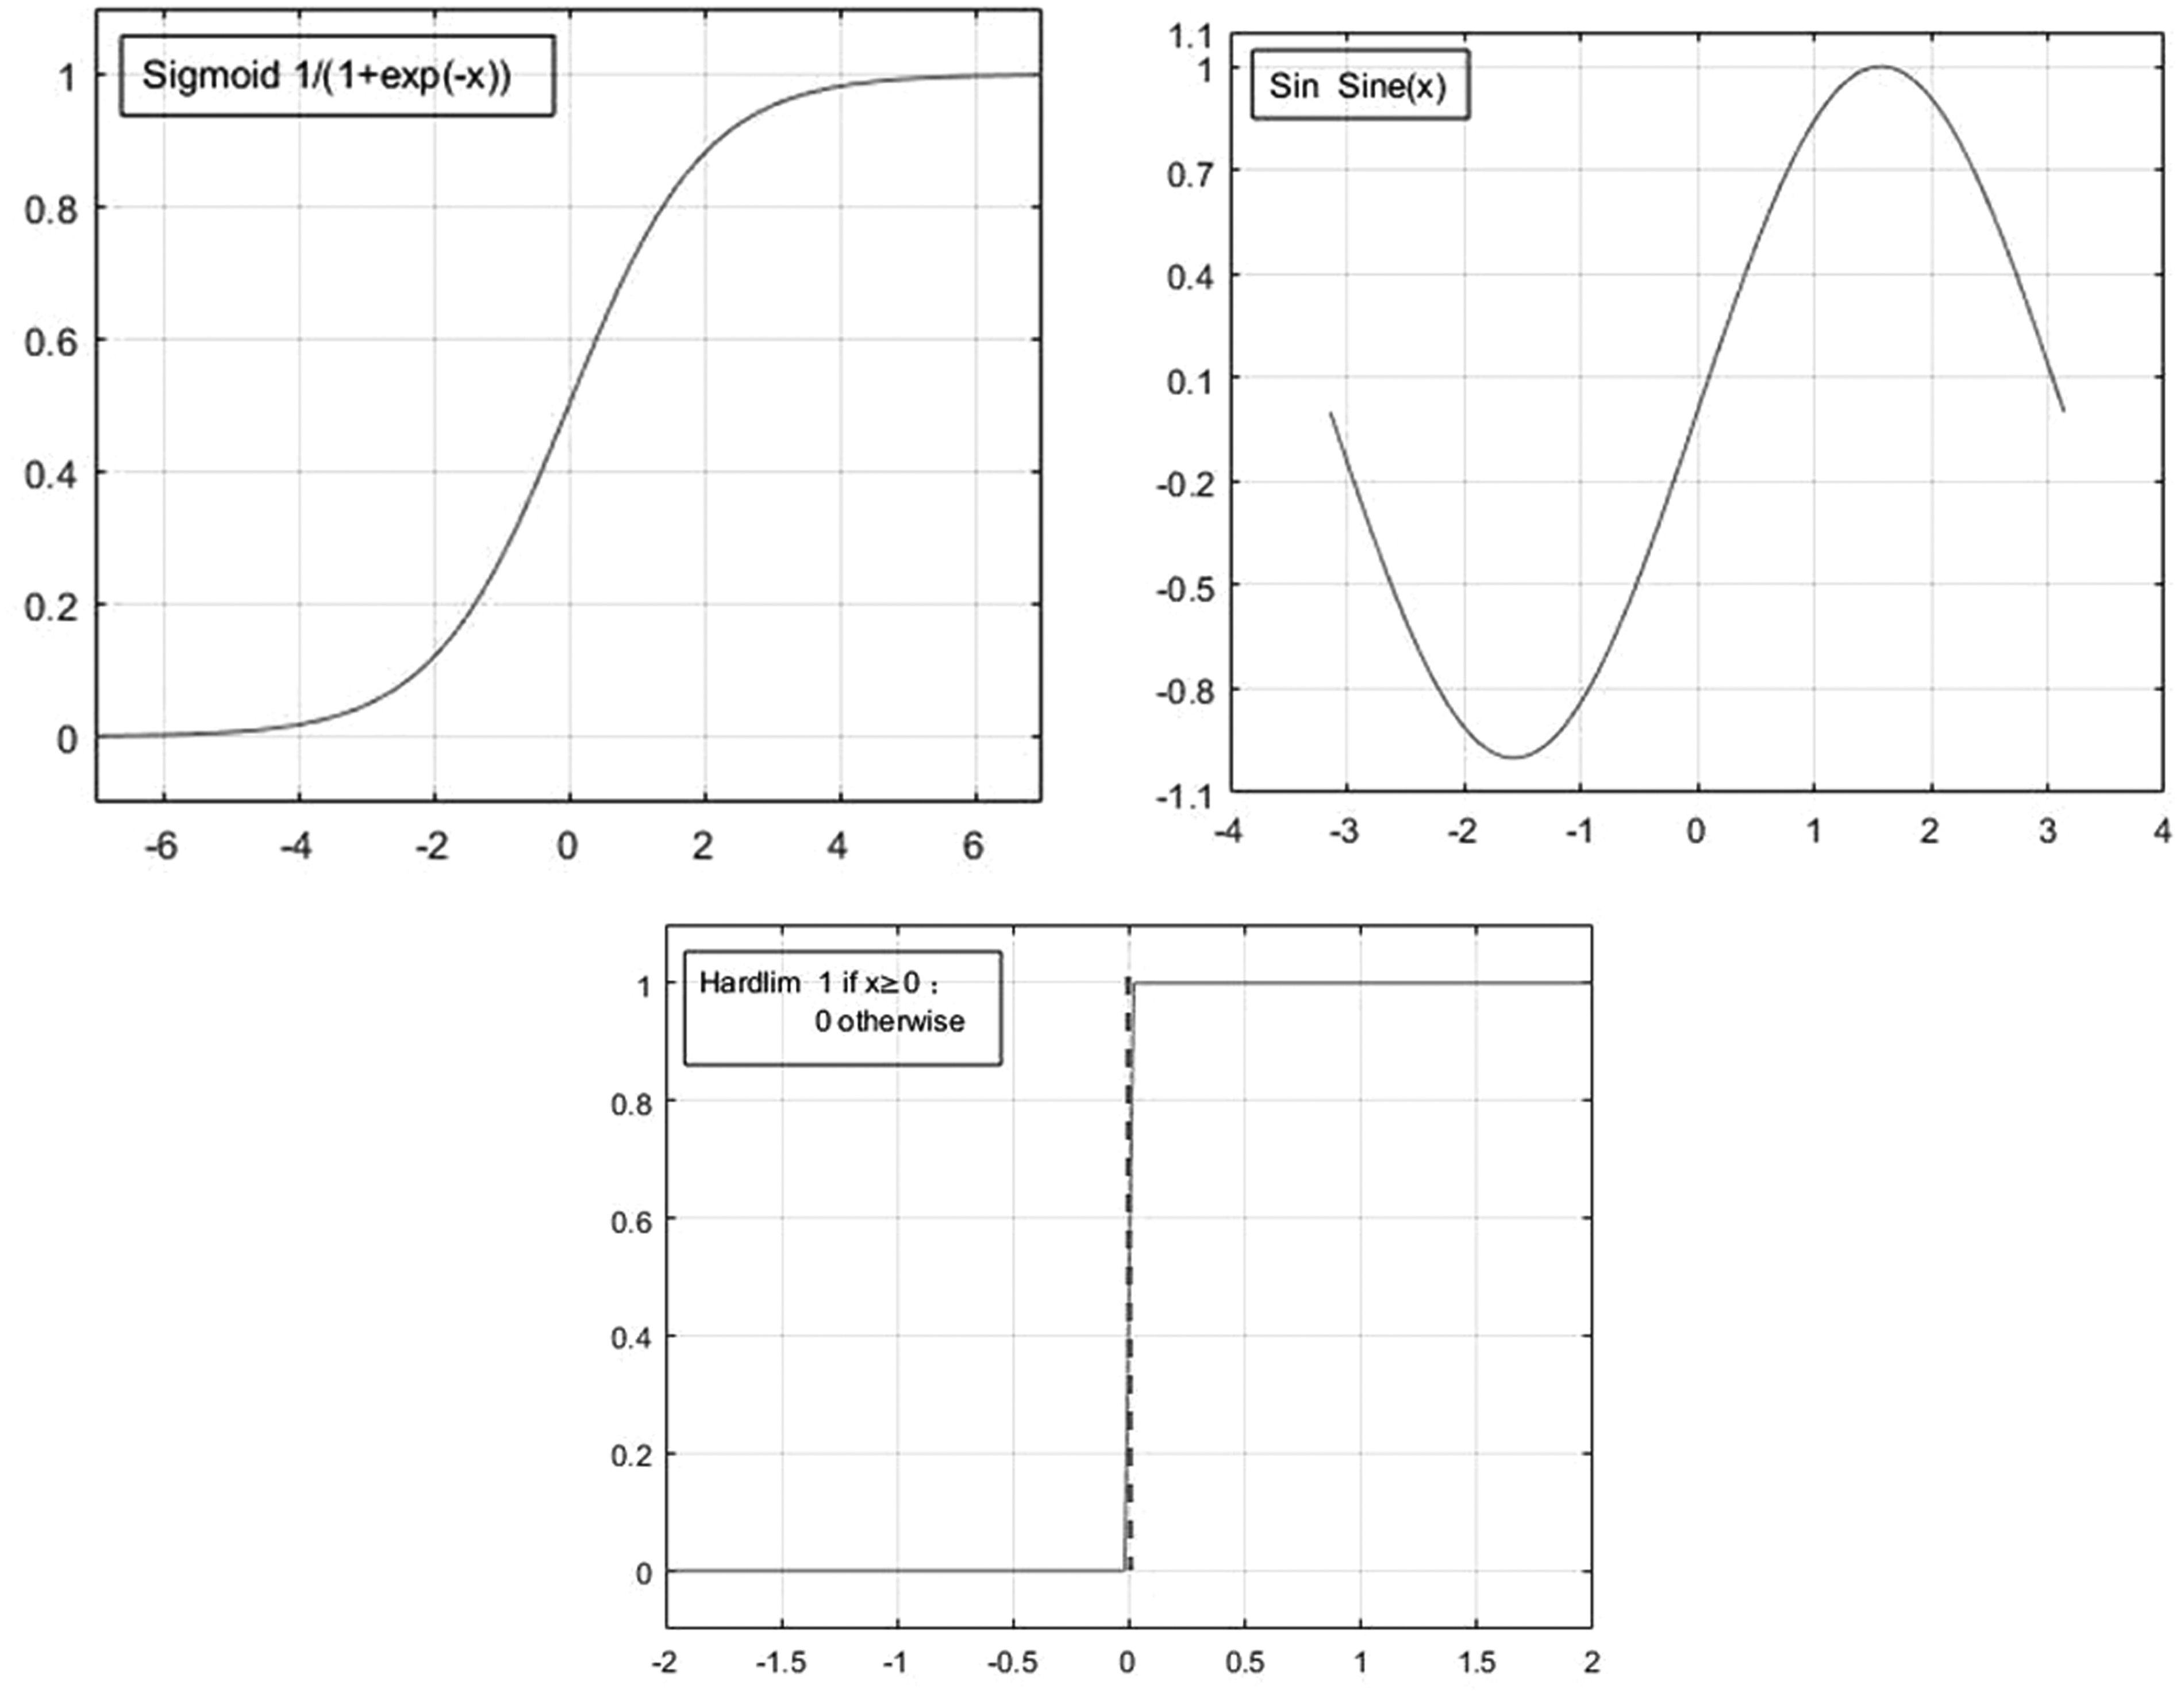
SVR models
Multi-output SVR models with kernel functions of Linear, Sigmoid, Polynomial, RBF and ERBF were trained and developed using the MLS-SVR toolbox. The corresponding results of minimum validation MSE are 0.05678, 0.00932, 0.08613, 0.00493 and 0.0092, respectively (as demonstrated in Figure 6). It is worth noting that models trained with the Linear kernel and Polynomial kernel are found to perform far more poorly than the others. Performance of those with the Sigmoid kernel and ERBF kernel are very close at a quite low level, although their validation MSE is nearly two times that of the SVR model with the RBF kernel (which performed the most in comparison in this issue when its parameters are optimized to γ = 32768, λ = 9.7656e−4 and p = 0.125; for more information regarding the LOO optimization process used in the toolbox for these kernel parameters, see Xu et al.
37
).
Validation mean square error (MSE) of support vector machine models with varied kernel functions. RBF: radial basis function; ERBF: exponential radial basis function.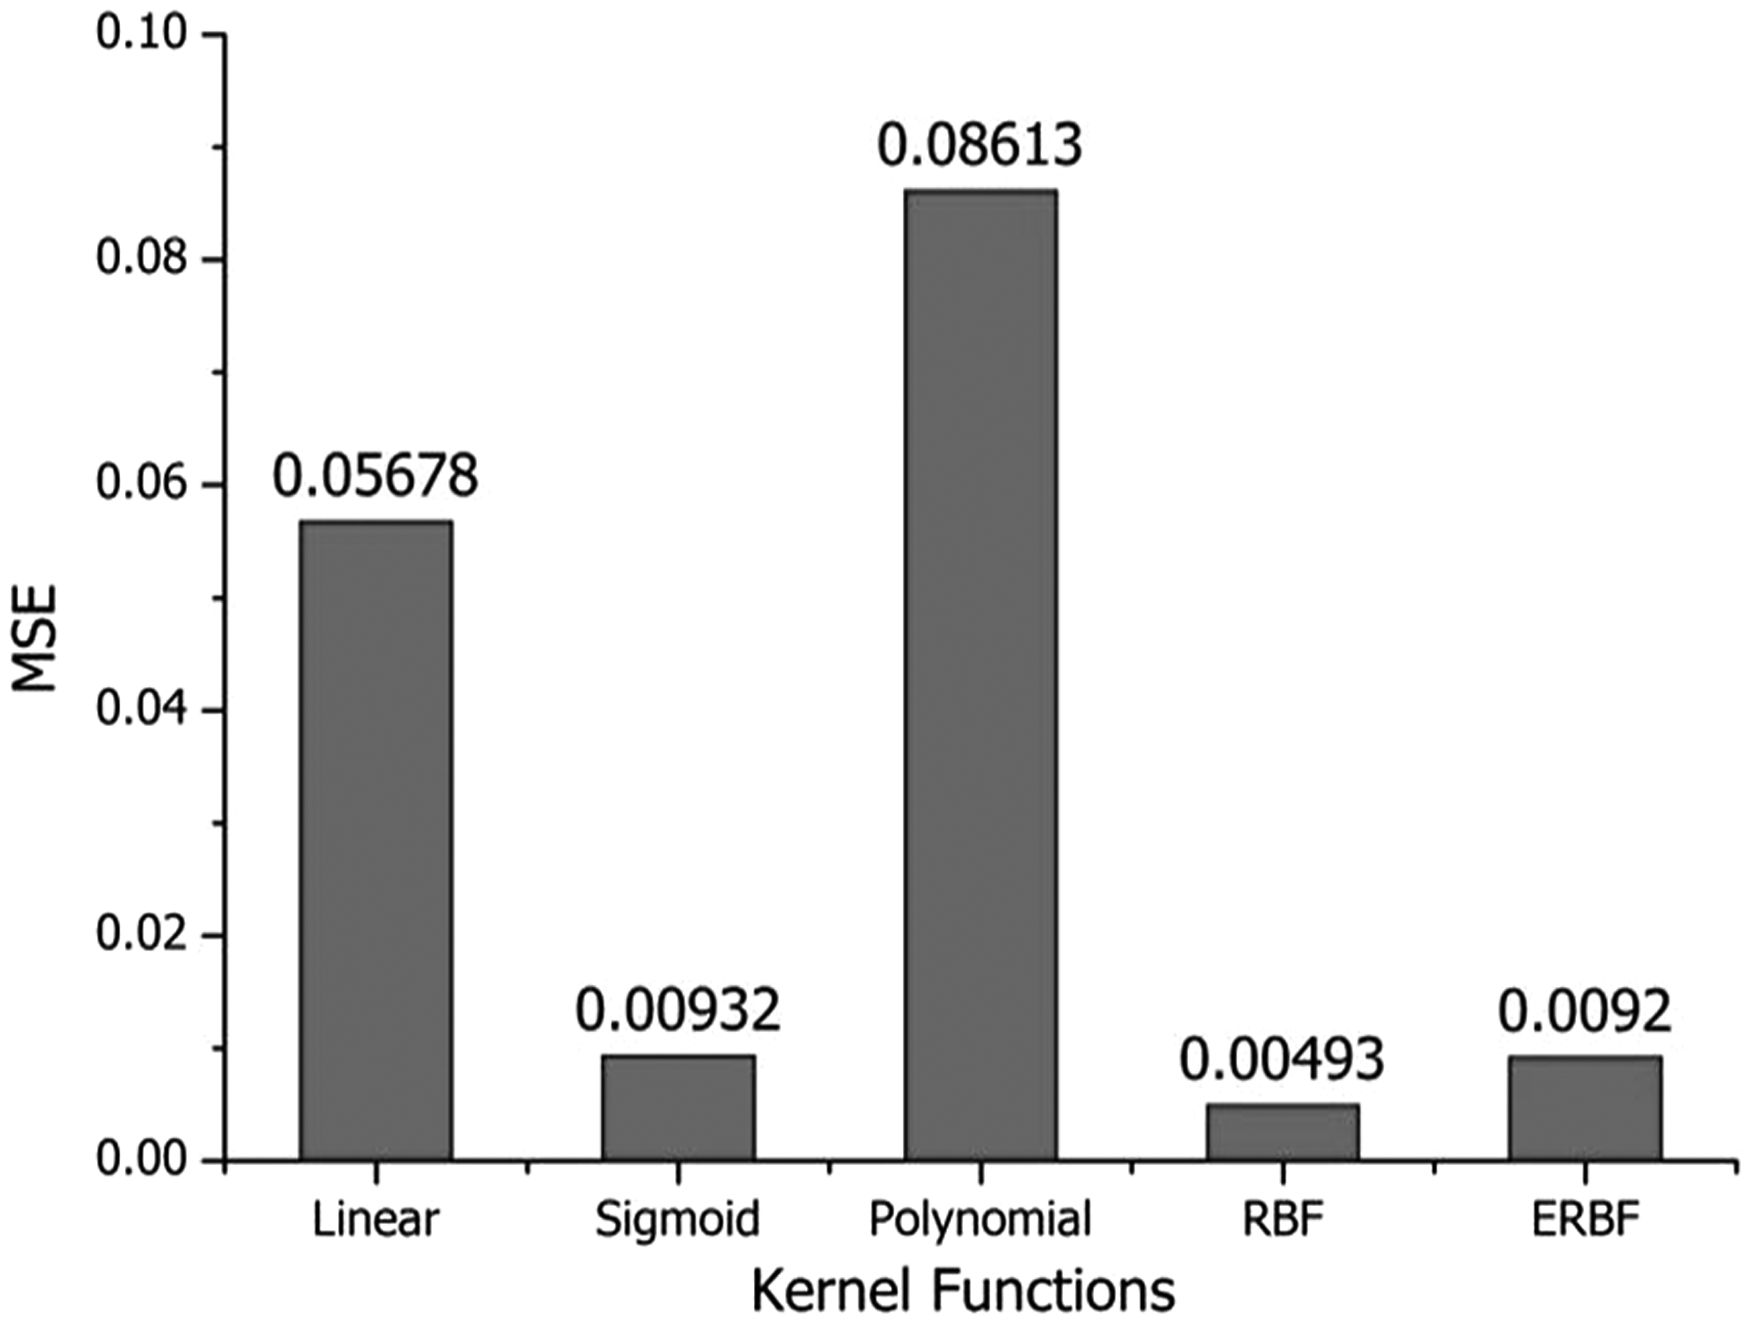
The kernel function is used to transform the data as input into the required form to facilitate a nonlinear decision surface to be a linear equation in higher dimensions where the computational power of the learning machine is heightened. The type of kernel function used would influence many of the characteristics of the SVR model. A wide range of kernels exist and it is difficult to explain their individual characteristics, but it is well known that the RBF kernel is recommended to be tried first in the SVR model due to the fact that it not only possesses certain similar parameters and behaviors of Linear and Sigmoid but also has fewer hyper parameters than Polynomial to avoid complexity in the model. The RBF is assumed to have computational advantages over other kernels, as it is easier and faster to compute the kernel values. 43 The lowest MSE it achieved in this case validates its preferential suitability to be employed in this study, which is because we have not too many features in the model but with comparatively large numbers of observations.
RF models
RF models with different mtry (from 1 to 5), minleaf (from 1 to 10) and ntree (from 1 to 100) are trained and developed, and the validation MSEs of these models are given in Figure 7 with a detailed demonstration of mtry = 1 and ntree ranging from 1 to 100, excluding those for which the validation MSE is higher than 0.026. In Figure 7, the number of mtry in each regression tree node is found that plays a very significant role in affecting the prediction accuracy of the color properties of models of ozone treated cotton fabrics. The falling curves of the MSE with the growing number of mtry may reveal that the five inputs we used to construct these RF models, that is, the (1) color of dyed cotton and (2) pH, (3) temperature, (4) pick-up and (5) treating time of ozonation process, have a very clear independent relation with each other. As a result, RF models with five randomly selected features generally lead the low validation MSE in this comparison. It is also found that ntree played another significant role in RF models, as the MSE of these models decreased dramatically when the number of trees increased in the forest from 1 to 30. In general, these models perform steadily when there are more than 30 regression trees in the forest construction no matter what the mtry or minleaf employed, but in order to save time and cost in the model training process, a 10-tree forest is sufficient and may be better recommended to be used in the color fading ozonation of dyed textile predicting model for further experiments. However, unlike mtry and ntree, the minimum number of samples in the leaf node, that is, minleaf, seems to be preferable to be less, although it is relatively uninfluential. Depending on the observation of the detailed depicted MSE plots of 1-mtry RF models in Figure 7, we can see that the average MSE of the achieved RF models was generally enhanced when the number of leaves increased from 1 to 10.
Mean square error (MSE) of Random Forest models with varied numbers of features, leaves and trees.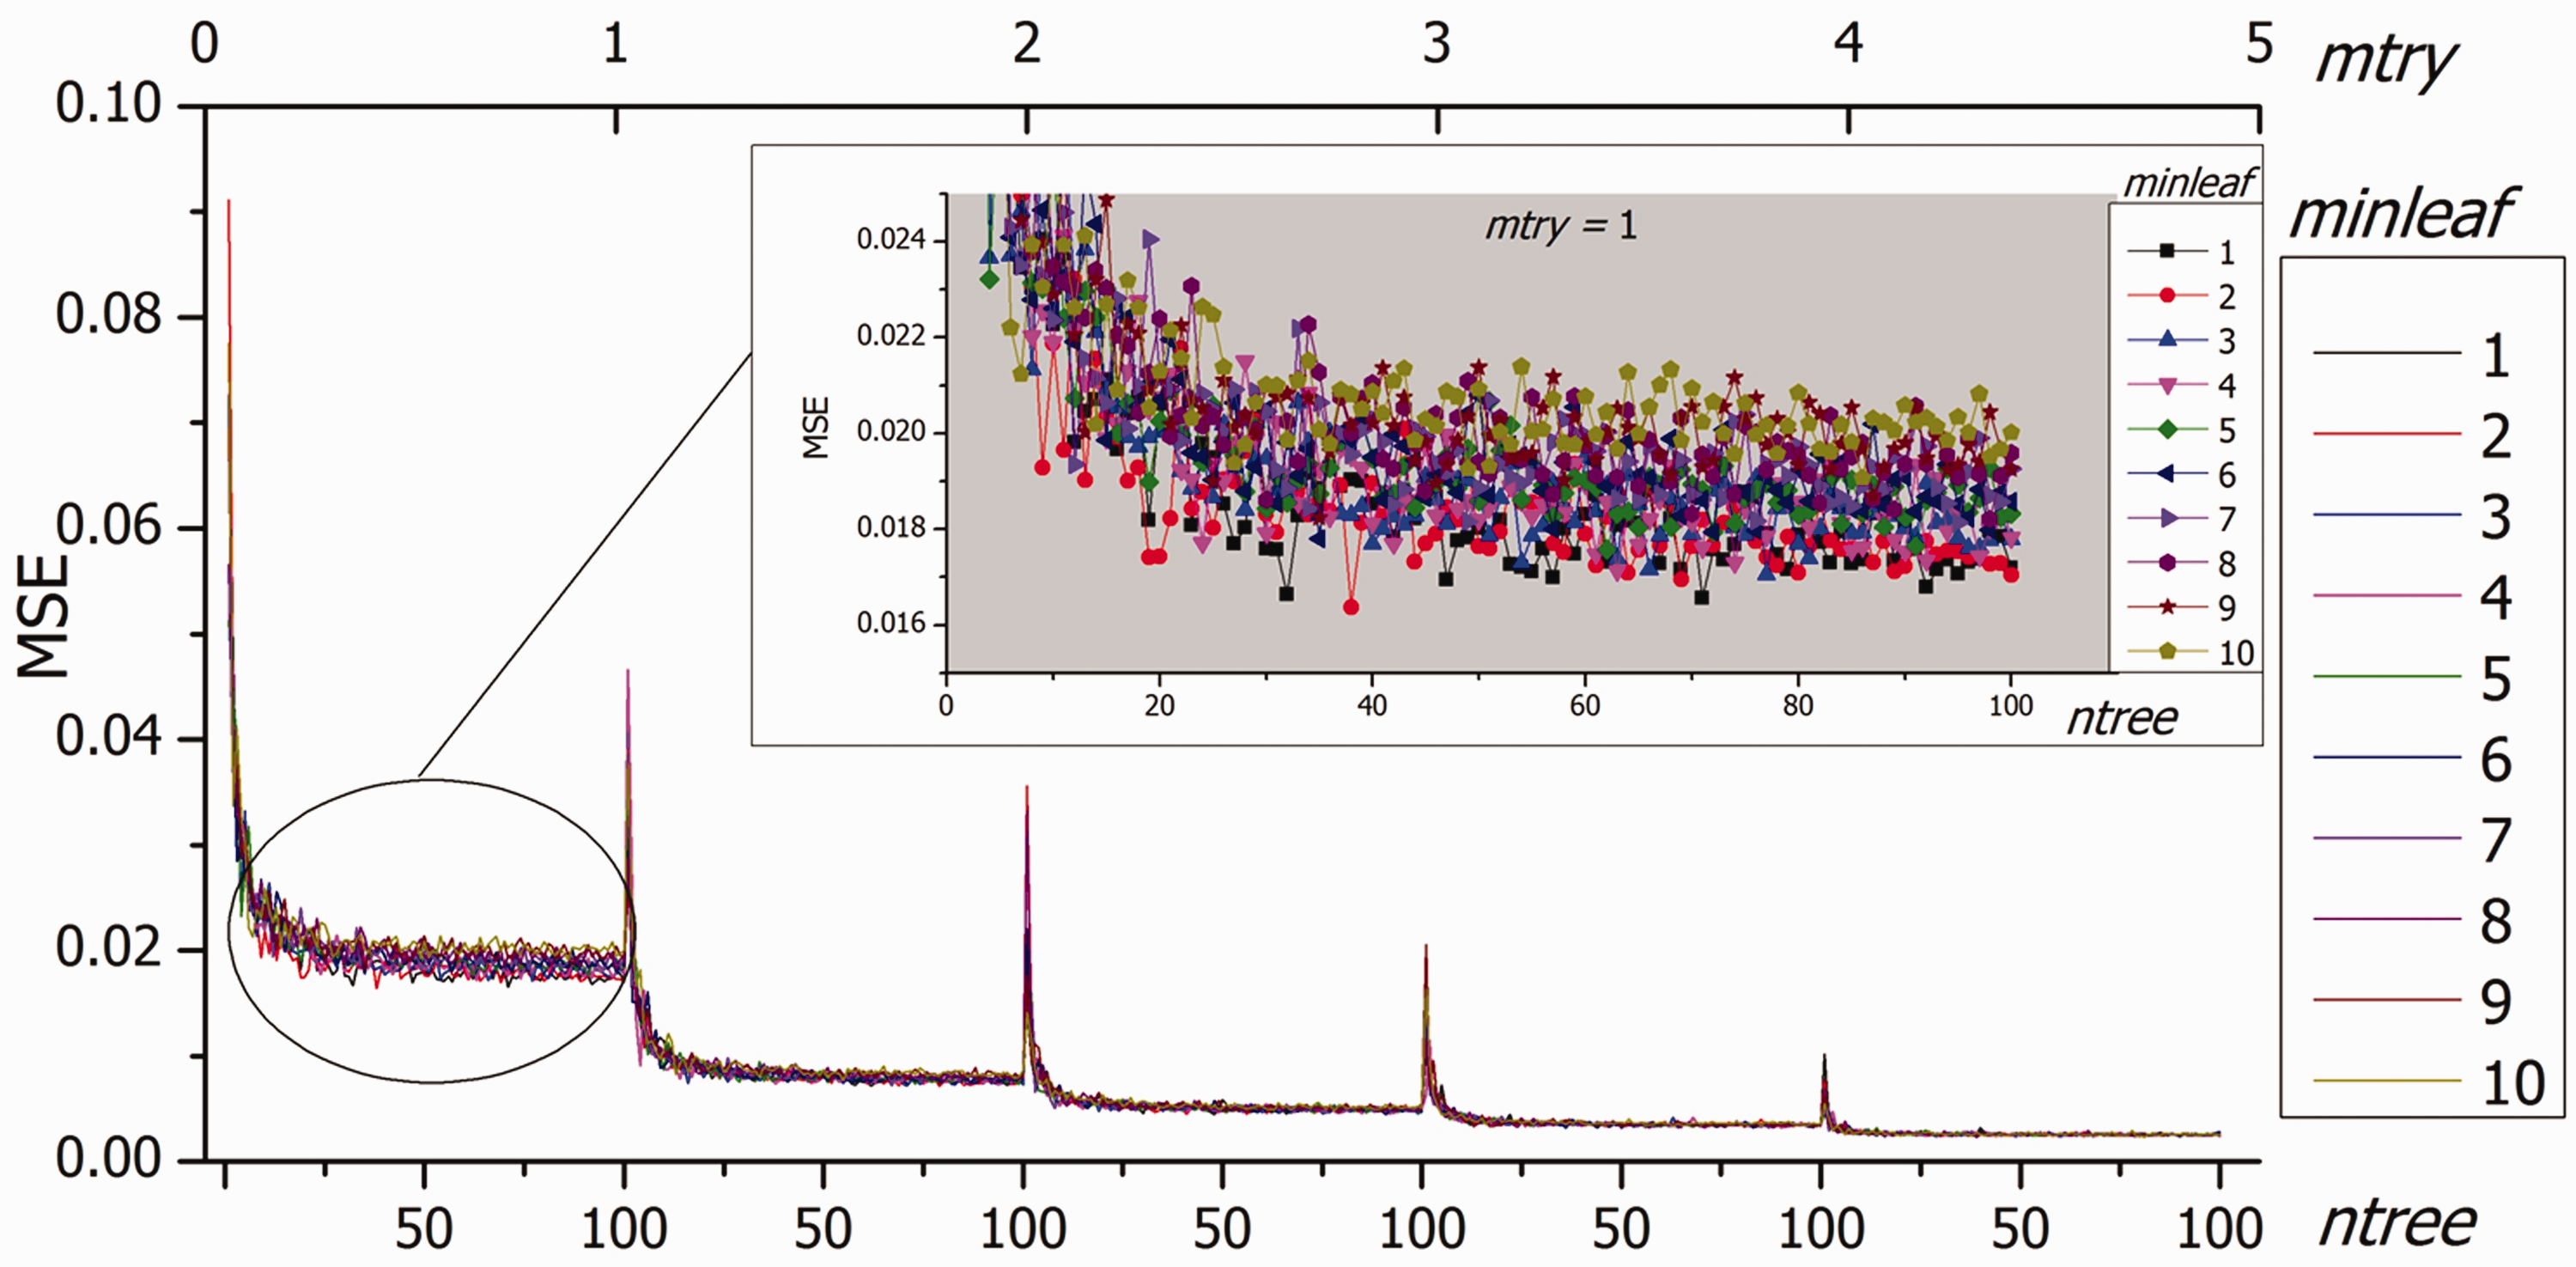
Prediction performance
The quality of a model is not only determined by its ability to learn from the data but also its ability to predict unseen data, which are the so-called learning capacity and generalization ability of a model. Models are seldom good in both of these capacities. According to the training results obtained above, we find that Sine and Sigmoid trained ELM models have very similar performance that both optimized at 50 nodes, while SVR with the RBF kernel function and the RF as mtry = 5, ntree = 10, minleaf = 2, in contrast, clearly precede the others in their training process. In order to further comparatively investigate the potential application of these three techniques without losing significant observations, the two ELM models were taken into account together with the RBF-SVR and the optimized RF (mtry = 5, ntree = 10, minleaf = 2) in this section.
Prediction performance of the optimized models
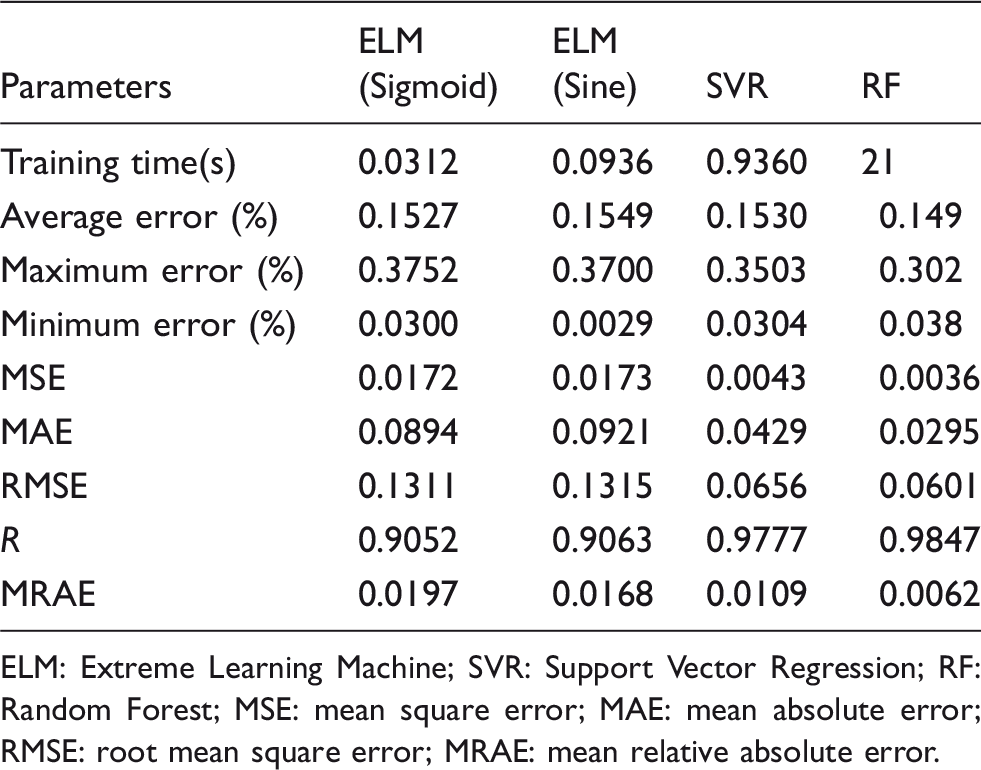
ELM: Extreme Learning Machine; SVR: Support Vector Regression; RF: Random Forest; MSE: mean square error; MAE: mean absolute error; RMSE: root mean square error; MRAE: mean relative absolute error.
Table 4 demonstrates the overall performance of the constructed models in terms of certain estimation evaluation indexes, but the detail of these predictions is neglected, as it is known that the constructed models possess four output, that is, K/S, L*, a*, b* values of reactive-dyed cotton fabrics treated with the color fading ozonation. How these predictive models work in detail with them is unclear. In order to reflect the real prediction performance (using testing data) of each trained model on predicting each single output separately, the predicted results range from output 1 (K/S value) to output 4 (b*) versus the real experimental data (targets 1–4) is illustrated in Figures 8(a)–(d), respectively.
Predicted data outputted by the Extreme Learning Machine (ELM) (trained by Sigmoid and Sine, respectively), Support Vector Regression (SVR) and Random Forest (RF) versus experimental data.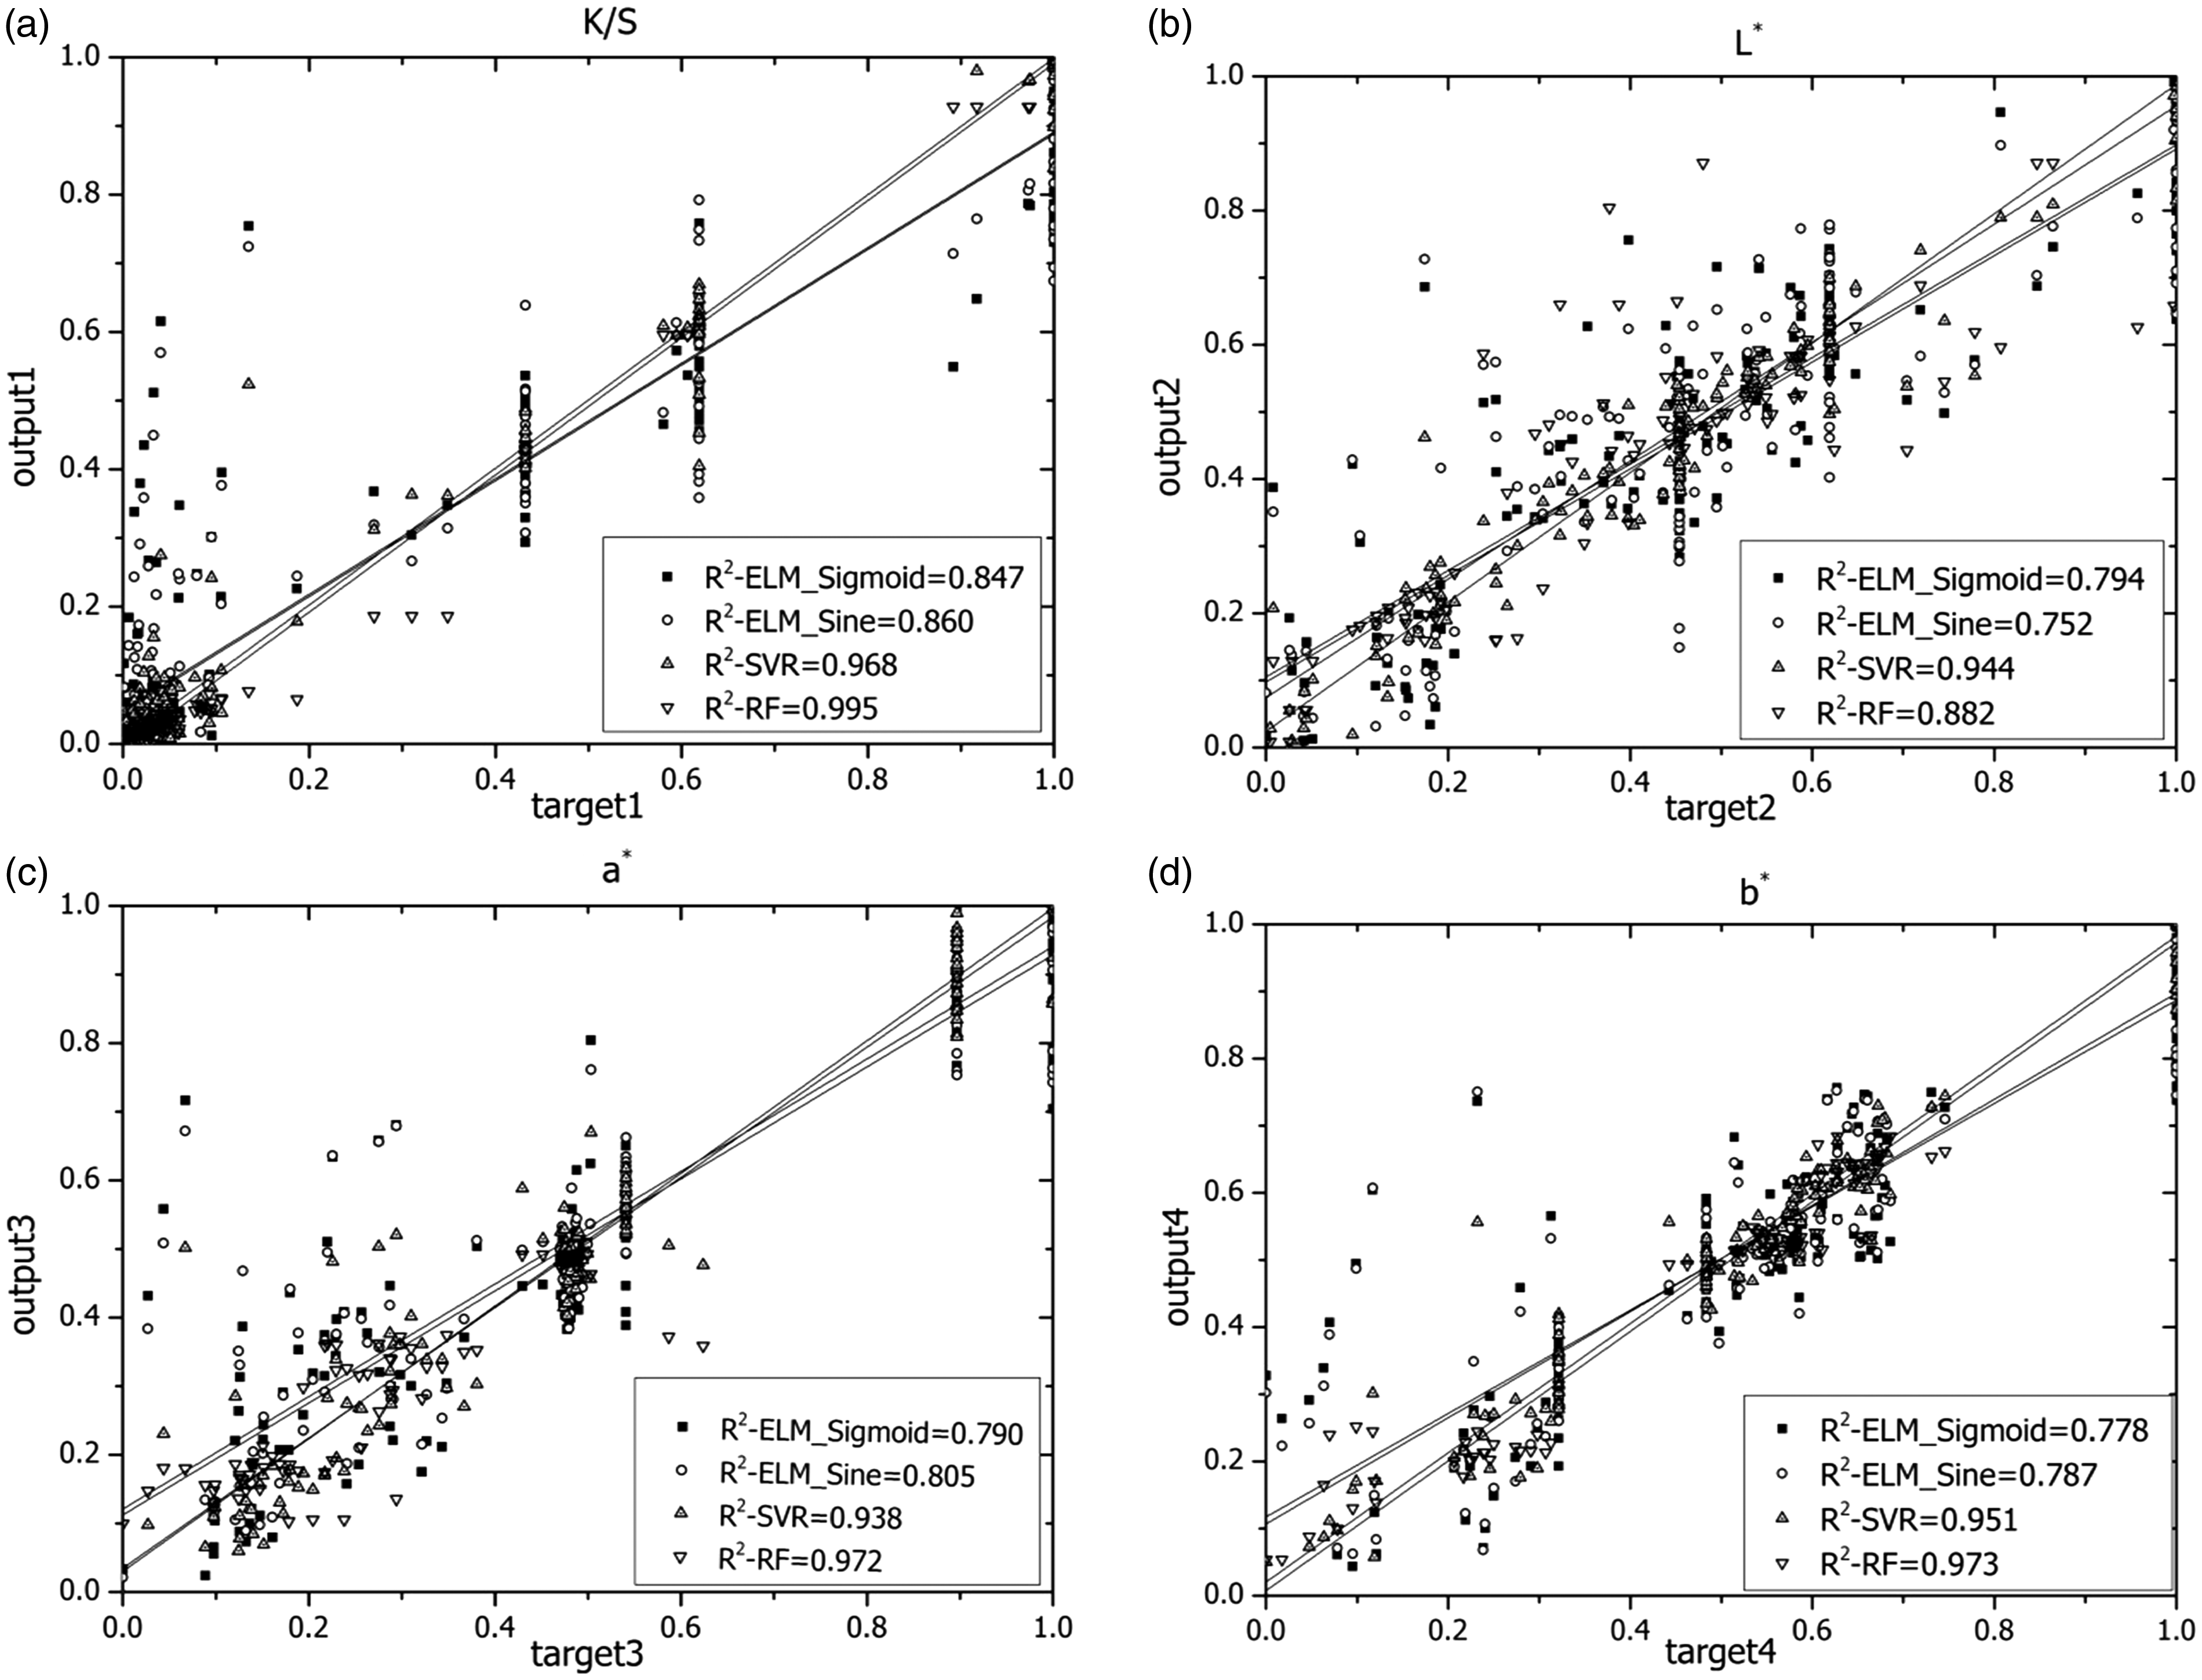
Correlation coefficients of the data in Figure 8
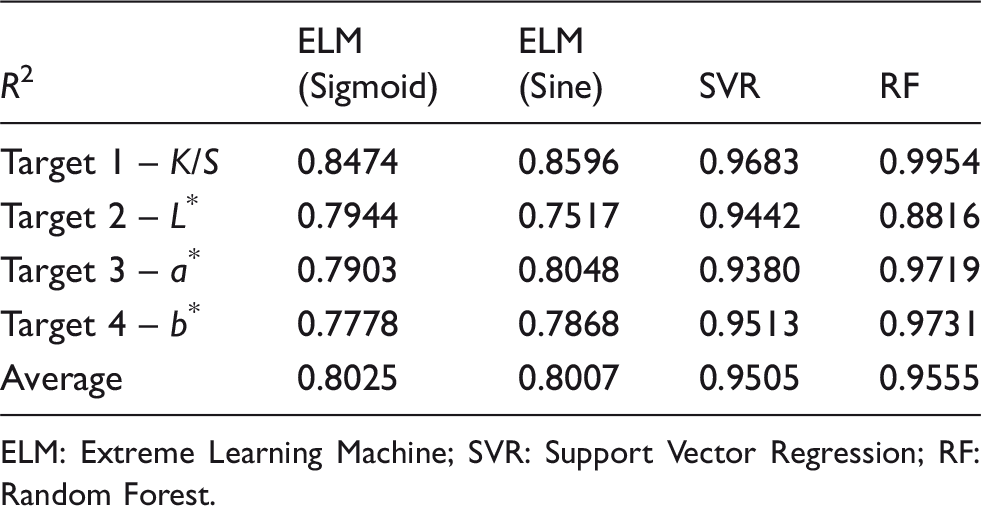
ELM: Extreme Learning Machine; SVR: Support Vector Regression; RF: Random Forest.
Conclusion
In this study, we used three modeling techniques, that is, the ELM, SVR and RF, to model the ozonation process for predicting the color properties of treated dyed textiles. The potential applicability of these models in the use of process modeling in the related textile process was estimated.
Color fading of dyed textiles is a vital process in the textile industry to obtain certain stylish effects on the product; this process has been increasingly used in recent decades. Ozonation is a novel technology developed in recent years to be employed to achieve the color fading effect of textiles with high performance not only in respect of efficiency and quality but also in regards to environmental sustainability. For the purpose of better understanding and application of color fading ozonation of textiles at the industrial scale, the complexity and nonlinearity of the factors and impacts of color fading ozonation on reactive-dyed cotton were investigated by process modeling. The effects of ozonation in terms of pH, temperature, water pick-up, treatment time of process and dyed colors of fabrics on the color fading performance in terms of K/S, L*, a*, b* values of reactive-dyed cotton were modeled using the ELM, SVR and RF, respectively. The results show that both the SVR and RF are potential candidates for modeling the color fading ozonation process of dyed textiles, as their predicted results on the ozonation process had a good agreement with the actual output data entirely as well as individually. However, taking the training time and cost into consideration, the SVR model would be better recommended than the RF to be applied in real use. In contrast, the ELM models performed poorer in the prediction and were very unstable in terms of predicting certain individual outputs in multi-variable process modeling.
The perspective development of modeling color fading ozonation should be drawn toward the realization of garment application. It is a mission that is more challenging that can barely be realized on the basis of experiments about reactive-dyed-cottons and the trials of computational development conducted in the present work. Researchers should expend more effort to expand the application to garment sector in future works.
Footnotes
Declaration of conflicting interests
The authors declared no potential conflicts of interest with respect to the research, authorship and/or publication of this article.
Funding
The authors disclosed receipt of the following financial support for the research, authorship, and/or publication of this article: The first author was supported by the China Scholarship Council (CSC, Project Number 201708420166) for this study.