
Abstract
This study took nano-silica particles mixed in low-density polyethylene to implement the optimum processing parameters and make abnormal parameter identification for the twin-screw co-rotating extruder used in the manufacturing process. The mixing quality was divided into distribution and dispersion, where distribution was tested by an energy dispersive spectrometer and evaluated using the coefficient of variation. Dispersion was assessed by the surface effect and specific surface equations, as based on the spectrum of scanning electron microscopy. By using the Taguchi method in planning the experiment coupled with an analysis of variance, we conducted the single-quality characteristic analysis of the experimental results of the two quality characteristics, namely the distribution and dispersion. Then, by using the hierarchical architecture of analytic level process, we can obtain the optimized parameter factors and levels and the calculation of the total weighting of various parameter levels, as well as the ranking of the parameter levels. According to the confirmation experimental results, the signal-to-noise ratios of distribution and dispersion fell within 95% confidence intervals, indicating that the experiment can be represented and reliable. The optimum parameters combination is SiO2 addition level 1%, screw speed 60 rpm, mixing time 5 min, temperature (upper) 150℃, temperature (middle), 175℃ and temperature (lower) 190℃. After that, by using the optimal parameters and operation processing parameters for support vector machine classification, the abnormality of the processing parameters can be identified for 100%. The good quality of the production can be guaranteed during the extrusion.
Keywords
The discovery of nanotechnology has led to the development of nanoparticles for various end uses, such us nano-composite fibers due to the high-tech applications of textiles. Therefore, studies on modifying the properties of polymeric fibers have increased lately. 1
Low-density polyethylene (LDPE) has branched-chain and straight-chain structures, and its molecular weight is usually 50,000 g/mol. It is considered to be an important thermoplastic polymer material, especially due to its low density, good fabricability and easy formability.2,3 However, the production of high-stiffness and high-strength polyethylene fibers has long been one of the challenges faced by polymer scientists and engineers,4–6 and the application of polyethylene fibers is often limited by relatively poor creep resistance as well as low shear modulus and strength. The main method adopted in today’s industry is to produce high-performance polyethylene fibers through a combination of melt spinning and drawing process parameters. However, Chantrasakul and Amornsakchai 7 found that the introduction of a small amount of layered silicates into polyethylene materials could significantly improve the mechanical properties of polyethylene fibers in terms of the elastic modulus and breaking elongation properties. Zhang et al. 8 studied the impact of the addition of silicon dioxide nanoparticles to polyethylene composite fibers and analyzed the material morphology, adhesion and mechanical properties. It was observed that compared with regular fiber, nano-silicon dioxide can promote lower crystal size and higher crystallinity, as well as significantly increase its mechanical properties and amplify interfacial adhesiveness to epoxy resin. Ju et al. 9 presented the nano-silica/LDPE composites using a melt-mixing approach to improve the dielectric properties. Scanning electron microscopy (SEM) revealed that modified nano-silicas were dispersed more evenly in the matrix than the unmodified ones. The dispersion of nanoparticles in the polymer matrix is the key factor affecting the electric insulating properties of nano-composites. The traditional method of preparing polymer/silica composites was direct mixing of the silica into the polymer. The mixing could be done by melt blending. The main difficulty in the mixing process is the effective dispersion of the silica nanoparticles in the polymer matrix, because they usually tend to agglomerate. 10
Nanoparticle silica is likely to aggregate for high surface activity and specific surface area and, thus, it is incompatible with polymers; however, the compatibility between the two materials can be increased by increasing the dispersion of nanoparticles in the composite.11–16 Bula and Jesionowski 17 melted and mixed different contents of silica and polyethylene for experimentation, and the results showed that the increase in Young's Modulus of the composite was related to the interface compatibility between plastics and nanoparticles and, thus, the interaction of plastics and silica reduced the size of the silica aggregate. Redhwi et al. 18 designed the LDPE composite, which allows the interfaces of polymer and nano fillers to be increased by reducing the mean particle size of the filler and increasing the specific surface area. Thus, different nanoparticles had good dispersion, and the maximum enhancement efficiency was obtained using a nano material with the minimum surface area. They indicated that the composite properties cannot be predicted only by the specific surface area of particles, meaning the distribution of fillers in the polymer matrix is also a major factor. Hu et al. 19 explained using SEM that the impact strength decreased at the aggregation site of the composite of silica particles and amorphous materials. Based on the above, silica needs to have good dispersion, leading to low nanoparticle agglomeration and contributing to increasing the mechanical properties of plastics. The points of these researches are viewing the impact of uniformity of nanoparticles on crystal size and crystallinity, so as to effectively improve the physical properties of fiber.
Basically, using an extruder, the thermoplastic and nanoparticles are compounded by melting–compounding before spinning. Then, the filaments were spun using melt spinning. Therefore, it is of great significance to study the impact of nano-silicon dioxide/polyethylene on uniformity under the process parameters of the twin-screw extruder mixing process. 14 Sasimowski et al. 20 used LDPE to test screw mixing, where the flow rate and viscosity, as resulted from the screw shape, had different torque values. Elemans et al. 21 proposed the effect of mixing temperature on torque. Isac and George 22 studied the relationship between viscosity and torque during the melt mixing of material. Kumar et al. 23 indicated that different factors would induce changes in torque. Crawford et al. 24 indicated that a higher temperature results in lower viscosity of material, and the torque changes slightly when the material flows. Yousfi et al. 25 indicated that the shear force increased with the screw speed, and the viscosity decreased as the temperature rose. Based on the above, the processing parameters during mixing can affect the torque, viscosity and shear force in the extruder. This study used the three data to validate the exceptions of the processing parameters of an extruder. Wang et al. 26 indicated that the maximum torque increases with the material content, and a steady state is reached after long-term mixing. Vercruysse et al. 27 and Dhenge et al. 28 found that, when different parameters are used for a mixing experiment, the steady state of the torque, viscosity and shear force values is reached after a period of time. Therefore, this study used these values as eigenvalues for the extruder mixing process.
In this study, the uniformity was divided into distribution and dispersion. The coefficient of the variation is used to discuss distribution. The specific surface area and surface effect are used to discuss dispersion. This experiment was designed based on the Taguchi method, and different processing parameters were used for multiple mixing to obtain single-quality optimum processing parameters. The experimental reproducibility was validated by confidence interval testing. Finally, the multi-quality optimum processing parameters were obtained by the analytic level process (AHP). The optimization experimental results show the feasibility of the dispersion and distribution defined in this study. The latter part of this study demonstrates that the multi-quality optimum processing parameters in the mixing process could be reflected in the online torque, viscosity and shear force values. These parameters can be used as the features of the processing factors, and the support vector machine (SVM) is applied to identify the abnormal parameters. The results can contribute to the evaluation of product quality in the actual process, and the processing parameter exceptions can be found by online data analysis during mixing. The defective mixed products can be directly removed from regular operation.
Materials
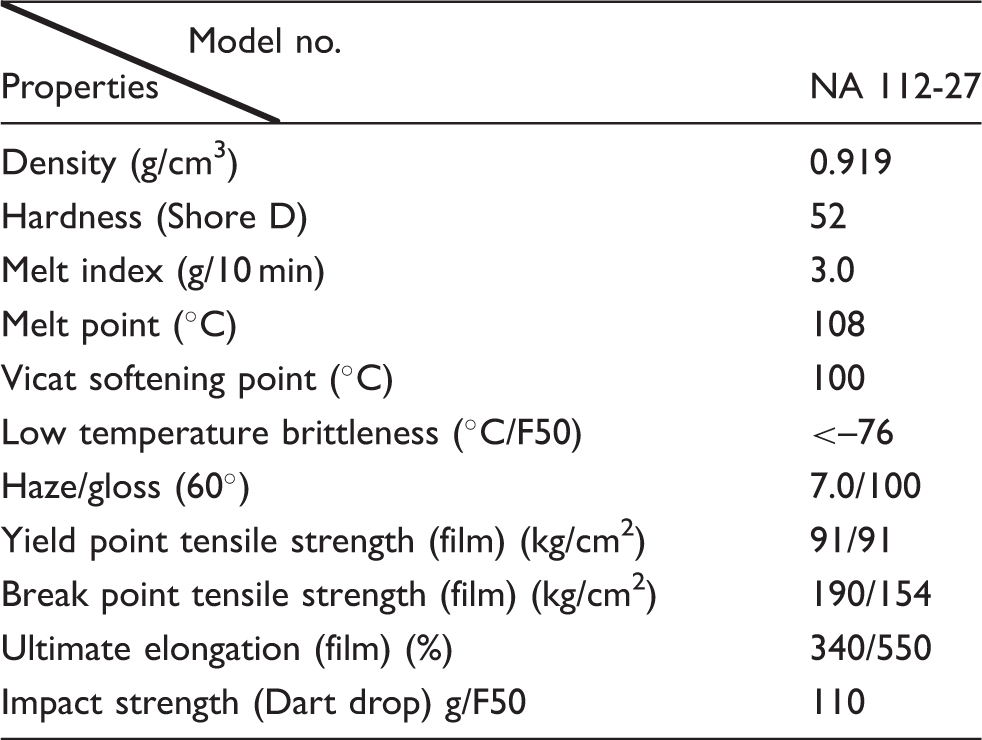
LDPE
The specifications of low-density polyethylene
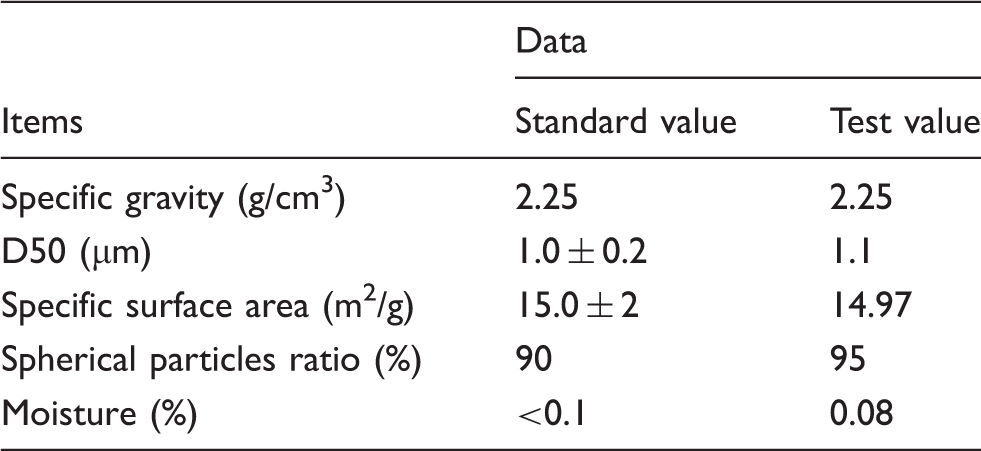
SiO2
The specifications of spherical silicon dioxide
Experimental machine
The micro co-rotating twin-screw extruder has two co-rotating screws for mixing. The structure comprises a feed inlet, a three-stage heating part and a material outlet. The extruder has three characteristics:
small-quantity mixing, where the material mixed each time is less than 15 g; cyclic mixing, where if the material outlet is not opened, the material returns to the top of the screw through the nearby channel, and is mixed again until the material outlet is opened and, thus, the mixing effect is better; real-time online machine monitoring, where a computer screen directly displays the speed, viscosity and temperature of the material mixing machine.
The micro extruder used in this study was the Twinson International Limited model Xplore MC-15, as shown in Figure 1. The section is shown in Figure 1(b). The material was pressed by the extruder in the feed inlet, the material was molten and was mixed in the direction of the arrow in the screw. The material outlet was opened after the mixing time, and the mixed material was extruded from the material outlet by the screw. The extruder has six controlled parameters, which are the screw speed, three heating temperatures, SiO2 addition level and mixing time. According to extruder processing,
29
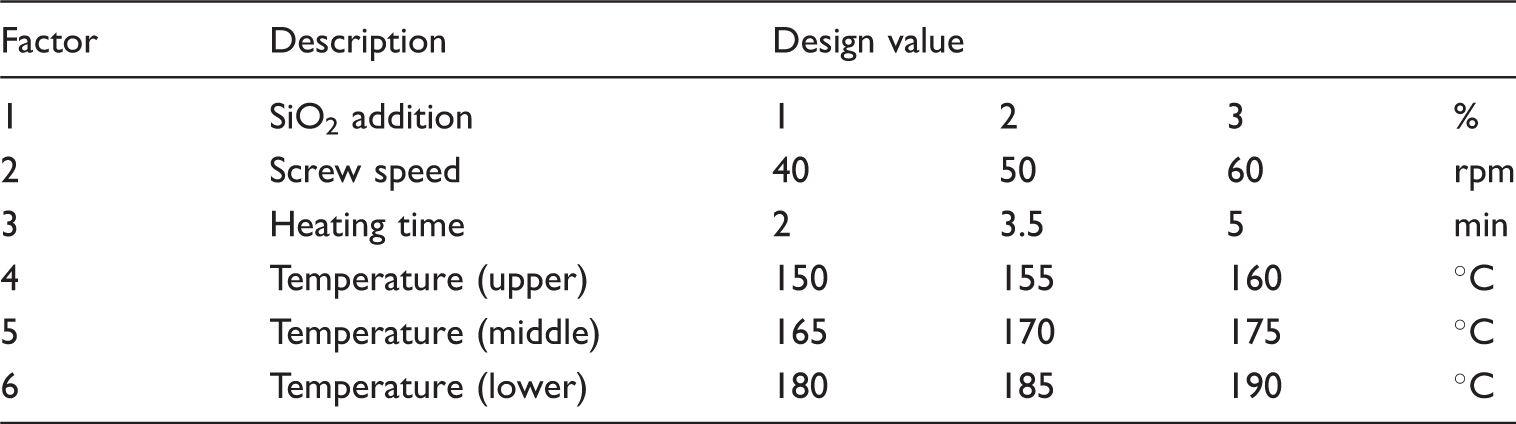
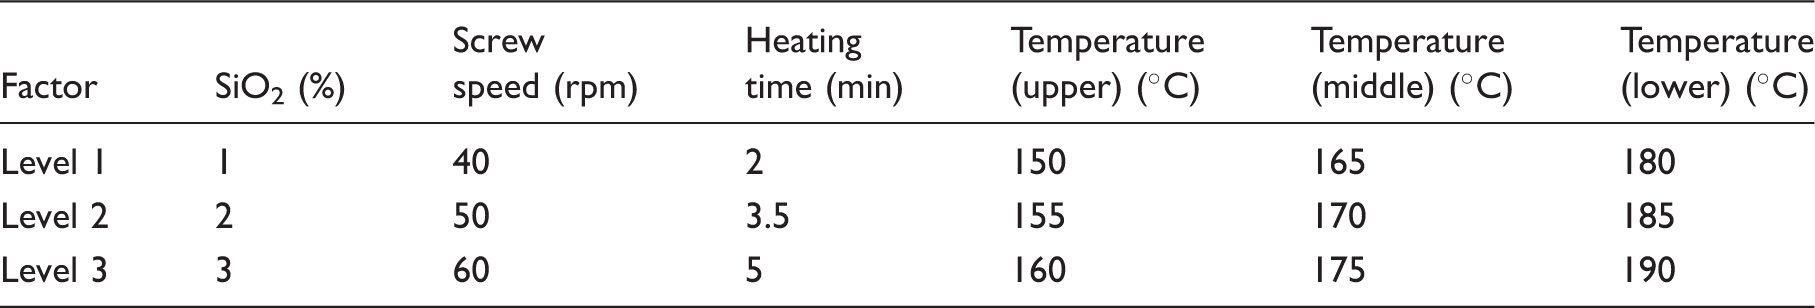
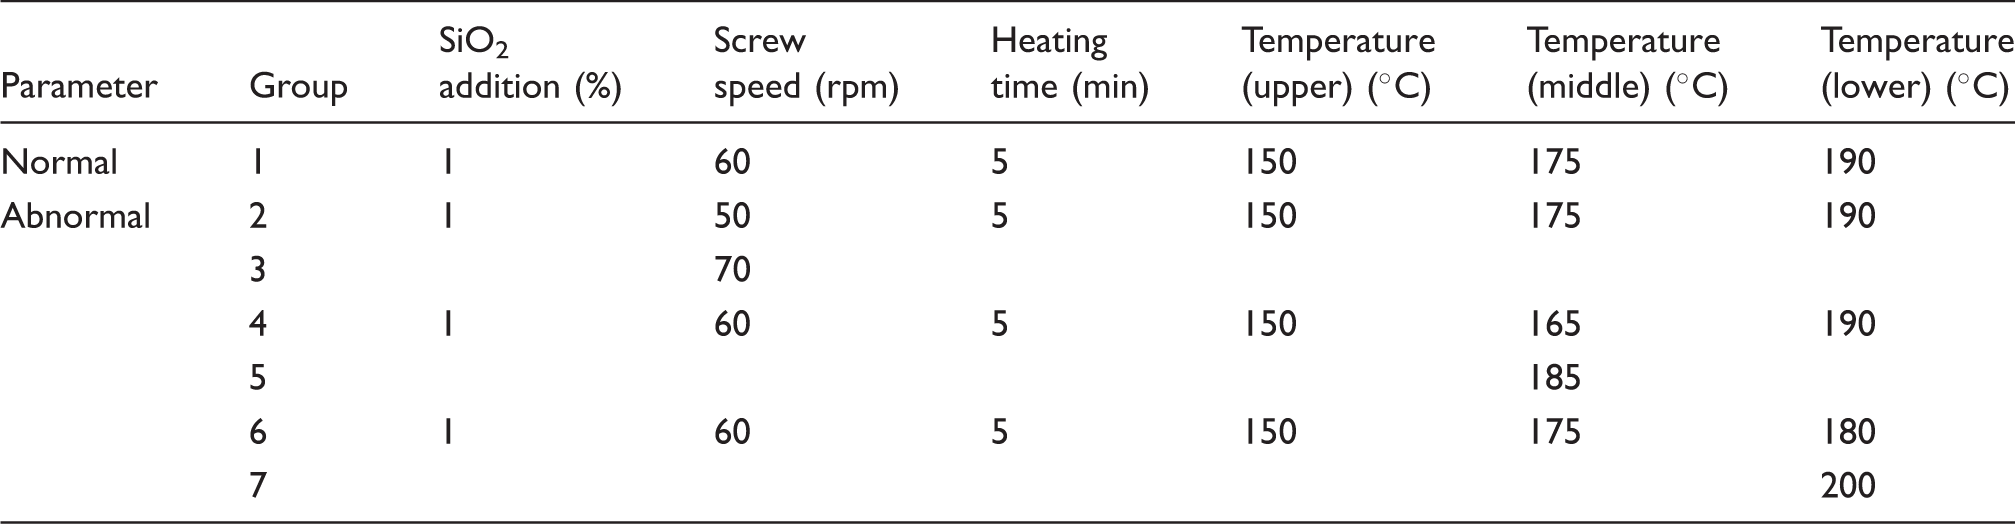
the processing parameters are adjusted to SiO2 addition levels of 1%, 2% and 3%; the screw speeds are 40, 50 and 60 rpm; the mixing times are 2, 3.5 and 5 min; the temperatures (upper) are 150℃, 155℃ and 160℃; the temperatures (middle) are 165℃, 170℃ and 175℃; the temperatures (lower) are 180℃, 185℃ and 190℃, as shown in Table 3.
Co-rotating twin-screw extruder: (a) appearance; (b) structural diagram. Control parameters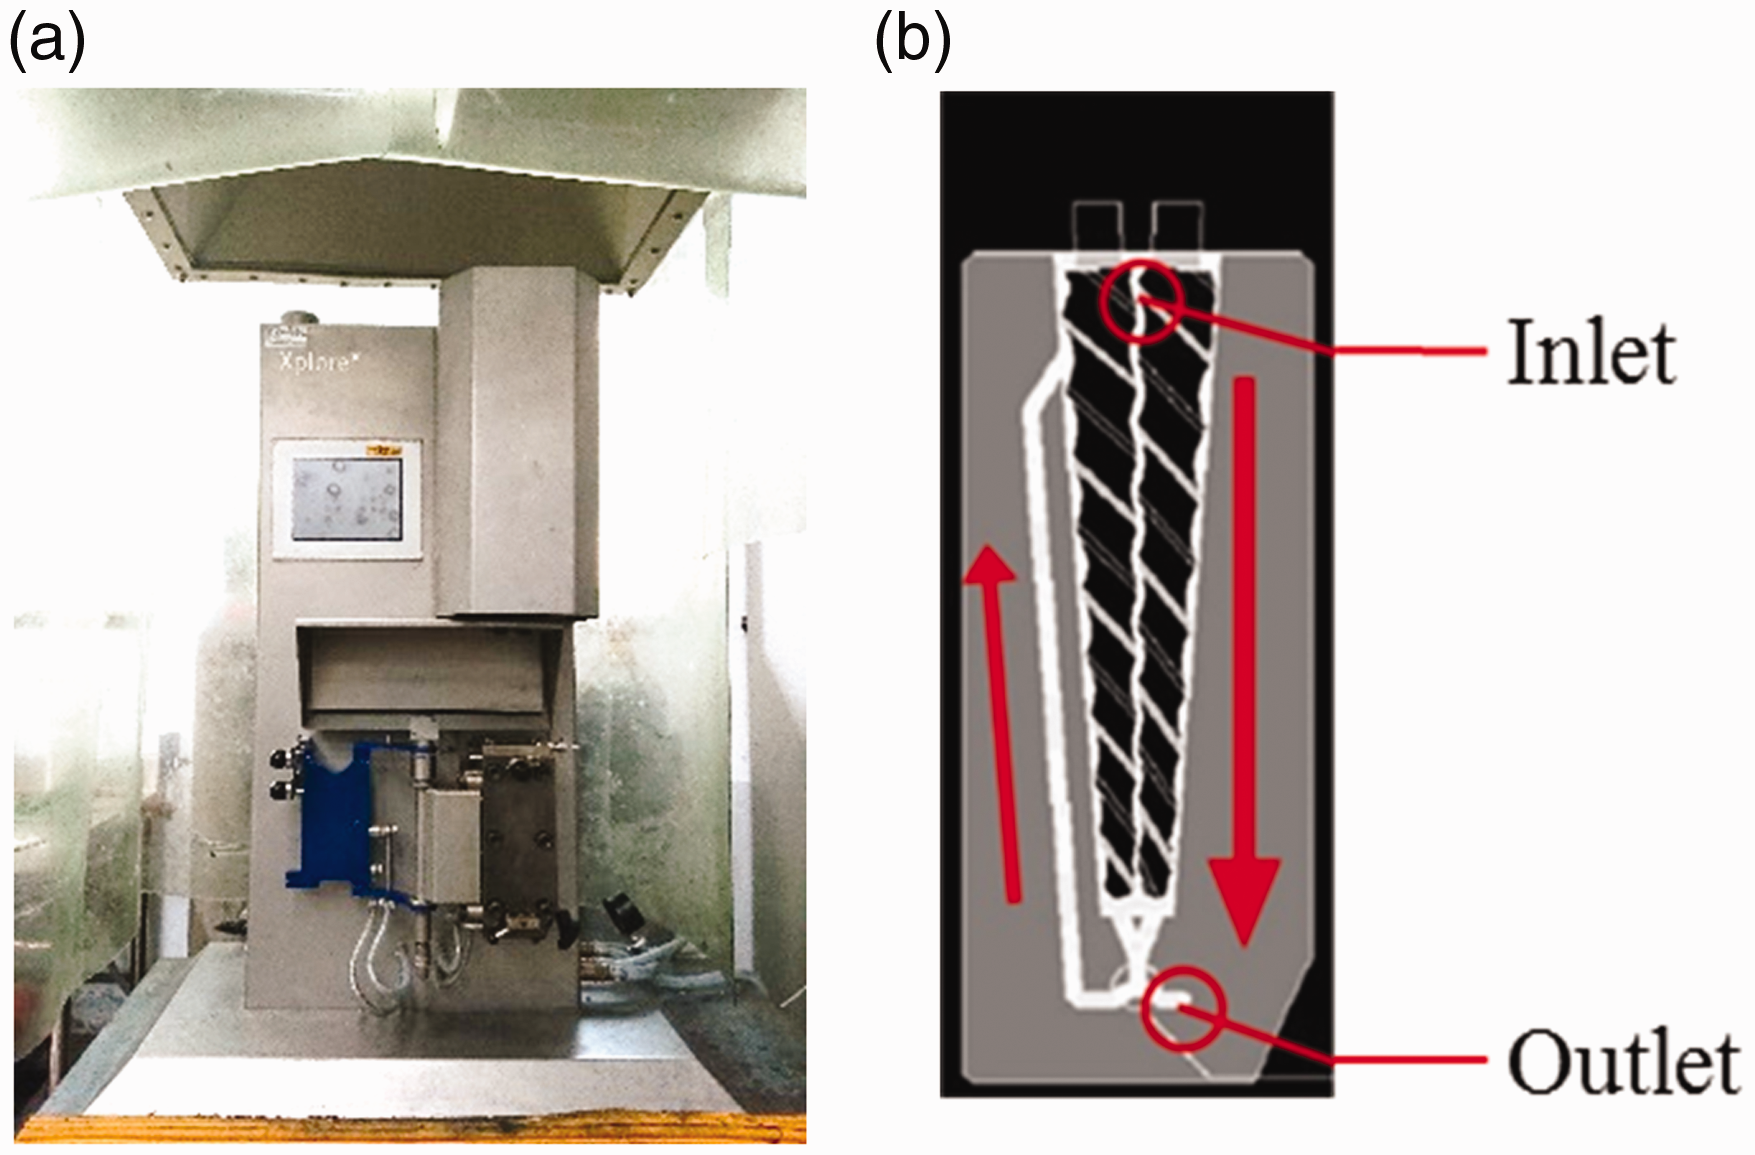
In this study, the mixing qualities of the extruder will be divided into distribution and dispersion, which are represented by the numerical values for subsequent experiments. The distribution was tested by an energy dispersive spectrometer (EDS) and evaluated using the coefficient of variation. Dispersion was evaluated by the surface effect and specific surface equations, as based on the spectrum of SEM.
Energy dispersive spectrometer
The energy dispersive spectrometer used was an Oxford model Inca energy 400; the distribution is measured by using the element content measured by the EDS.
SEM
A JEOL JSM-6390LV scanning electron microscopy with voltage 20 kV, height 12 mm, spot size 60 and magnified 1500 times was used for material surface structure analysis to evaluate the dispersion.
Research methods
This study took nano-silica particles mixed in LDPE to implement the optimum processing parameters and identify abnormal parameters for the twin-screw co-rotating extruder applied in the extrusion process. The mixing qualities of the extruder include dispersive mixing and distributive mixing. 30 Dispersive mixing refers to the break-up of the minor components of a mixture into smaller size particles, whereas distributive mixing leads to a homogeneous spatial distribution of the minor components into the polymer matrix. 31
This study used the Taguchi method combined with the AHP to present optimization design of the twin-screw co-rotating extruder system for improving the two quality characteristics, namely distribution and dispersion. First, the Taguchi method was coupled with the analysis of variance (ANOVA) to obtain the best parameter combination on each single-quality characteristic of distribution and dispersion. In order to achieve the maximum mixing quality of the extruder system, the multi-quality analysis AHP was used to obtain the optimal control parameter combination according to the contribution degrees of quality weight. Then, the multi-quality optimum parameters were used as the factors and were identified by the SVM. Thus, the operation processing parameters are normal or not can be identified directly.
Distribution
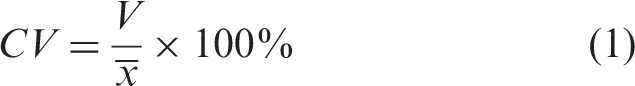
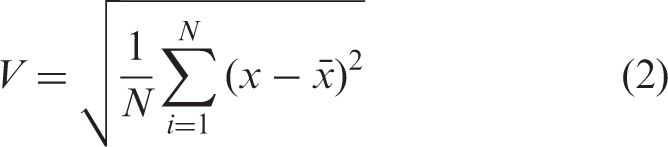
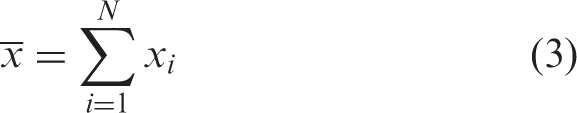
The distribution defines the excellent nano-composite materials, and the particle contents in different positions of substrate should be about the same.32,33 In the calculation of distribution, the content variance of SiO2 in different positions of LDPE is calculated, where the larger the variation coefficient, the larger the tendency of dispersion of the group,30,34,35 which is expressed as Equations (1)–(4)

Dispersion
The dispersion defines the agglomeration degree of particles, where the purpose is to disperse the agglomerated particles into fine particles. When the particles are small, the specific surface area is large and the surface effect is high. In comparison to straight polymer, as the added nanoparticles have a very large specific surface area, the mechanical properties of nano-composite materials are significantly improved.36,37 Therefore, the dispersion is discussed by using the definition of the image processing SEM spectrum, and the mean specific surface of particles in the range is calculated. The dispersion of particles is expressed in Equation (5)

At present, documents regarding particle uniformity only discuss the agglomeration of particles, that is, the dispersion, while the subjective evaluation is given only by the SEM spectrum and, thus, there is no objective data for comparison.
Taguchi method
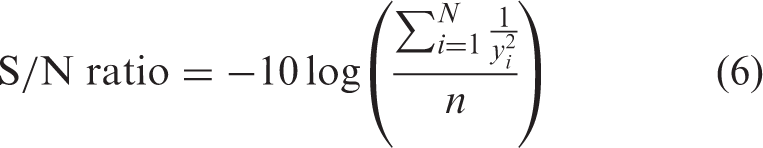
This study required that the qualities, dispersion and distribution are higher the better, so the larger-the-better signal-to-noise (S/N) ratios are used, expressed as Equation (6)
Experimental parameters of the orthogonal array
Analysis of variance
The experimental data derived from the orthogonal array were made into an experiment data sheet. The measured quality data were calculated by Equation (6) to obtain the larger-the-better S/N ratio. The S/N ratio factor response table was used to make an ANOVA table. The ANOVA table contains the experiment error, sum of square, degrees of freedom, average response value estimated variance and F distribution.
(1) Experimental error (S)
The experimental error is defined as in Equation (7)
(2) Sum of squares (SS)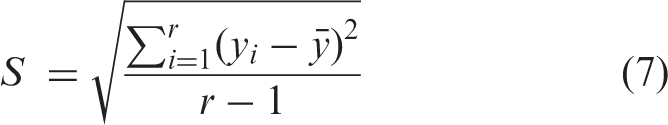
As various groups of data are measured independently, the degree of freedom (DOF) of the vector is n × r, the mean value of the measured total mechanical quality only contains one (3) DOFs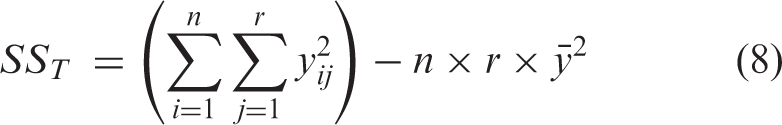
DOFT denotes the DOFs of the total variation vector, DOFA denotes the DOFs of the factor A effect vector, DOFe denotes the DOFs of the error vector and the relationship is expressed as in Equation (9)

The factor variation vector SSi is divided by DOFi, expressed as Equation (10)
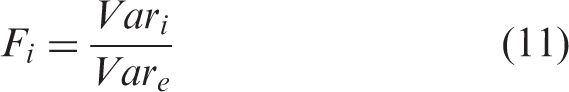
(5) F distribution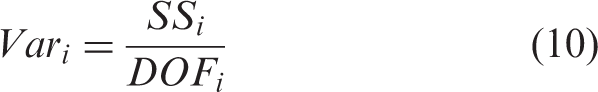
The denominator of the F-value is the error variance Vare estimated by the original sample number; the numerator is the variance Vari of the original sample estimated by the sample mean, expressed as Equation (11)
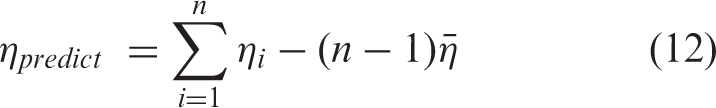
Confidence intervals and confirmation experiment
The confidence intervals reflect the error. The confidence level is the probability of an uncertain measured value or calculated value occurring in an interval; this interval is called the confidence interval. The S/N ratio prediction value is expressed as Equation (12)
The confidence limits are the upper and lower bound value of the confidence interval, expressed as Equations (13) and (14)
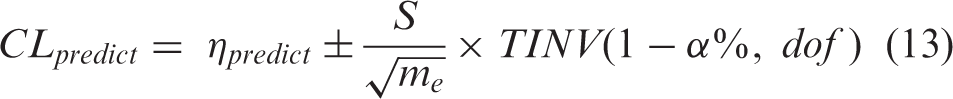
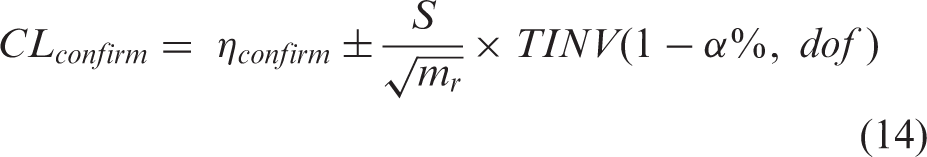
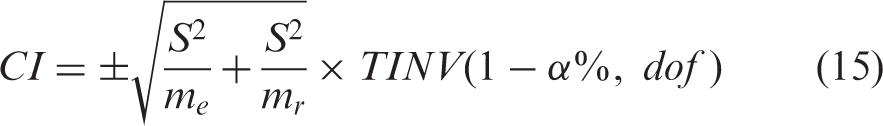
When the experimental S/N ratio and predicted S/N ratio in the confirmation experiment are in the error range and close to each other, the reproducibility of this experiment is very high, the experimental model is reliable and CI is the α% permissible error difference between the prediction value and confirmation experiment value, or α% confidence interval, expressed as Equation (15)
AHP
In this study, the two qualities characteristics are distribution and dispersion. However, the Taguchi method can only be used for the best solution of a single quality. Since this study wants to obtain the best solution of distribution and dispersion to achieve the maximum total quality of the extruder system, a multi-criteria analysis and decision-making technique, the AHP,41,42 is chosen for analysis.
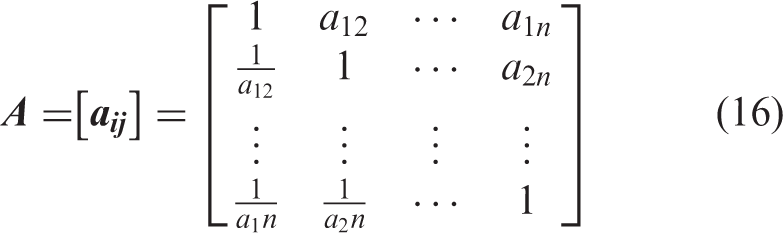
The hierarchical structure of this study comprises a multi-quality optimum parameter combination (ultimate objective), two product qualities (major factor layer) and six control factors (minor layer). The hierarchies are connected completely to form multiple hierarchies. The contributions of the six factors to the quality are obtained from the Taguchi method, and the single-quality optimization parameter group is obtained. In order to obtain multi-quality optimization parameter group, the importance matrix can be calculated by the importance of the two qualities to the research purpose, expressed as Equation (16)
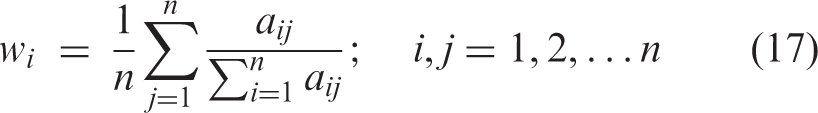
The consistency of hierarchies is confirmed, and the weight value of the two qualities is obtained, expressed as Equation (17)
The weight value is multiplied by the contributions of the six factors to obtain the multi-quality optimum parameter group, expressed as Equation (18)

SVM
The SVM43,44 is a supervised learning method, giving training samples and tags. The SVM determines a model according to the training samples. The test samples can be classified during testing, and whether the tags of the test samples meet the model is analyzed. This method has a superior recognition rate for the two-classification problem. The SVM uses data samples to find out a boundary of a hyperplane and classification in a higher space. In the two-classification problem, the widest supporting hyperplane is found by the vector of the test sample, and the middle solid line of the supporting hyperplane is the optimum hyperplane, providing a reference for subsequent test sample classification. This study used MATLAB for the SVM classification. The radial basis function (RBF) is used as the kernel function of the SVM; the RBF kernel function maps the nonlinear data point into a high-dimensional space so as to find the optimum hyperplane in high-dimensional space for separation. Half of test and training samples are selected randomly.
Results and discussion
Uniformity test result
L18 orthogonal array
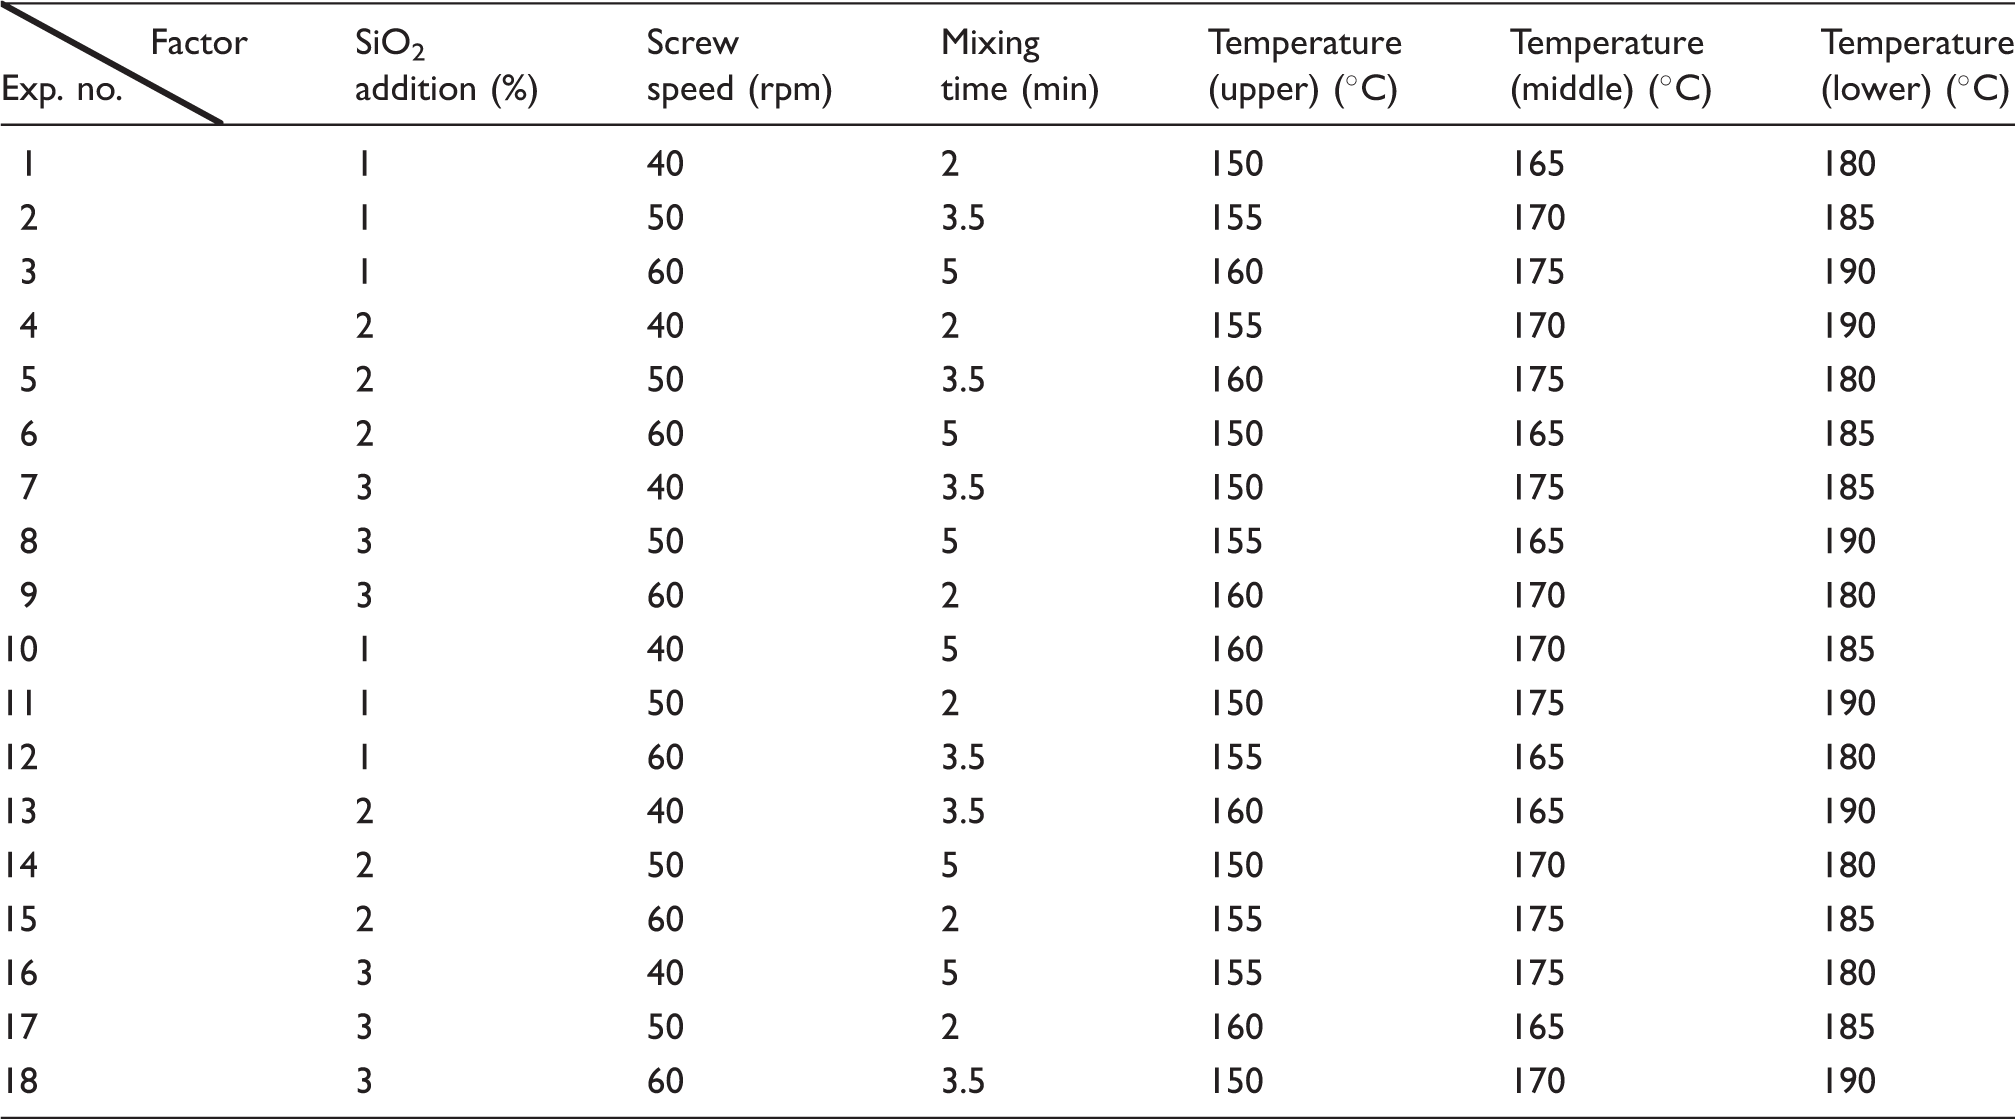
The melting point of LDPE is 106℃, whereas the temperatures in the experiments on a twin-screw mixer in the references are 135℃, 145℃, 190℃, 195℃ and 215℃, so the mixing temperature range is set as 150℃ in this study, each level is increased by 5℃ to 190 C and smooth mixing is guaranteed. 29 According to Redhwi et al., 18 Isac and George 22 and Jeziórska et al., 29 the SiO2 addition level is 1–5%; there are better mechanical properties when the addition level is 1%, so the levels are set as 1%, 2% and 3%. Such parameters as the screw speed and mixing time are designed according to the formula for smooth mixing in actual operation.
The mixing is performed five times for each experiment, and a section is analyzed; the sample section is circular and the diameter is about 3 mm, magnified 1500 times to test nine different positions of the section. The distribution and dispersion are calculated.
(1) Distribution
The nine positions of the section are tested by the EDS; the measuring area is 62 µm × 84 µm. For example, one group of measured silicon content is 2.35%, 2.17%, 3.12%, 2.29%, 2.97%, 2.35%, 2.22%, 2.10% and 2.07%; the values are substituted in Equation (4) and the calculated distribution is 85.37%.
(2) Dispersion
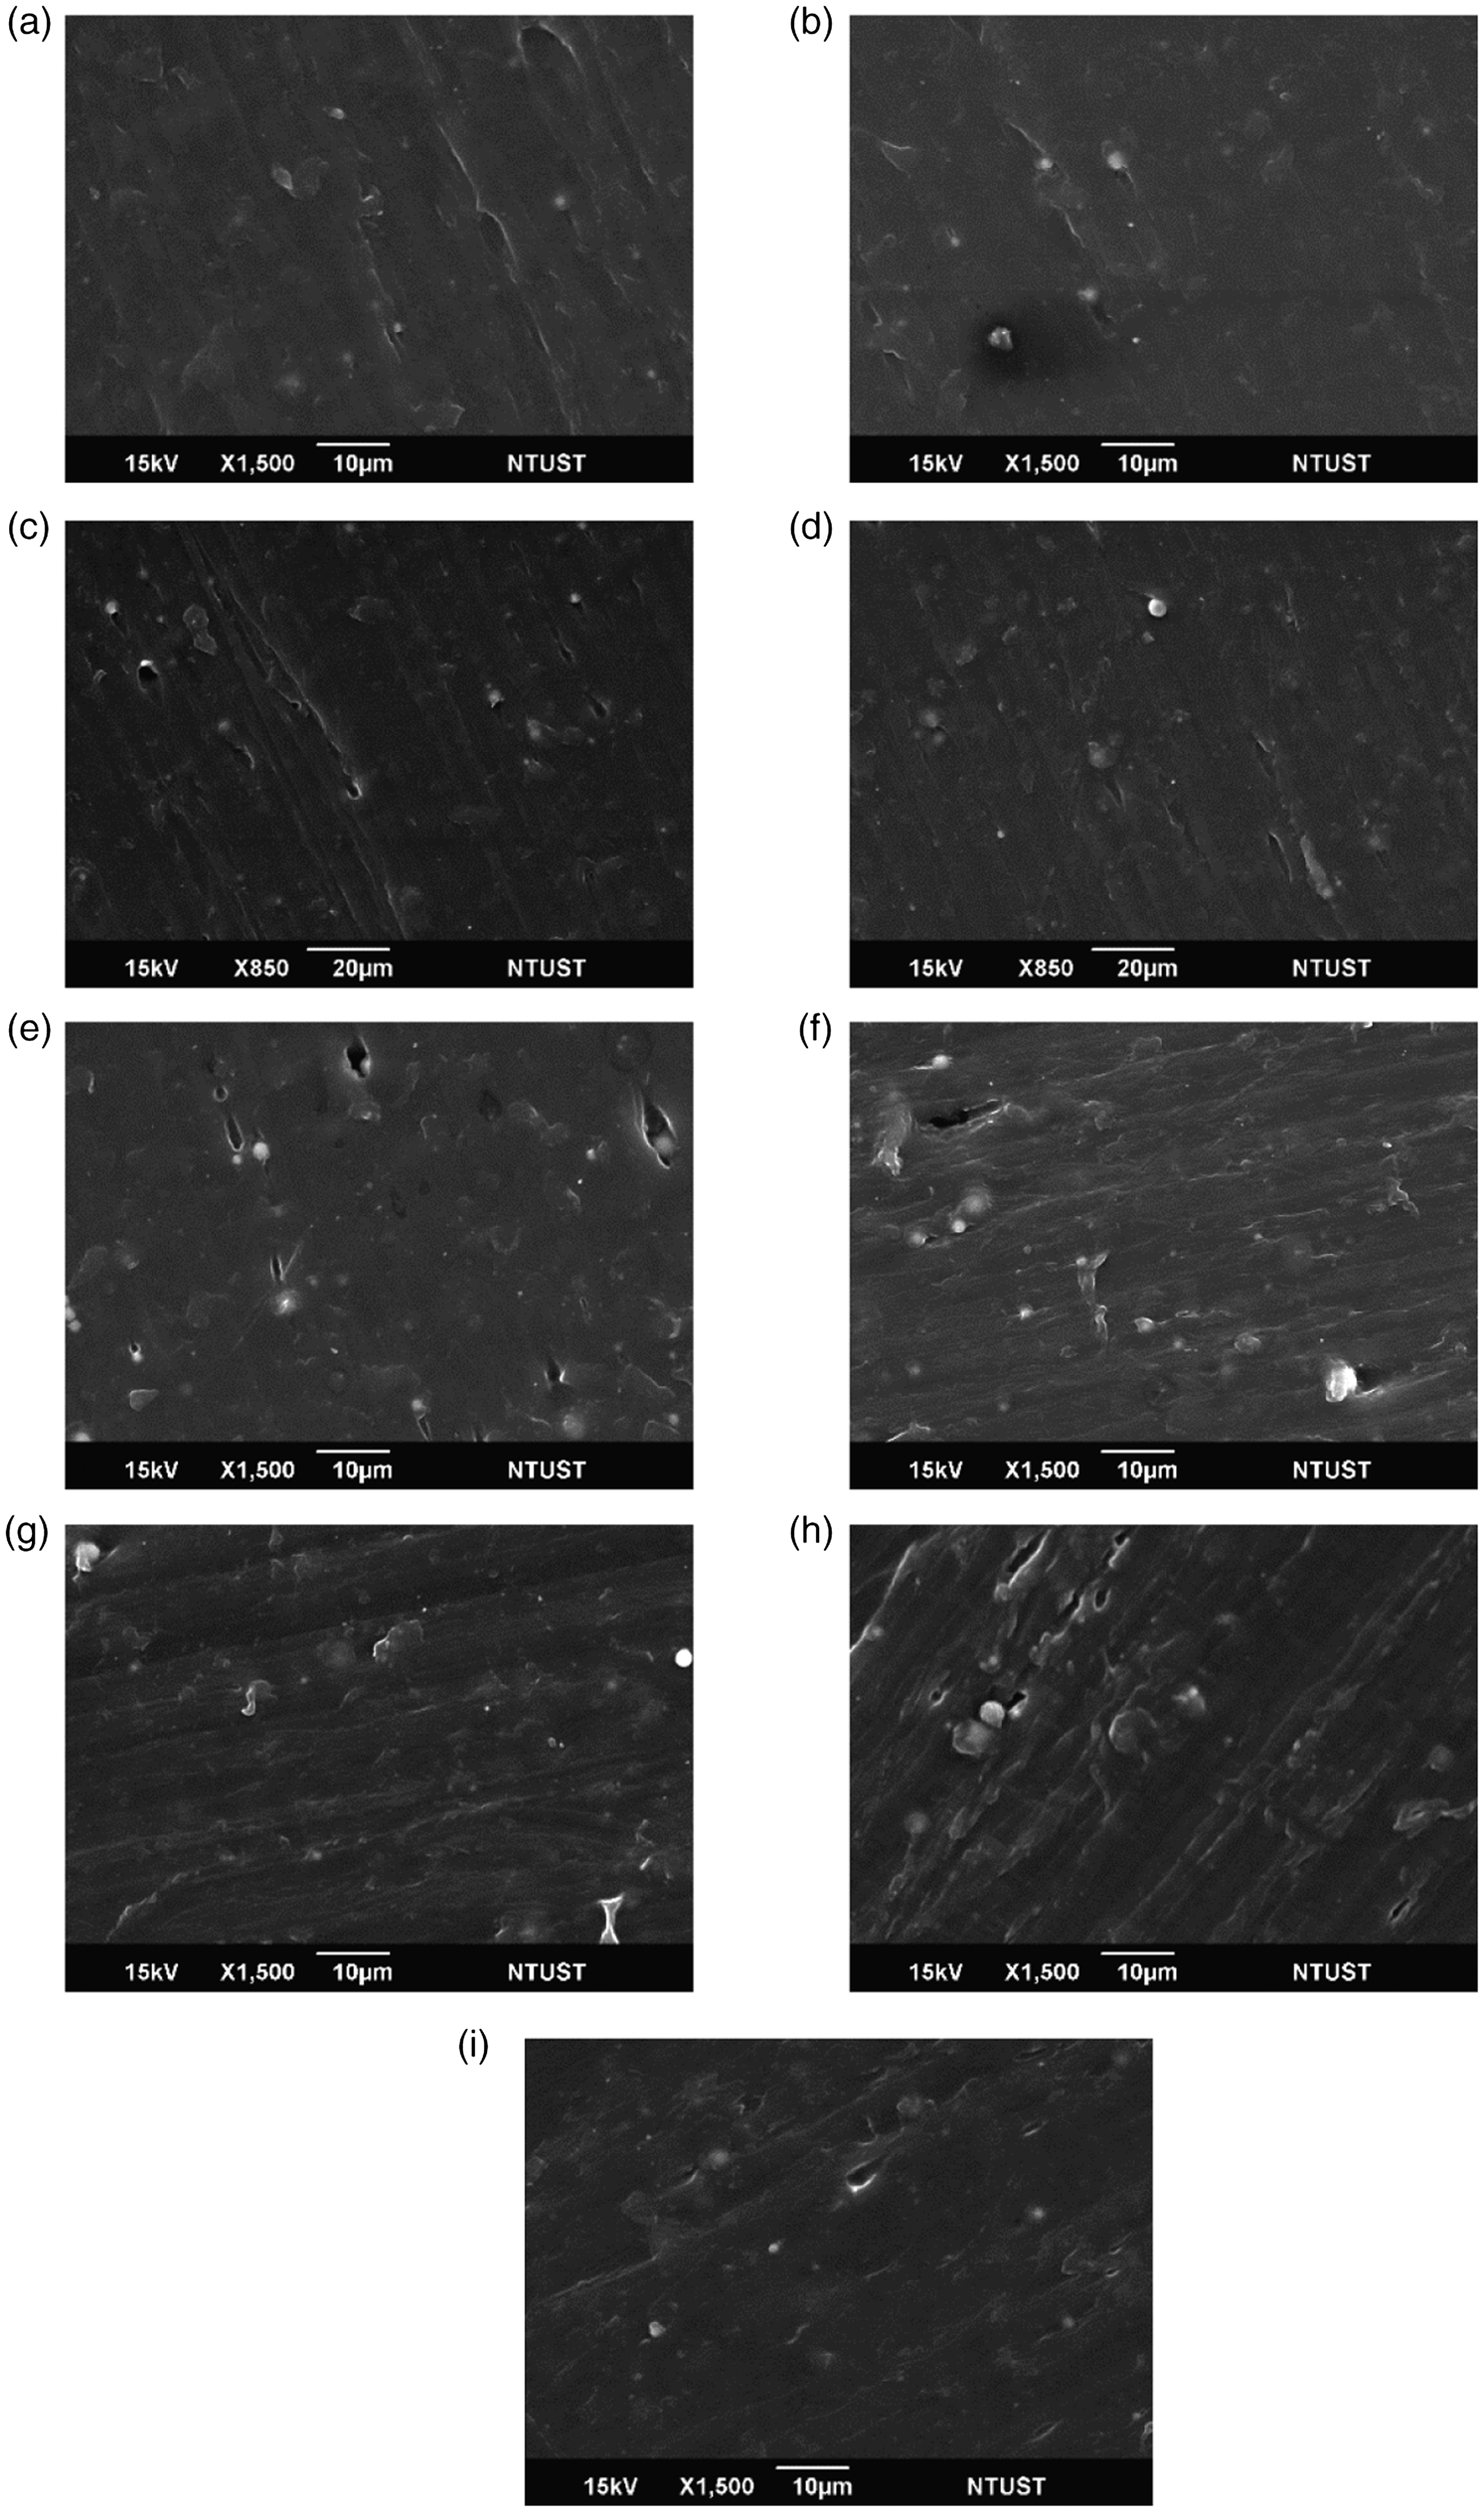
The nine positions of the section are analyzed by SEM, and the spectrum is extracted. The region size is 56 µm × 84 µm. The center point and edge of particles are selected by MATLAB to draw a circle automatically. The perimeter area ratio of the circled object is calculated by Equation (5), and the value is the distribution of the object. The average distribution of all objects in the same spectrum is the dispersion of this spectrum. Finally, the average dispersion of the nine spectra is the dispersion of this mixing material. Taking the dispersions of two mixings as examples, Figures 2(a)–(i) show that the average dispersion of the nine spectra is 17.71%, which is the dispersion of the mixing. Figures 3(a)–(i) show that the average dispersion of the nine spectra is 43.55%, which is the dispersion of this mixing. The two dispersion results are shown in Figure 3. The dispersion is better, the particles are smaller and there is no aggregation. According to Equation (5), the particle radius can determine the dispersion. For the limitation of silica particle size, the optimal dispersion is about 45% and the performance of dispersion is derived from pairwise comparison.
Dispersion measurement (I): (a) dispersion 19.69%; (b) dispersion 15.80%; (c) dispersion 13.55%; (d) dispersion 17.97%; (e) dispersion 19.31%; (f) dispersion 19.53%; (g) dispersion 16.87%; (h) dispersion 16.93%; (i) dispersion 19.75%. Dispersion measurement (II): (a) dispersion 44.73%; (b) dispersion 43.77%; (c) dispersion 47.52%; (d) dispersion 44.80%; (e) dispersion 43.23%; (f) dispersion 41.59%; (g) dispersion 42.08%; (h) dispersion 41.87%; (i) dispersion 42.37%.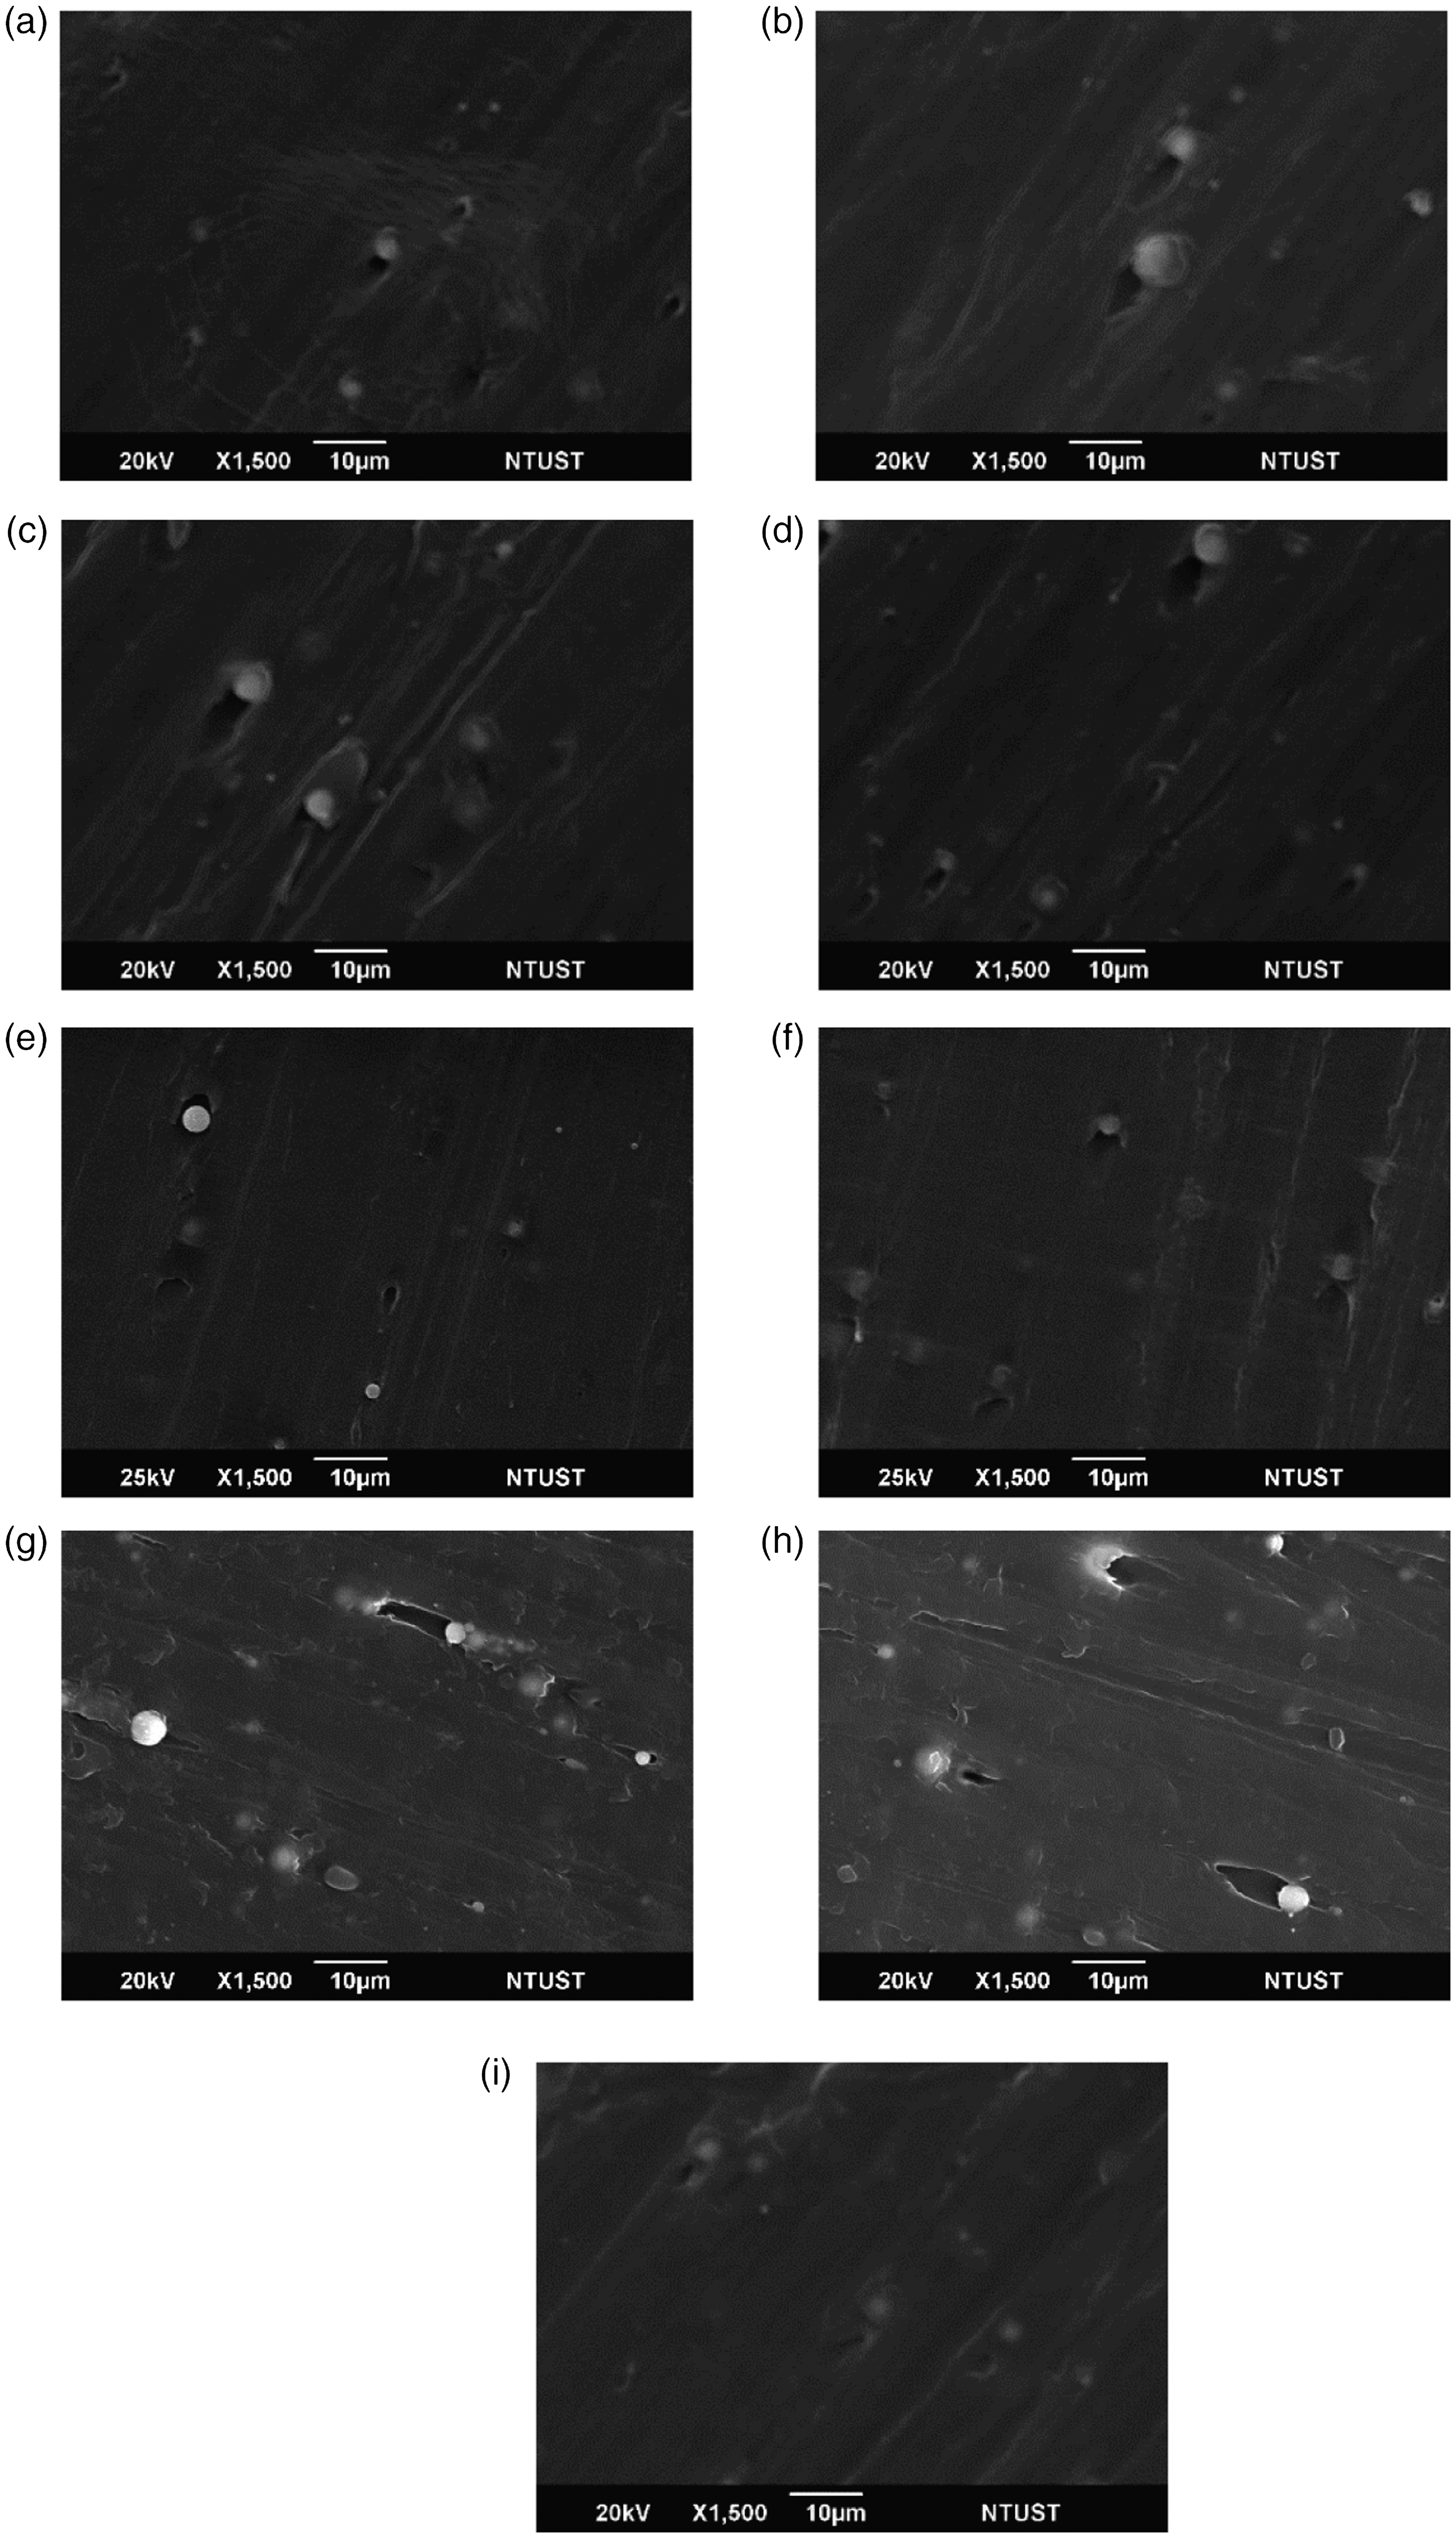
Single-quality optimal experimental results
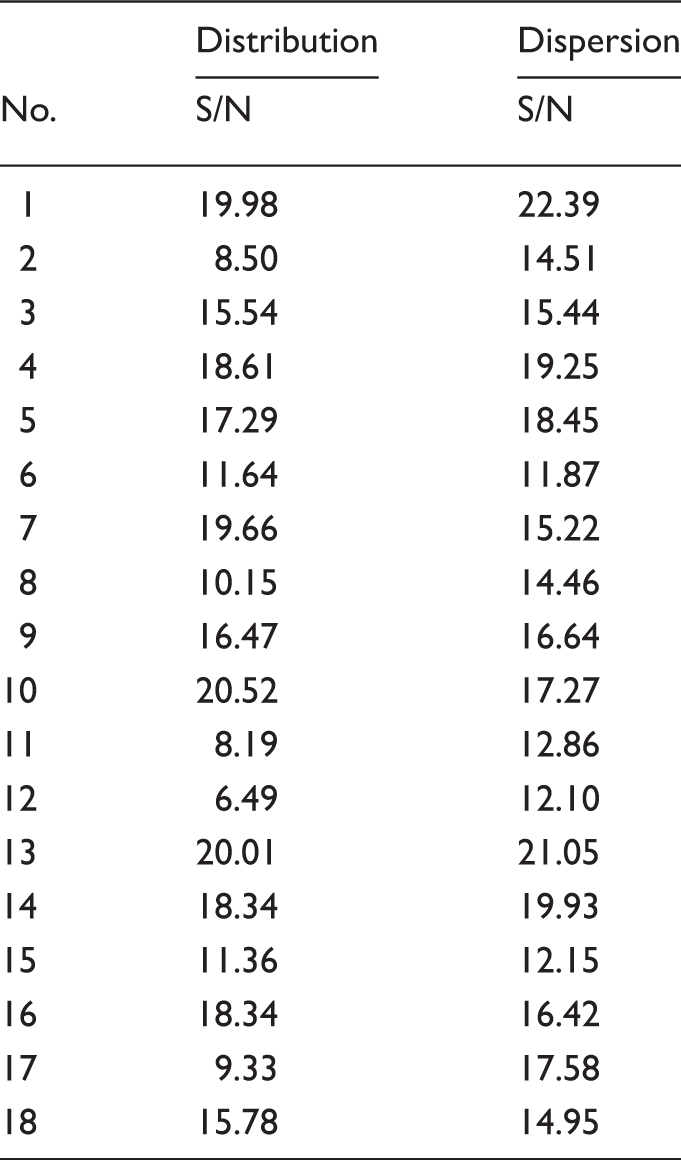
Signal-to-noise (S/N) ratio for larger-the-better analysis
Optimal parameters for the single quality
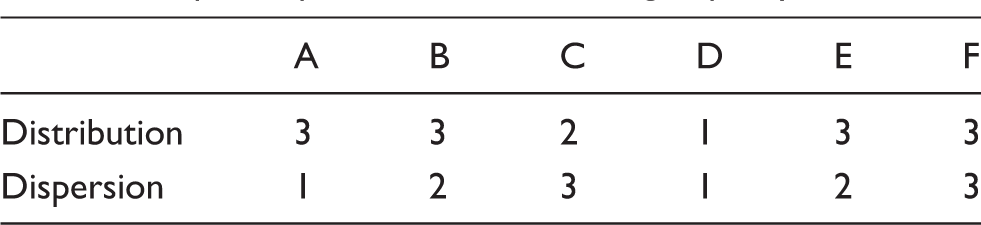
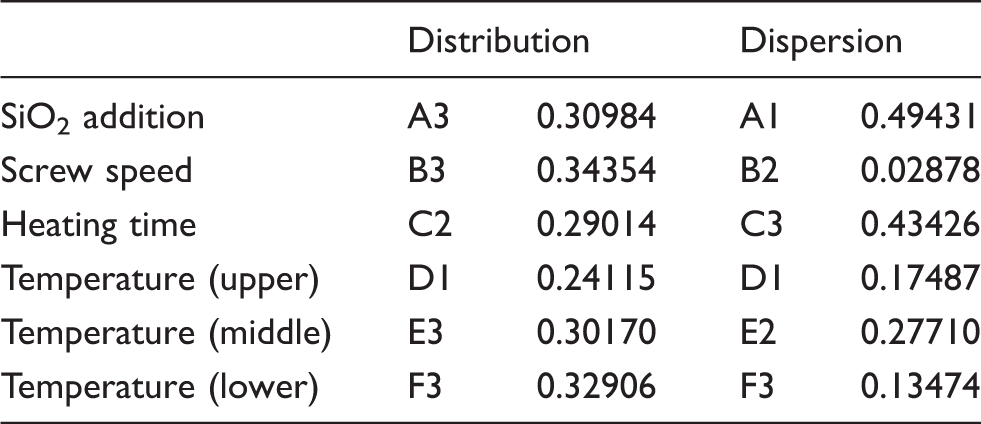
The quality S/N ratio value in Table 6 is substituted in Equations (7)–(11) to calculate the ANOVA parameters. The distribution ANOVA shows that the significant factors are A, B and F. The dispersion ANOVA shows that the significant factors are A, C and E.
The experimental results for single-quality optimum process parameters
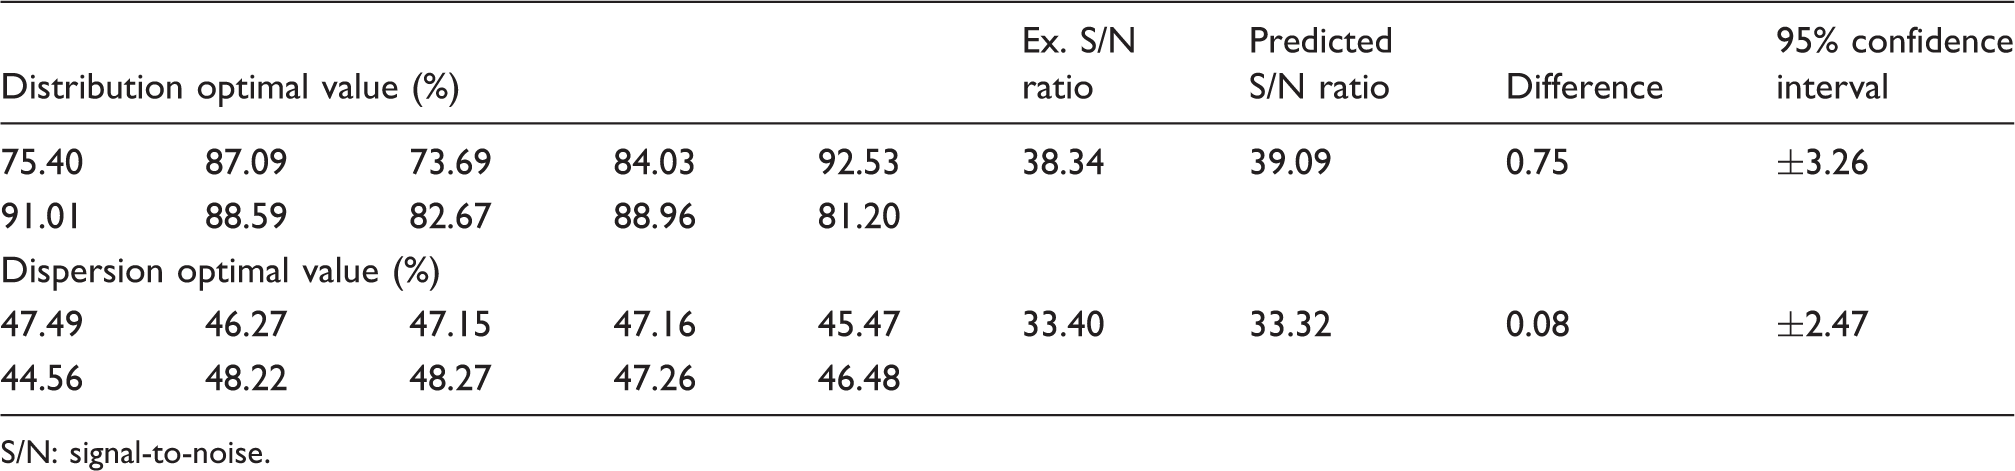
S/N: signal-to-noise.
Variance analysis for distribution
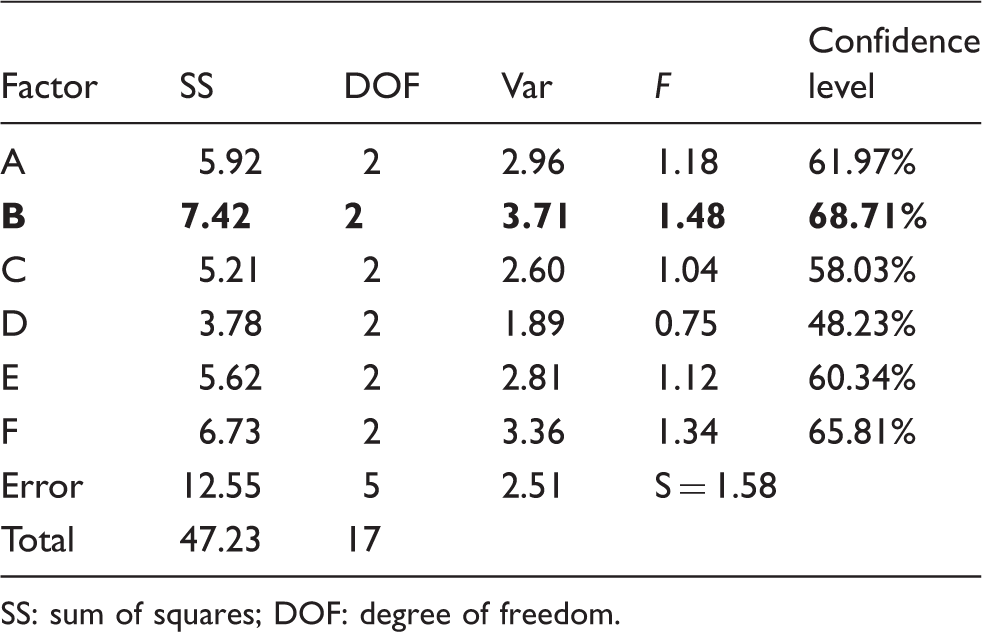
SS: sum of squares; DOF: degree of freedom.
Variance analysis for dispersion
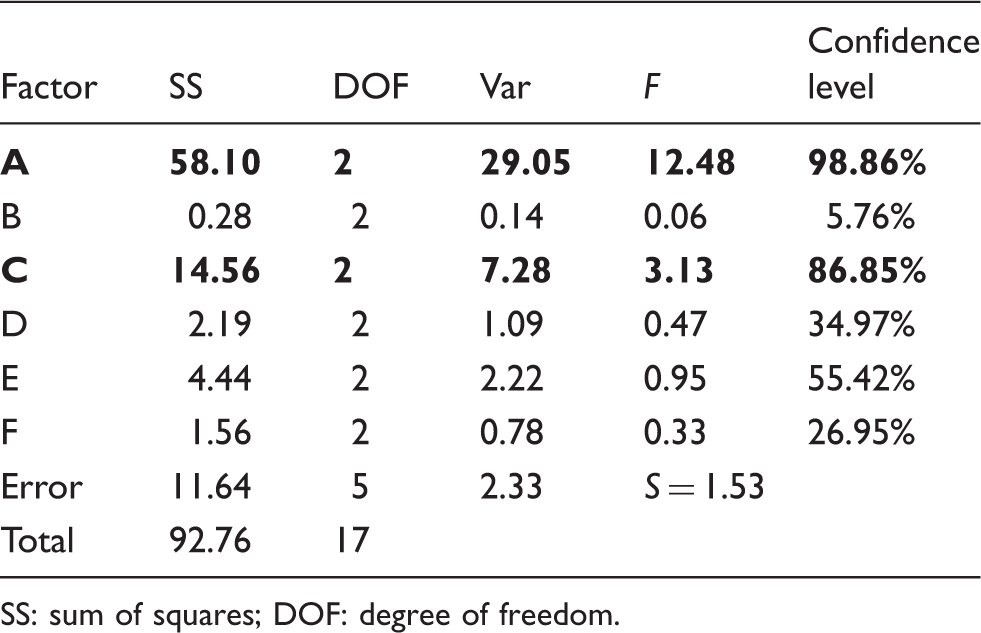
SS: sum of squares; DOF: degree of freedom.
The more accurate factor contribution can be found through the variance analysis table. In the table, for the confidence level, where the screw speed has a significant effect on the distribution, the amount of SiO2 added and the mixing time have a significant effect on the dispersion.
Multi-quality parameter optimization system
For a reasonable AHP of the single-quality optimum parameter group of distribution and dispersion, the weights and contributions of the multi-quality optimum parameter group are determined. The procedure is as follows.
Important matrix of quality characteristic
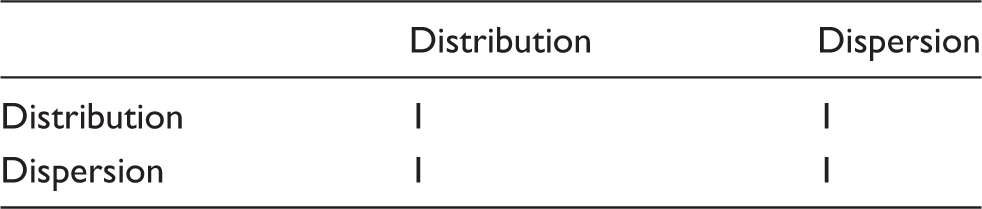
The weights of the optimum parameter combination for multi-quality
The experimental results from parameters (%)
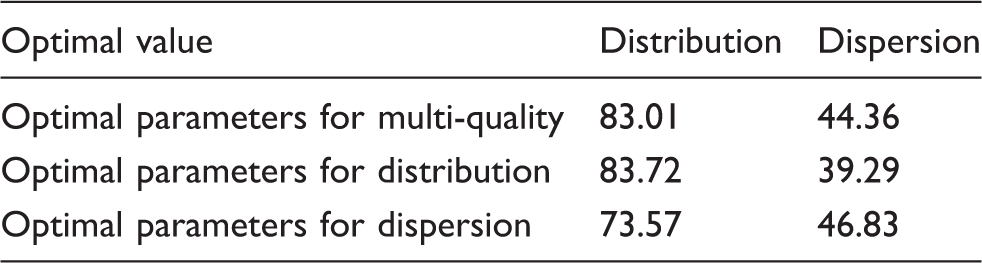
According to previous references, the better the uniformity of silica particles in LDPE, the better the mechanical properties. There is no objective reference frame for discussing particle uniformity; this study proposes that the uniformity computing mode, the Taguchi method, the AHP and the extruder processing parameter conditions are used to find the local multi-quality optimum processing parameters. The distribution and dispersion quality results approach the single-quality optimal results. The uniformity computing mode can provide a reference for subsequent studies about uniformity evaluation.
Mixing data and abnormal parameter analysis
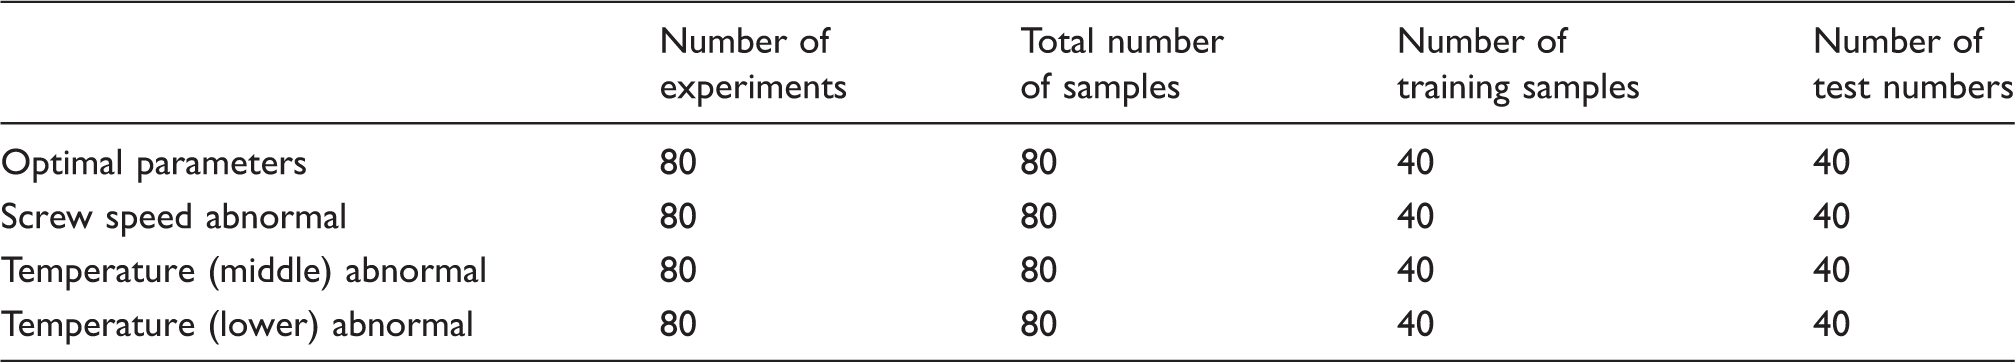
The normal and abnormal parameters are identified by online data in the mixing experiment. The normal parameters are the previously obtained multi-quality optimum parameter group. The first influential factors in the optimum parameter group are changed to an abnormal parameter group for mixing. The changes in the torque, viscosity and shear force of the optimum parameter group and abnormal parameter group during mixing are obtained from the online data. Finally, MATLAB executes the SVM to classify the abnormal parameter group and optimum parameter group. The test samples and training samples are selected randomly by the program.
Number of samples for support vector machine classification
Normal and abnormal values
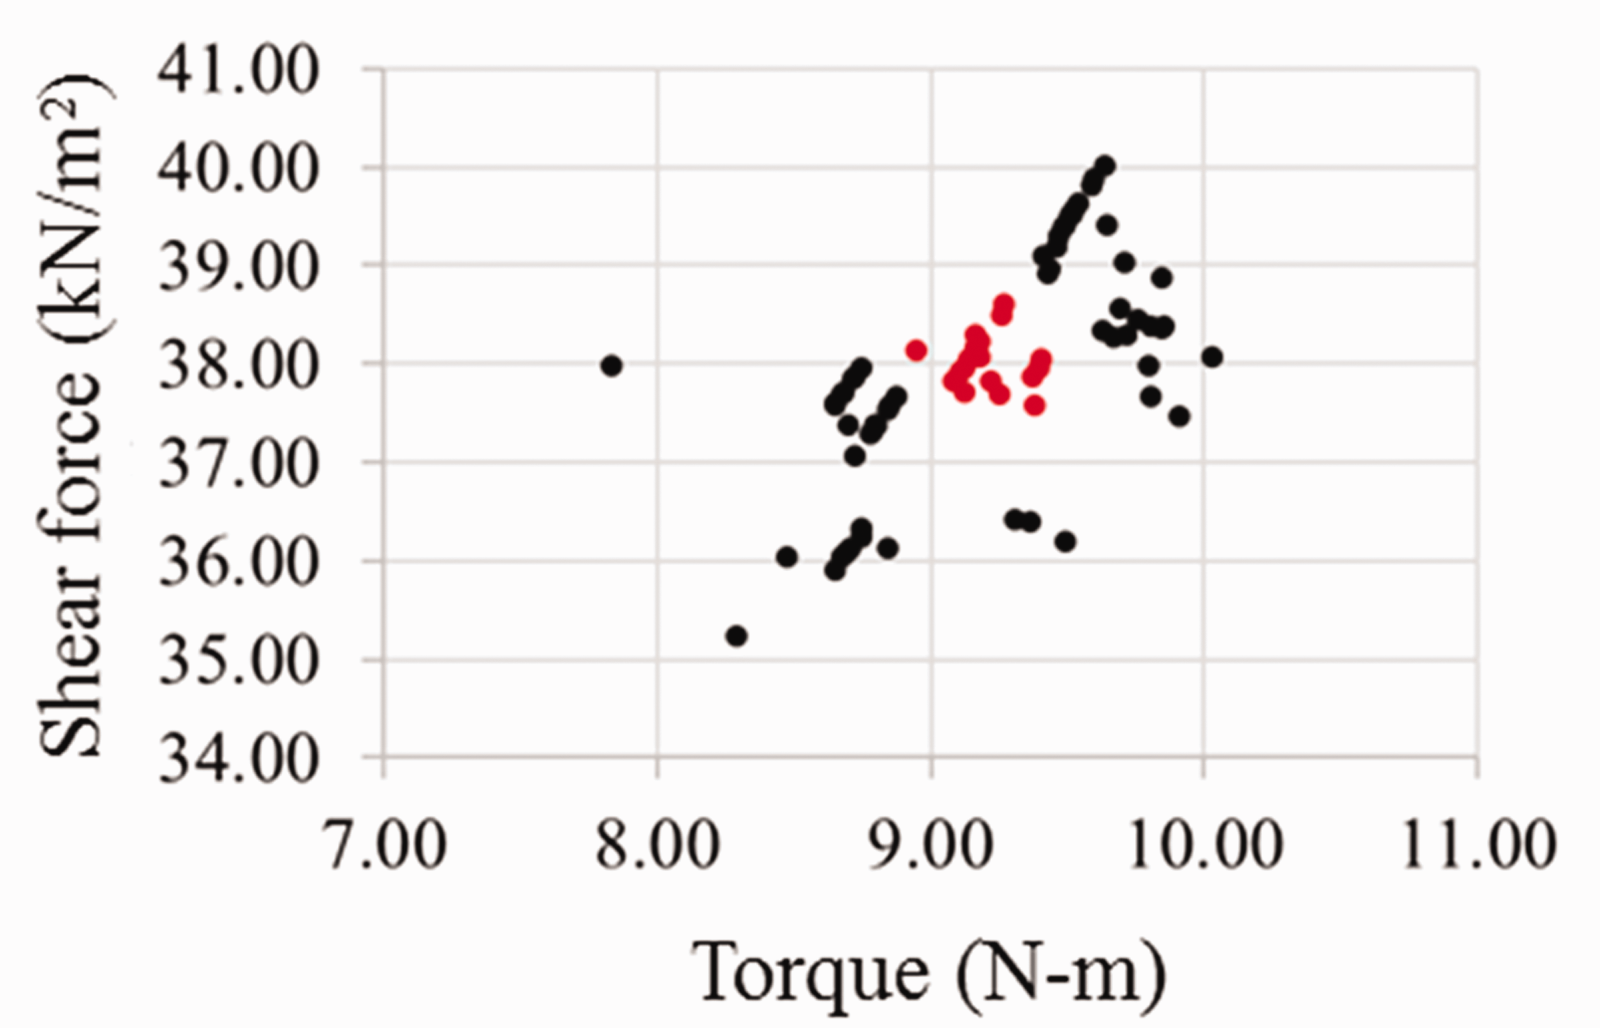
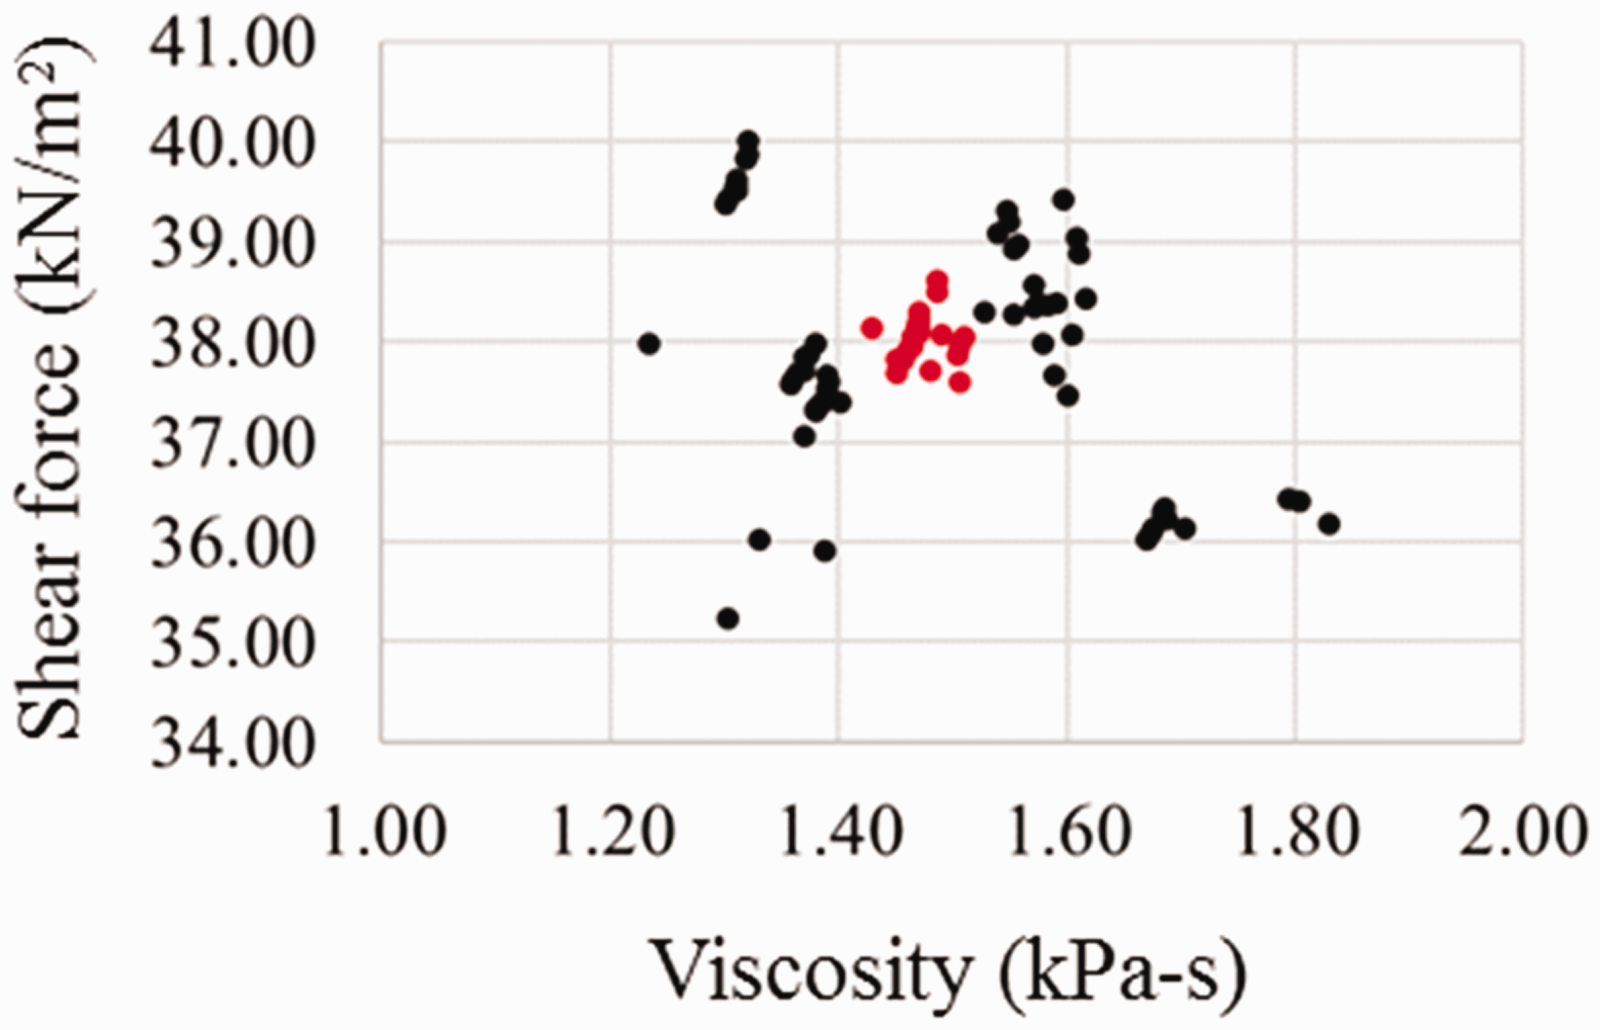
The eigenvalue is selected as the basis of SVM classification. The readable data in the micro extruder include the temperature, speed, current, torque, viscosity and shear force. As the temperature, speed and current will not change obviously after the machine is stable and set, the torque, viscosity and shear force are used as eigenvalues. The experimental eigenvalues are drawn pairwise, as shown in Figures 4–6. According to Figures 4–6, if the SVM executes classification by linear equation, it is difficult to identify normal and abnormal parameters by viscosity and shear force eigenvalues, and the viscosity eigenvalue is likely to identify normal and abnormal. Therefore, the three eigenvalues are used simultaneously for classification with the function RBF = 1 of the kernel function. The optimum parameters, the speed anomaly parameter, temperature (middle) anomaly parameter and temperature (lower) anomaly parameter, are mixed 20 times respectively. Half of the test and training samples are selected randomly by the program, and the final classification effect is good.
Torque and viscosity eigenvalue distribution diagram. Shear force and torque eigenvalue distribution diagram. Shear force and viscosity eigenvalue distribution diagram.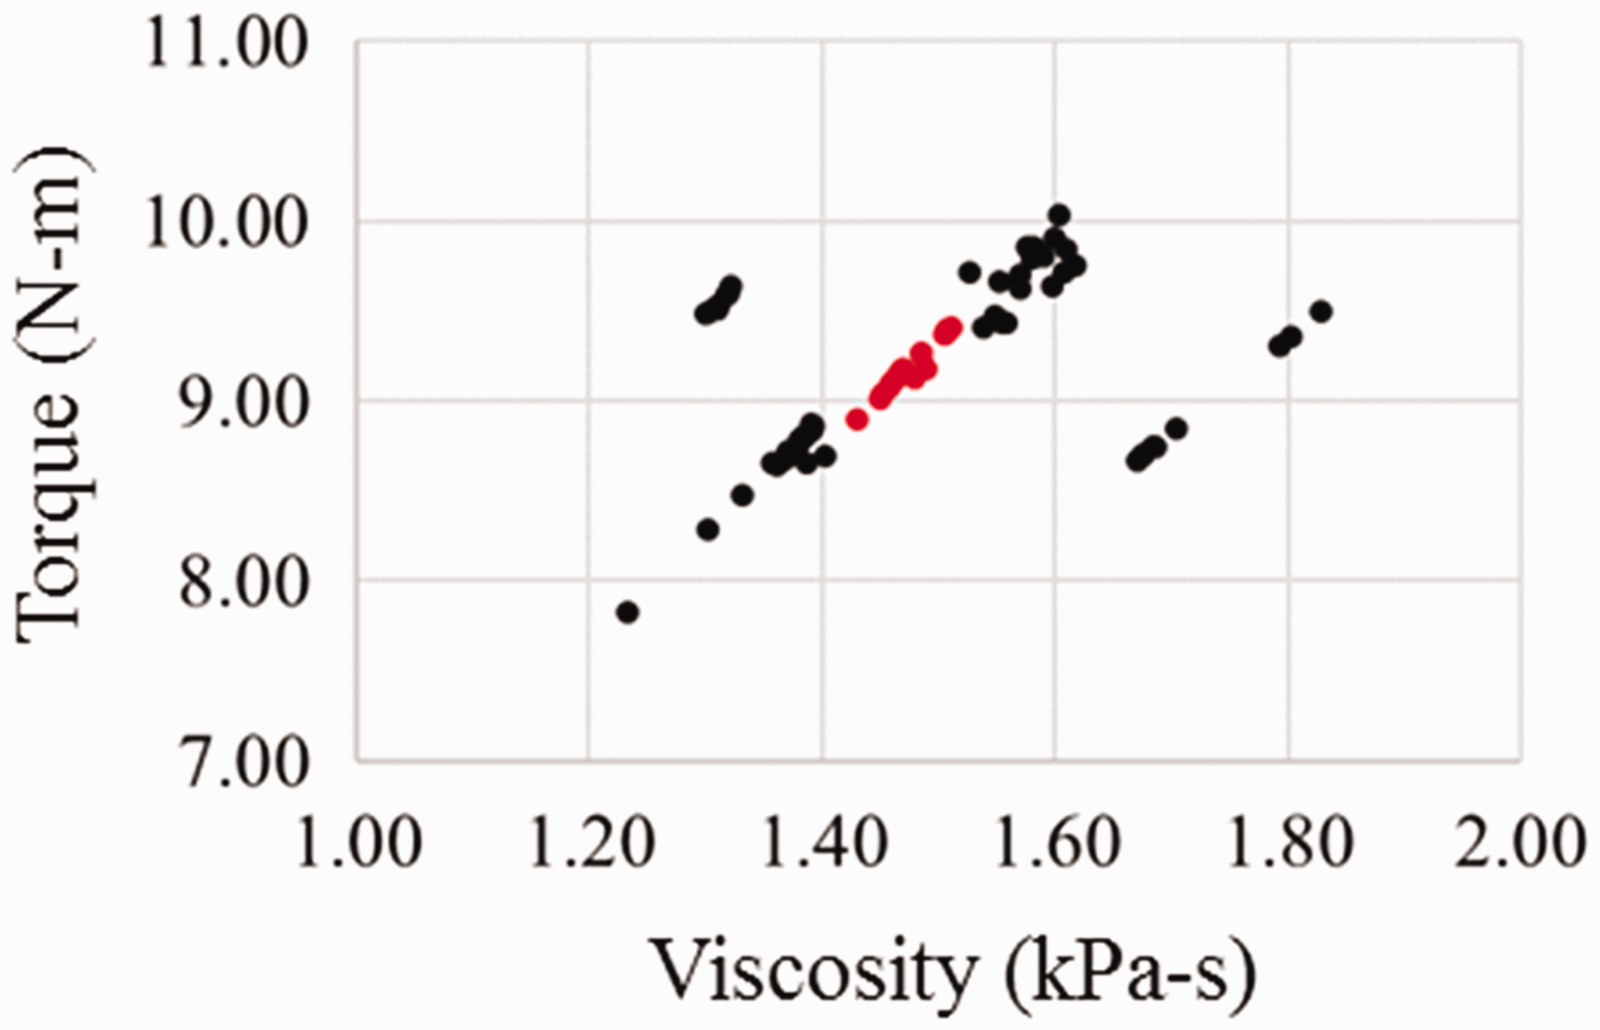
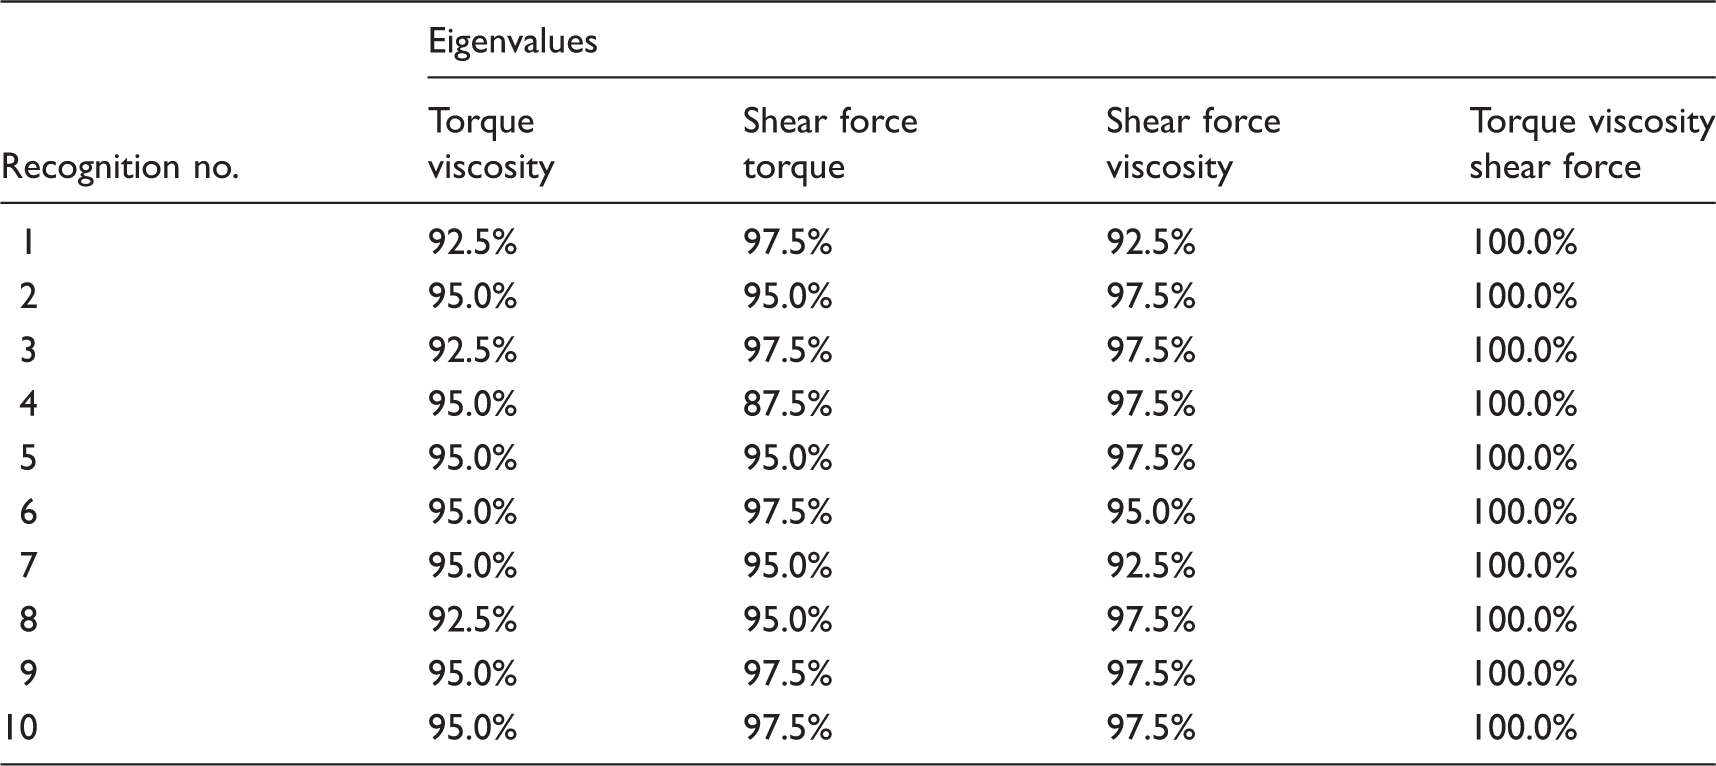
Support vector machine classification results of abnormal and normal parameters
Conclusion
Nano-silica particles can enhance the properties of multiple materials, and good silica uniformity in the materials can enhance the dielectric properties or mechanical strength of materials. In this study, nano-silica is mixed in LDPE plastics by a micro extruder and we discuss the uniformity of nanoparticles in plastics using the Taguchi method, AHP and SVM classifier. Uniformity is divided into distribution and dispersion for SEM/EDS testing. The distribution is analyzed using the variation coefficient, the dispersion is analyzed by the specific surface theory and the local multi-quality optimum processing parameters are obtained by using the Taguchi method and the AHP. Finally, according to the experimental online mixing data: the torque, viscosity and shear force eigenvalues, as well as the abnormal parameters, are identified by the SVM classifier. Firstly, the uniformity of the particles in the plastics is analyzed, and then the local multi-quality optimum processing parameter group is determined by using the Taguchi method and the AHP, which is as follows: silica addition level 1%, screw speed 60 rpm; mixing time 5 min; temperature (upper) 150℃; temperature (middle) 175℃; and temperature (lower) 190℃. The measured uniformity quality of dispersion is 44.36% and distribution is 83.01%. The uniformity approaches that of the results of the single-quality optimum parameters, where dispersion is 46.83% and distribution is 83.72%; thus, the uniformity analysis method used in this study is proved effective. Finally, the mixing experiment is performed based on the three important factors of the multi-quality optimum processing parameters, while the torque, viscosity and shear force data during mixing are used as eigenvalues. The SVM classification result of the pairwise eigenvalues show that there will not be a good classification rate. Therefore, three eigenvalues are used as the basis of SVM classification. The recognition rate is 100% after 10 validations, while the exceptions of the processing parameters can be found by SVM classification with online data in order to remove defective products early and save the cost of measuring poor quality.
Footnotes
Declaration of conflicting interests
The authors declared no potential conflicts of interest with respect to the research, authorship and/or publication of this article.
Funding
The authors disclosed receipt of the following financial support for the research, authorship, and/or publication of this article: This work was supported by the Ministry of Science and Technology of the Republic of China (Grant no. 106-2221-E-011-137-MY2).