
Abstract
A multi-analytical technique approach involving the combined use of micro-invasive and nondestructive techniques was used to identify the type of fiber, mordant and natural dye constituents for eight historical textiles fragments from the 17th–18th centuries, found in monasteries in Northern Romania. The analysis was performed using optical microscopy (OM), scanning electron microscopy with an energy-dispersive X-ray detector (SEM-EDX), attenuated total reflectance Fourier transform infrared spectroscopy (ATR-FTIR) and high-performance liquid chromatography (HPLC). HPLC could determine two flavonol-based structure yellow dyes (possibly weld and Persian berries), one naphthoquinone-based structure brown dye (juglone-walnut) and five samples composed of anthraquinone-based structure red dyes (two fragments contain kermes, one cochineal, one lac and one madder). Elemental analysis using EDX was utilized to identify the possible using of alum as a mordant and the use of metallic threads (pure silver and gilt threads). OM and SEM techniques identified the fiber type and the existence of metal threads, while ATR-FTIR analysis could provide an initial idea about the functional groups of the textile components for the fiber structure substrates.
Keywords
The use of analytical and instrumental techniques for studying archaeological and historical textiles emerged about three decades ago. Since then, scientists have succeeded in using, developing and innovating multi-analytical approaches for studying and identifying old textiles components, such as fibers, mordants and colorants, and for determining the manufacturing and dyeing techniques.1–14 These techniques and devices have contributed in decoding the necessary information about the status, level, nature of chemical and physical condition and degradation level of the examined textiles to provide pertinent conclusions and recommendations, as well as vital information about the history of the examined samples. Scientific analysis of old textiles can tell us about the past, enrich our knowledge regarding the socio-economic context in a region and with other provenances and cultures that can shed light on trade routes, cultural influences and anthropological beliefs and movements.15–19
The textiles and dyeing industry flourished in the territory of Romania during the 15th–18th centuries. This can be evidenced by the very large and rich textile collections preserved in Romanian museums and monasteries, due to the well-established embroidery workshops that were combined with many monasteries in Romania. They consist mainly of silk core wrapped with metallic threads. They were worn by priests during orthodox religious ceremonies. Some silk garments textured with metallic threads were donations to churches from royalty and nobles. These silk garments had simple cuts and could be dismantled later to be used as grave covers.20,21
During that period, many local and imported types of dyes were being used as well as different kinds of local and imported fibers. Many of the dyes were brought either from Eastern countries, such as kermes dye, or from Western ones, such as American cochineal and lac red dyes. Red dyes, many of them plant and insect dyes—mostly anthraquinones derivatives—were documented as being used in the textile and dyeing industry. Anthraquinones are of vegetal origin, such as madder, while kermes cochineal is the secretion of an insect. Also, many flavonoid yellow dyes types were documented and applied on Romanian textiles for many centuries, such as weld, dyer’s broom, sawwort, young fustic, Persian berries (buckthorn berries) and bastard hemp. Weld was the most commonly used yellow dye for religious embroidery. Some red and yellow dyes were mixed and combined together to produce different shades and new colors.5,20,21
In this study, the potential of the multidisciplinary use of instrumental analysis devices has been exploited for examining historical textiles fragments belonging to 17th–18th century period, found in monasteries in northern Romania, in order to recognize and identify the fragments components (i.e. type of fibers, dyes, metal threads and mordants). The experimental protocol was implemented according to the instrumentation available in the laboratory, using several techniques: optical microscopy (OM), scanning electron microscopy with an energy-dispersive X-ray detector (SEM-EDX), attenuated total reflectance Fourier transform infrared spectroscopy (ATR-FTIR) and high-performance liquid chromatography with diode array detection (HPLC-DAD).
Experimental details
Historical samples
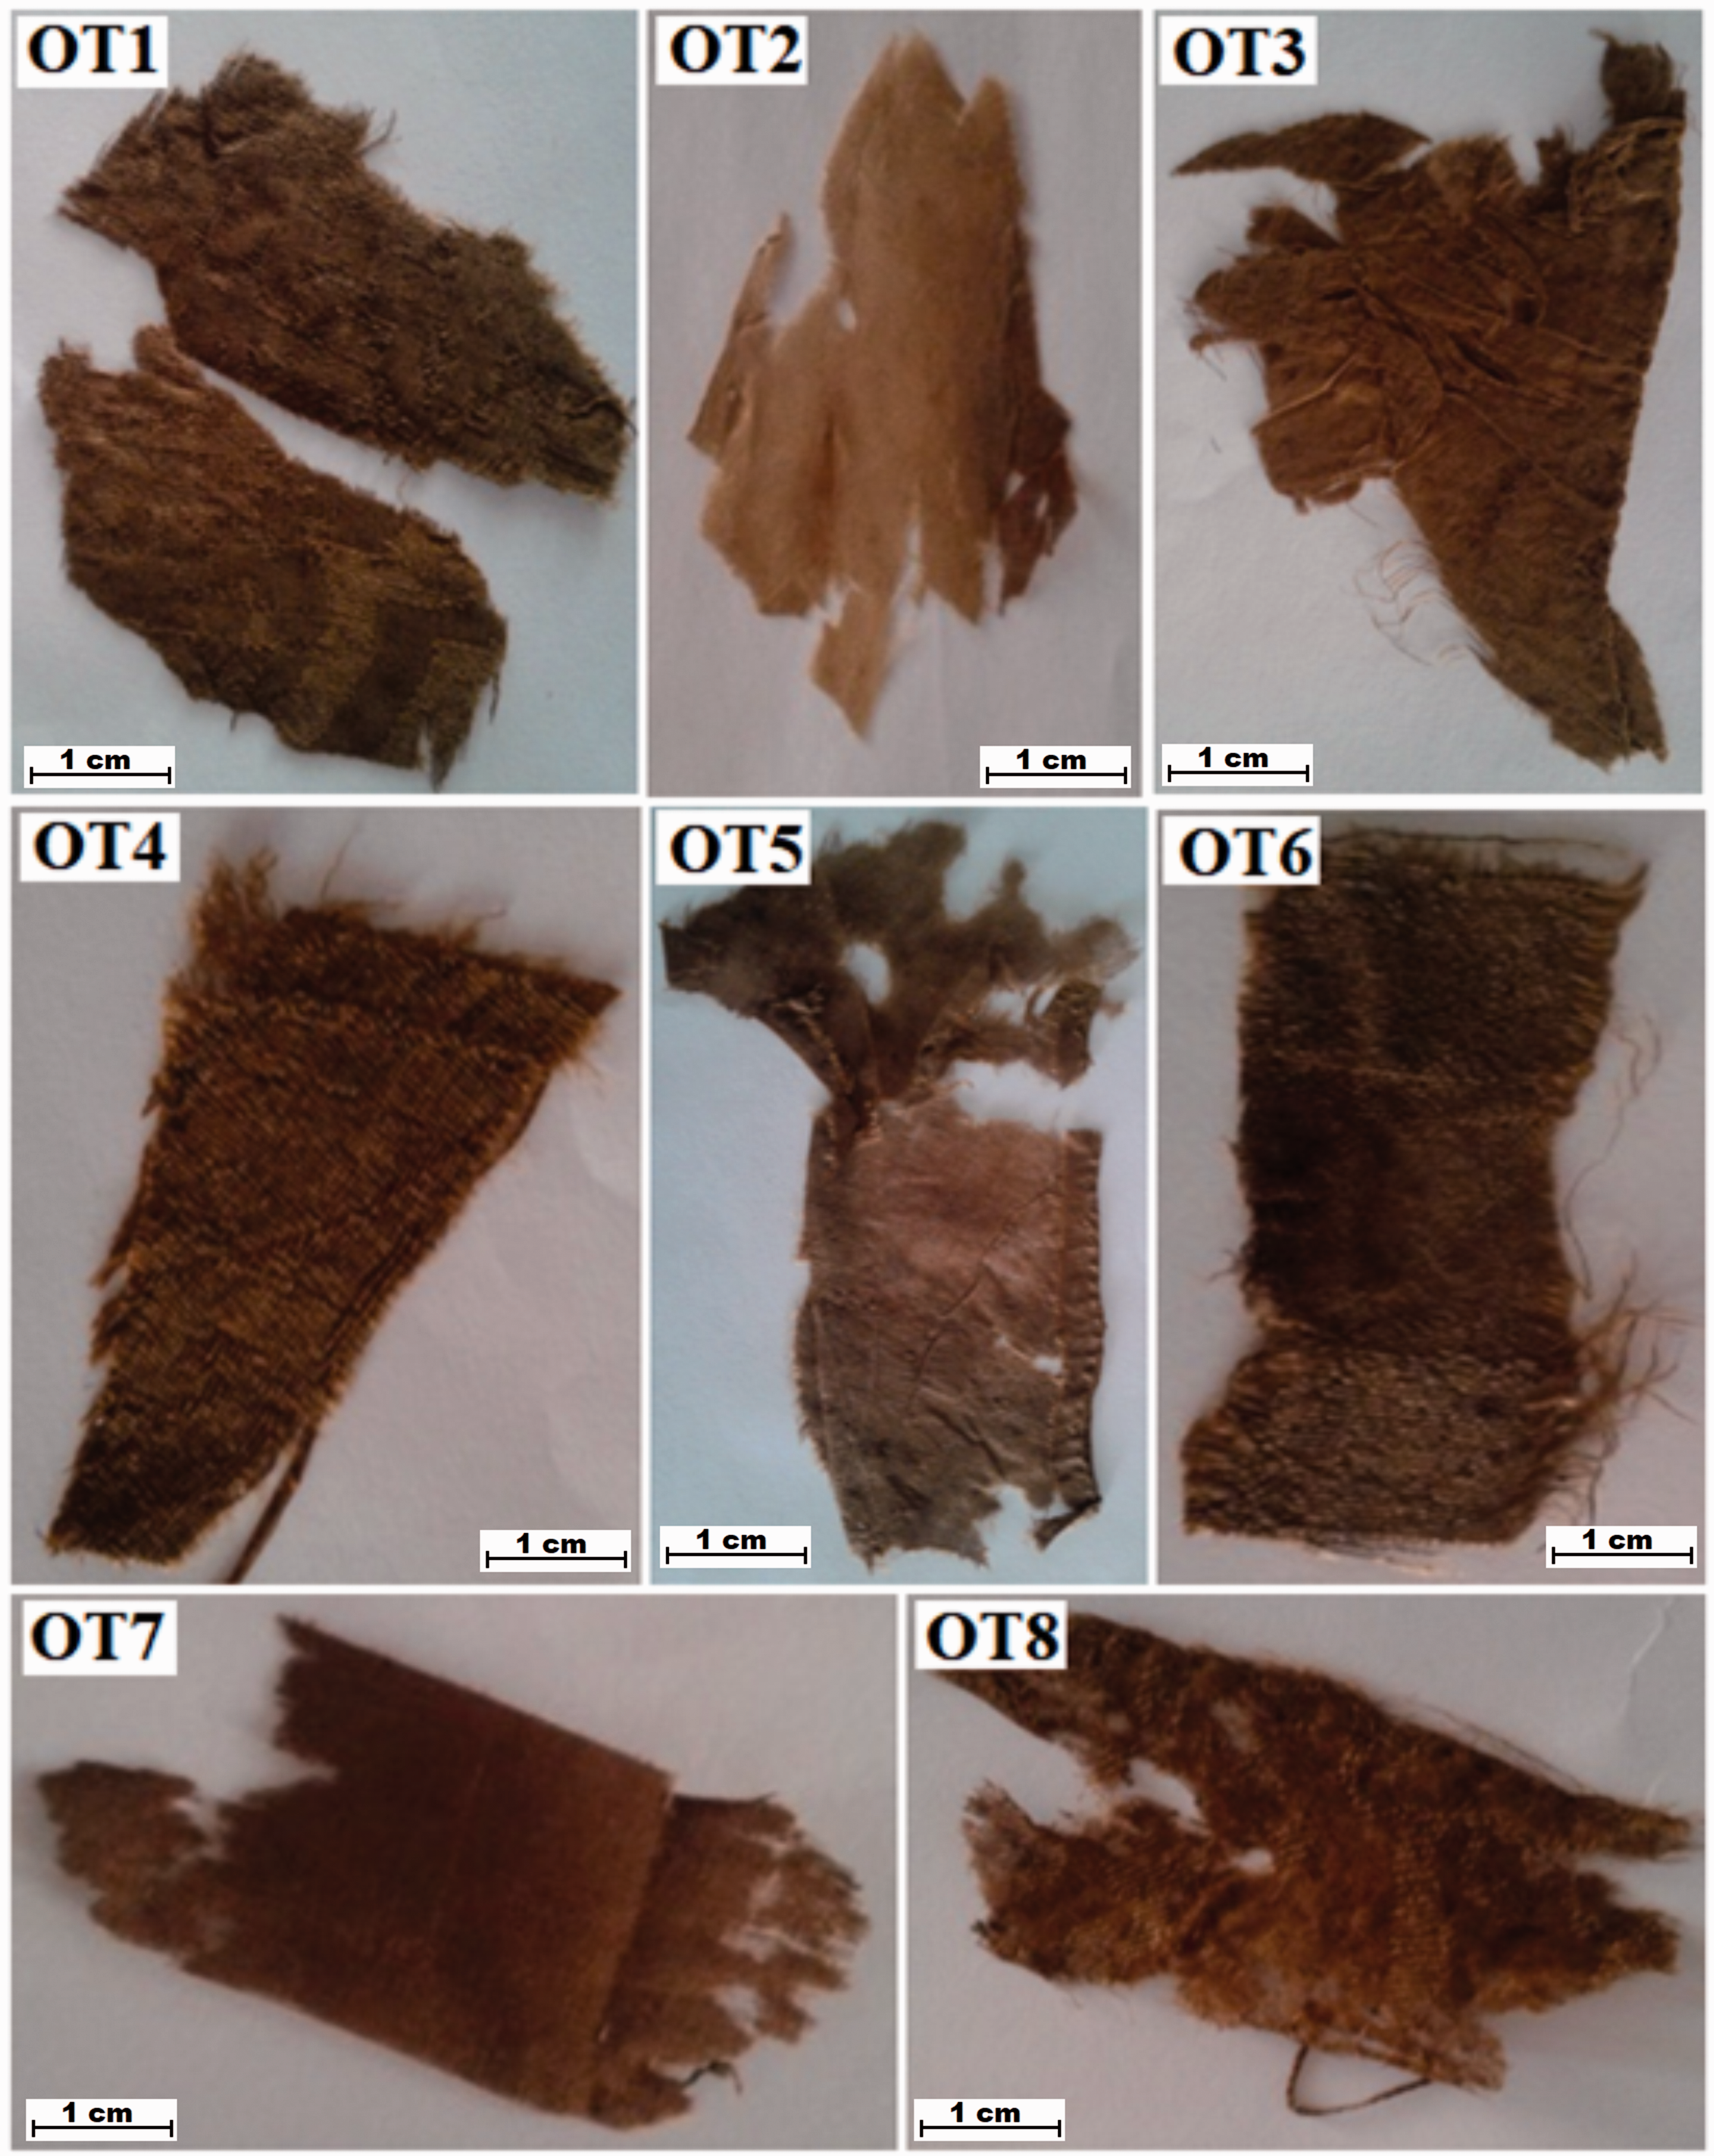
The textile samples under study consist of eight pieces belonging to the period 17th–18th centuries. All of the samples are fragments pieces, which could not be integrated in objects after conservation intervention or separated from their original objects due to natural and environmental factors. All of the samples possess brownish-orange hues (Figure 1). The specimens were found in three monasteries in Northern Romania (Moldova), as follows:
St. Sava Church in Iaşi (17th–18th centuries), three sets of samples; Barnovschi Church in Iaşi (17th century), three sets of samples; Neamt Monastery in Tg. Neamt (17th–18th centuries), two sets of samples. Images of the old textile samples.
The historical samples, collected after coffins were opened, were cleaned by immersion and light washing with an aqueous dispersion of a decoction of Saponaria roots, after which they were washed with deionized water and dried in the open air. The samples were wrapped in polyethylene terephthalate (PET) foil and kept until the investigation in an opaque glass exicator.
The samples were found and uncovered during restorations in the three monasteries. Unfortunately, no documented reports or records details exist regarding the finding process. Taking into consideration that they were buried underground for centuries, the samples must have been subjected to environmental conditions that definitely affected their structure, morphology and colors.
The eight samples in the study were indexed as follows: OT1–OT3 from Sf. Sava Church in Iaşi; OT4–OT6 from Barnovschi Church in Iaşi and OT7 and OT8 from Neamt Monastery - Tg. Neamt (Figure 1).
New dyed samples references
Reference samples (RT) to be compared were prepared using natural silk fabrics (bought from a local market) and the following natural dyes: safflower (RT1), fustic (RT2), Persian berries (RT3), luteola R. (RT4), alkanet (RT5), turkey madder (RT6), logwood (RT7), walnut (RT8), cochineal (RT9), saffron (RT10), kermes (RT11), lac (RT12), sandalwood (RT13), curcumin (RT14), madder—Levant/Jordan (RT15), tannin gulls (RT16), cochineal (from Jordan) (RT17), walnut (from Jordan) (RT18), kermes (from Jordan) (RT19)—dyes were bought online from Kremer Pigmente (Germany) along with some reference dyed samples (Figure 2). The dyeing process was done according to Wickens,
22
and treated with alum (potassium aluminum sulfate). The historical sample components were identified after chromatographic and spectroscopic comparison and matching with the reference samples.
Macroscopic images from the dye reference textiles.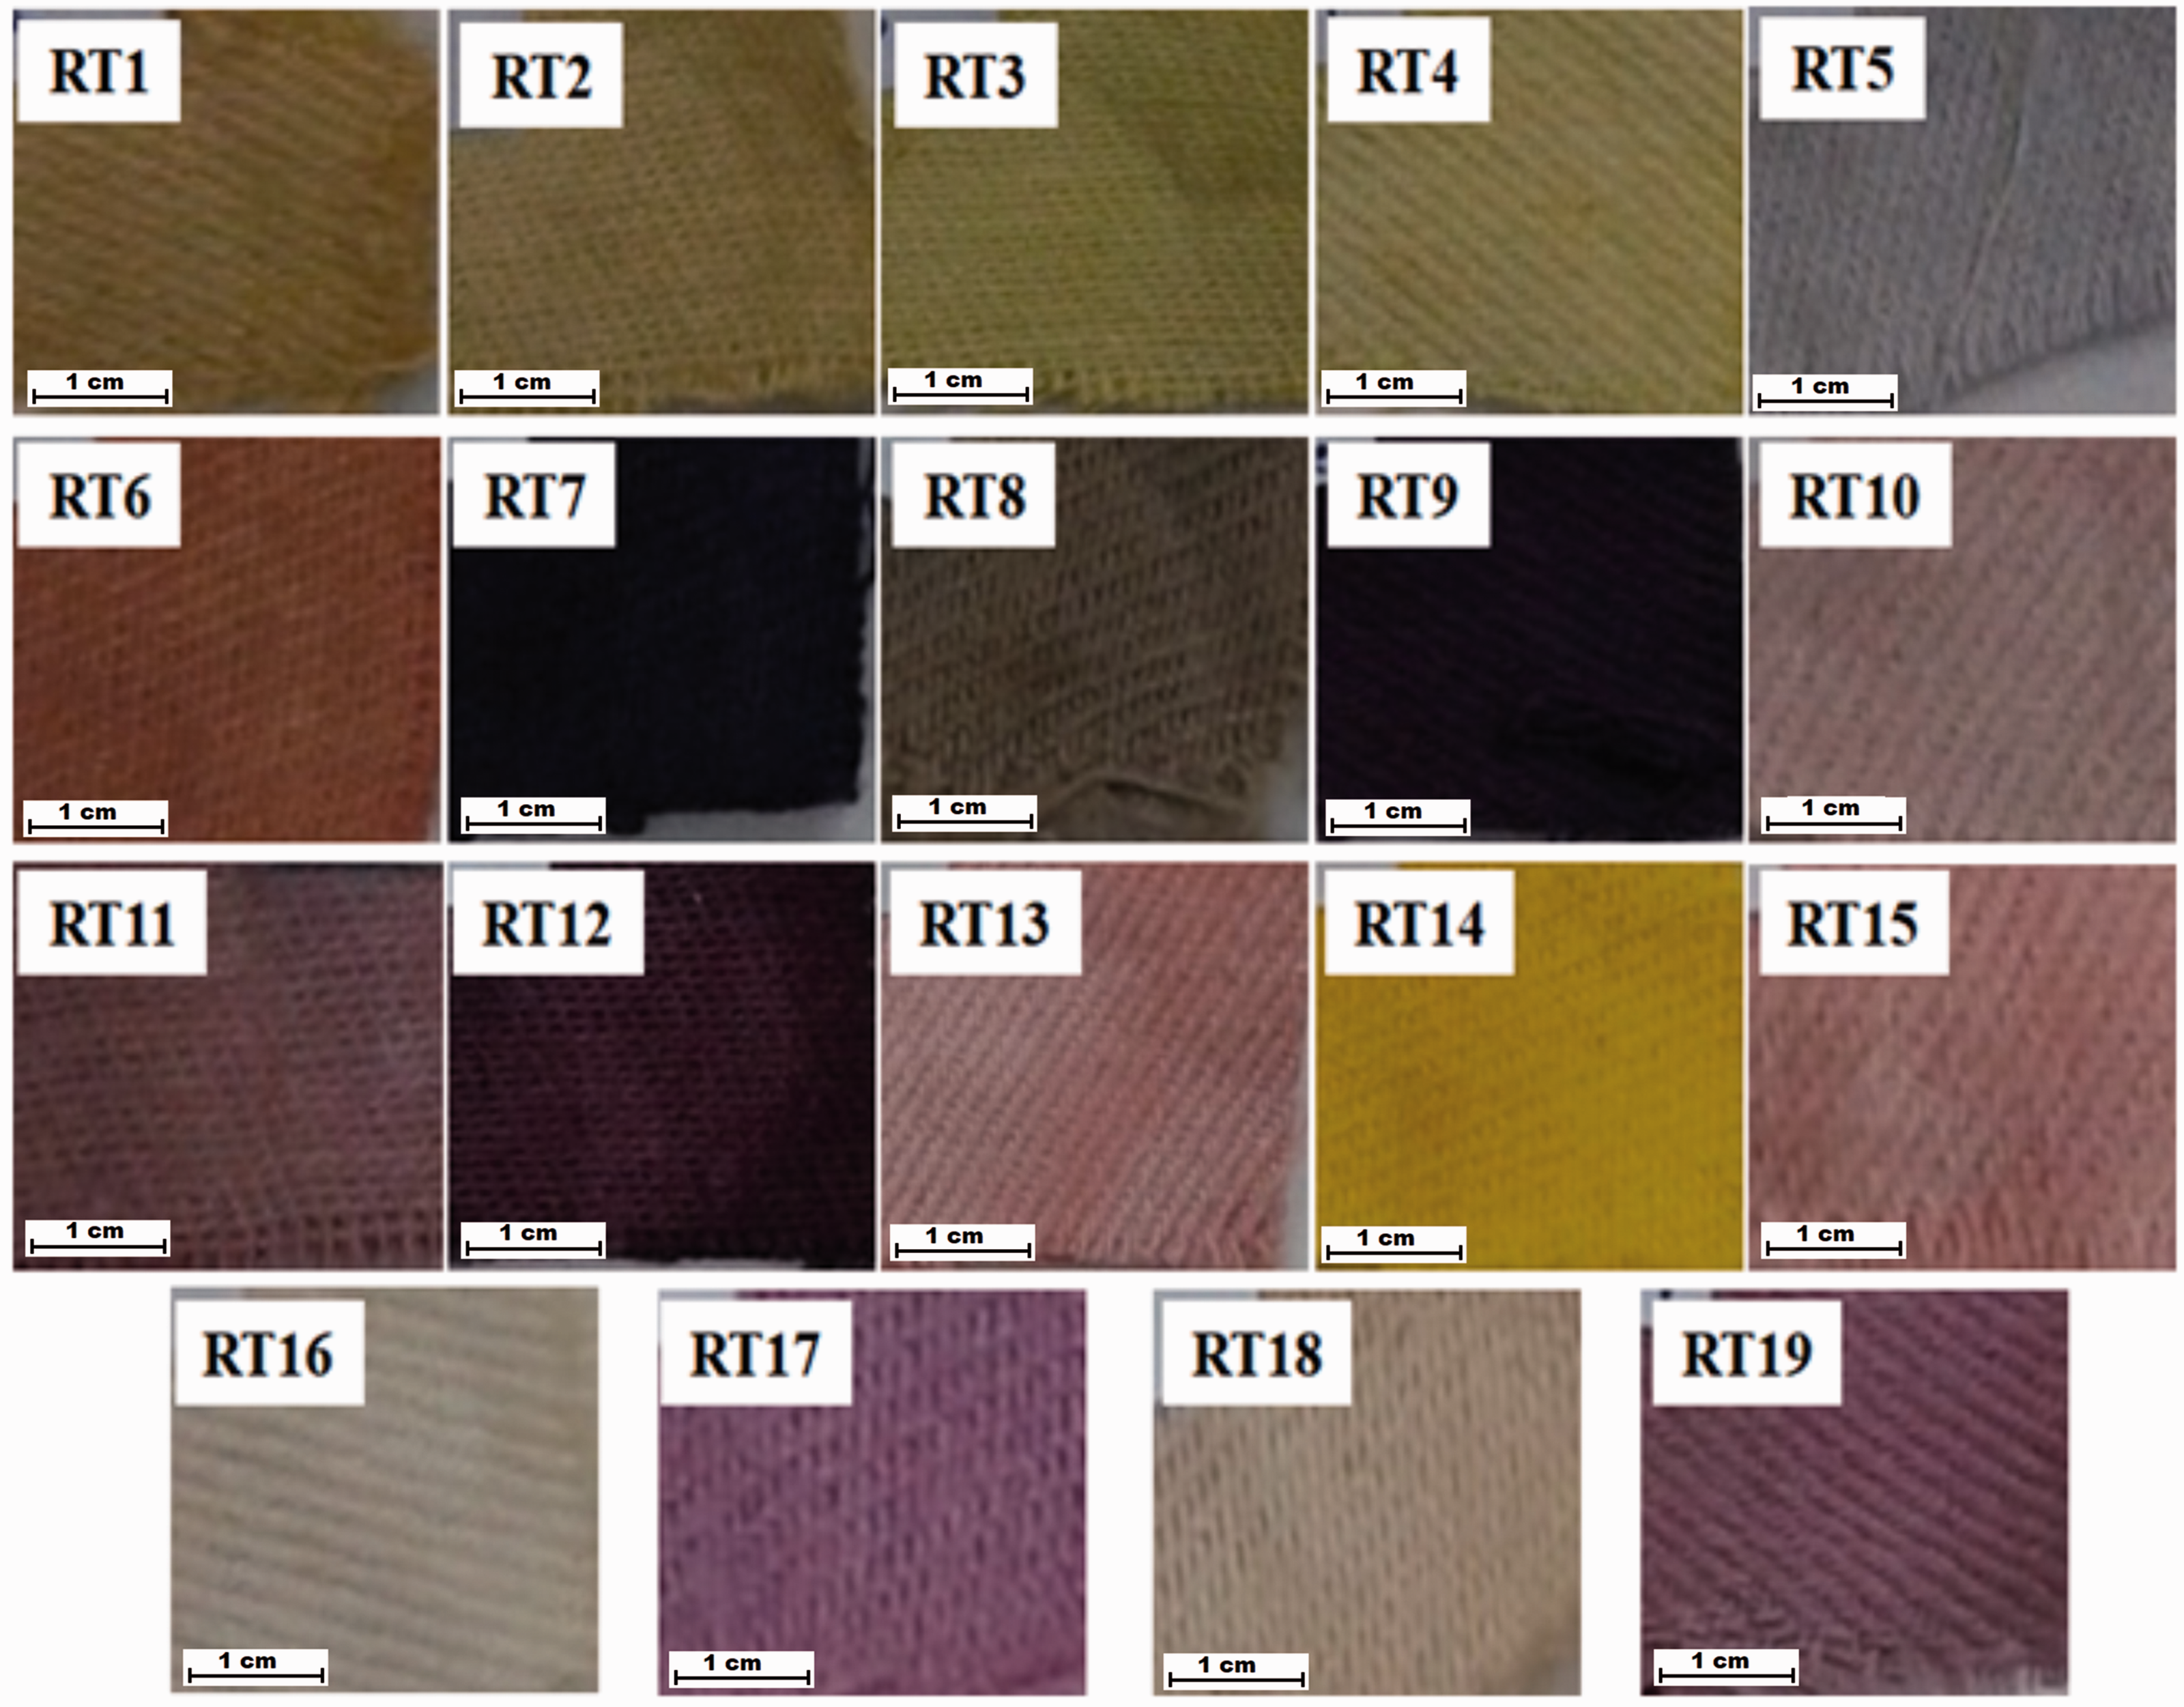
Methods and techniques
Optical microscopy
OM analysis was carried out with an optic microscopy, type Zeiss Imager a1M, with an Axiocam camera attached. The analyses were carried out with an objective of ×50 in darkfield.
Scanning electric microscopy with an energy-dispersive X-ray detector
Fragments of the threads collected from the historical Romanian samples were adhered to an aluminum slot head SEM stub using double-sided carbon tab. The samples were carbon-coated to prevent charging, and then examined using a scanning electron microscope, VEGAIILSH model, produced by Czech TESCAN, coupled with an EDX detector, QX2 QUAN TAX type, manufactured by Bruker/ROENTEC Germany.
Attenuated total reflectance Fourier transform infrared spectroscopy
A few fiber specimens were taken out, pressed and scanned in one position for 64 scans on both samples, as well as for the background blank before each scan process, in the range between 4000 and 650 cm−1 with 4 cm−1 resolution. The software for analysis is ChemID SpectrAssist ver. 1.3.0. The equipment has the following databases: Aldrich/Smiths Detection ATR Spectral Libraries; IChem ST Japan ATR Spectral Library; Smiths Detection ATR Libraries.
High-performance liquid chromatography with a diode array detector
Extraction procedure
The hydrochloric extraction analysis method was carried out in this work after Halpine 23 and Wouter, 24 with some slight modifications.
The extraction of a weighed quantity of historical textile samples (average sample weight 0.2 mg) were performed with a 2 mL solution mixture of 37% HCl:MeOH:H2O (2:1:1; v:v:v) for 8 minutes at 100℃ in polytetrafluoroethylene (PFTE) septum closed vials to extract under reflux in an oven. The extracts were then left in a vacuum desiccator for 10 days. The residual solution was evaporated just to dryness under a gently stream of nitrogen at 3–5 psi for 10 h. The dry residue was dissolved in 200 µL of a mixture of MeOH:H2O (2:1; v:v), transferred to centrifuge vials and was centrifuged at 6000 rpm for 10 min. A total of 100 µL of supernatant was transferred to 250 µL insert vials prior to HPLC analysis.
HPLC instrumentation
Chromatographic measurements were carried out using an Agilent 1220 series system (Agilent Technologies, Germany - G4294B) at a flow rate of 1.25 mL/min (280 bar). A sampler injection with needle wash was used to put a volume of 10 µL of the sample on to a PhenomenexKinetex®, with conditions of 2.6 µm pentafluorophenyl (PFP), 100 Å, 150 mm × 4.6 mm (L × id) and stationary phase PFP (with tetramethylsilane (TMS) endcapping), that is, a core–shell silica (L43 USP designation) coupled with SecurityGuard™ ULTRA cartridge UHPLC F5 4.6 mm ID columns. The gradient is binary A: 0.1% AcCN (acetonitrile) acidified with TFA (trifluoroacetic acid) 1 mL/L (pH 2.2) and B: 50% AcCN acidified with TFA 1 mL/L. All solvents are, prior to usage, vacuum filtered through sterile 0.45 µm nylon 47 mm disks for degassing and particulate removal. The elution gradient is as follows: 0% B on injection, at 2 min 1% B; at 3 min 1% B; at 10 min 30% B; at 20 min 60% B; at 22 min 60% B; at 43 min 95% B; at 44 min 95% B; at 45 min 100% B; at 46 min 100% B; at 47 min 0% B; at 49 min 0% B, with 1 min post-time. The column oven temperature is 30℃. The detection is done with the diode array detector. The DAD spectrum range is as follows: 190–800 nm in 1 nm steps, peak width >0.0031 min (0.063 s response time) (80 Hz), slit 16 nm. Signals used were as follows: A: 235 nm, B: 255 nm, C: 268 nm, D: 276 nm, E: 350 nm, F: 491 nm, G: 520 nm and H: 580 nm, with 4 nm bandwidth and no reference.
Results and discussion
Surface morphology—type of fiber
The OM images (Figure 3) show changing hues under different magnifications, which differed slightly or marginally from the superficial ones visible to the naked eye (Figure 1).
Optical microscopy images from representative areas with good conservation status of samples of the old textile materials (OT1–OT8).
Comparison of the morphology of the textile materials in Figure 2 with those of Figure 3 shows that during the long burial period, the texture and color of the buried textiles had changed into a “sepia” hue, with slight gradual changes of the shades (diffuse spots), due to the aggressiveness of the environment on many natural organic dyes. Thus, samples OT1–OT3 showed different level of yellow hues, while samples from OT4–OT8 showed different variations of pale brown–orange shades.
The initial investigation with the OM method also revealed that all of the fragments are made of silk. In addition, samples OT4 and OT6 appear to contain metal threads within the weaved silk textiles fabric (Figure 3). The initial examination of the threads shows that the sample OT4 metallic threads consist of silver-gilded threads weaved across the side the weft pattern of the silk fibers, while sample OT6 metallic threads consist of almost pure silver threads twisted in a Z-shape and spun within the warp fiber weaving.
The SEM-EDX analysis was used to add informative and confirmative data to the results above. Thus, the SEM-EDX analysis of the historical Romanian samples confirmed the preliminary data results obtained earlier by OM, of all of the historical fragments being made of silk, as well as that samples OT4 and OT6 contain metal threads. SEM micrographs of the fibers show smooth surfaces, structureless with fine, longitudinal lines passing across the filaments from OT4 and OT6 (Figure 4).
Scanning electron micrographs of the old textile samples.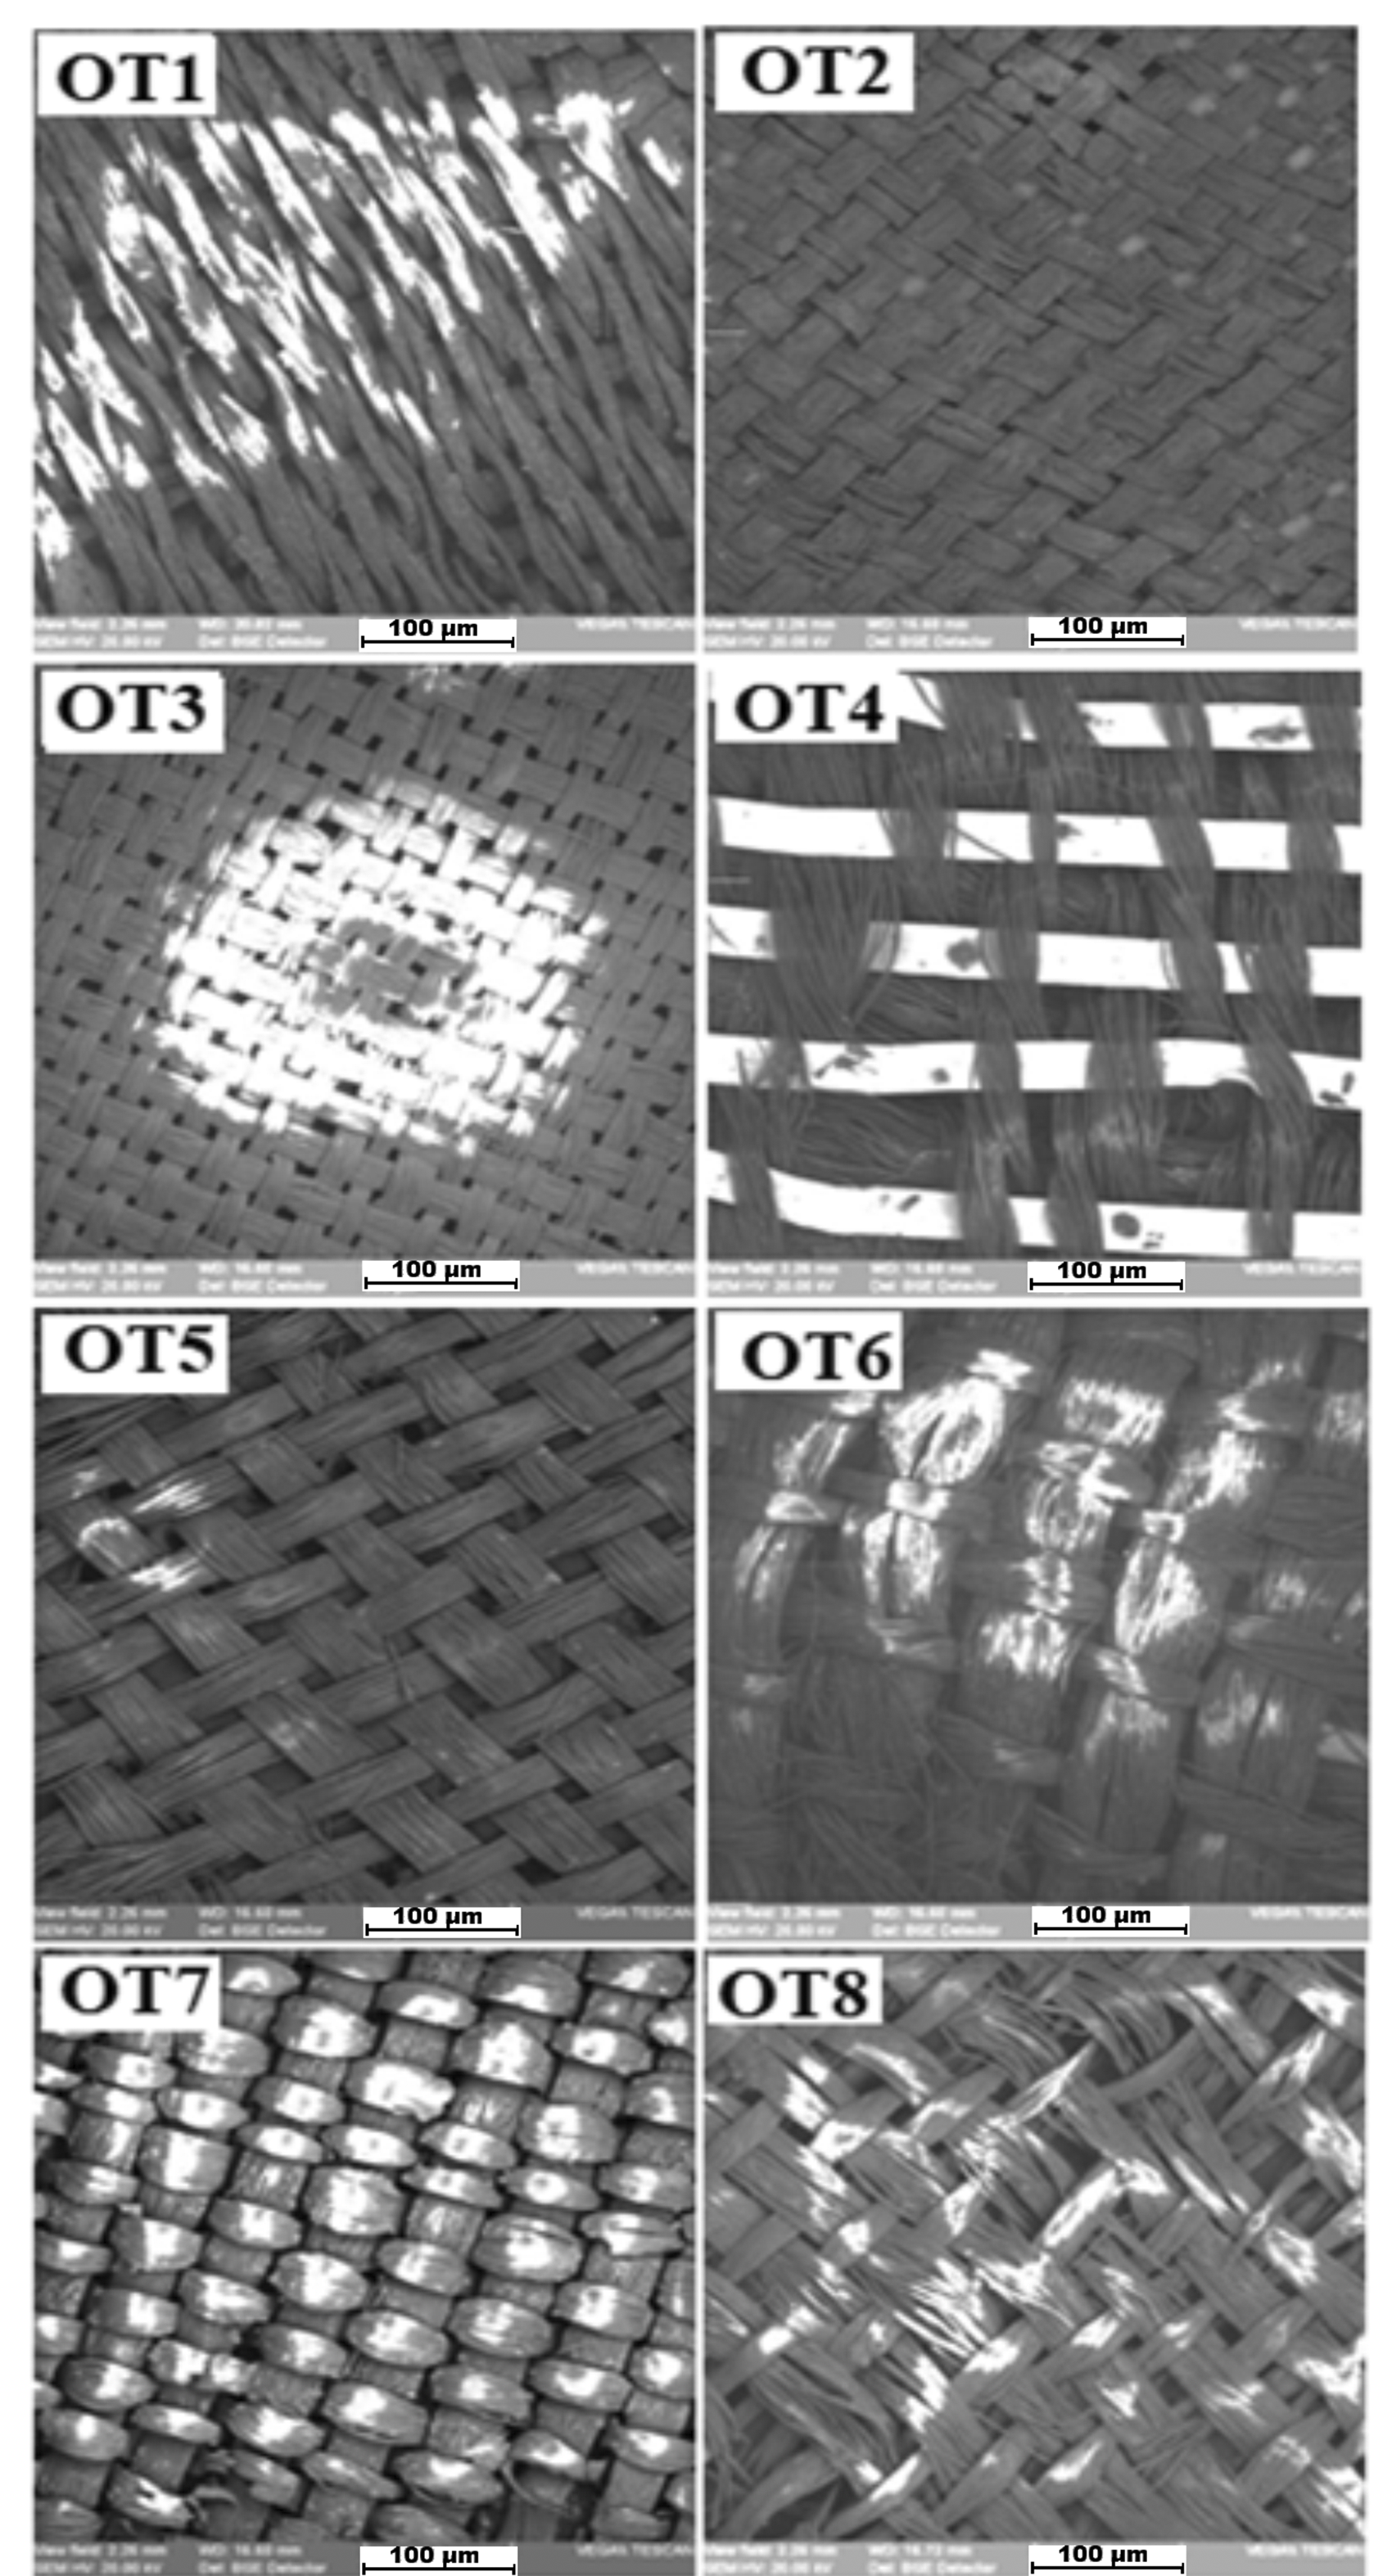
According to the basic structural components of silk fiber, the ATR-FTIR spectra of un-dyed silk fibers mainly display signals at 3277, 3072, 2929, 2849, 1618, 1513, 1441, 1371, 1227, 1156, 1041, 607, 545 and 423 cm−1.25,26
Figure 5 depicts the FTIR-ATR spectra gathered for the eight historical samples. The amide group in proteins, including fibroin, presents characteristic vibrational modes (called the amid band). In this spectra, Amid I band in the 1700–1590 cm−1 region can be attributed to mostly C=O stretching vibrations, Amid II in the 1590–1440 cm−1 region to NAH bending and C≡N bending vibrations and Amid III in 1190–1280 cm−1 to N–H bending and C≡N stretching vibrations. In more elaborated details, it could be seen that the characteristic amide absorption band at 1700 cm−1 was assigned to stretching of C=O and the bands at 1620 cm–1 (asymmetric stretching of NO2 and stretching of C=O) were assigned to the nitro group.25,26
Attenuated total reflectance Fourier transform infrared spectroscopy absorbance spectrum for all of the Romanian historical samples from OT1 to OT8.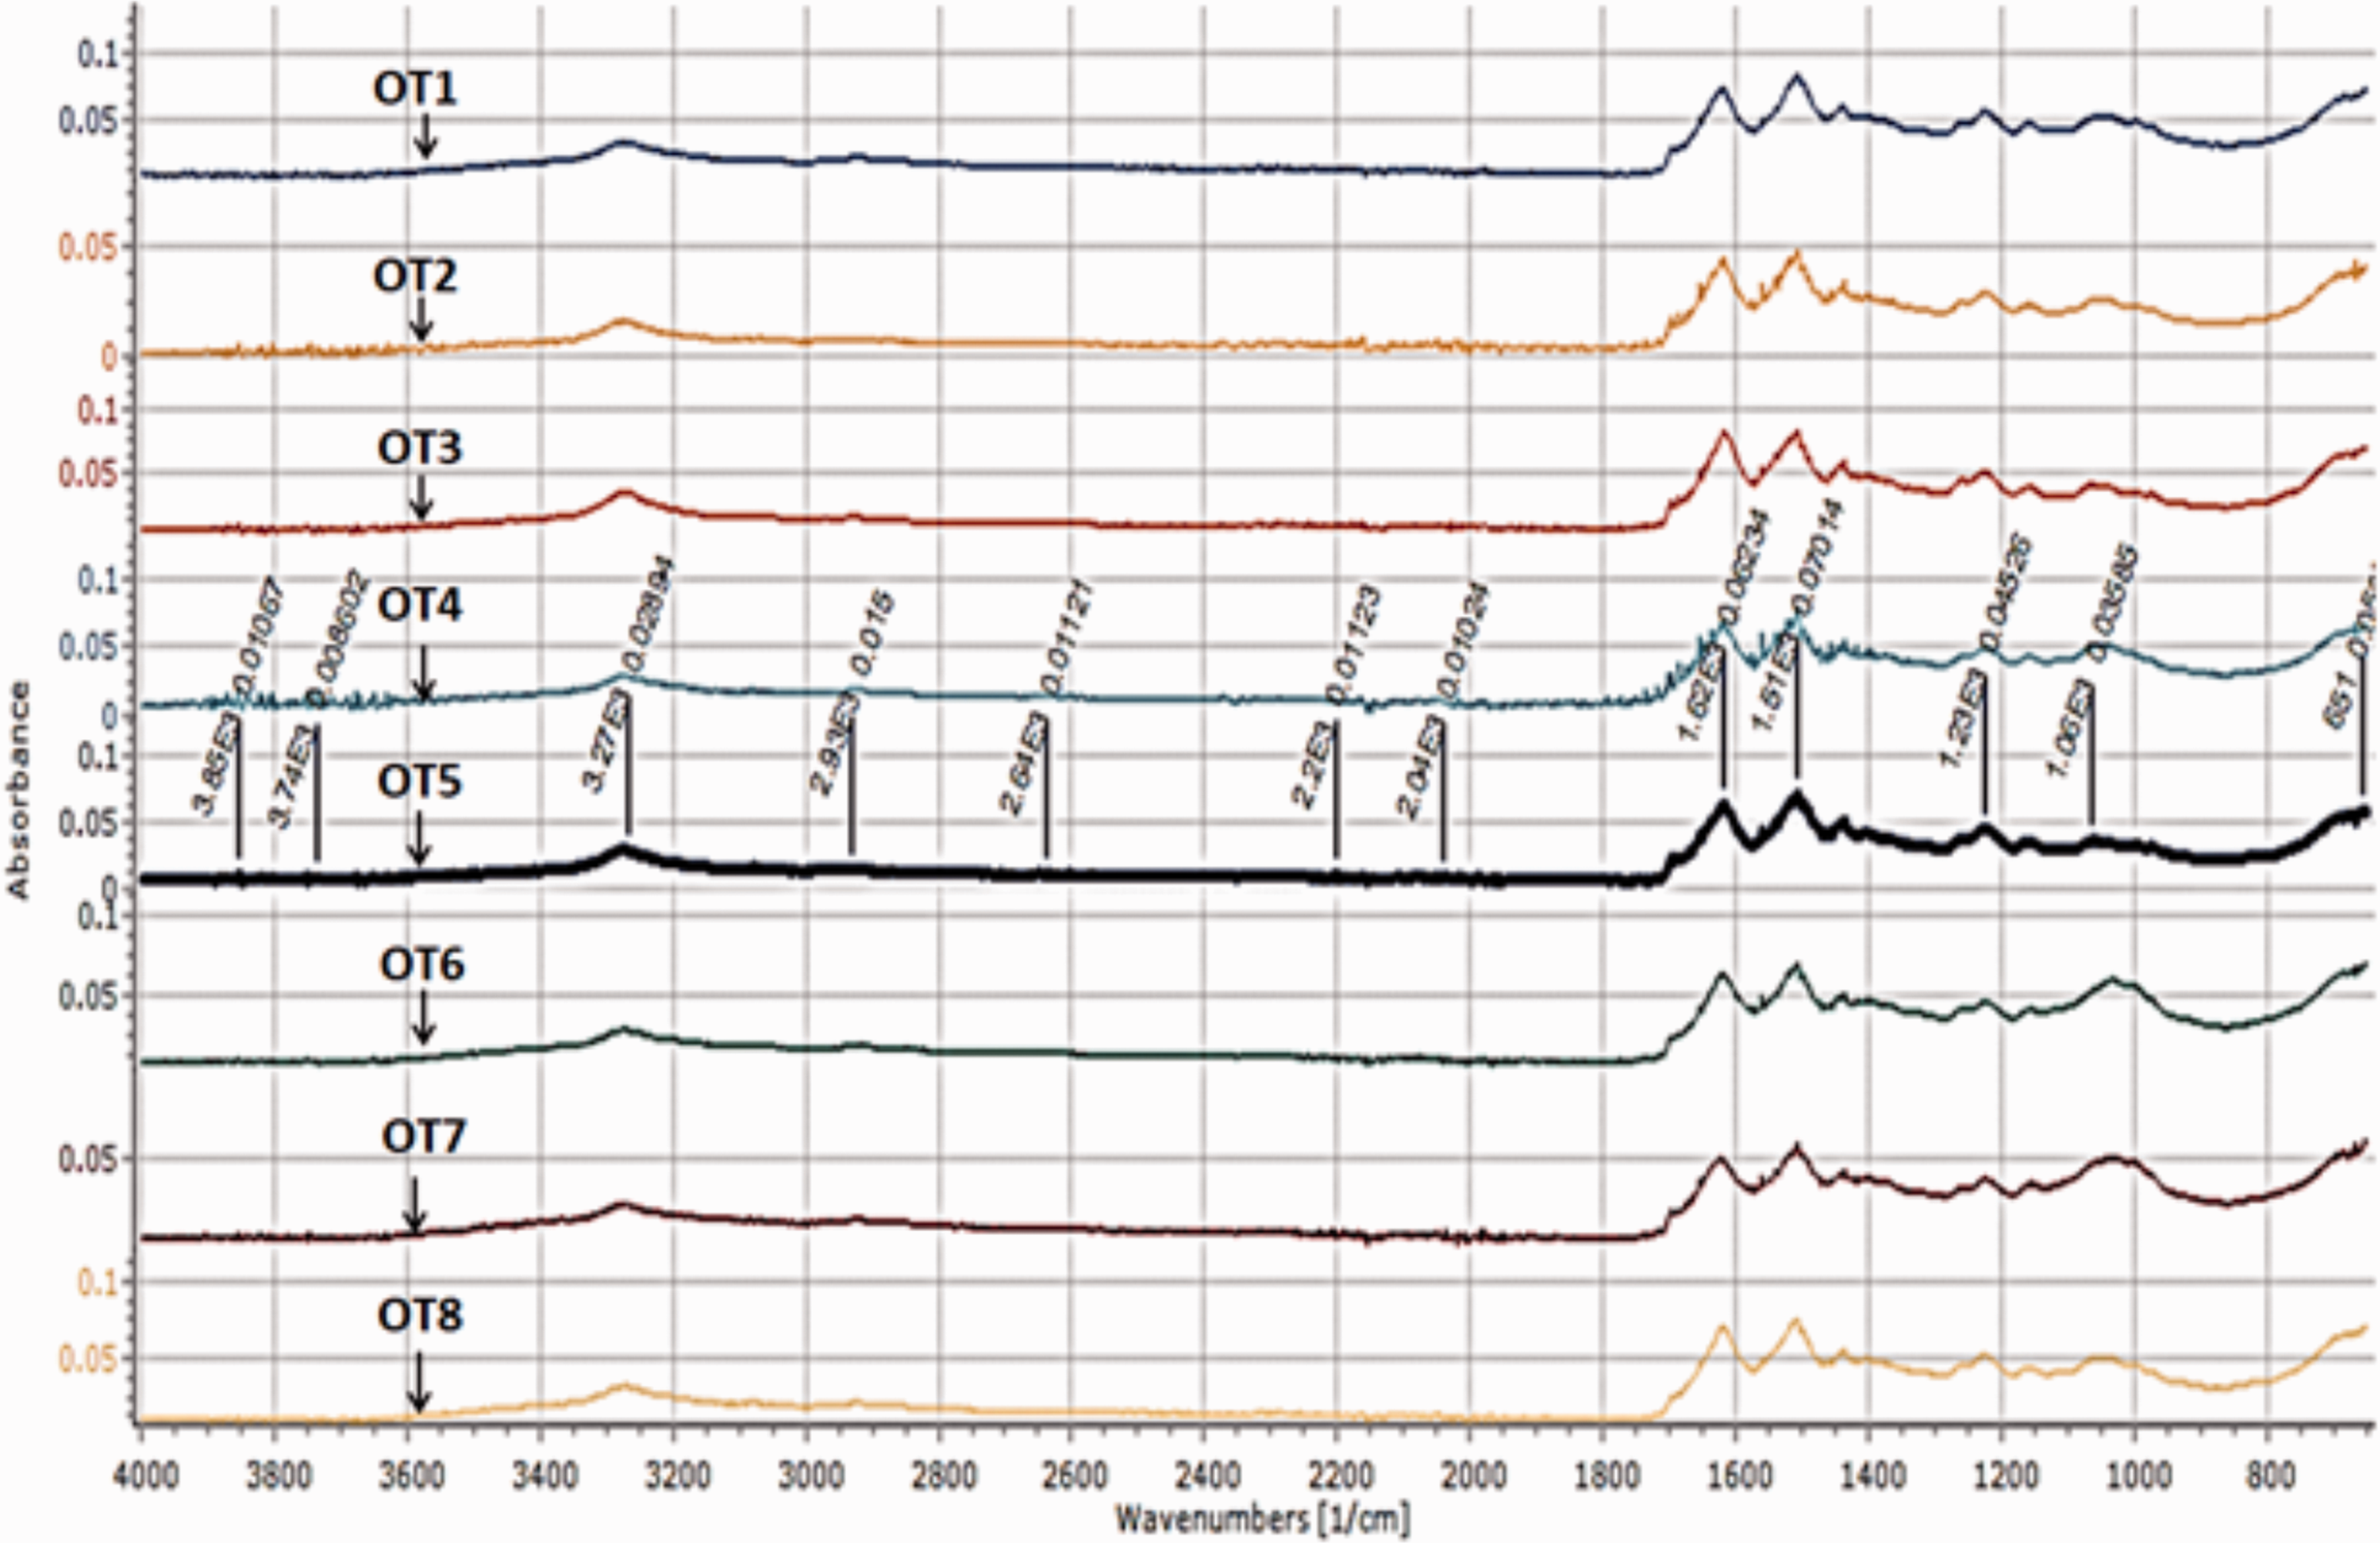
Other noticeable spectra presented in the high wavelength range were bands centered at 3275 cm−1. These can be attributed to primary aliphatic amine N–H asymmetric and symmetric stretching vibrations (which usually occur at 3450–3250 cm−1). Therefore, it can be presumed that the decomposition of fibroin peptide in silk samples over centuries produces primary aliphatic amines. This is supported by appearance of a wide band in the 1220–1050 cm–1 region that can be attributed to C–N stretching vibrations of primary aliphatic amines. IR spectra of historical silk samples showed carboxyl, carbonyl and nitro groups, suggesting that they might have suffered oxidative damage. 25
Few differences in the spectra were obtained in the infrared absorption level in the frequency regions from 2800 to 1800 cm−1. It is known that this frequency region depends on the air composition in the laboratory and its interaction with different fibers. So, it cannot be used for fiber constitution identification and further investigation. 27
Elemental analysis—type of mordant
Composition of old silk fiber elements (in atomic % a) based on energy-dispersive X-ray analysis
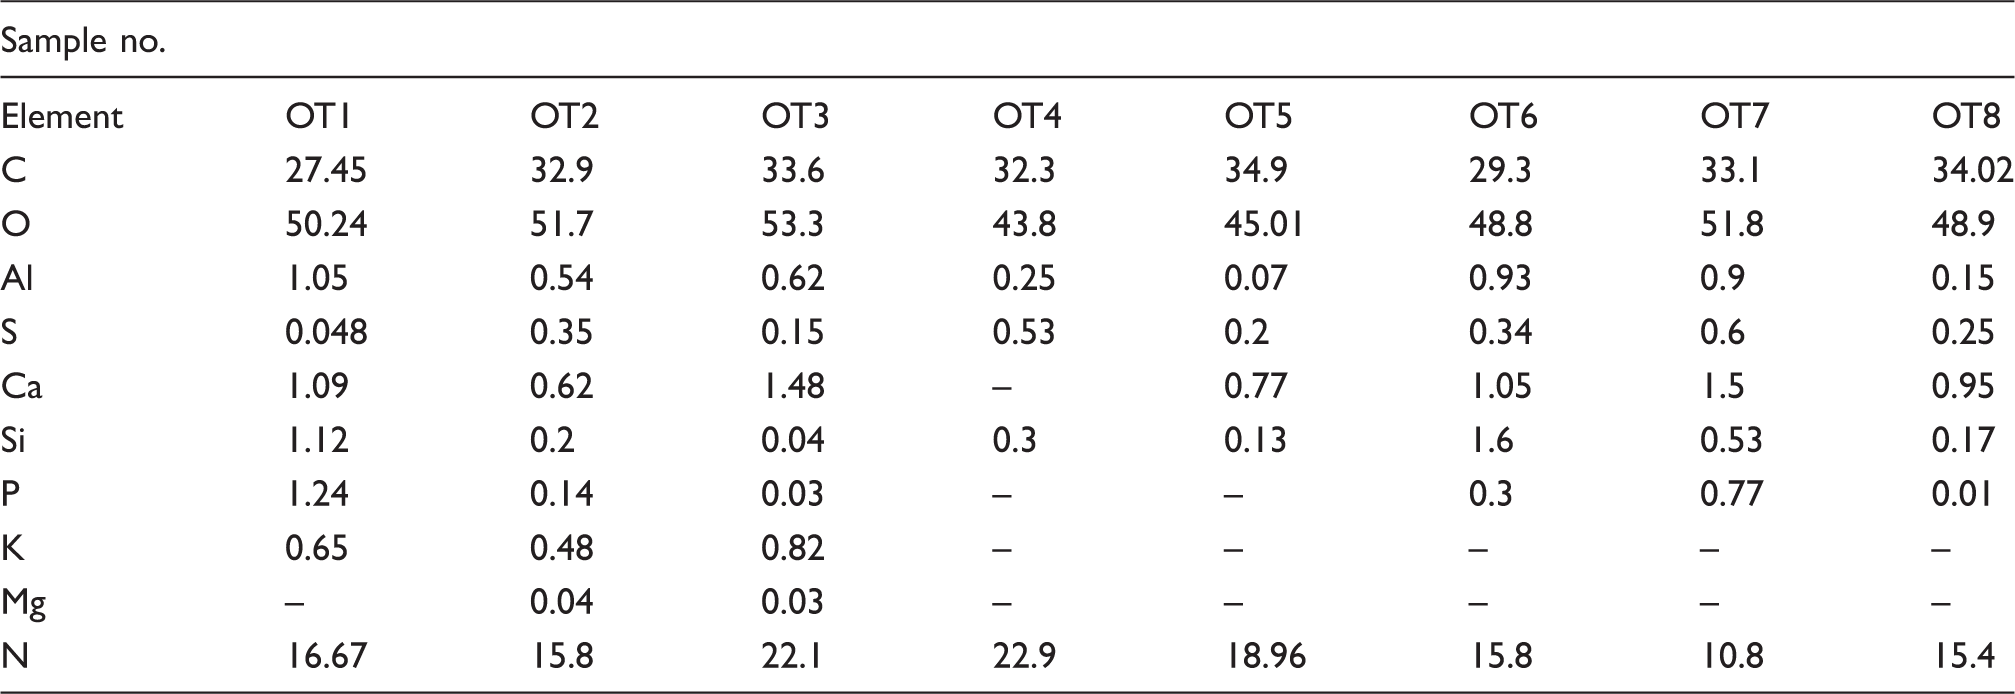
Metal threads components
The EDX analysis for sample OT4 shows that the metallic wire consists of silver (Ag) as a major compound and gold (Au) as a minor compound, as shown in spectra, with average amounts of Ag 50.4% wt and Au 22.3% wt, while the metal threads of sample OT6 are composed entirely from Ag with an average of 90.9% wt (Figure 6).
Scanning electron microscopy image with energy-dispersive X-ray analysis spectrum for samples OT4 and OT6.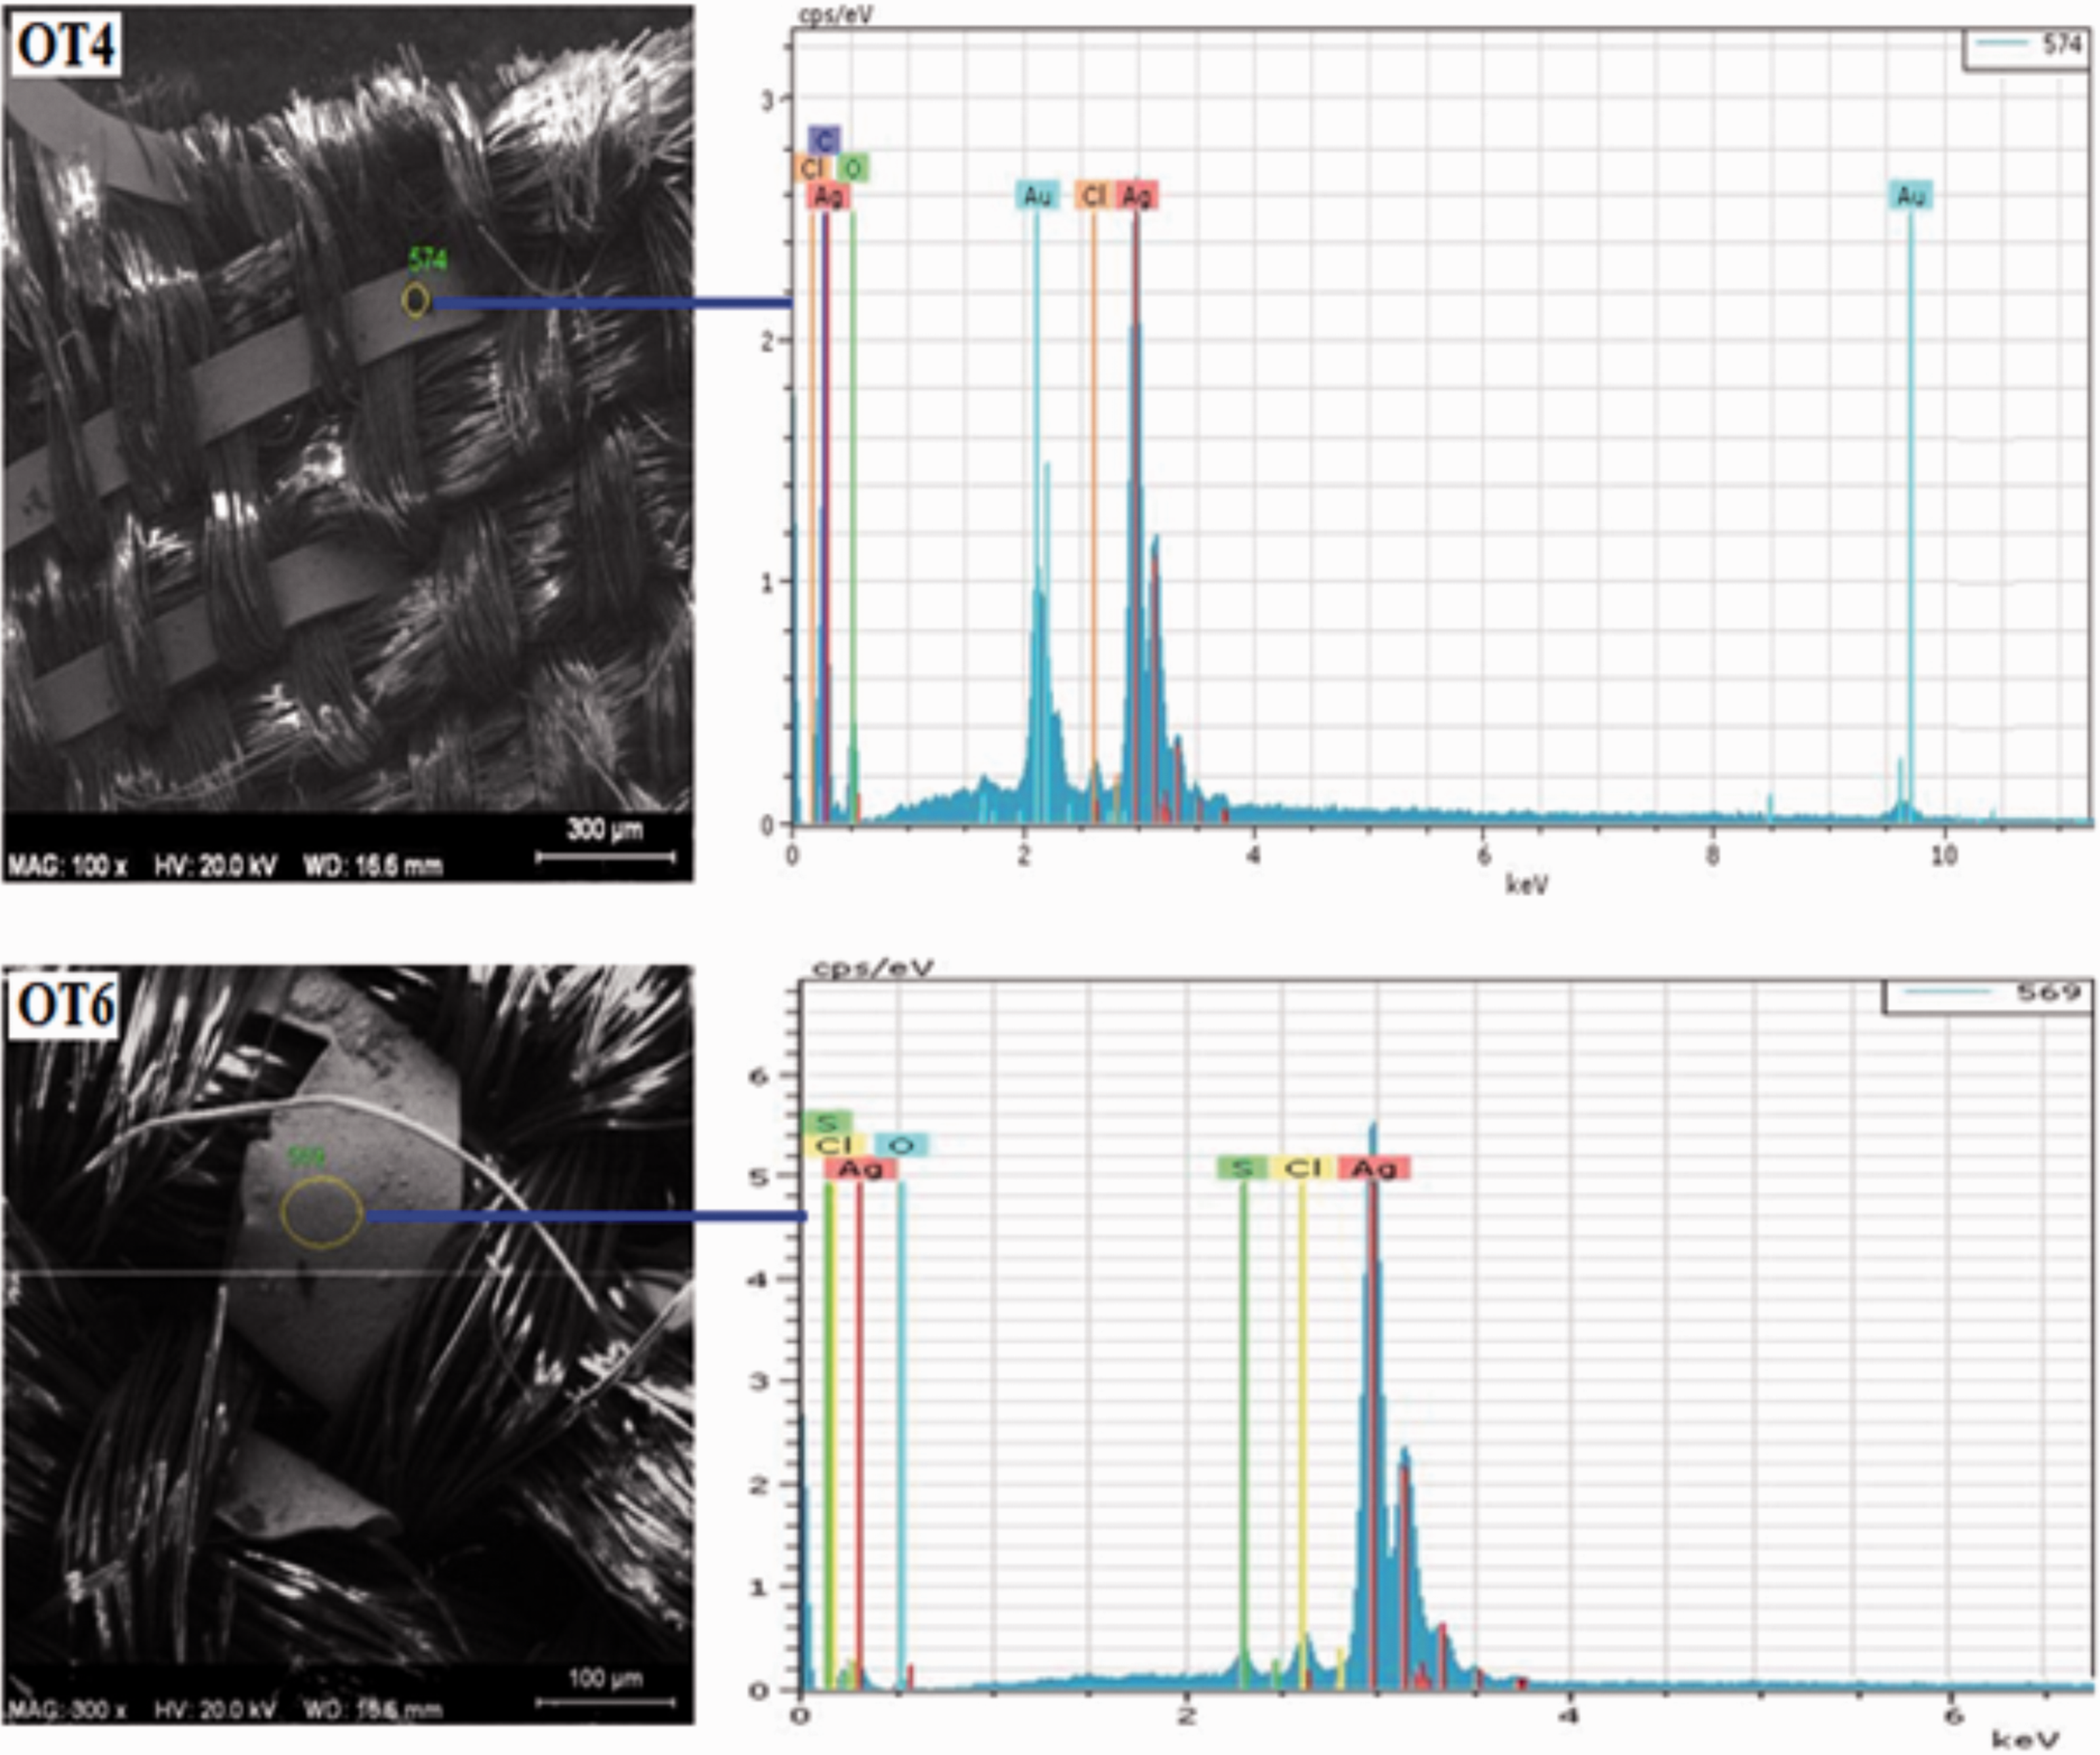
Molecular analysis of the dyes
The dyeing process between the colorant and the fiber establishes not only chemical ionic (salt bridge), covalent or coordinative bonds, but also physical or inter-molecular H bonds. By means of ATR-FTIR and HLPC analyses, the colorants and the textile fibers are identified on the basis of the interactions occurring between them.
ATR-FTIR
As regards the identification of the spectral characteristics of dye molecules on the historical Romanian silk fragments using ATR-FTIR, there is, generally in all spectra, a significant overlapping between the bands of the new and old silk samples with the organic dyes, indicating a strong inter-molecular binding to the silk fibroin structure compounds. This might suggest there is a considerable possibility of degradation over time for historical samples in both dye molecules and fiber structure compounds. Moreover, the presence of dye on the fibers often produced only slight variations in the spectral pattern and, for this reason, some spectra are completely superimposable with that of mordant treated silk fibers. This was noticeable when historical silk samples were compared and measured with new silk dyed reference samples for comparison and matching purposes. Only in some cases were some minor characteristics attributable to the corresponding dye. 28
Due to the possible overlapping of the spectra signals, a long aging period and the unknown burial conditions of the historical textiles pieces, the amount of information that can be deducted from the infrared spectra of the samples was based on juxtaposing the spectra of newly produced and historical samples, with attempts to identify existing basic functional or chromophore groups. The spectra of dyed silk samples primarily display peaks of the proteinaceous fibers (Figure 5), which appear around values of 3275, 3075, 2925, 2872, 1701, 1620, 1513, 1440, 1228 and 1069 cm−1.
As far as coloring compounds are concerned, the IR fiber absorption pattern showed some minor characteristics attributable to the corresponding dye. On the basis of a database for individual compounds in the bands from about 1700 to 1100 cm−1, significant similarities between absorption bands and characteristic values matched with flavonoid-like compound dyes, such as luteolin and rhamnetin.
29
A new weld-dyed sample showed comprehensive matching with historical sample OT1 (Figure 7(a)). Significant similarities between absorption bands and characteristic values for the weld dye (Reseda luteola L.—RT4) can be seen. Moreover, a similar spectra pattern was clear between the sample dyed with Persian berries (Buckthorn) and historical sample OT2 (Figure 7(b)).
Attenuated total reflectance Fourier transform infrared spectra for the (a) sample OT1 spectrum versus new silk weld (RT4) dyed sample, (b) sample OT 2 spectrum versus new silk Persian berries (RT3) dyed sample and (c) sample OT3 spectrum versus new silk walnut (RT8) dyed sample.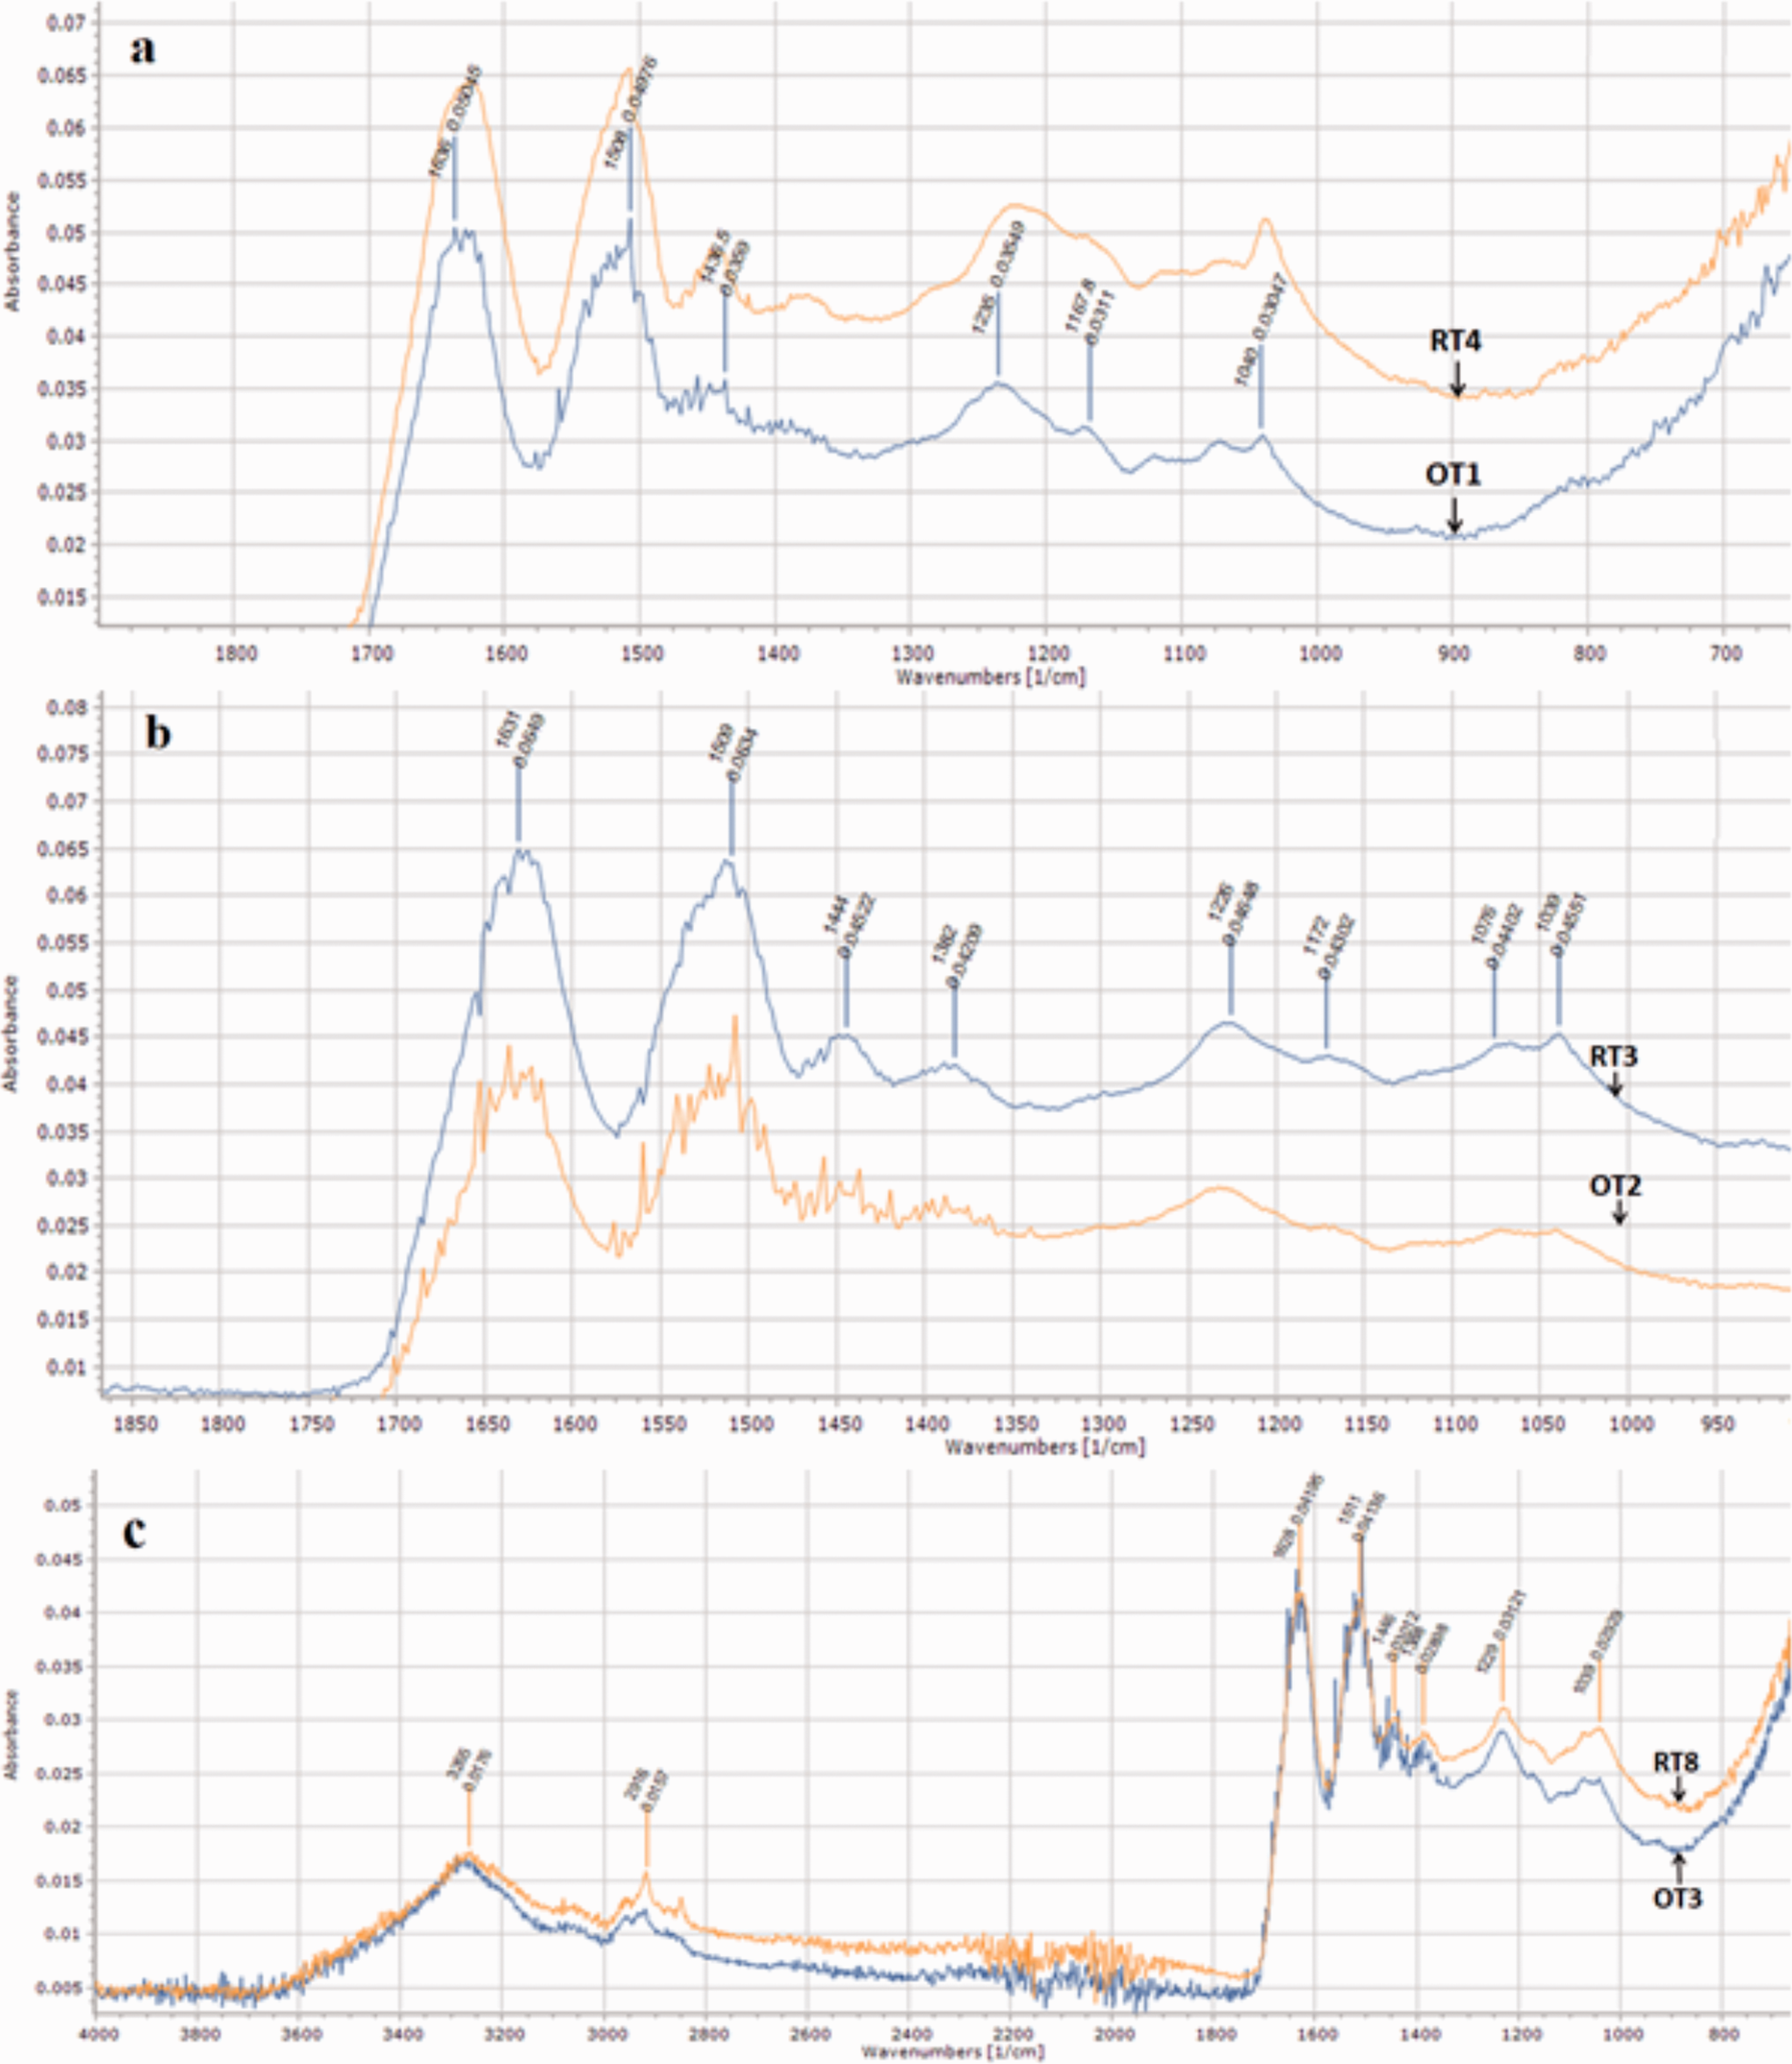
For historical sample OT3 it was noted that the IR spectrum (Figure7(c)) contains several bands common to naphthoquinone-based dyes, such as lawsone or juglone, whereas the band from 3265 cm−1 indicates the presence of hydroxyl groups and C–H; the band around 1510 cm−1 indicates the presence of aromatic (CHar) and saturated (C–C) structures existing in naphthoquinone as a derivative of naphthalene; the band from 1039 cm−1 indicates the presence of C–O groups. These results are in accordance with other literature studies that found juglone (a naphthoquinone) to be one of the compounds responsible for the brown color. 30
For historical samples OT4–OT8, the spectral features appear to point to anthraquinone-based group compounds. This has been indicated after obtaining quality IR spectra of dyes from the fibers, by conducting spectrum subtraction. Reference spectra of un-dyed silk fiber were subtracted from the spectrum of four new silk colored samples (cochineal, kermes, madder and lac) and compared with the historical samples under study; the result is a spectrum that can be interpreted as an IR spectrum that corresponds to each of dyes on the fibers. The obtained result (Figure 8) shows evident absorption band peaks at wavelengths of 1714, 1685 and 1587 cm−1. The available literature data postulate that these detected spectral peaks are typical for madder and cochineal. The FTIR-ATR absorption band at 1685 cm−1 is a characteristic peak of the carbonyl group absorption (C=O) in anthraquinone derivative compound structures; more than one peak band around near positions might indicate the presence of more than carbonyl group in different positions to the phenol structure position, or might be attributed to the hydrogen bond between the carbonyl and the phenol at different positions.29,31
Attenuated total reflectance Fourier transform infrared spectrum for subtraction, OT7 and new un-dyed silk fiber.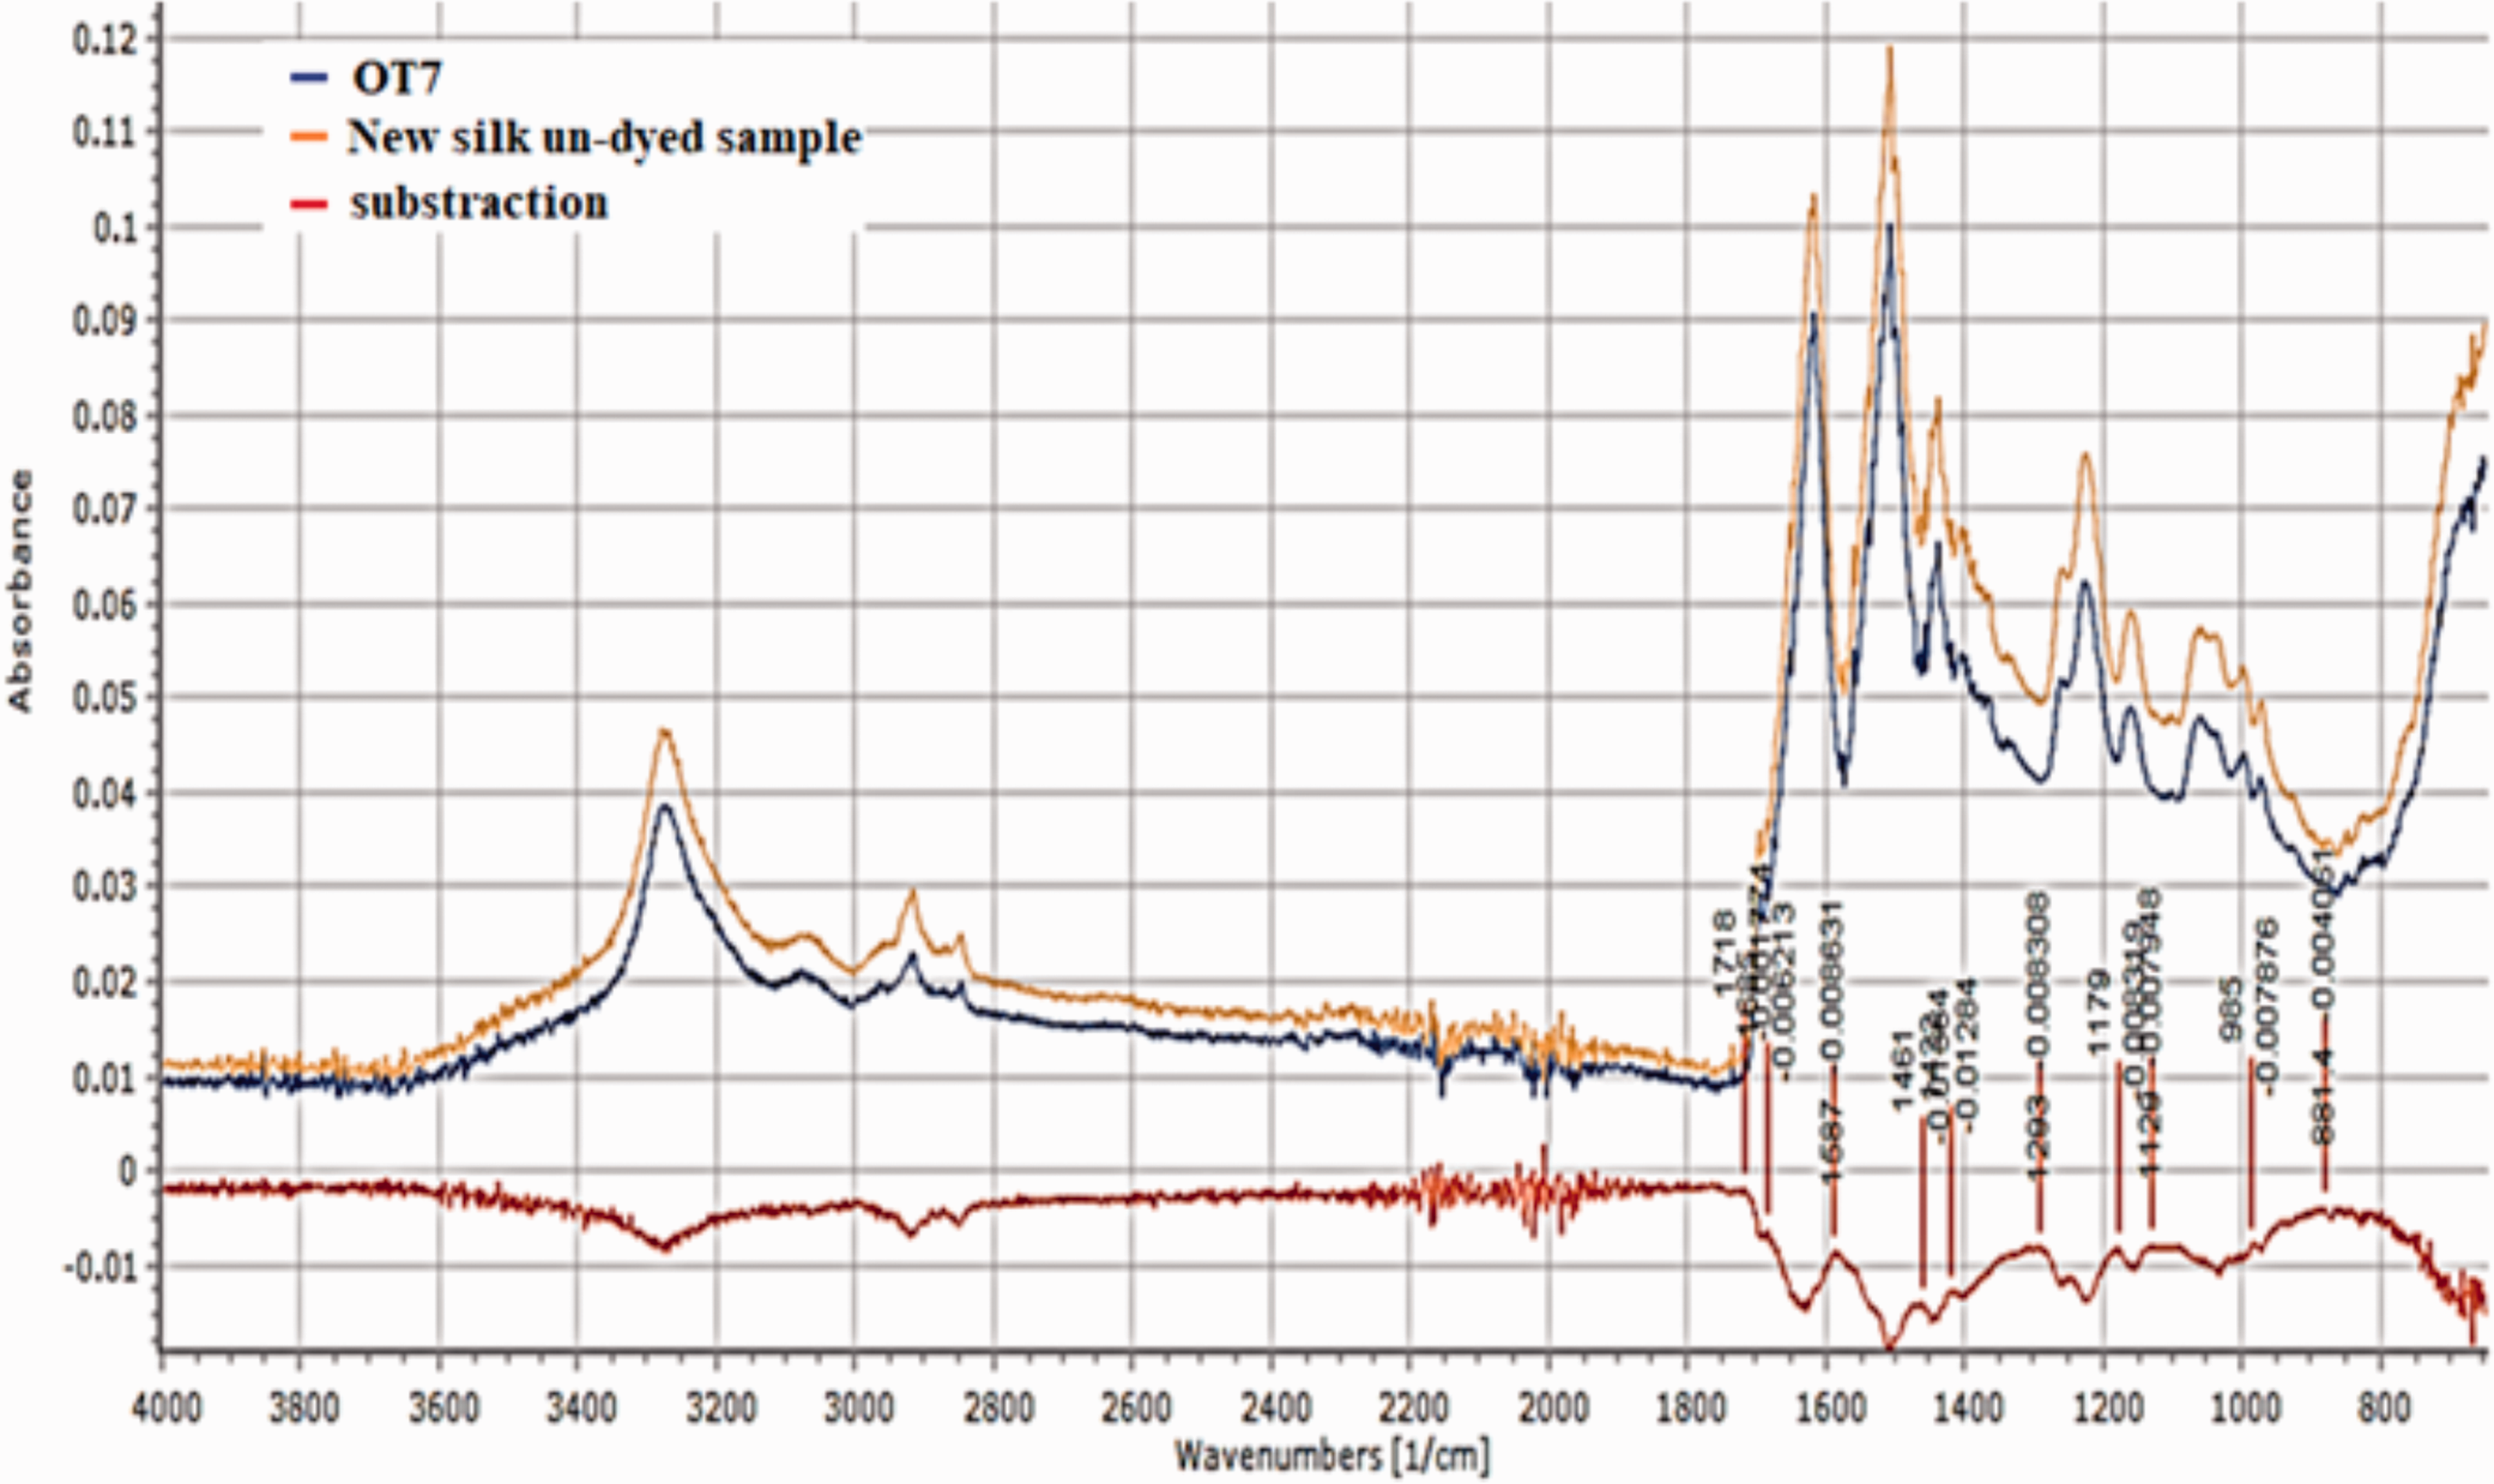
However, the anthraquinone derivative structures behave almost with the same vibrational spectral pattern when dyed with silk, which might suggest a strong inter-molecular bonding between silk fiber structure groups and the organic aromatic compounds of the red dyes, making the differences observed between the spectra of anthraquinone compound types inconclusive.31–33
HPLC
Cromatographic data and identified dyes for the investigated samples
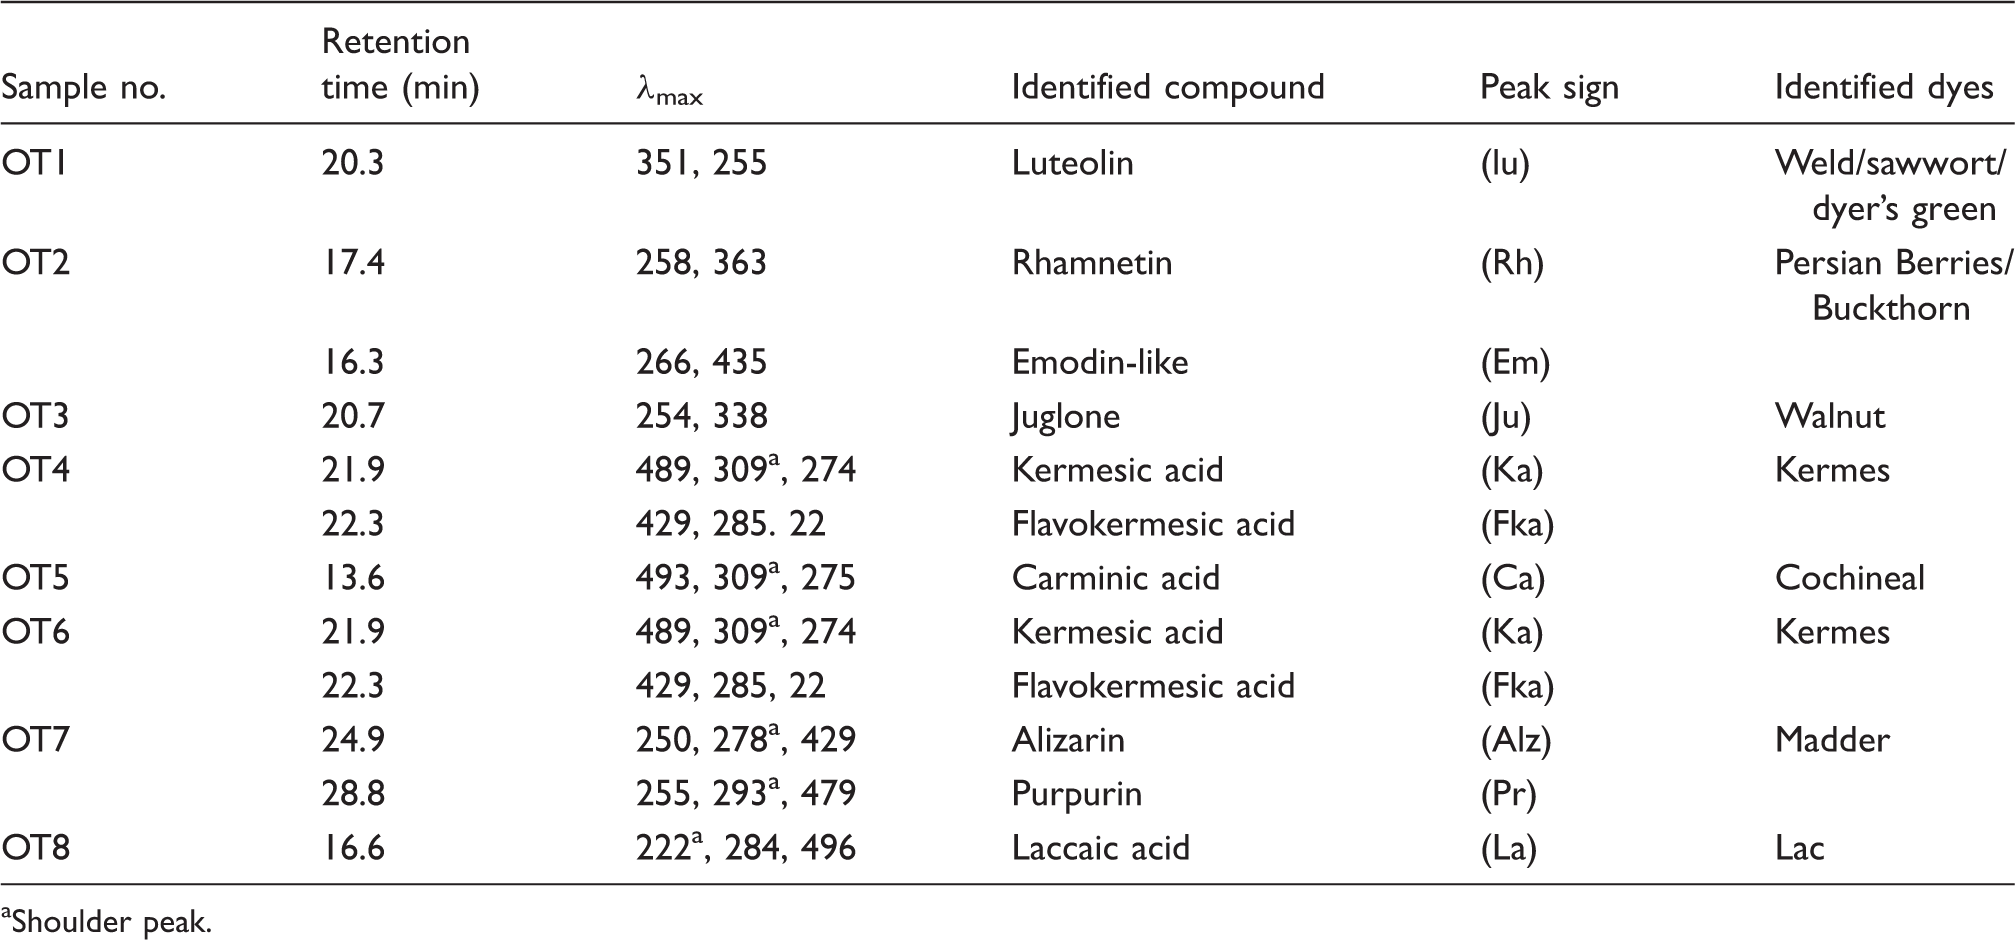
Shoulder peak.
Yellow dyes
Samples OT1 and OT2 were often dyed with yellow flavonoids of plant origin. Among the main colorant flavonoid compounds detected were luteolin in sample OT1 and rhamnetin and perhaps emodin in sample OT2. The spectrum peak for sample OT1 is in agreement with luteolin compound, which is the main yellow flavonoid in many yellow dye plants. Luteolin (flavon) is a major component of some yellow plant dyes. It is present mainly in three well-known European dyeing plants: weld (Reseda luteola), dyer’s broom (Genista tinctoria) and sawwort (Serratula tinctoria). In the absence of accompanying characteristics of minor compounds, such as apigenin or genistein, differentiation between the sources mentioned is impossible. The absence of the markers that usually accompany luteolin can be explained by the generally very low ageing resistance of yellow dyestuffs. These compounds could also be present in quantities below their detection limits in the applied method.34–37 Nevertheless, the chromatographic profile of sample OT1 is quite similar and comparable to the chromatogram of the weld extract. The chromatogram peak at retention time of 15.2 min, which has the same UV-visible spectrum, might be an isomer or glucoside form of the luteolin compound (Figure 9).
(a) Chromatogram of new weld-dyed sample extract versus sample OT1 extract. (b) Ultraviolet (UV)-visible spectrum of luteolin. (a) Chromatogram of new Persian berry dyed sample extract versus sample OT2 extract. (b) Ultraviolet (UV)-visible spectrum of the rhamnetin and emodin-like compound.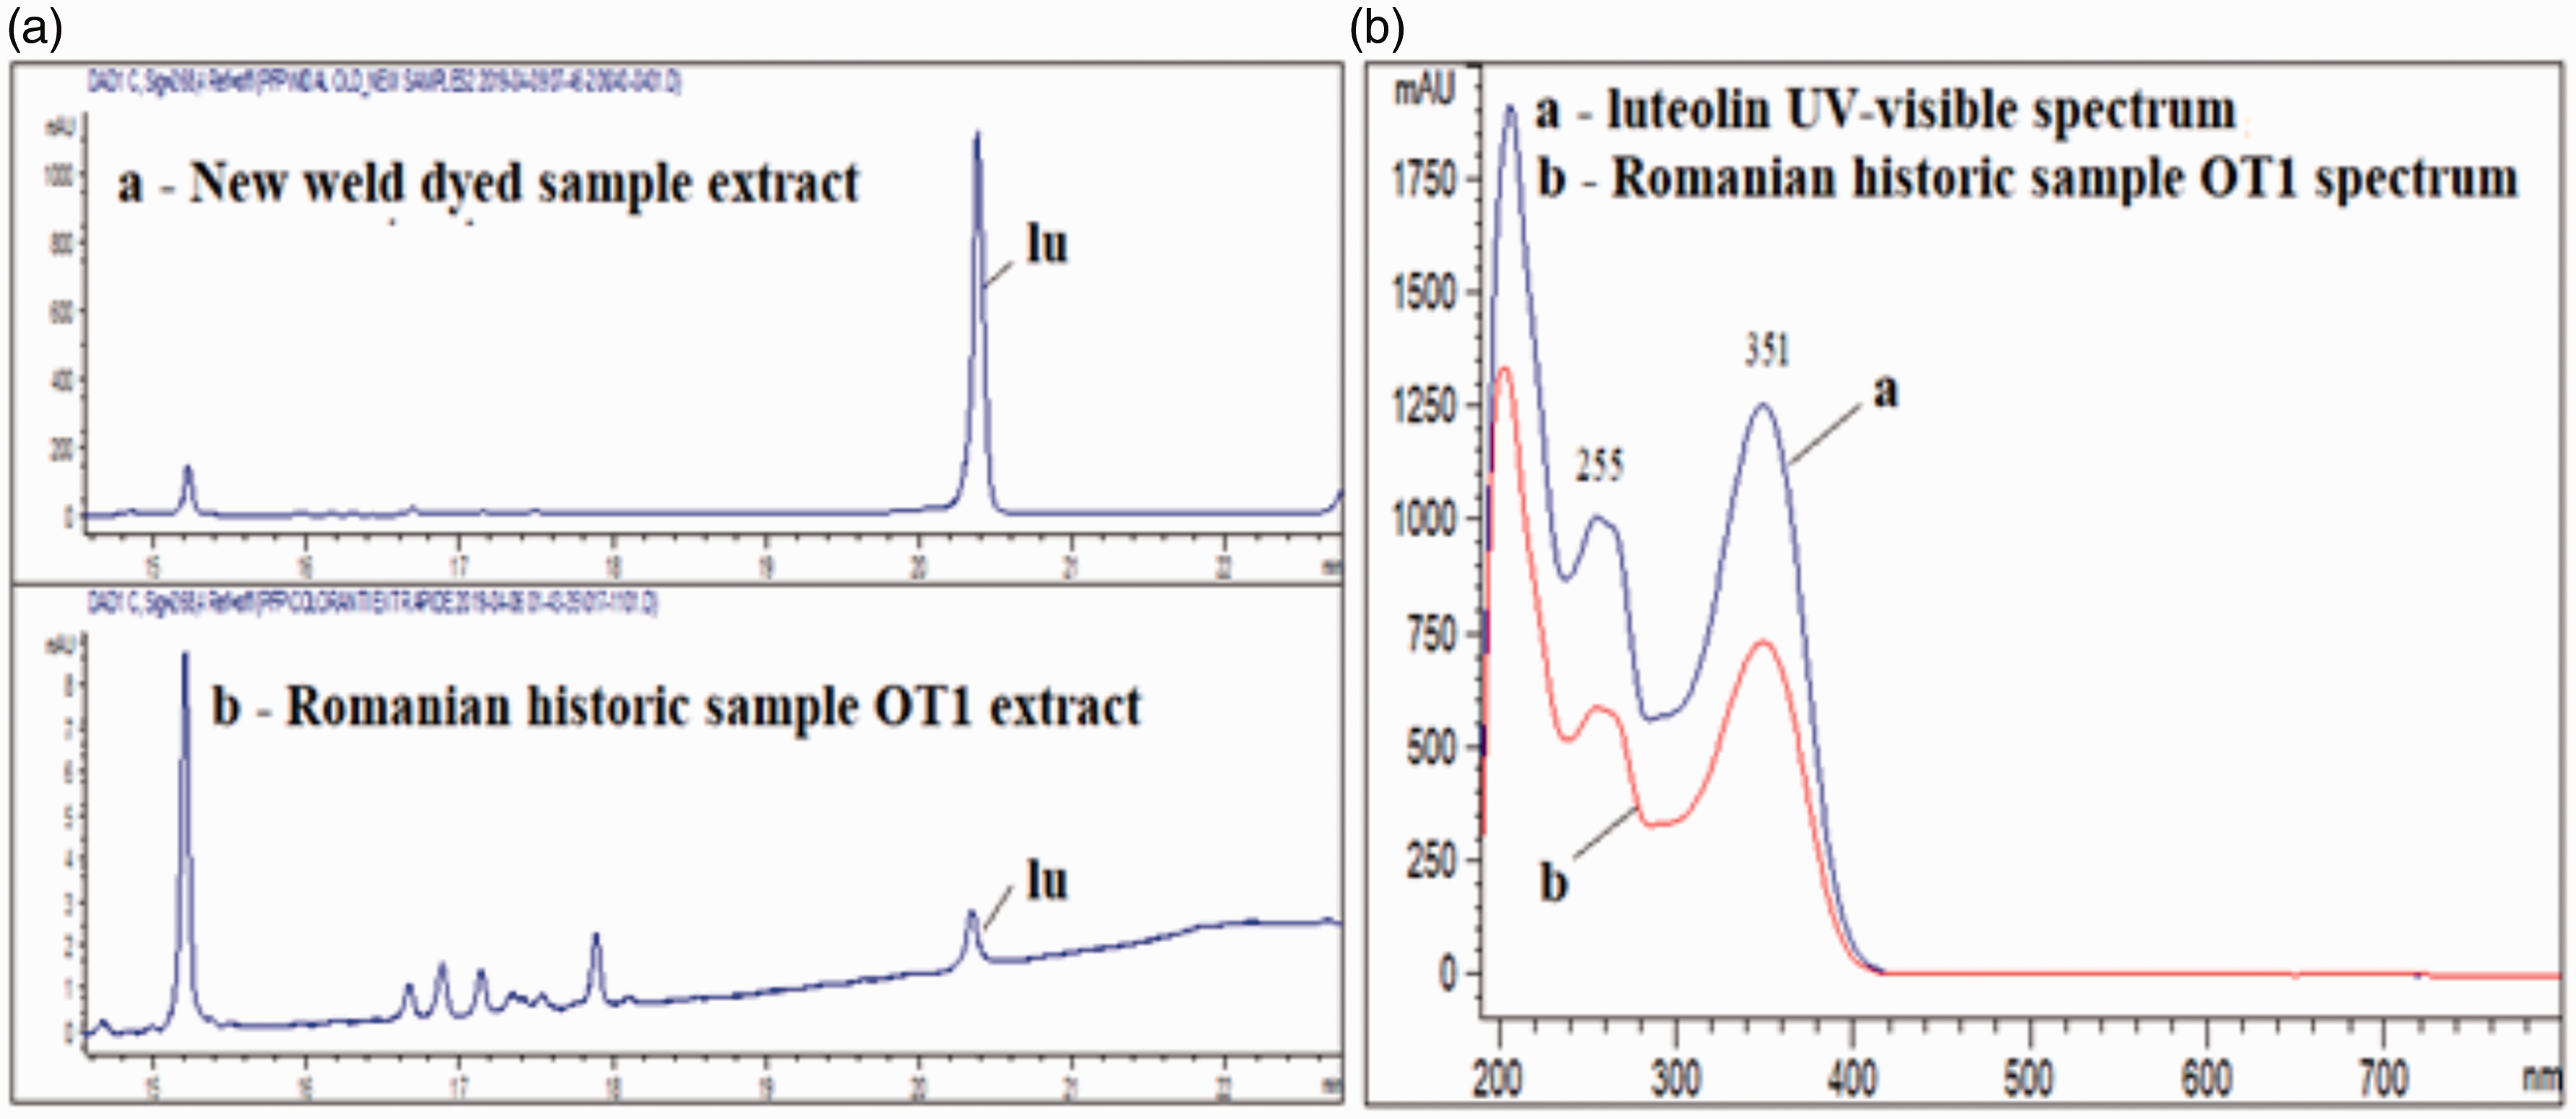
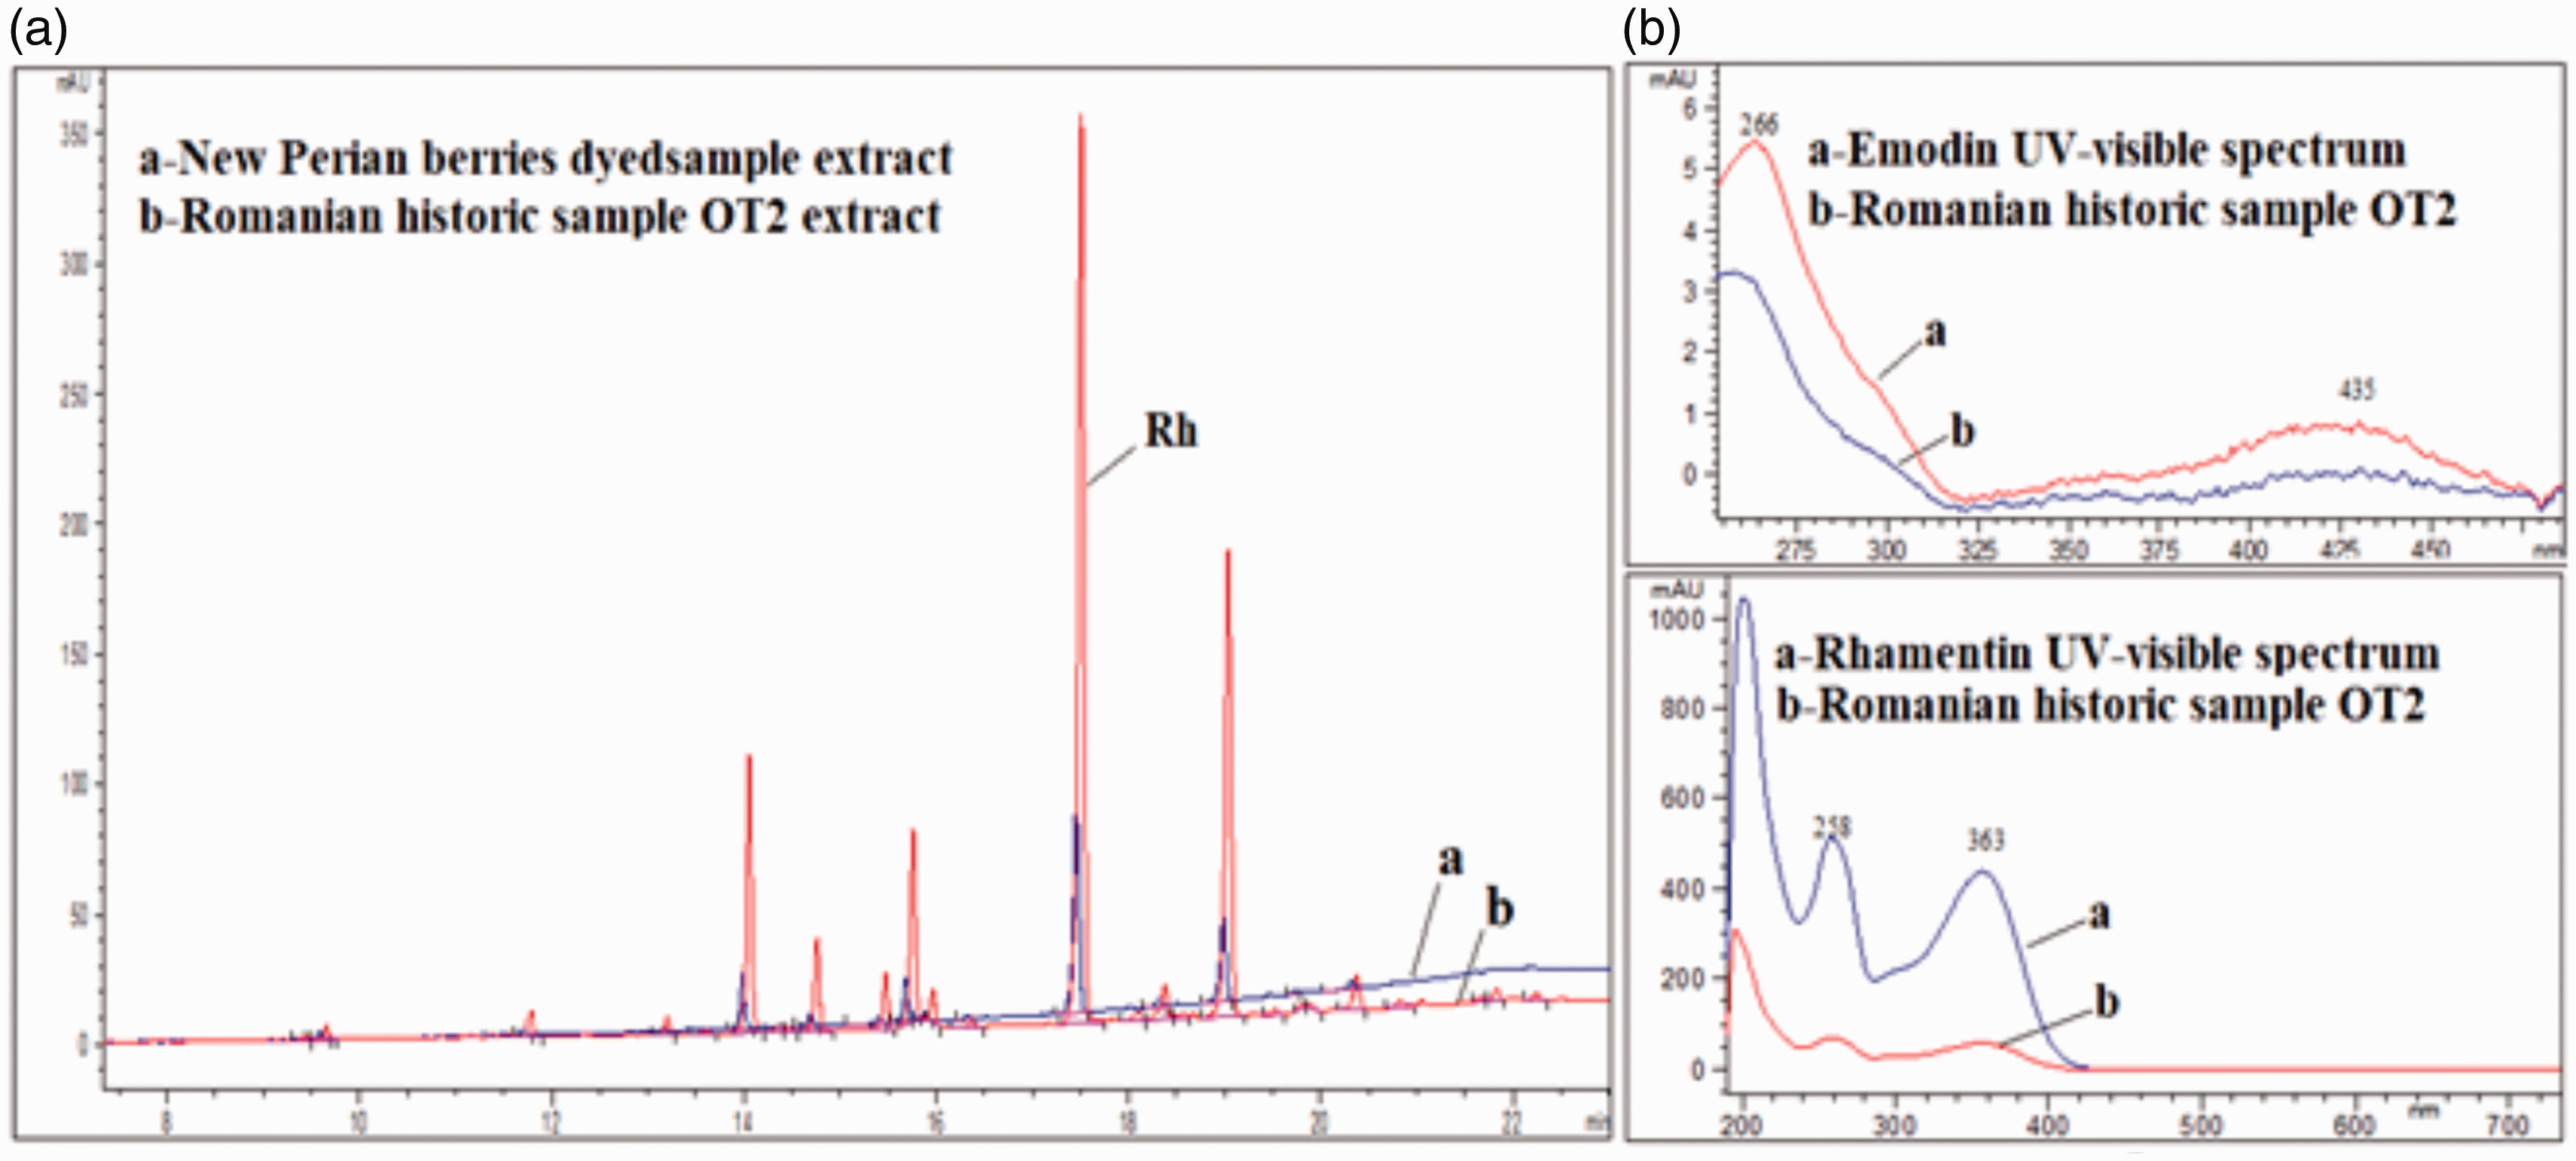
The obtained results and the literature data correlate with the occurrence of the rhamnetin compound chromatogram peak identified in sample OT2; a trace amount of emodin-like compound was detected at a retention time of 16.3 min after comparison of retention times and spectra peaks with the Persian berry (Buckthorn) dyed sample extract, namely rhamnetin and emodin (Figure 10). 38
Brown dye
For historical sample OT3, the chromatographic peak decrease at around a retention time of 12.4 min. is similar to that of the walnut extract sample, with the characteristic UV-visible spectrum of a juglone-like compound (Figure 11). The spectrum is typical to a naphthoquinone-based structure; more specifically, it is likely to be a juglone compound with characteristic long wavelength absorption band that differs from lawsone, a similar juglone dye compound found mainly in Henna plant dye.39,40 Other compound peaks are detected, but they are not identified. Perhaps they represent other naphthoquinone compounds, or a form of gallic or ellagic acid, since walnut dye plant contains many chemical compositions.
41
(a) Chromatogram of new walnut dyed sample extract versus sample OT3 extract. (b) Ultraviolet (UV)-visible spectrum of the juglone compound.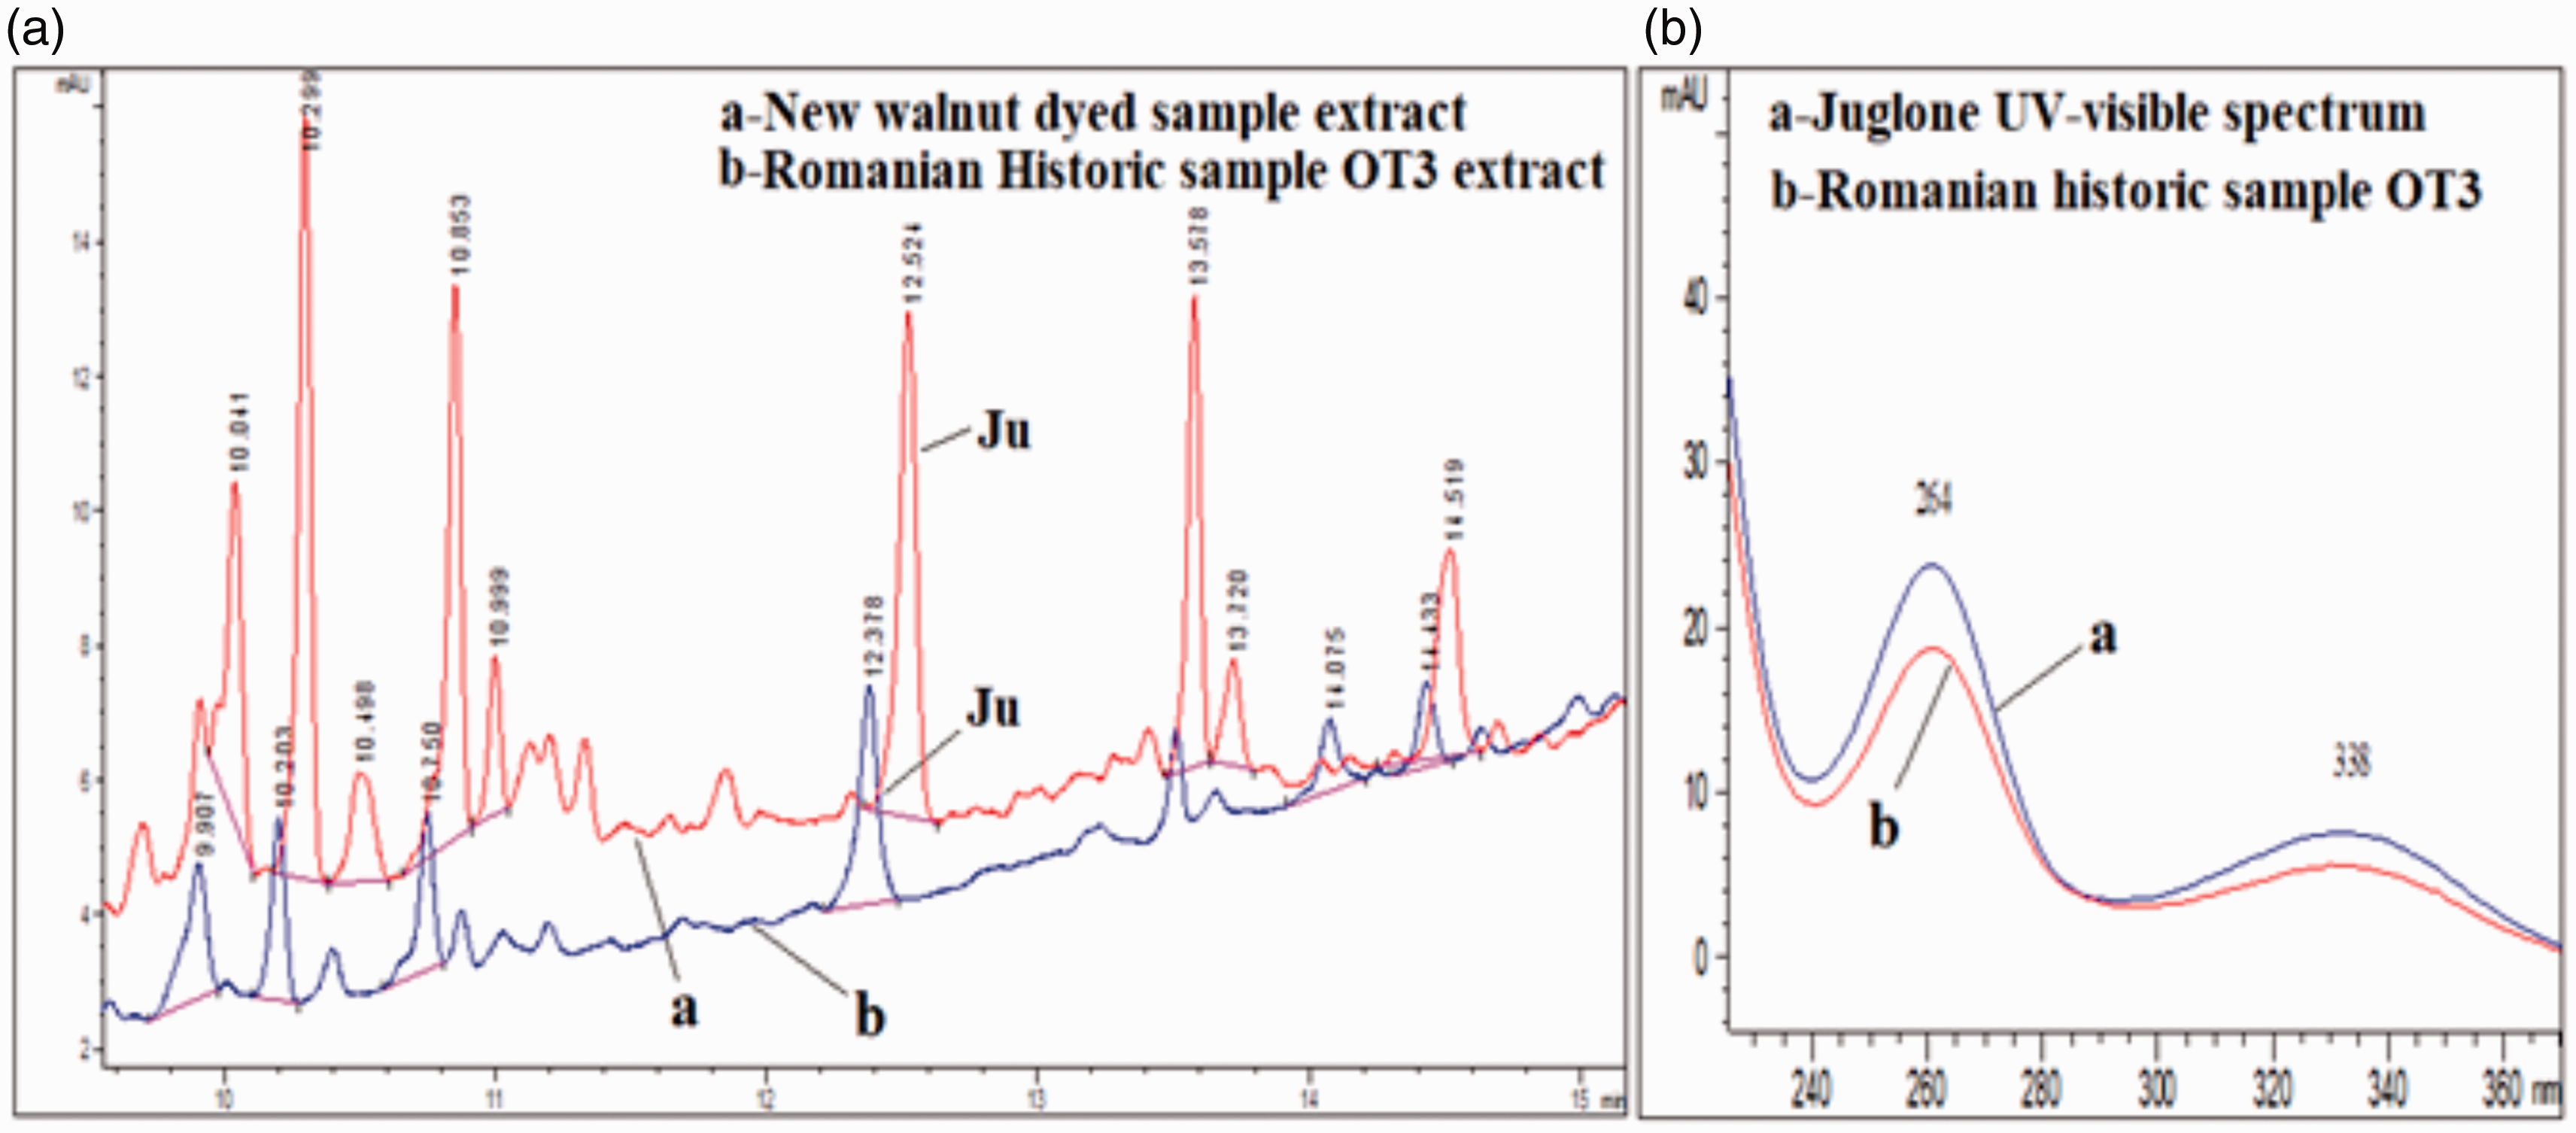
Red dyes
The chromatographic and UV-visible spectra peaks for samples OT4–OT8 suggest they were dyed with red dyestuffs from plants and insect sources. These red dyes commonly have an anthraquinone-based structure. Anthraquinone-derived red dyes were mainly used as mordant dyes in which the carbonyl group and the adjacent phenolic group(s) establish the fiber–mordant–dye complex. 37
Samples OT4 and OT6 are found to be dyed with kermes dye. Kermes dye is a mixture of kermesic acid (>75%) and flavokermesic acid (also called laccaic acid D). The chromatographic peaks correspond to kermesic and flavokermesic acid at retention times of 21.9 and 22.3 min, respectively, and were confirmed with the typical UV-visible spectra of both compounds (Figure 12). Kermes is considered to be one of the most expensive dyeing sources in ancient times. It gives a strong scarlet color and was used only for high-rank religious clerics in churches.
42
(a) Chromatogram of new kermes dyed sample extract versus sample OT4 extract. (b) Ultraviolet (UV)-visible spectrum of the kermesic acid compound. (c) UV-visible spectrum of the flavokermesic acid compound.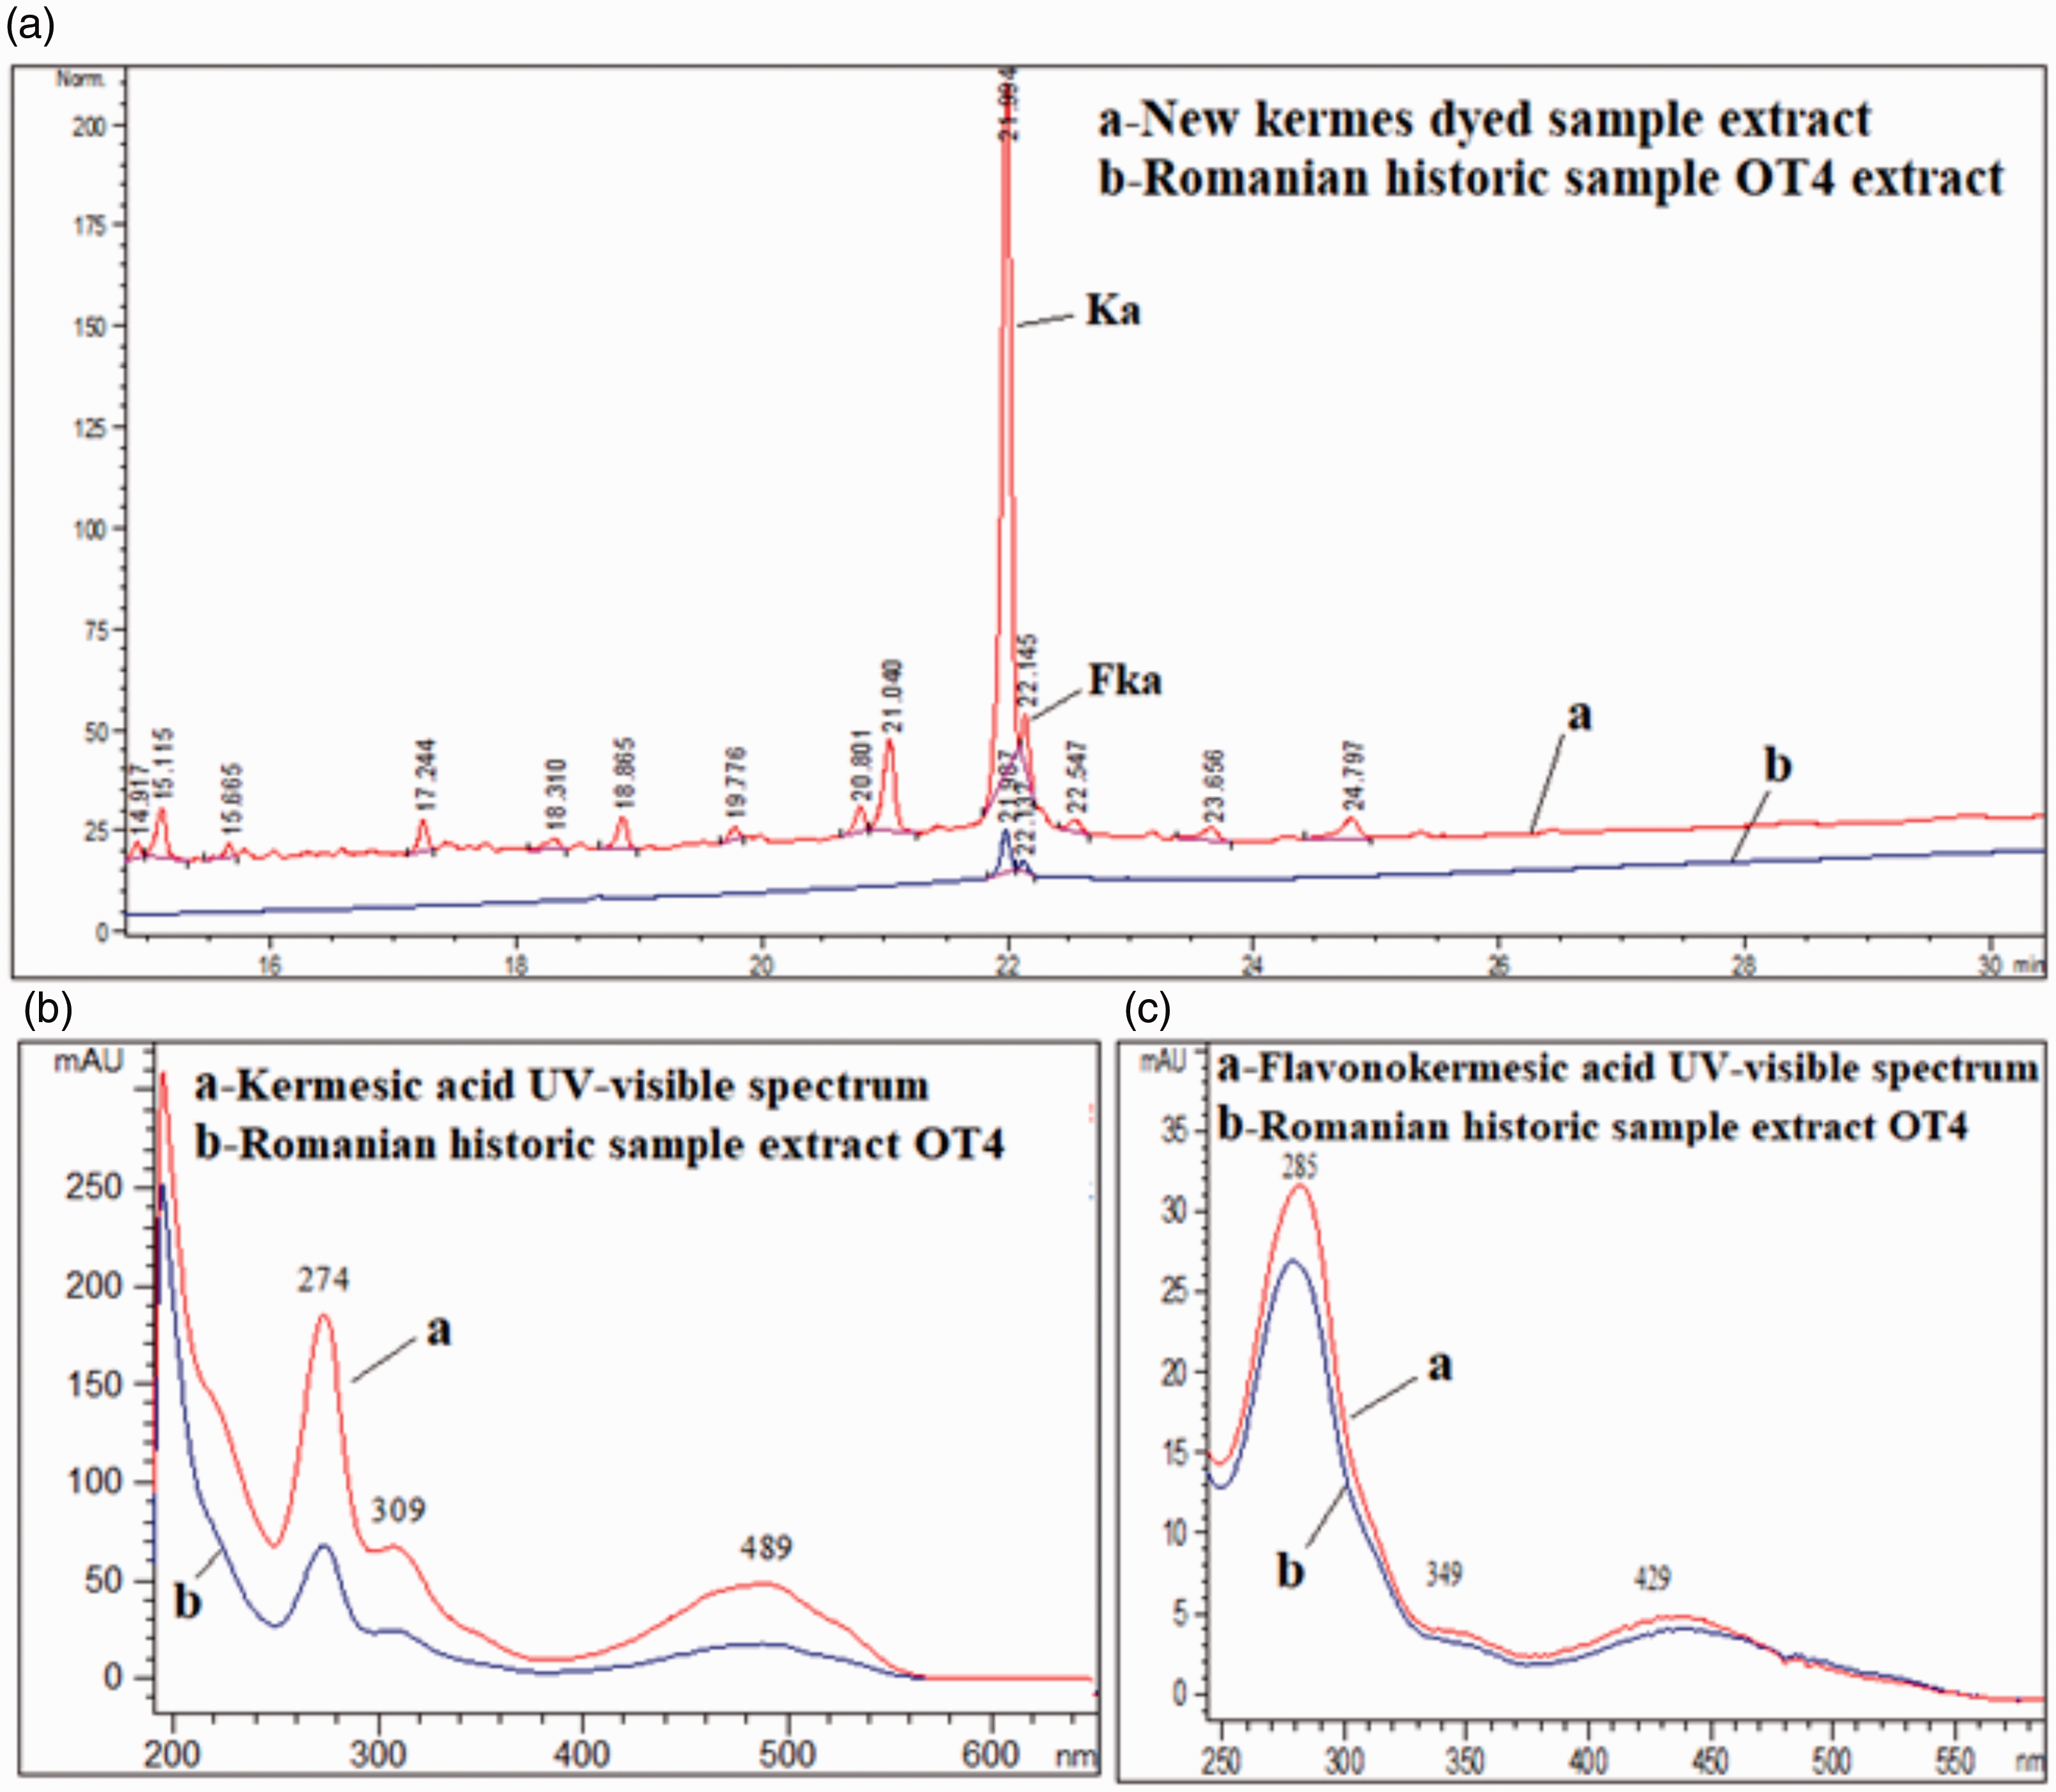
Cochineal insect dye extracts show significant matching with that in historical sample OT5, with a main chromatographic peak at 13.6 min that corresponds to carminic acid according to the UV-visible spectra pattern (Figure 13). The main constituent of all cochineal dyes is carminic acid. The various species have, however, characteristic fingerprints of other minor anthraquinone components, including kermesic acid and flavokermesic acid, as well as of some still unidentified anthraquinoid compounds, commonly named dcII, dcIV and dcVI, which allows one to distinguish between them in historical samples. None of these mentioned anthraquinone components have been detected by chromatography for sample OT5. The study could not, accordingly, specify the exact geographical type species of cochineal.37,43–45
(a) Chromatogram of new cochineal dyed sample extract versus sample OT5 extract. (b) Ultraviolet (UV)-visible spectrum of the carminic acid compound.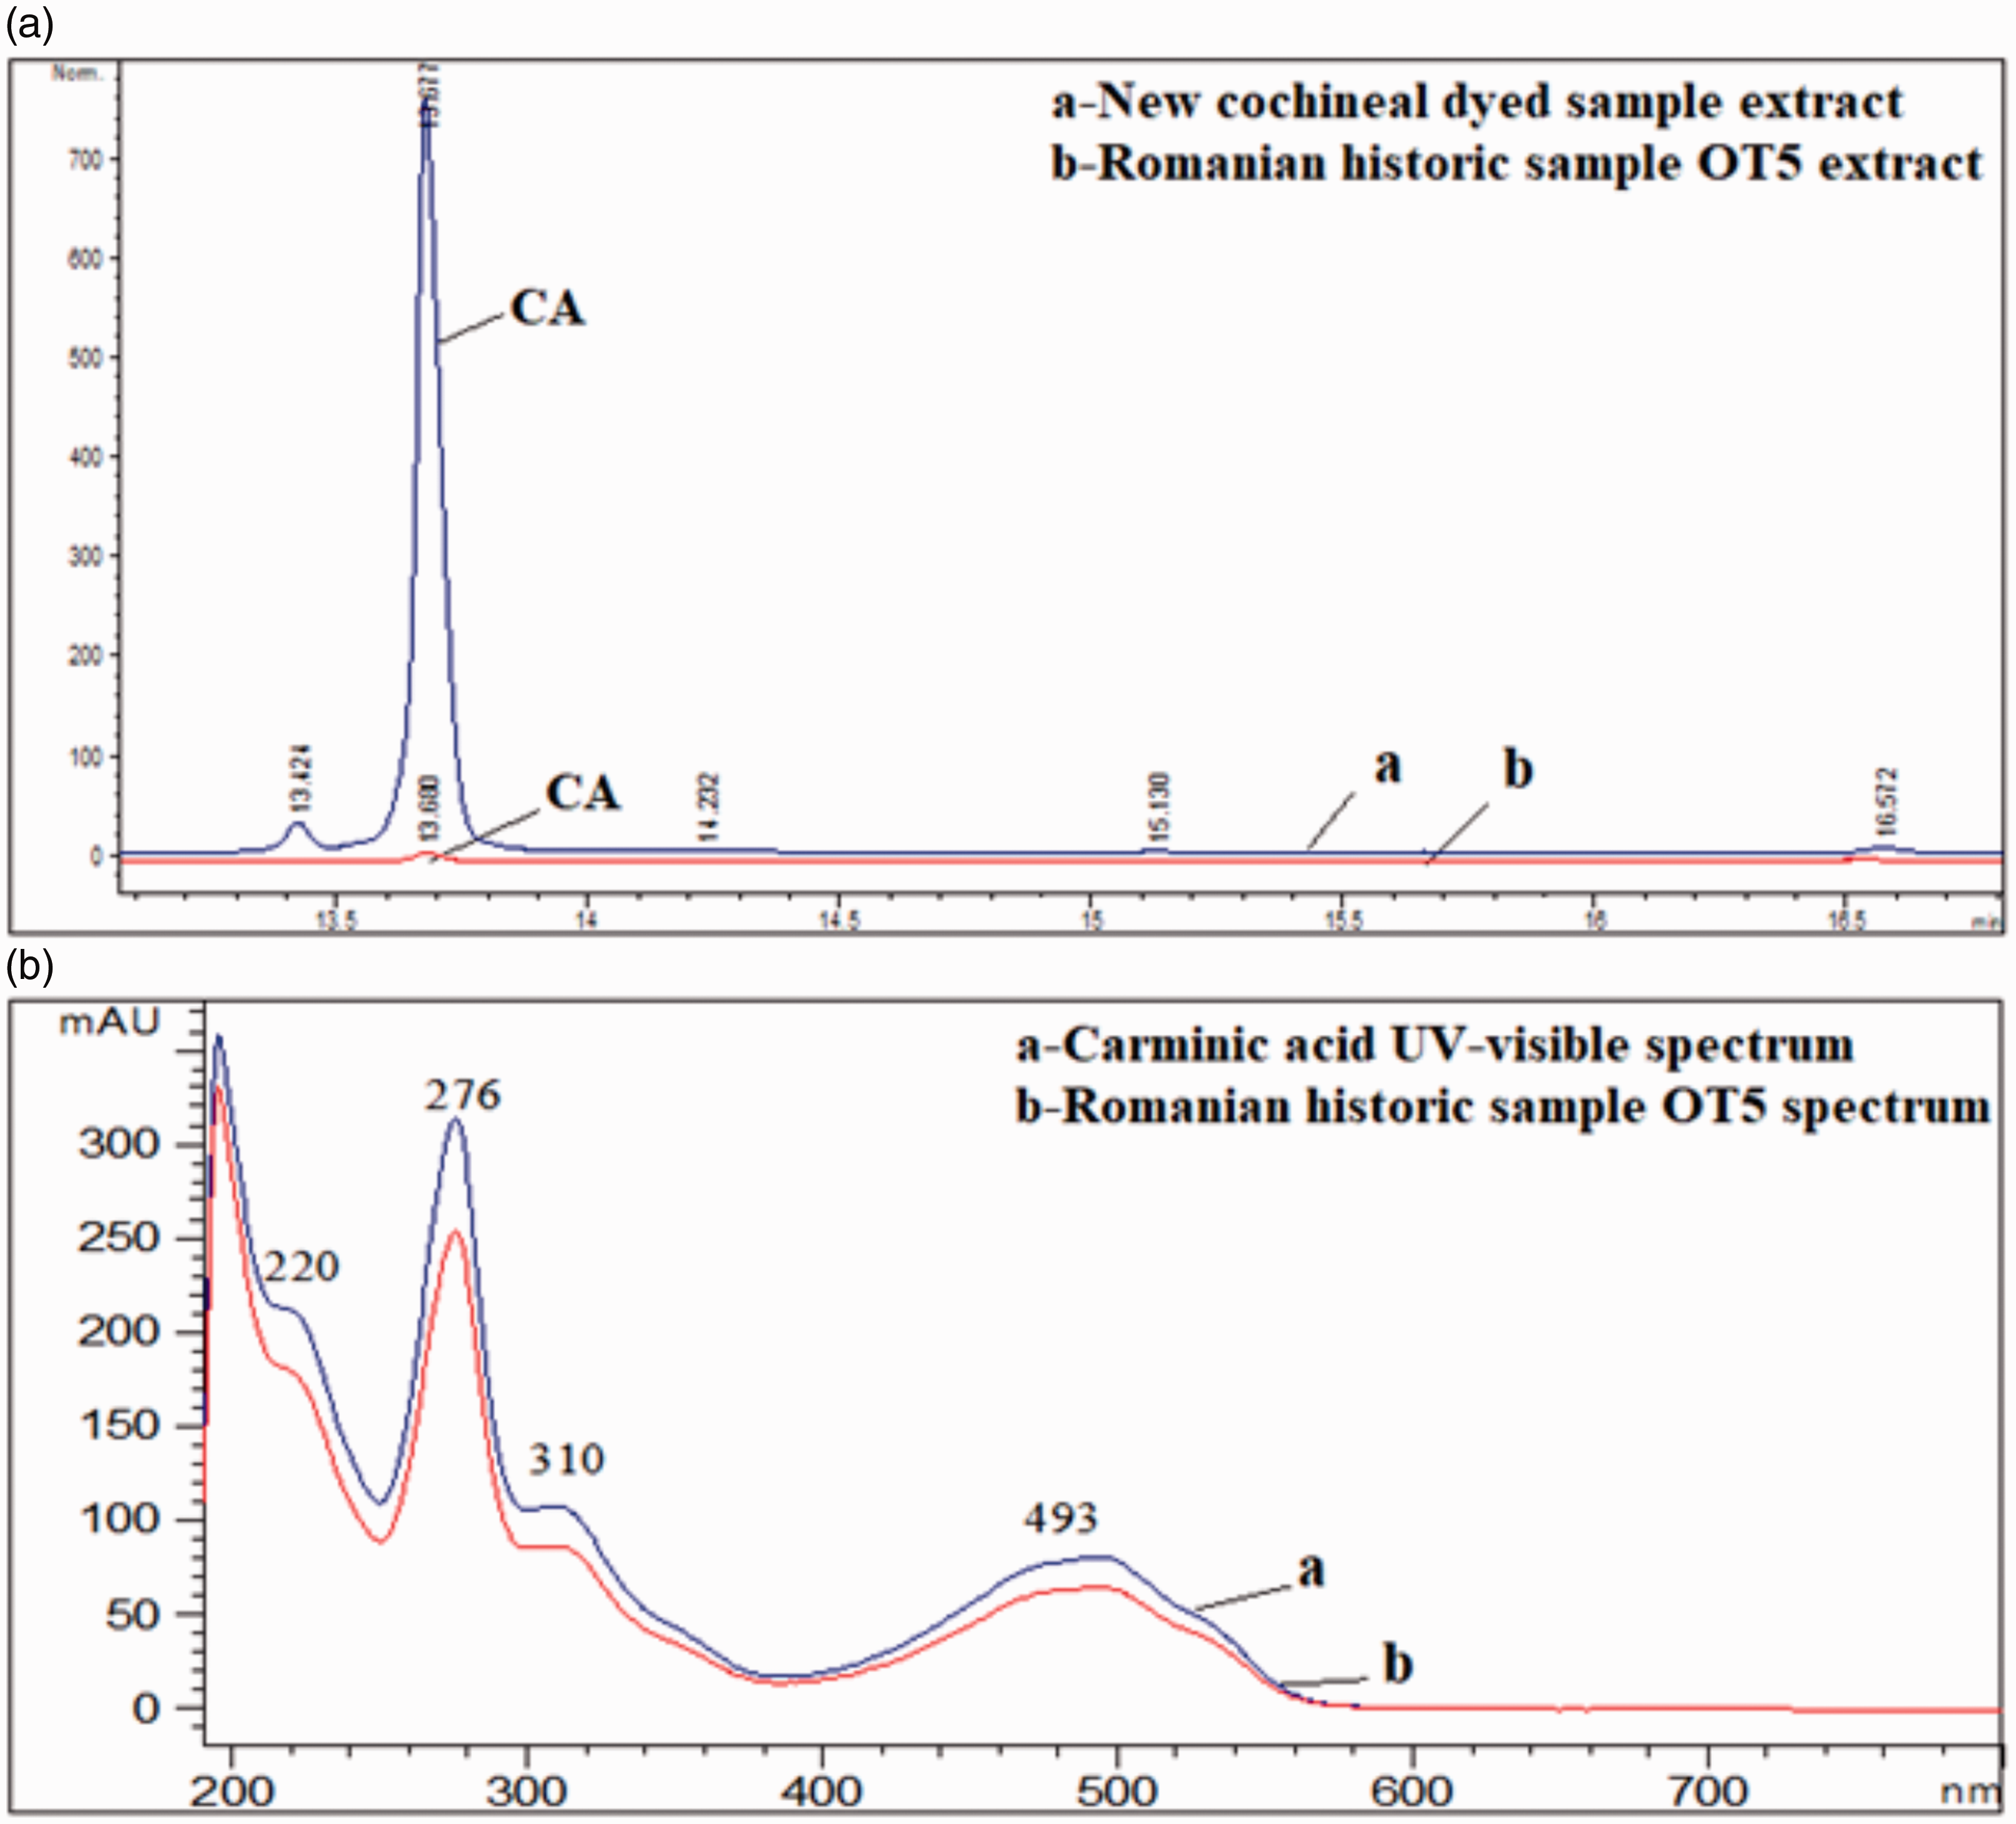
Alizarin and purpurin were recognized in sample OT7, which is an indication of using madder plant dye. Other main anthraquinone components in this plant, such as pseudopurpurin, munjistin, xanthopurpurin and rubiadin, have not been detected in the concerned sample extract.37,46–48 Similar chromatographic peaks and spectra were detected and compared between sample extract OT7 and the new madder dyed sample extract (Figure 14).
(a) Chromatogram of new madder dyed sample extract versus sample OT7 extract. (b) Ultraviolet (UV)-visible spectrum of the alizarin compound. (c) UV-visible spectrum of the purpurin compound.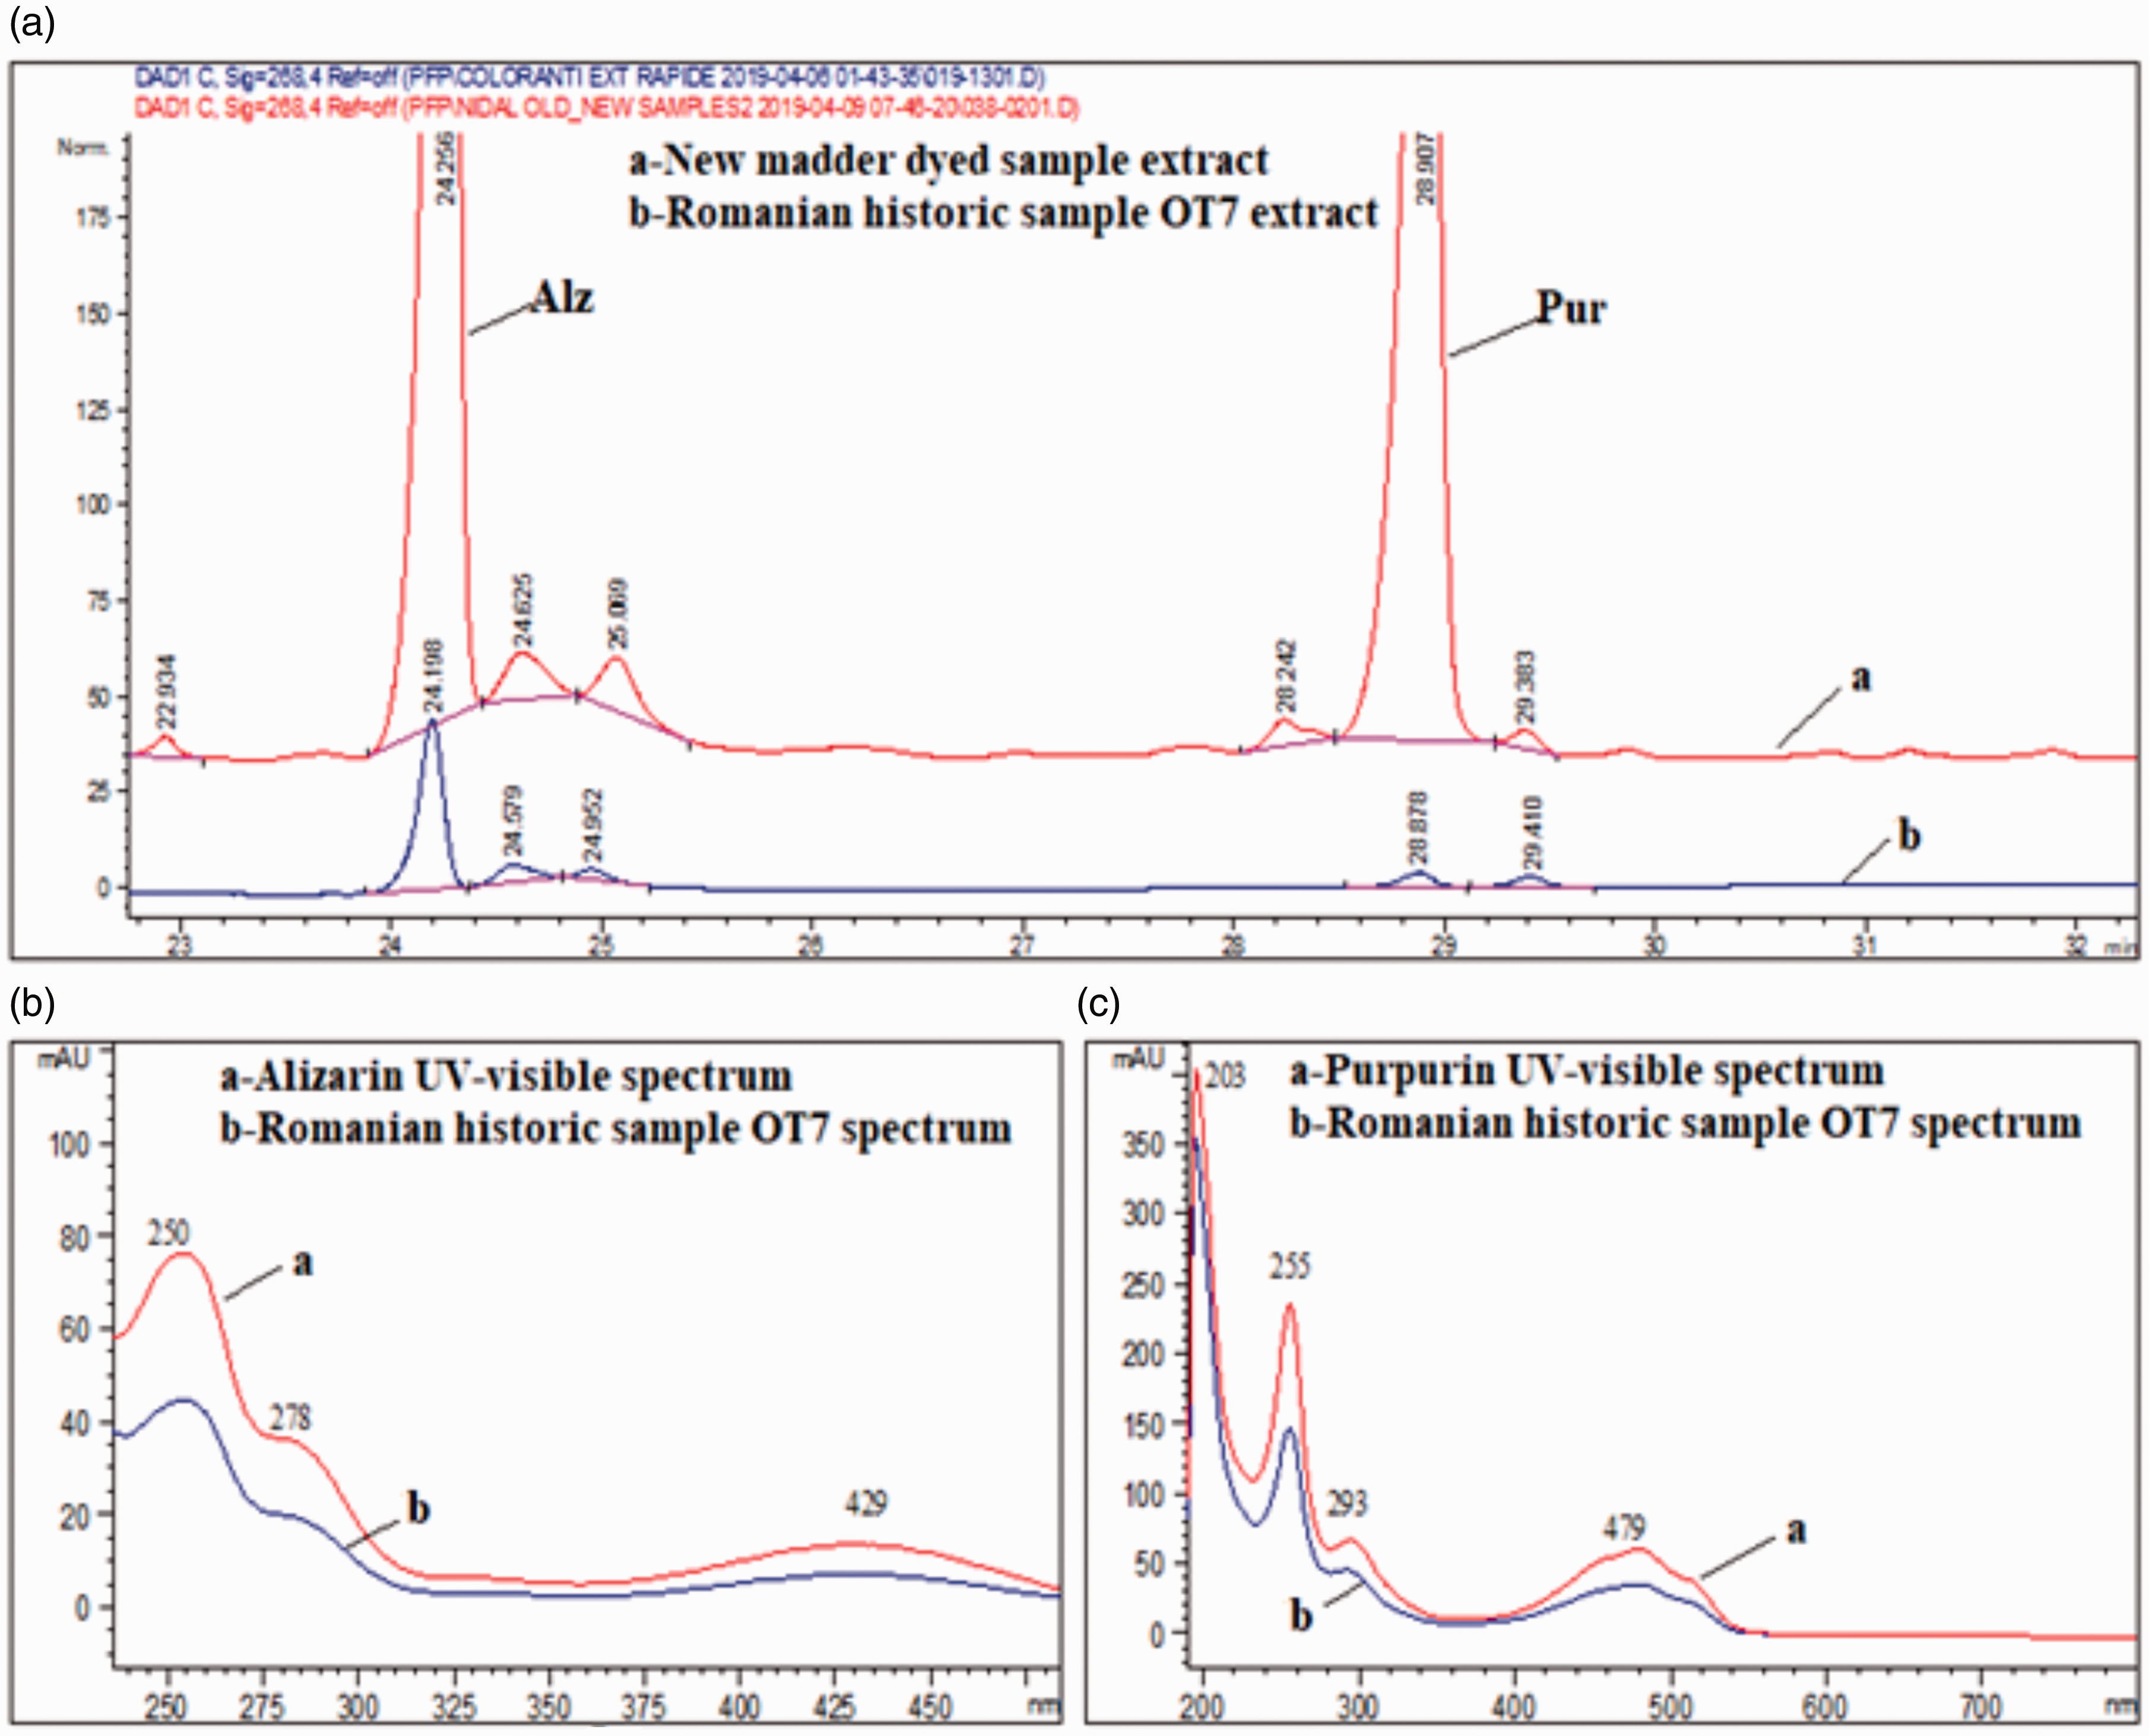
Madder is the most important red plant dyes, which originally came from India. During the period of high demand for red dyestuffs, however, its cultivation also began in Europe and the Middle East. Madder is cheaper and has less dyeing power than the scale insect dye species. There are many important plant sources for madder red dyestuffs, many of them based on the anthraquinone ring system. These dyes were obtained from the roots of different species of the Rubiaceae family. From a chemical point of view, it is remarkable that the anthraquinone structures derived from plants are only substituted on one ring, which distinguishes them from the insect-derived dyestuffs.37,49,50
As for historical sample OT8, the chromatographic peaks for the compounds separated correspond to the chromatographic extracts of lac dye solution at a retention time of 16.5 min. although the spectrum pattern and maximum peaks are very close to carminic acid and kermesic acid compounds, but could be differentiated by the difference of retention time separation (Figure 15). Lac differs in its composition from the cochineals in that its main constituents are the two laccaic acids A and B. Lac was used in India and the Far East long before its introduction in Europe in the late 18th century.
37
(a) Chromatogram of new lac dyed sample extract versus sample OT8 extract. (b) Ultraviolet (UV)-visible spectrum of the laccaic acid compound.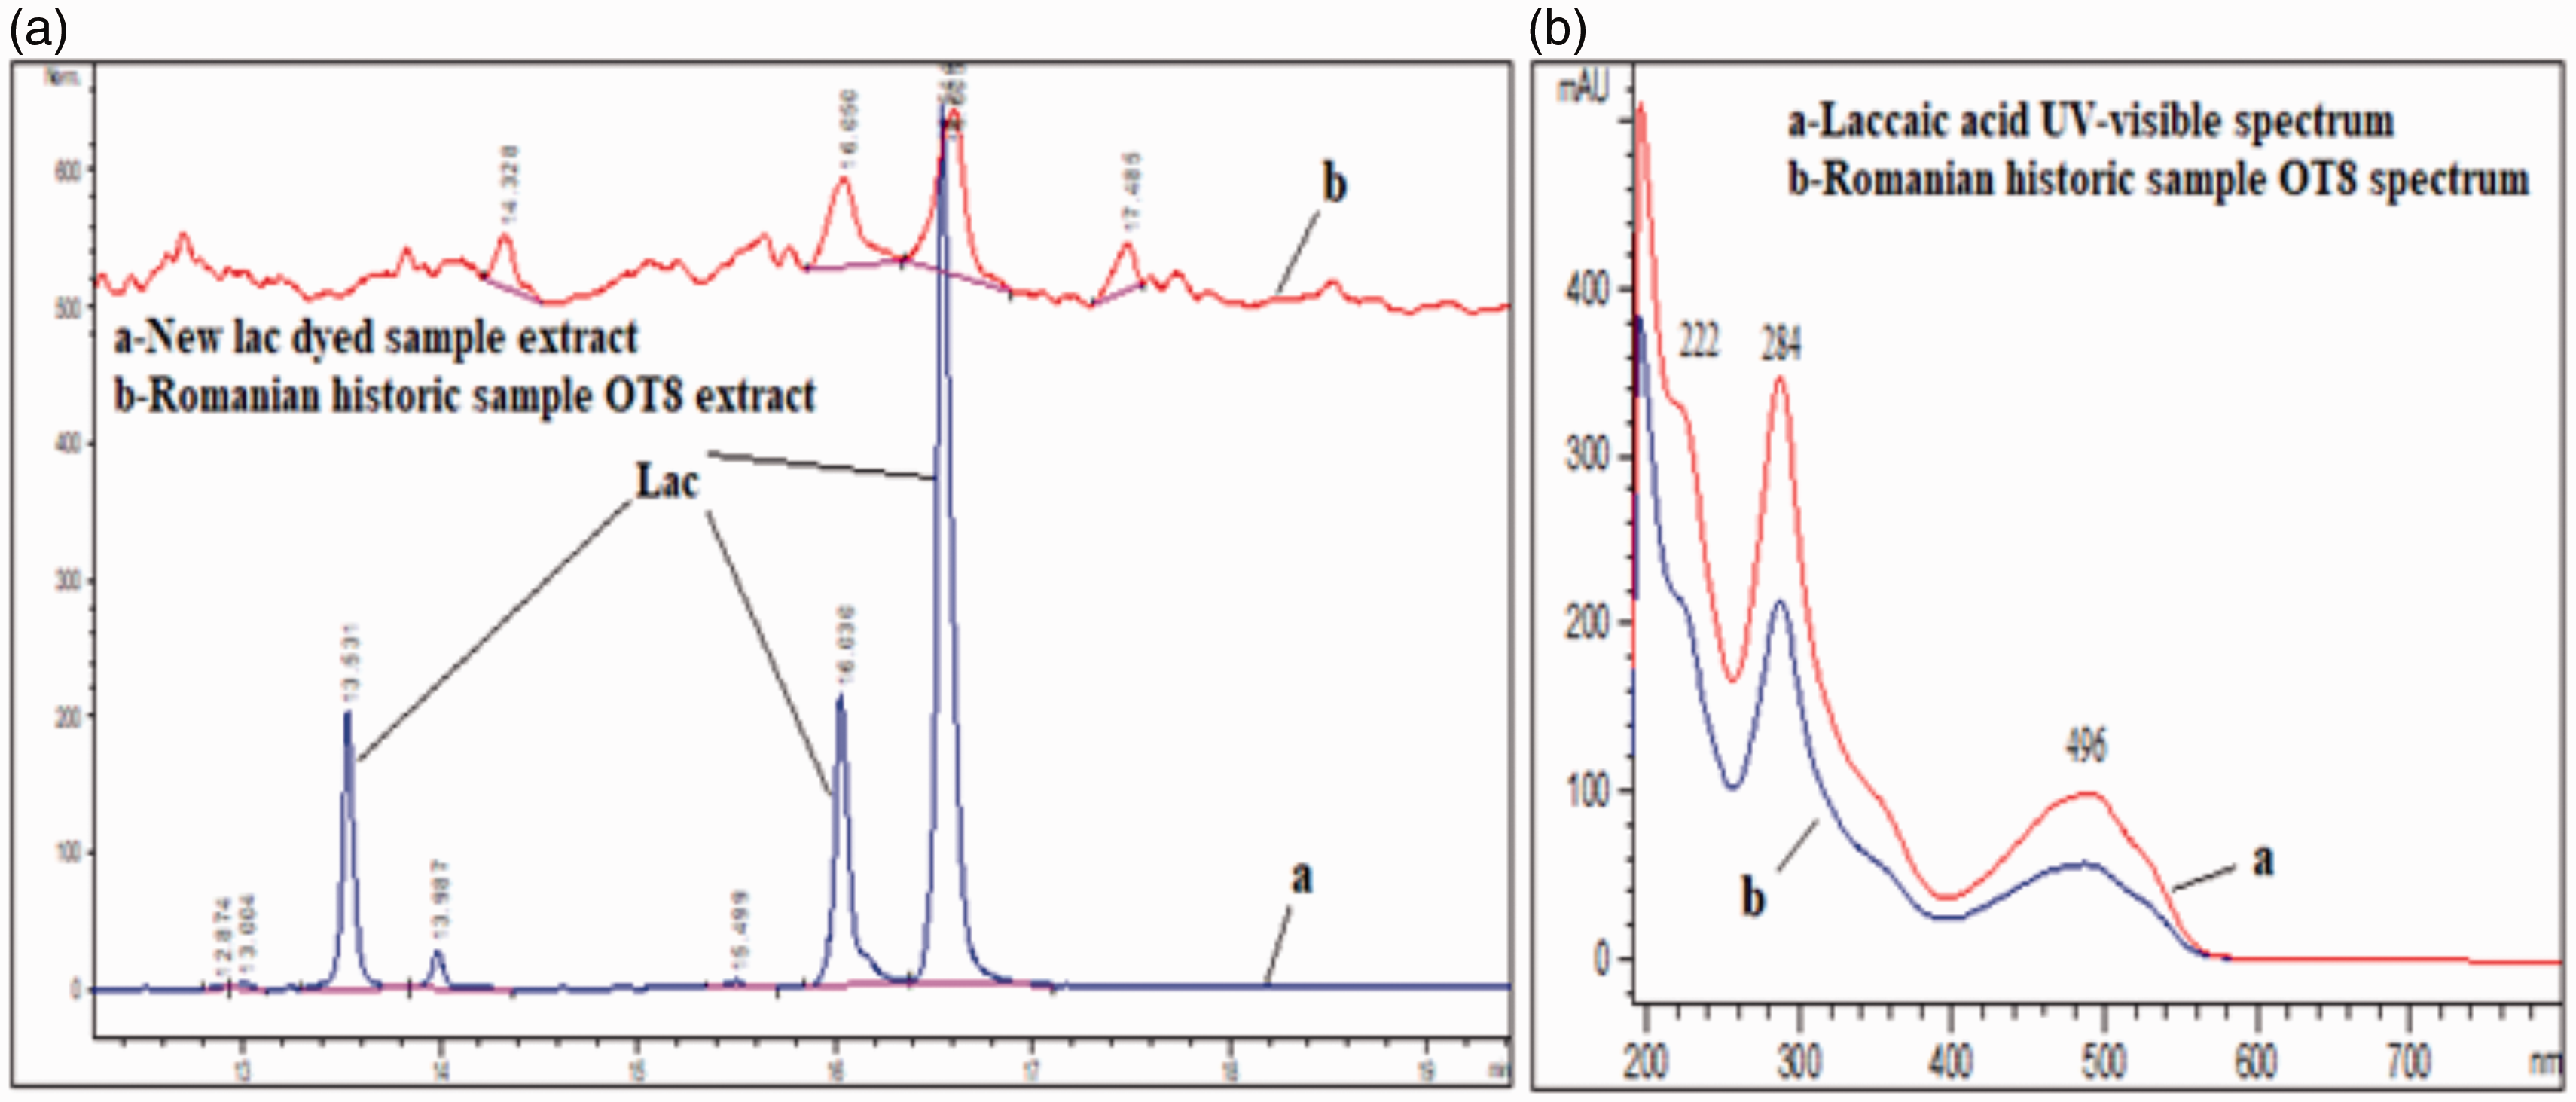
Laccaic acids A, B, C, D and E are the main coloring matters of lac dye (Kerrialacca), with the first two (A and B) being the principal components with an amount for laccaic acid A (>70%) and laccaic acid B (<20%). Except for compound D, which has the same structure as flavokermesic acid, the remaining laccaic acids have similar identical absorption spectra. It is impossible to determine the exact structure type of the laccaic acid with any mass spectrum measurement. So, due to absence of a suitable mass spectrometer tool, this study could not determine the exact isomer structure.15,37
It has been noted for all of the historical samples that there are different chromatographic peaks at retention times between 4 and 14 min with differentiation in positions and intensities for each sample within. These peaks values might be attributed to gallic or ellagic acids from a tannin source as an additive during the dyeing process. Tannins have been used both as dyes to induce dark–black hues in textiles and as dyestuff adhesives, which might explain the brownish shade of the yellow/red-based dyed fragments, taking into consideration the absence of ferrous salts as mordants, which usually impart dark hues for yellow and red colors. The second possibility is the existence of tannins within the burial environment causing unintended interaction and dark staining on the surface of the textile pieces. Ellagic tannins can be synthesized by several plants and produce staining products through decomposition from vegetal fragments present in the surrounding environment. Incidentally, tannins are believed to play the role of an organic mordant for many other dyes. The third possibility of the presence of ellagic acid indicates the use of a tannin-containing plant material either for textile dyeing or for weighting the silk.51–55
Conclusion
The preliminary investigation, analysis and results obtained using OM, SEM-EDX and ATR-FTIR were helpful in limiting the possibilities of dyes recognized using HPLC-DAD. The multi-analysis approach proved to be very efficient in the identification of the textile components under scrutiny.
This study is very important because it allows highlighting the type of natural silk, traditional colorants and metallic threads often used in the manufacturing technology for the textiles used for producing fine clothing used by high-ranking individuals, as well as the period and area of use.
The identification of the luxurious silk as fabric, weaved with fine gilt or silver strips and dyed with costly precious dyestuffs, such as cochineal and kermes, indicates that these samples were part of garments with a highly prized status symbol. Hence, it can be assumed that they were made for part of ceremonial or decorative purposes in religious practice, given that they were found in monasteries.
Both the samples of natural silk used as reference, and the historical ones, on the basis of the chemical analyses carried out by EDX and FTIR, as well as the morphological data obtained from OM and SEM, reveal similar characteristics, but with difference conservation states, with the historical textiles witnessing processes of deterioration and degradation, which lead to high fragility under the influence of the cryptoclimate factors (microbiological, hydric and chemical).
Footnotes
Acknowledgements
Warmest thanks to Dr Carmen Marian from the National Museum Complex “Moldova” in Iaşi for donating the historical textile samples, to Dr Irina Petroviciu from the National Museum of Romanian History, Bucharest, for donating dyed reference samples and to Mr Marius Niculaua from the Research Institute for Agriculture and Environment for his profound technical help and advice.
Declaration of conflicting interests
The authors declared no potential conflicts of interest with respect to the research, authorship, and/or publication of this article.
Funding
The authors received no financial support for the research, authorship and/or publication of this article.