
Abstract
The small-size microstructure models of the 3D needled waste cotton fiber/epoxy composites (3DNWCFCs) were brought out to predict their key vibration parameters (natural frequency and mode shapes) with the finite element analysis method. Six kinds of 3DNWCFCs with different parameters were prepared and tested by the experimental modal analysis method to verify the accuracy of the prediction of the natural frequencies and mode shapes with the finite element method. The effects of the fiber volume content and needling density of the composites on the modal behavior were investigated. The natural frequency of the cantilever beams of the composites increased with the increase of the fiber volume content and increased at first then decreased with the increasing needling density. The effect of needling density on the vibration properties of the composite depended on the degree of damage and entanglement of Z-direction fibers. The comparative analysis of the finite element analysis and the experimental results showed that the small-size microstructure models of the 3DNWCFCs were effective to predict their vibration parameters. Therefore, the small-size finite element models can be used to predict the modal properties of the staple fiber reinforced composites effectively with less time and lower economic costs.
According to the statistics, over 100 million tons of waste textiles are produced around the world. 1 Most waste textiles are disposed of by incineration and landfill, which leads to air pollution, soil contamination and water pollution.2–4 With the rising concern on the environment and sustainable development, it is essential to look for a more recyclable approach to deal with the waste in the textile industry.
Natural fiber reinforced composites have the advantages of easy processing, high specific strength, low price and being environmentally friendly, and are widely used in fields of automobiles, furniture and architecture, amongst other fields.5–8 Waste textiles and fibers with wide application prospects can be used in the field of composite materials to replace some part of the composite products.9–11 Our previous studies have shown that the waste cotton fiber reinforced composites have good mechanical properties. 9 The mechanical properties of the waste cotton fiber reinforced composites we made are better than that of the best particle board on the market. Therefore, the composite can be used as load-bearing structures. However, the vibration modal performance of the composite needs to be further studied for practical application as a structural part, as the vibration modal performance has a very important influence on the service life of composites. 12 Natural frequency and mode shapes are two of the modal parameters that must be understood to avoid unnecessary losses caused by resonance factors in practical application.13–15
The experimental modal test method, the finite element analysis (FEA) method and the calculation analytical method are three main modal detection methods. 16 Wang et al. 17 used a new high order shear deformation theory to analyze the modal performance of a functionally graded graphene nanoplatelet reinforced composite. The modified Halpin–Tsai micromechanics model was used to evaluate the effective Young’s modulus of the composite. This calculation method was improved on the basis of predecessors, but it was complicated and time-consuming. Rajkumar et al. 18 studied the influence of boundary conditions and aspect ratio on modal properties of jute and ramie fiber composites with the FEA method. The large number of simulated samples could well reflect the differences in modal performance under different aspect ratios and boundary conditions, but there was insufficient experimental validation. Moreover, a lot of studies used the FEA method to obtain the modal characteristics and chose the experimental modal test method to verify the accuracy of the simulation.19–23 It has been proved that the FEA method is an effective method to predict the modal properties of the continuous fiber reinforced composites with an appropriate finite element model.
Recently, large numbers of researches were reported to analyze the mechanical properties of three-dimensional (3D) needled felts or composites by building a model with the FEA method. Song et al. 24 proposed a 3D geometric closed model, an open model and a cut model of carbon fiber needled felts to investigate the full-scale 3D geometric model. Alghamdi et al. 25 made a 3D needled carbon–carbon composite model. The carbon fiber model, the clutter model of short-chopped fiber felts and the homogeneous small model of composite were each established. Saberi et al. 26 used the ABAQUS software to simulate the needle punching process of geotextiles with different weights in two tests of CBR (ASTM D6241) and pin (ASTM D4833). In addition, a lot of studies set 3D models to predict the modal performance of the composites. Ma et al. 27 established a 3D model of carbon fiber composite auxetic double-arrow corrugated sandwich panels to predict its modal properties. Orlowska et al. 28 used FEA modeling to obtain the results of numerical simulations conducted for a five-layered glass–epoxy composite beam. The natural frequencies in connection with three initial bending modes were analyzed for different prestressing force levels and for different fiber volume content (FVC) compared with the experimental modal analysis (EMA) results. Many studies as mentioned above set up 3D models of the needled felts or composites with different simplified methods. However, few studies have been carried out to predict the modal properties of the needled staple fiber reinforced composites by the FEA method.
The purpose of this study is to predict the modal properties of the 3D needled waste cotton fiber/epoxy composites (3DNWCFCs) by establishing a model related to needling density (ND) and FVC. In the Materials and tests section, six kinds of 3DNWCFCs with different parameters were prepared and tested by the EMA method to verify the accuracy of the prediction of the natural frequencies and mode shapes with the FEA method. In the Finite element prediction and modeling section, the small-size microstructure models of 3DNWCFCs were established to predict their modal performance. In the Results and discussion section, the study expounded the mechanism of the effect of ND and FVC on the modal performance of 3DNWCFCs with the experimental and the FEA results.
Materials and tests
Materials
Waste jeans as the reinforced materials were supplied by the Guangzhou Xinyang Textile Co., Ltd, China. The JC-02A epoxy resin as the matrix was supplied by the Changshu Jaffa Chemical Co., Ltd, China.
Manufacturing process of the 3DNWCFCs
Figure 1 shows the main production process of the 3DNWCFCs. Waste jeans were transformed into waste cotton fibers (length: 10–25 mm
9
; diameter: 15–25 µm
29
) by the cloth opener apparatus (HY2-15). Afterwards, the waste cotton fibers were combed into original fiber webs, which would be laid layer upon layer by the web-forming machine (WL-GP-B-800) to form fiber webs with certain thickness, strength and uniformity according to the FVCs. Then the fiber webs were transformed into the needling machine (WL-GZ-A-800), and the needles on the needle board punched the fibers from the surface of the webs into the Z-direction. After many times of needle punching, a large number of in-plane fibers were introduced into the Z-direction, producing thousands of vertical fiber clusters, making the fibers in the fiber network intertwine with each other, forming a 3D needled felt with certain strength both in the plane and in the thickness direction. The needled felts were then made into the composites through the vacuum-assisted resin transfer molding process. The curing process of the composites was 90℃ for 2 h, 110℃ for 1 h, and 135℃ for 6 h. Finally, the needled felt reinforced composites were cut for the modal test specimens with the size of 250 × 25 × 4 mm
3
according to the standard ASTM E756-05 by the cutting machine (QG-4 A).
Technological process of 3D needled waste cotton fiber/epoxy composites.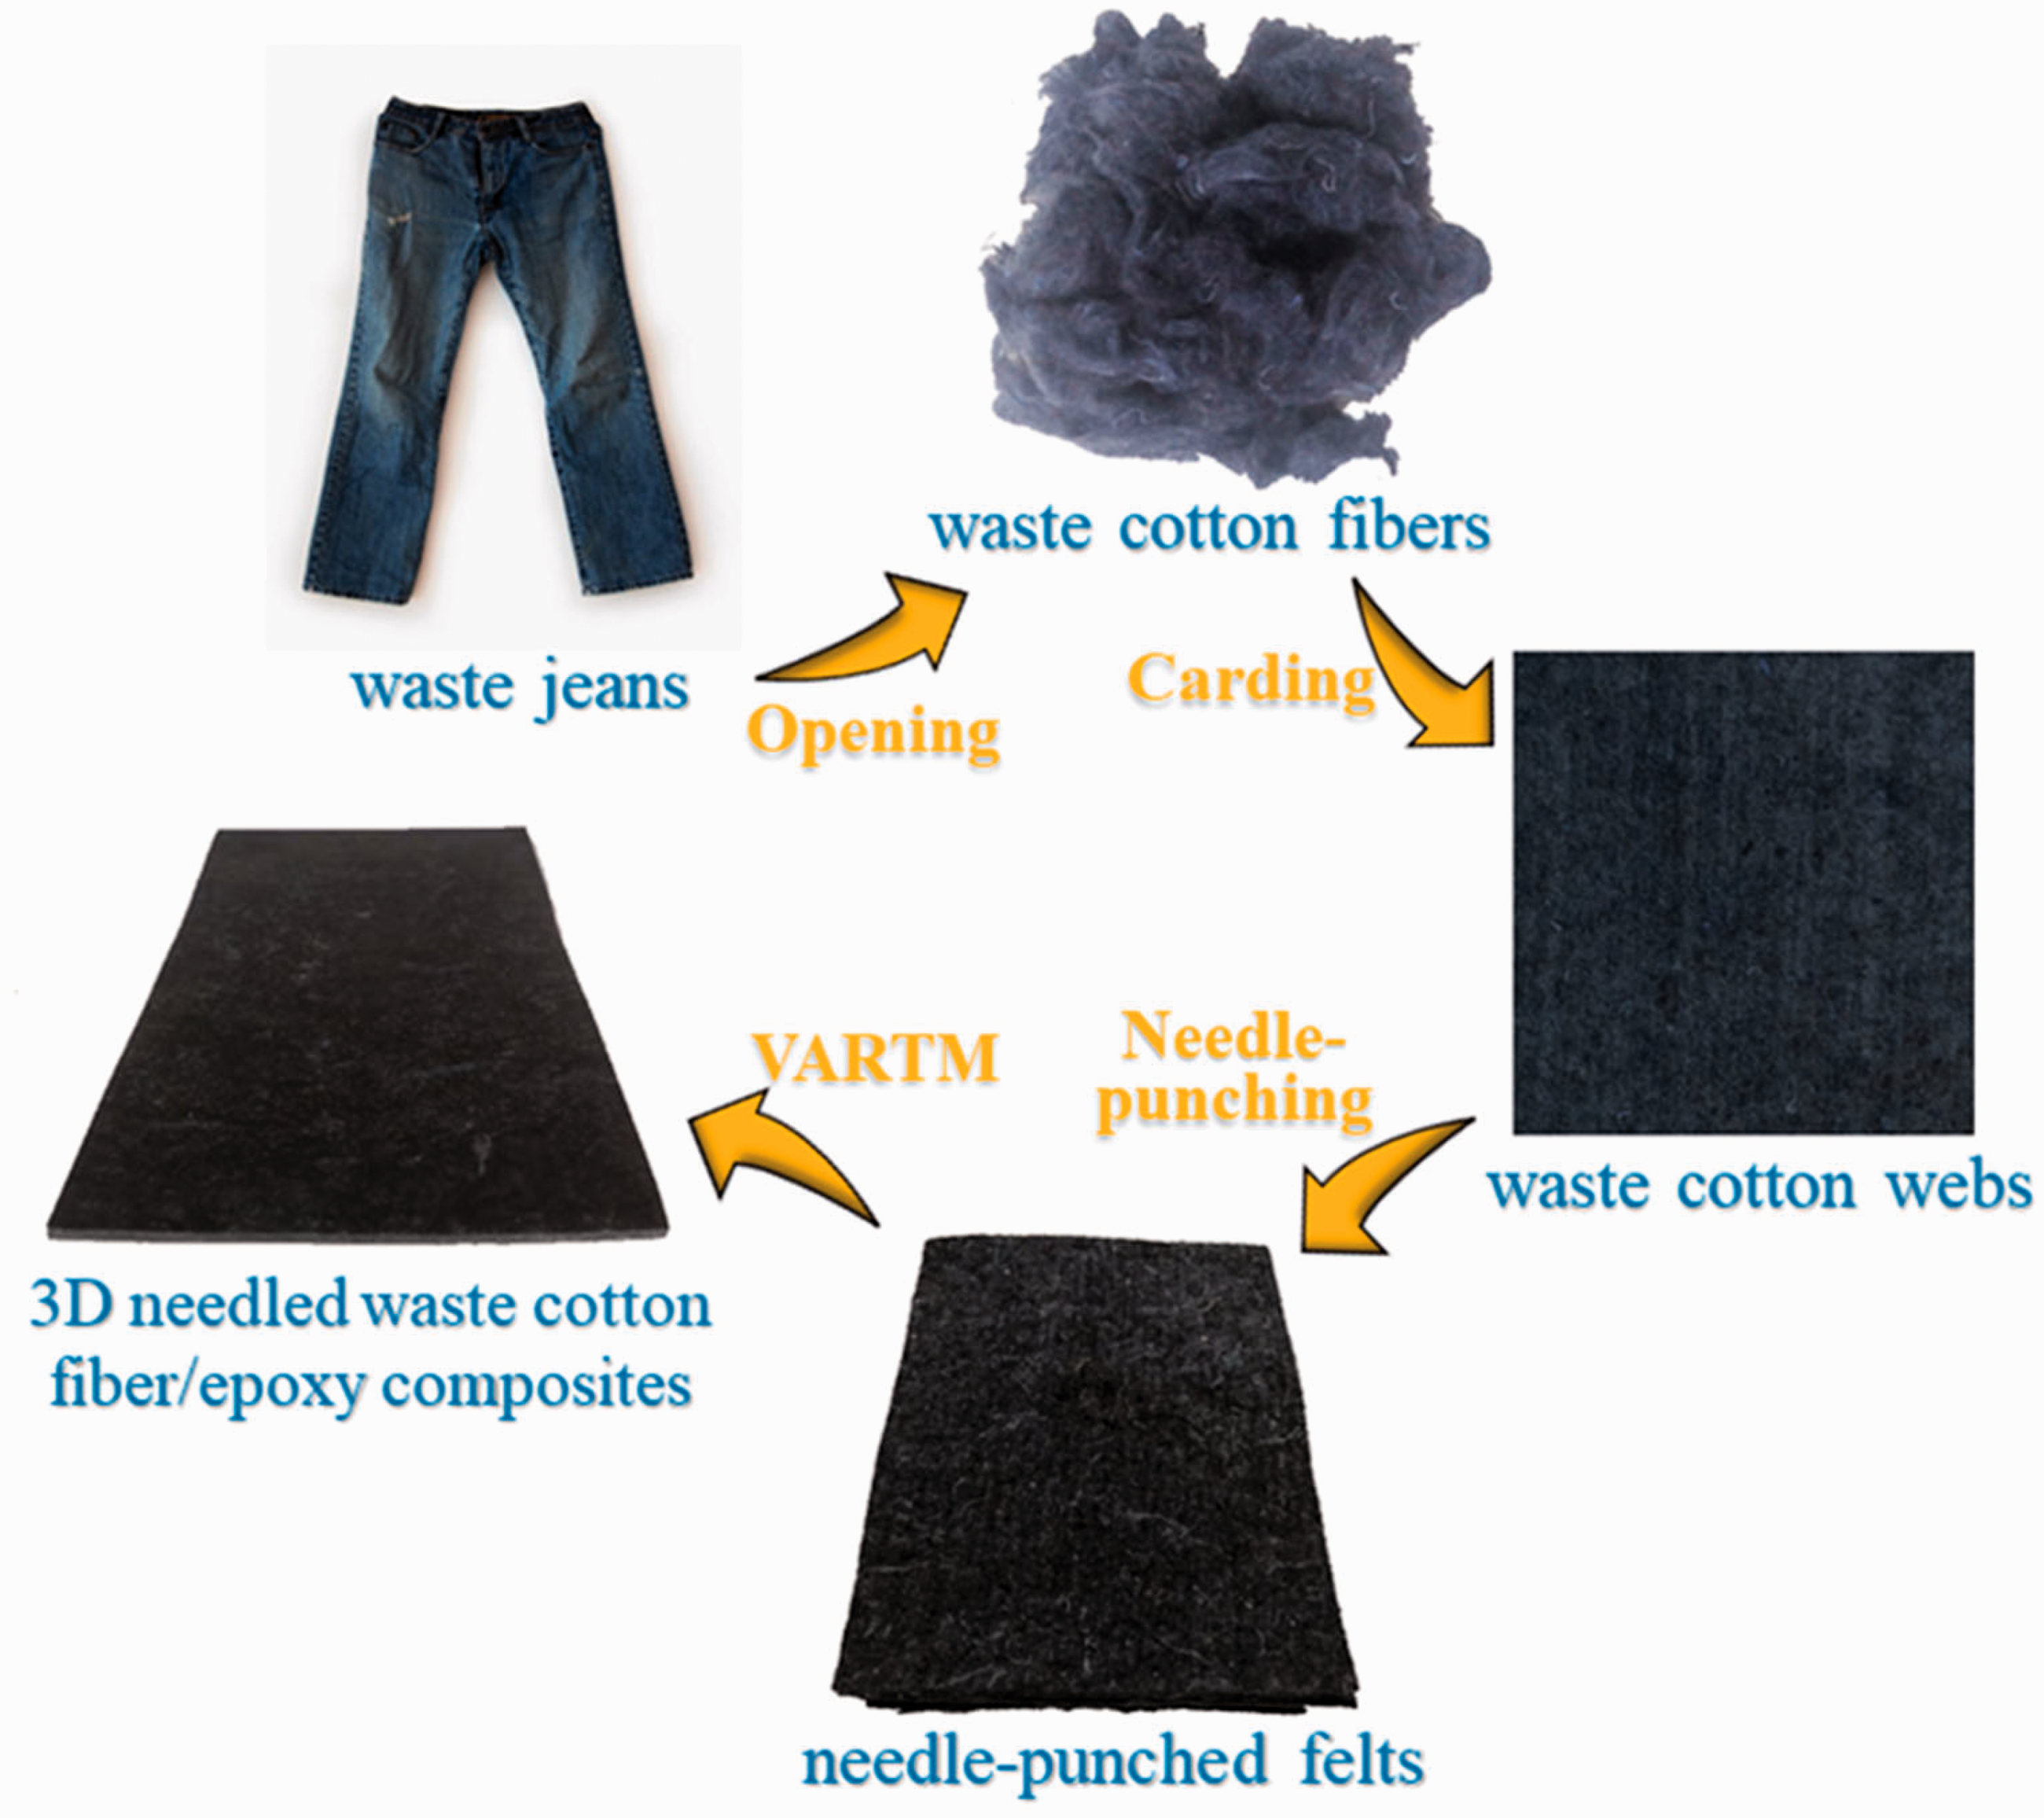
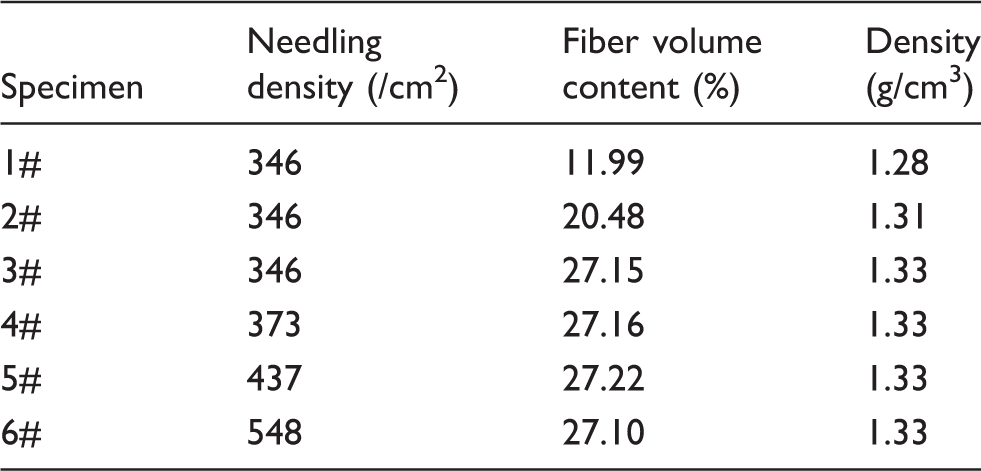
Process parameters of six kinds of 3D needled waste cotton fiber/epoxy composites
The modal test
This study measured the modal characteristics by the material modal damping system (INV3062T0) according to the standard ASTM E756-05. Figure 2 shows the system diagram of modal testing and modal analysis for the composites. The cantilever beam was divided into 10 points on average. Afterwards, one end of the composite beam was tightly clamped by a fixture, while the other hung freely in the air, forming a cantilever beam. An impact hammer was used to tap those 10 points on the specimen successively, and a non-contacting sonic accelerometer transducer was used to detect the response.
Operational process of experimental modal analysis for vibration.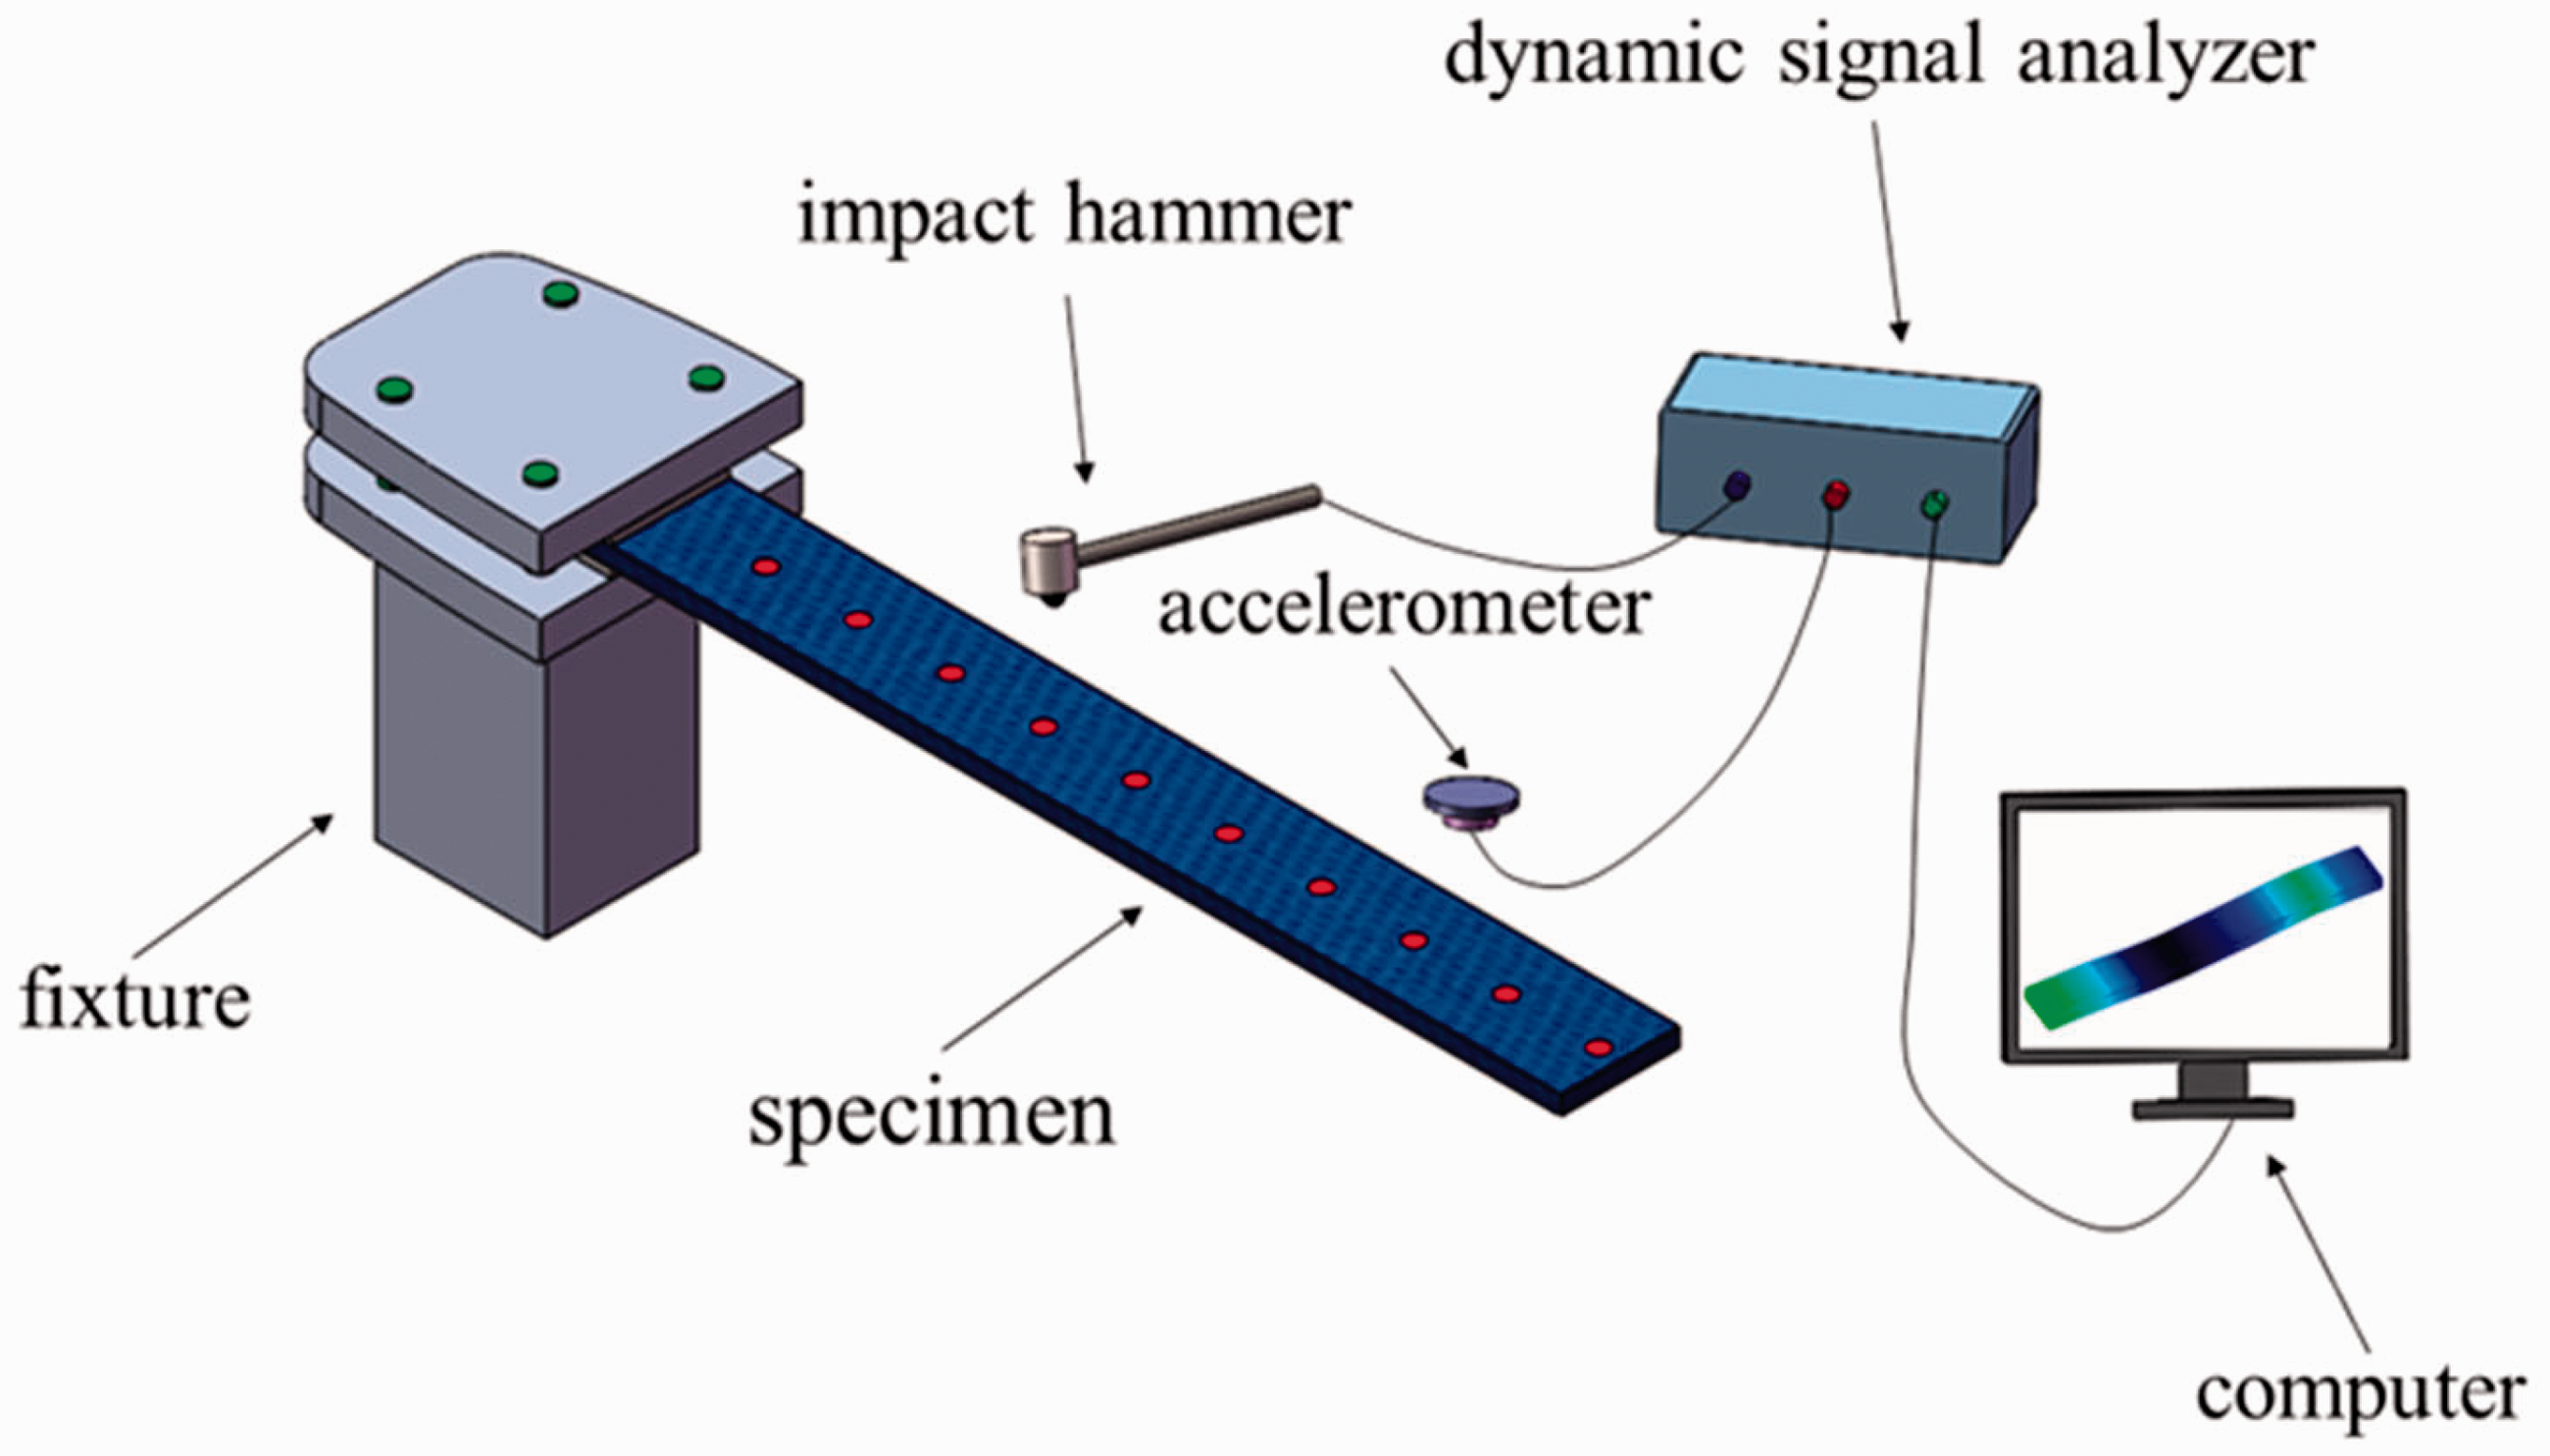
The mode shapes could be reestablished based on the signs and magnitudes of the imaginary part of each measured natural frequency. Through the modal software (DASP modal analysis system) analysis and calculation, the key parameters (natural frequency and mode shapes) of the composite beam were obtained by establishing the frequency response function stating and computing.
Morphology characterization and mechanical testing
A light microscope (VHX-500) and a scanning electron microscope (Quanta-450-FEG+X-MAX50) were employed to observe the surface structure of the WCFNFs.
The tensile modulus of waste cotton fibers was tested on a monofilament tensile testing machine (YG001B) following ASTM D1445.
Finite element prediction and modeling
Figure 3 shows the WCFNFs with six different parameters. The WCFNFs can be divided into non-needle-punched areas and needle-punched areas. The non-needle-punched areas are composed of random fibers, and the needle-punched areas are composed of Z-direction fibers. The diameters of needle-punched holes of 1#, 2# and 3# WCFNFs are approximately 461.00 µm, 443.67 µm and 432.67 µm. The diameters of needle-punched holes of 4#, 5# and 6# WCFNFs are about 523.33 µm, 649.67 µm and 719.67 µm. The diameters of needle-punched holes largen as the ND increases.
Photomicrographs of needle-punched holes on the surface of the waste cotton fiber needled felts: (a) 1#; (b) 2#; (c) 3#; (d) 4#; (e) 5#; (f) 6#.
According to the actual appearance of the needle-punched felt structure, the equivalent small-size models were set, which consist of Z-direction fibers, random fibers and epoxy resin. The setting of the size of the needle-punched holes varied according to the ND.
Methodologies of creating the equivalent small-size model
Many studies establish full-scale models to predict the vibration characteristics of the specimens.16,30The full-scale model of this study needs a large amount of calculation time with the finite element software. To simplify the calculation, this study created a small-size model to predict the natural frequencies and mode shapes of the 3DNWCFCs.
In the experiment, one end of the cantilever beam was fixed and the length of the fixed place was 50 mm. The remaining 200 mm was a valid test range. Therefore, the dimensions of the specimen in FEA can be simplified as the size of 200 × 25 × 4 mm3. Many studies have shown that the size of a material affected the value of the natural frequency.31,32 The model can be further simplified by scaling down the length, width and thickness of the model at the same proportion. When the size of the same specimen decreased, the natural frequencies of the 3DNWCFCs increased. The law of change is as follows31,32

If the length, width and thickness of the specimen are scaled down at the ratio of 50 times, the natural frequency increases 50 times. The small-size model with the size of 4 × 0.5 × 0.08 mm 3 was chosen to predict the natural frequencies of the specimen.


Needle-punched number of the area of 4 × 0.5 mm2 of the small-size model and the diameter and number of needle-punched holes
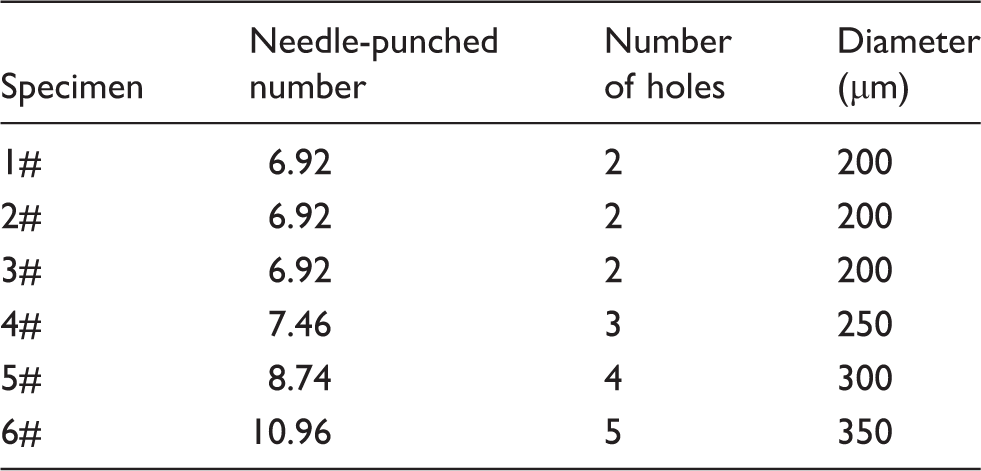
In order to simplify the models and the calculation, two needle-punched holes were placed on the small-size models of 1#, 2# and 3# specimens of 3DNWCFCs. The diameters of 1#, 2# and 3# needle-punched holes are 200 µm. Three, four and five needle-punched holes were placed on the small-size models of 4#, 5# and 6#, respectively. The diameters of needle-punched holes of 4#, 5# and 6# small-size models are 250 µm, 300 µm and 350 µm, respectively, shown in Figure 4. The FVC of the small-size model was 3.01%.
Four kinds of small-size models of 3D needled waste cotton fiber/epoxy composites: (a) 1#, 2# and 3#; (b) 4#; (c) 5#; (d) 6#.
Geometrical model
The formation of random fibers
Figure 5 shows the growing process of random fibers. The specific steps are as follows:
① In the Cartesian coordinate system (O-XYZ), generate an ith straight fiber that is parallel to the axis OZ, as is shown in Figure 5(a). The start of the fiber locates randomly in the plane of X-O-Y. The length and diameter of the fibers are randomly controlled in the range of 10–25 mm and 15–25 µm, respectively, with the Mersenne Twister
33
algorithm. ② Rotate the fiber along the axes of OX, OY, OZ with a list of angles ③ Calculate the minimum distance dj between the straight line of the current fiber and the line of all former fibers. Modeling process of the random fibers: (a) initial state of one random fiber; (b) state of the random fiber after rotation; (c) distance between the two fibers (dj>ri + rj); (d) distance between the two fibers (dj≪ri + rj); (e) generated random fibers.
If:
where rj is the radius of the jth fiber; ri is the radius of the current ith fiber; j ranges from 1 to
Else: Calculate the distance of three points of the current fiber to the former fibers, as is shown in Figure 5(d).
If:
where
Else: return to step 1. Record the iteration and number m.
④ If
The formation of Z-direction fibers
Figure 6 shows the formation of the Z-direction fibers. The specific steps are as follows:
Modeling process of the Z-direction fibers: (a) area for growing Z-direction fibers; (b) generated Z-direction fibers.
① Choose r1 (r1 = 100, 125, 150, 175 µm) as the inner radius of the needle-punched hole. Fibers were generated in the range of
② The fibers are parallel to the axis of OZ around one needle-punched hole of the Z-direction fibers with the Mersenne Twister 33 algorithm. The Z-direction fibers are shown in Figure 6(b).
Material model

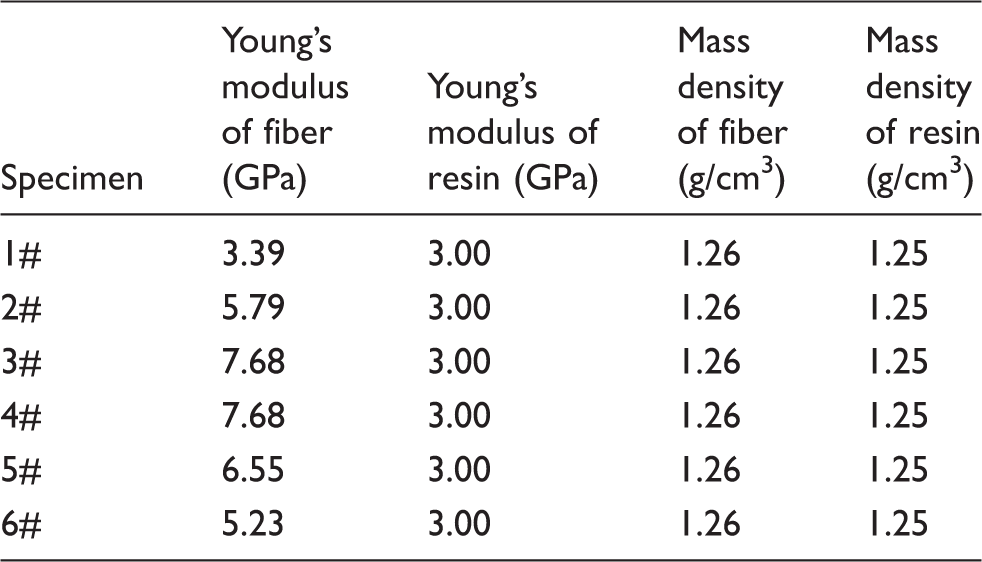
Properties of the materials
On the one hand, the increasing ND causes large numbers of in-plane fibers transferred to the Z-direction. On the other hand, the increasing ND results in more fiber damage. When the FVC is constant, more and more fibers are damaged by needles due to the rising NDs.
35
The NDs of 5# and 6# 3DNWCFCs led to a lot of fiber damage. The fiber damage was the source of the decreasing modulus of the composites. Therefore, the Young’s modulus of the fibers in the 5# and 6# specimens will decrease by changing the Young’s modulus of the waste cotton fiber. Compared with the 4# specimen of the 3DNWCFCs, the Young’s modulus of 5# and 6# small-size models can be scaled down with the following equation

Properties of the six specimens
Results and discussions
Effect of FVC
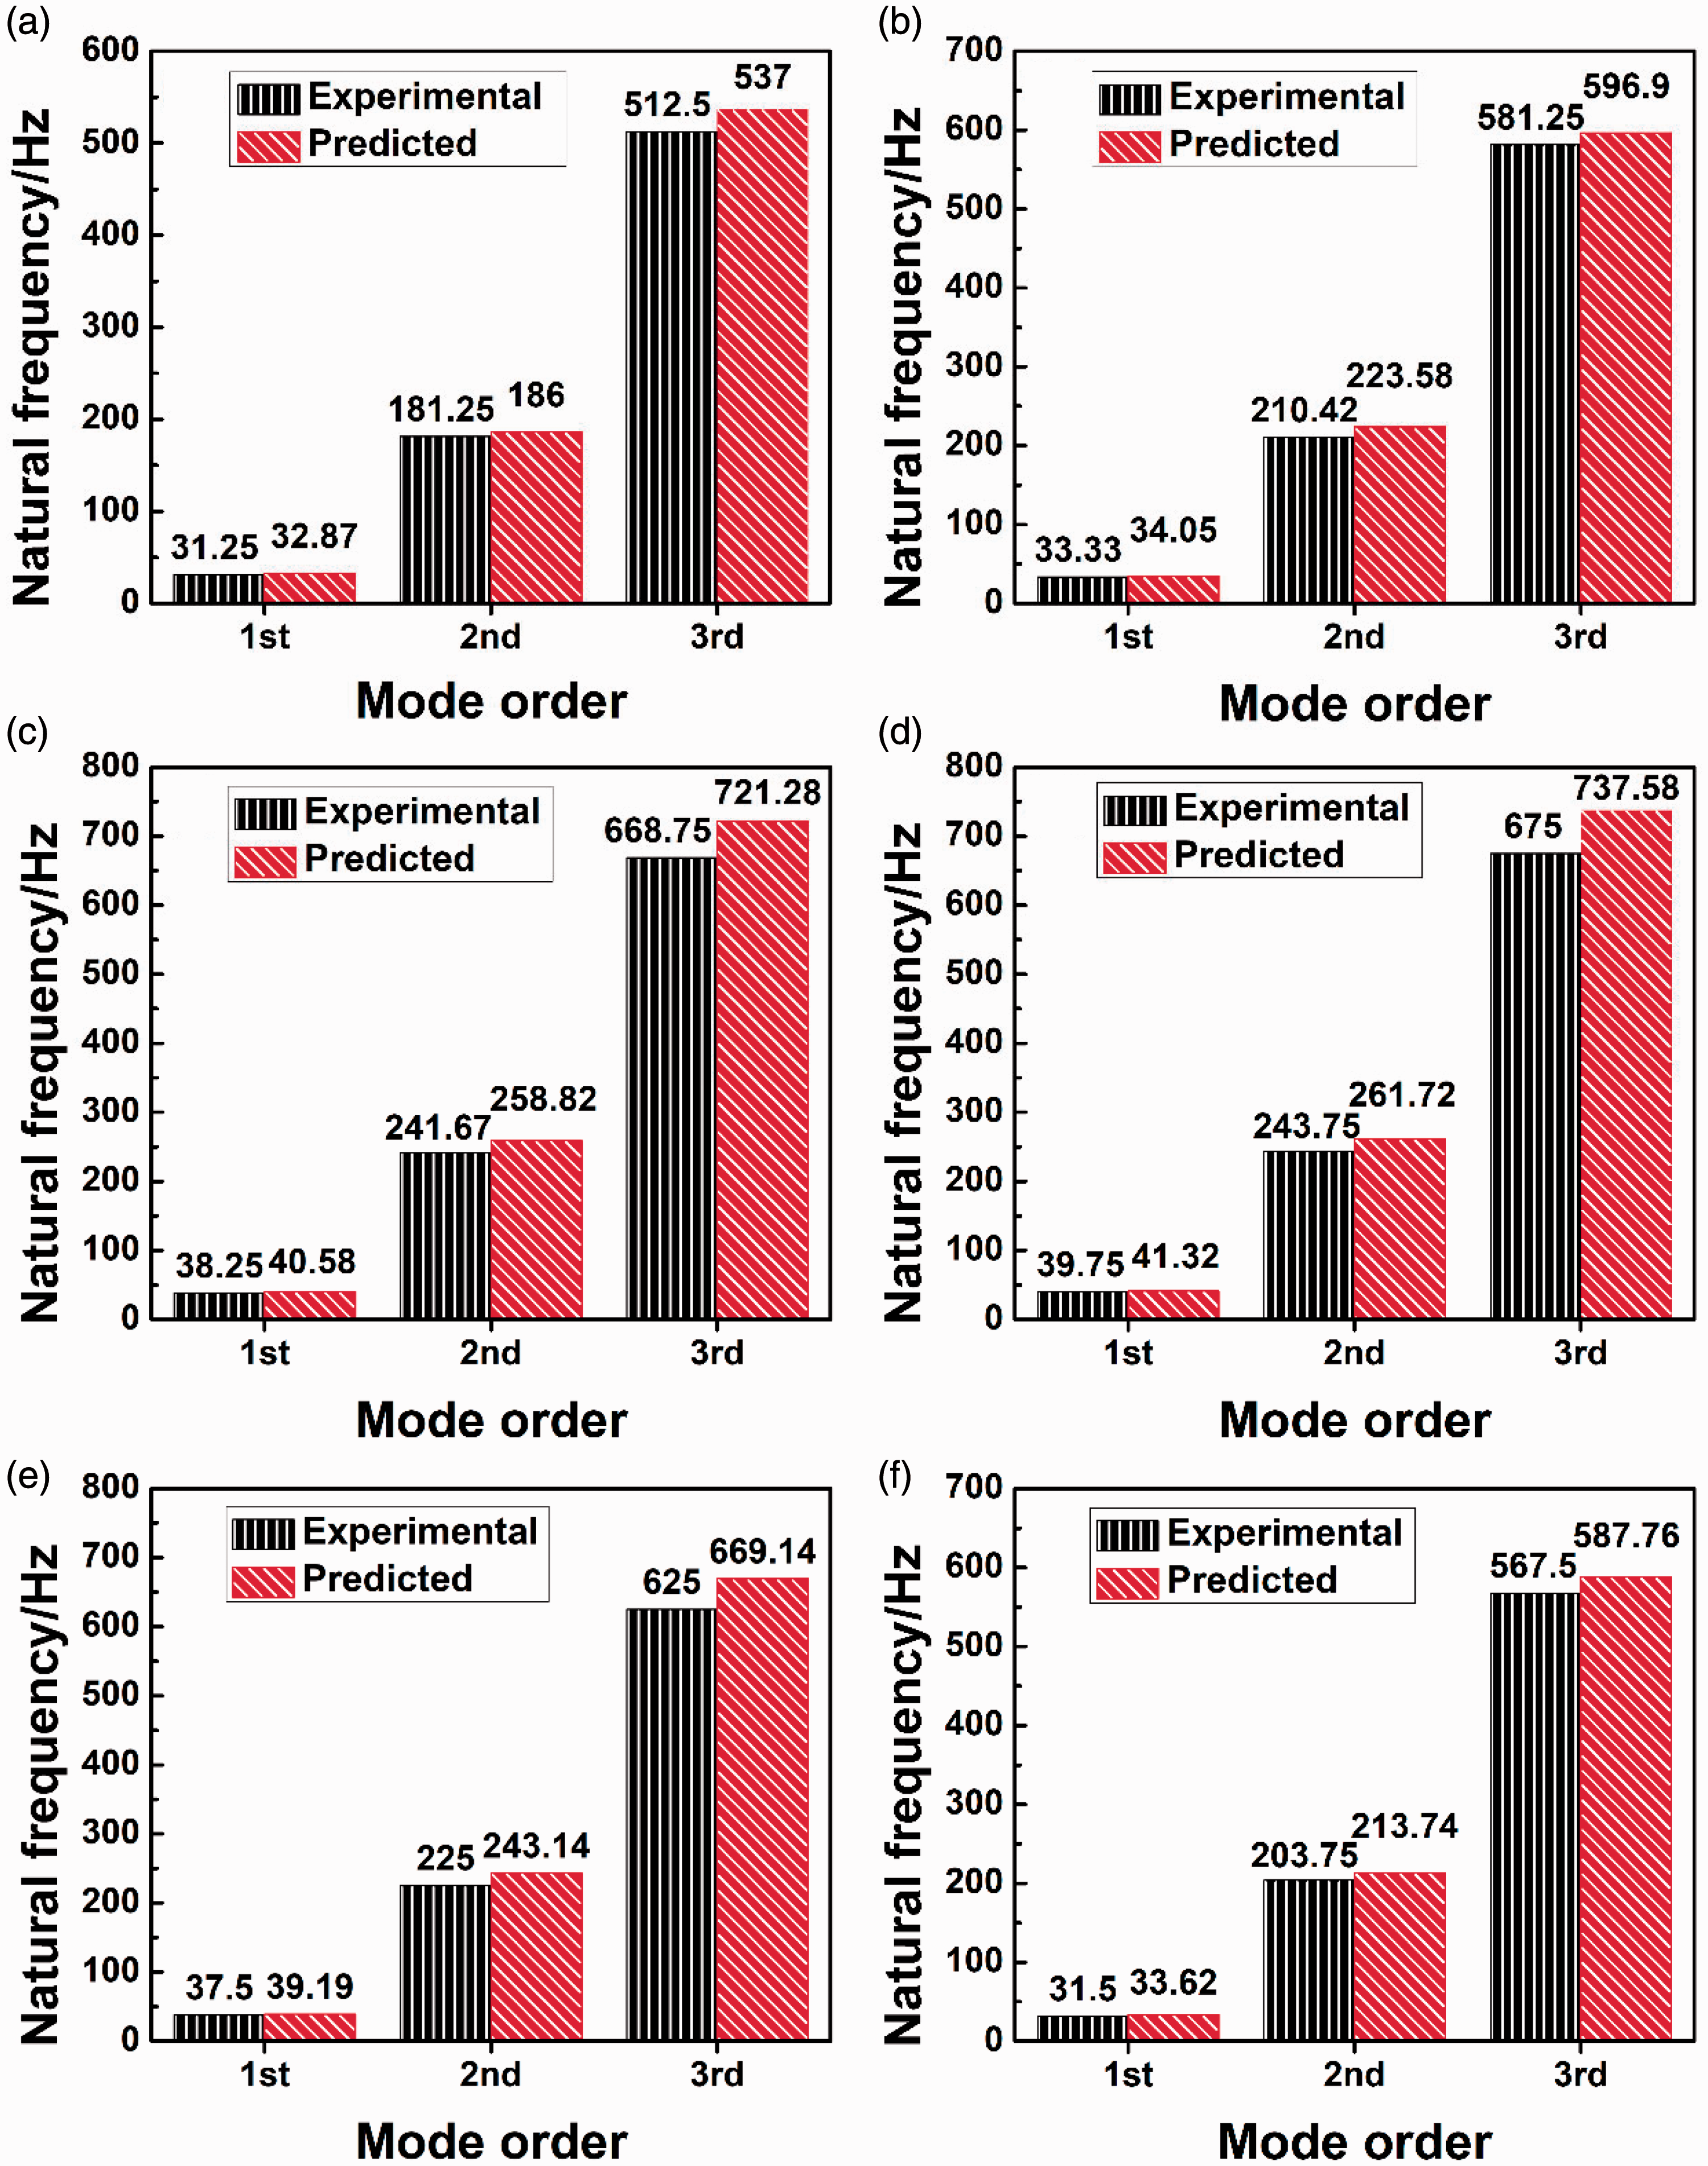
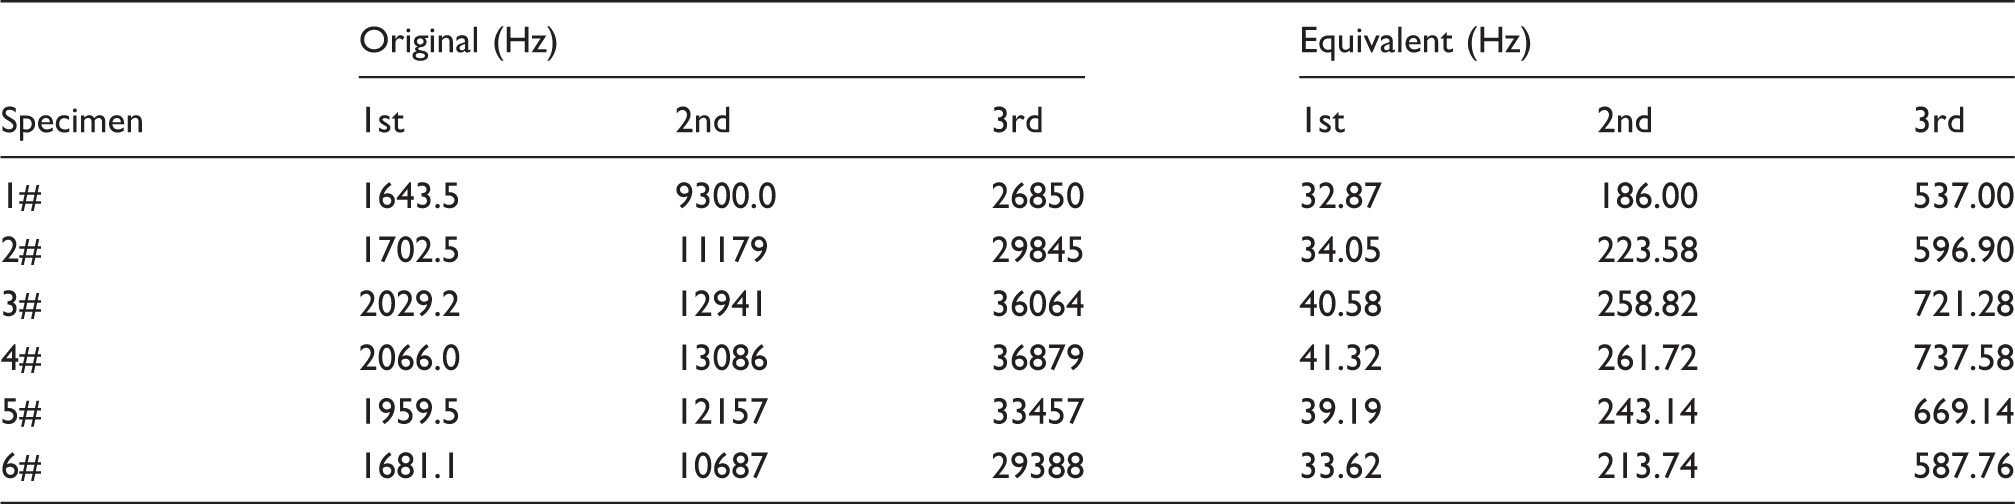
The first three modes of experimental natural frequencies of 3DNWCFCs were obtained as shown in Figure 7. The natural frequencies of 1#, 2# and 3# 3DNWCFCs keep growing successively with the increasing mode order. Table 5 shows the natural frequencies of the original small-size models and the equivalent FEA results of 3DNWCFCs by the transformation of equation (1). Figure 8(a) to (c) displays the experimental and predicted results of 1#, 2# and 3# 3DNWCFCs, respectively. The experimental results are very close to the FEA predicted results. The relation error is less than 10%, which explains that the prediction of the FEA results is reasonable. When the NDs of the 1#, 2# and 3# 3DNWCFCs remain unchanged, the natural frequencies of the experimental and FEA results of 3DNWCFCs increase gradually with the increase of the FVCs. It is because the elastic modulus has a positive effect on the natural frequency of a material.
13
The modulus of the fiber is much higher than that of epoxy resin, so the modulus of the composite increases due to the increase of the FVC. The FVCs of the small-size models are less than that of the experimental specimens. The way of enhancing the Young’s modulus of the waste cotton fiber to make up for the loss of FVC mentioned in the Finite element prediction and modelling section is effective. It reveals that the difference of modal performance is caused by the difference of the macroscopic modulus in nature.
First three natural frequency results of 1#, 2#, and 3# 3D needled waste cotton fiber/epoxy composites of different fiber volume contents. Comparison between the predicted results and the experimental results of natural frequency: (a) 1#; (b) 2#; (c) 3#; (d) 4#; (e) 5#; (f) 6#. Natural frequencies of the original finite element analysis results and the equivalent results after calculation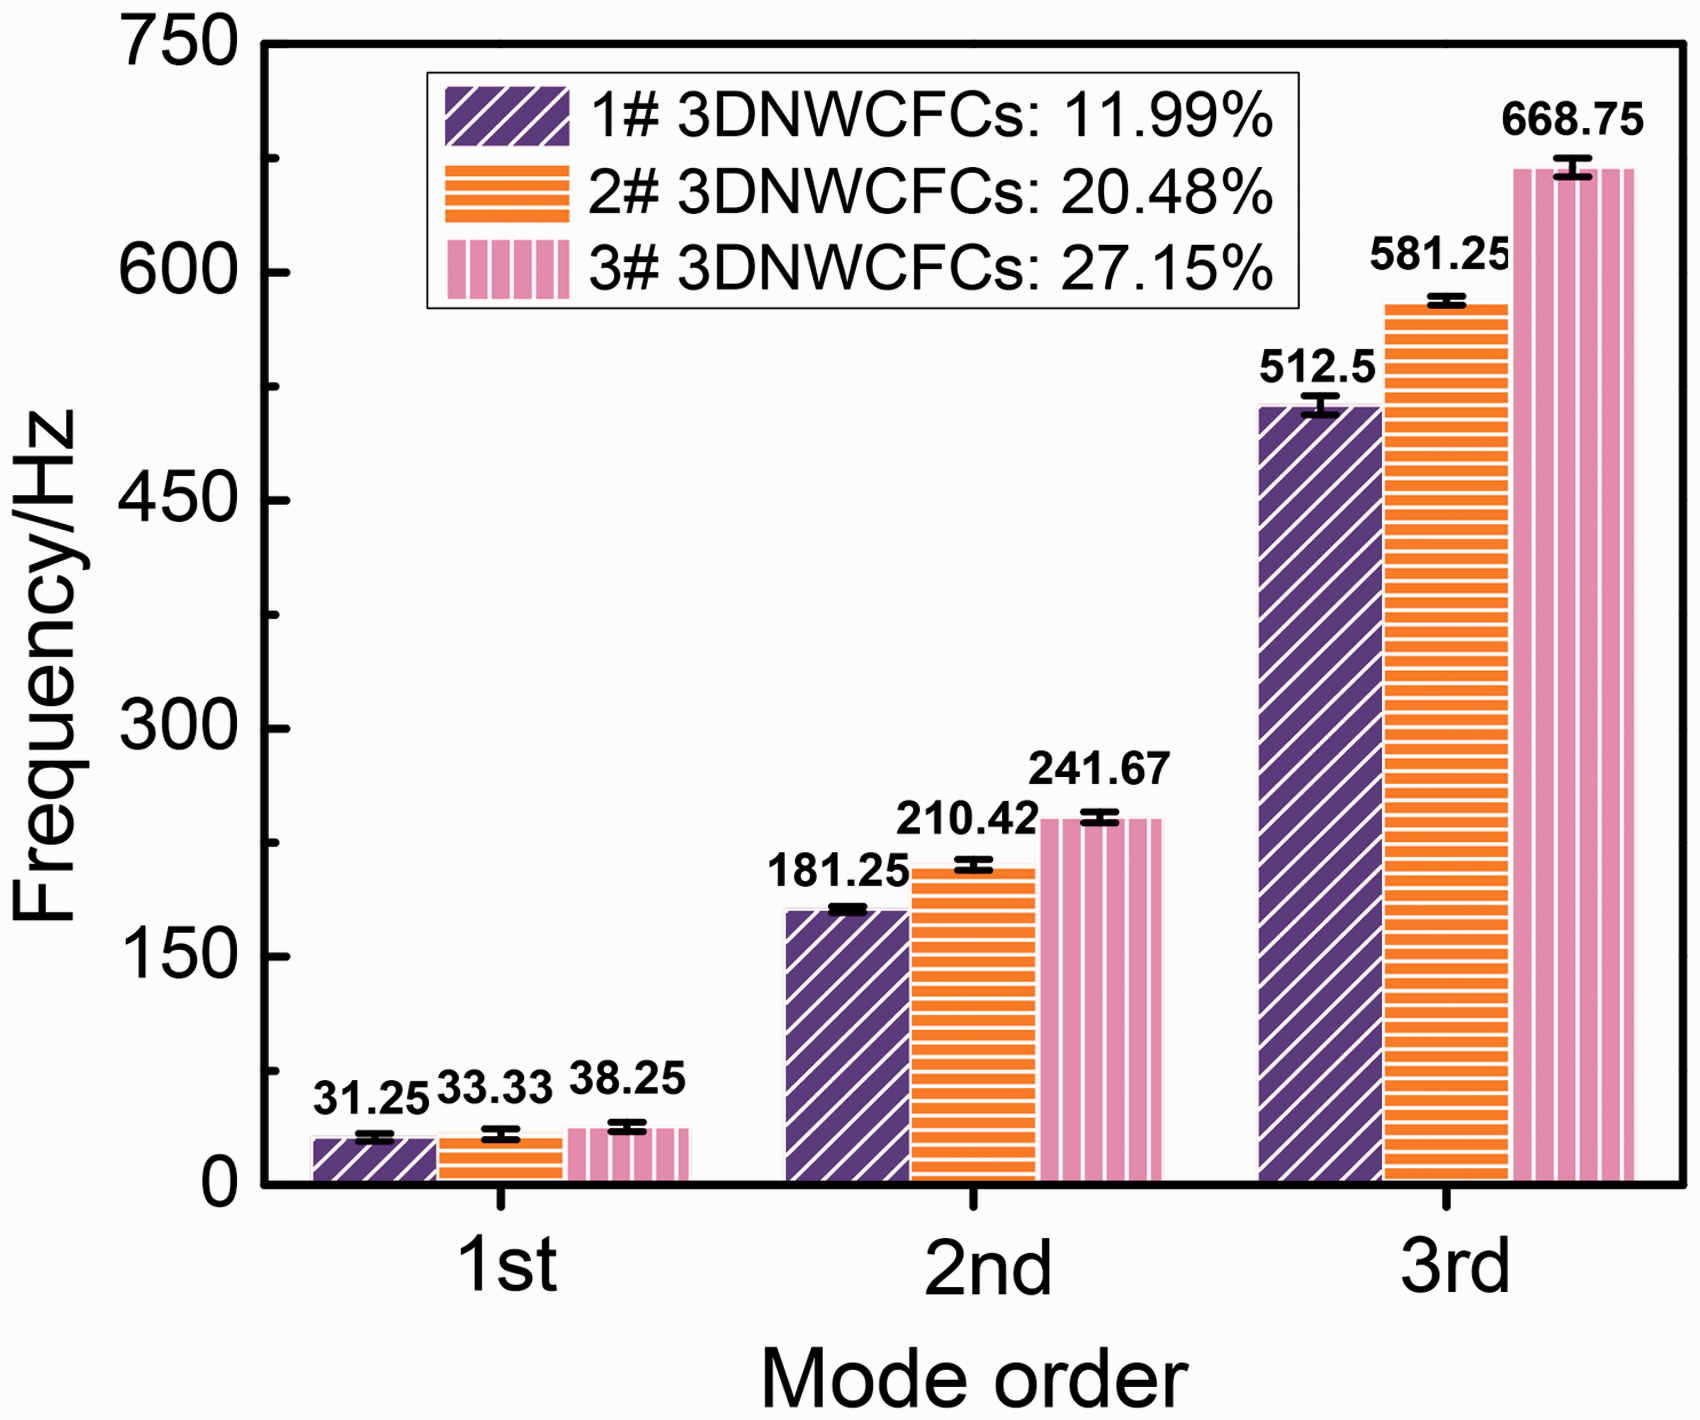
During the needle punching, the barbs on needles carry a part of fibers on the surface of the web into the Z-direction to produce fiber bundle formation. The fibers are entangled together due to the fiber bundle formation.
36
As is shown in Figure 9(b) to (d), the mean distances between Z-direction fibers of 1#, 2# and 3# 3DNWCFCs are 1162.67 µm, 943.67 µm and 650.00 µm, respectively. The mean distances between Z-direction fibers represent the density of the arrangement of Z-direction fibers. When the FVC increases, the density of the arrangement of Z-direction fibers increases too. Furthermore, in staple fiber reinforcement, the surface to contact area along with the fiber/matrix interface increases due to the increase of the FVC.37,38 The elastic modulus of 1#, 2# and 3# 3DNWCFCs rises with the increase of FVCs, which leads to the growth of natural frequencies of each mode.
Photomicrographs on cross-sections of the distances between Z-direction fibers in the 3D needled waste cotton fiber/epoxy composites: (a) Z-direction fibers; (b) 1#; (c) 2#; (d) 3#.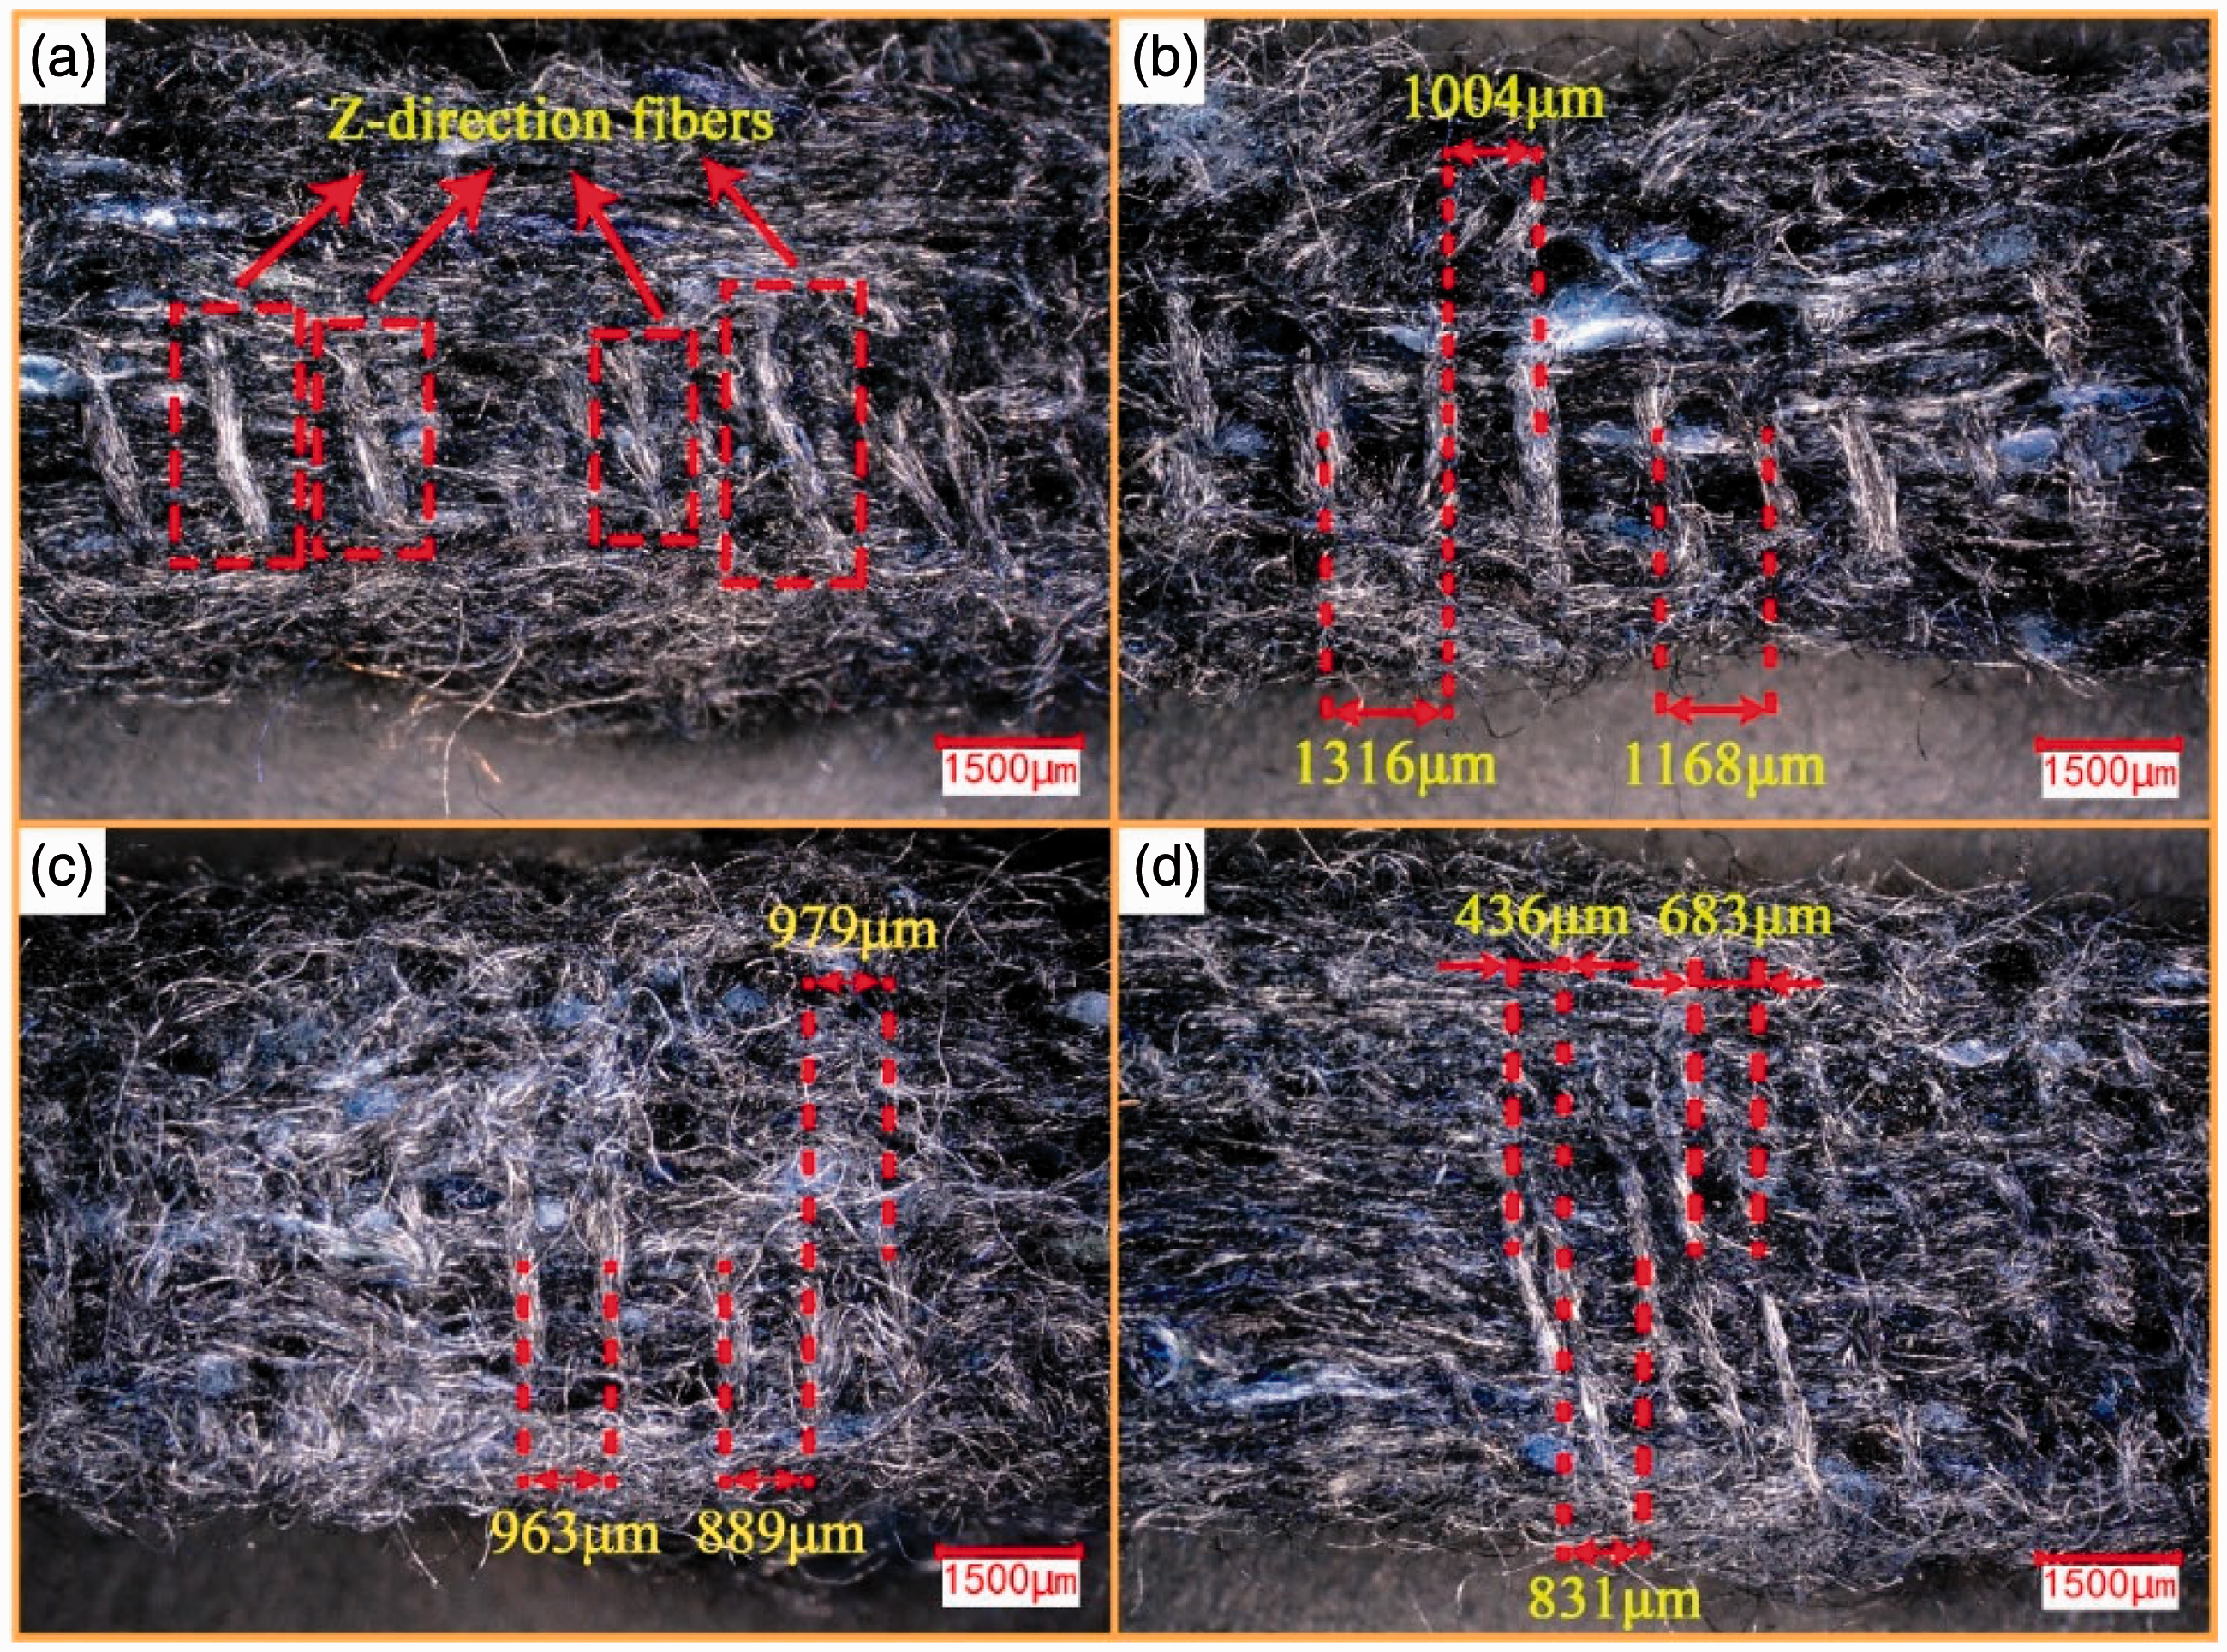
Figure 10 shows the first three orders of mode shapes of 1#, 2# and 3# 3DNWCFCs. The mode shapes demonstrate the bending deformation of the composite beams relative to the horizontal position in the context of vibration. The first three modes of deformation pattern that exist in the structure are confirmed by the vibration performance of the composite beams effectively. The mode shapes of the first, second and third order modes are named bending, twisting and second bending, respectively.
39
The ends of the beams painted green were clamped. The redder the color, the greater the displacement relative to the horizontal position in the pictures of the damping shapes. If the displacement is too large, the vibration amplitude is large and it is easy to damage the material.
12
In Figure 10, the first and second orders of the mode shapes of 1#, 2# and 3# 3DNWCFCs are similar. The third order of the mode shapes of 1# specimen shows three large excessive bends, which explains that there are flaws in these three excessive bends of the specimen. The third order of the mode shapes of 2# 3DNWCFCs shows two excessive bends and that of 3# 3DNWCFCs shows one excessive bend. The mode shapes of 1#, 2# and 3# specimens show that 3# specimen has the fewest flaws, which leads to the best modal performance of 3# specimen in these three specimens. Figure 11 shows the mode shapes of the small-size models of 1#, 2# and 3# 3DNWCFCs with the FEA method. There are no excessive bends on the small-size models. It is because the specimen is considered to have no defects in the finite element modeling. Hence, it is common that the mode shapes of FEA results and experimental results are slightly different.
Three orders of the vibration mode shapes and natural frequencies of three experimental 3D needled waste cotton fiber/epoxy composites: (a) 1#; (b) 2#; (c) 3#. Three orders of the vibration mode shapes and natural frequencies of three small-size models of 3D needled waste cotton fiber/epoxy composites: (a) 1#; (b) 2#; (c) 3#.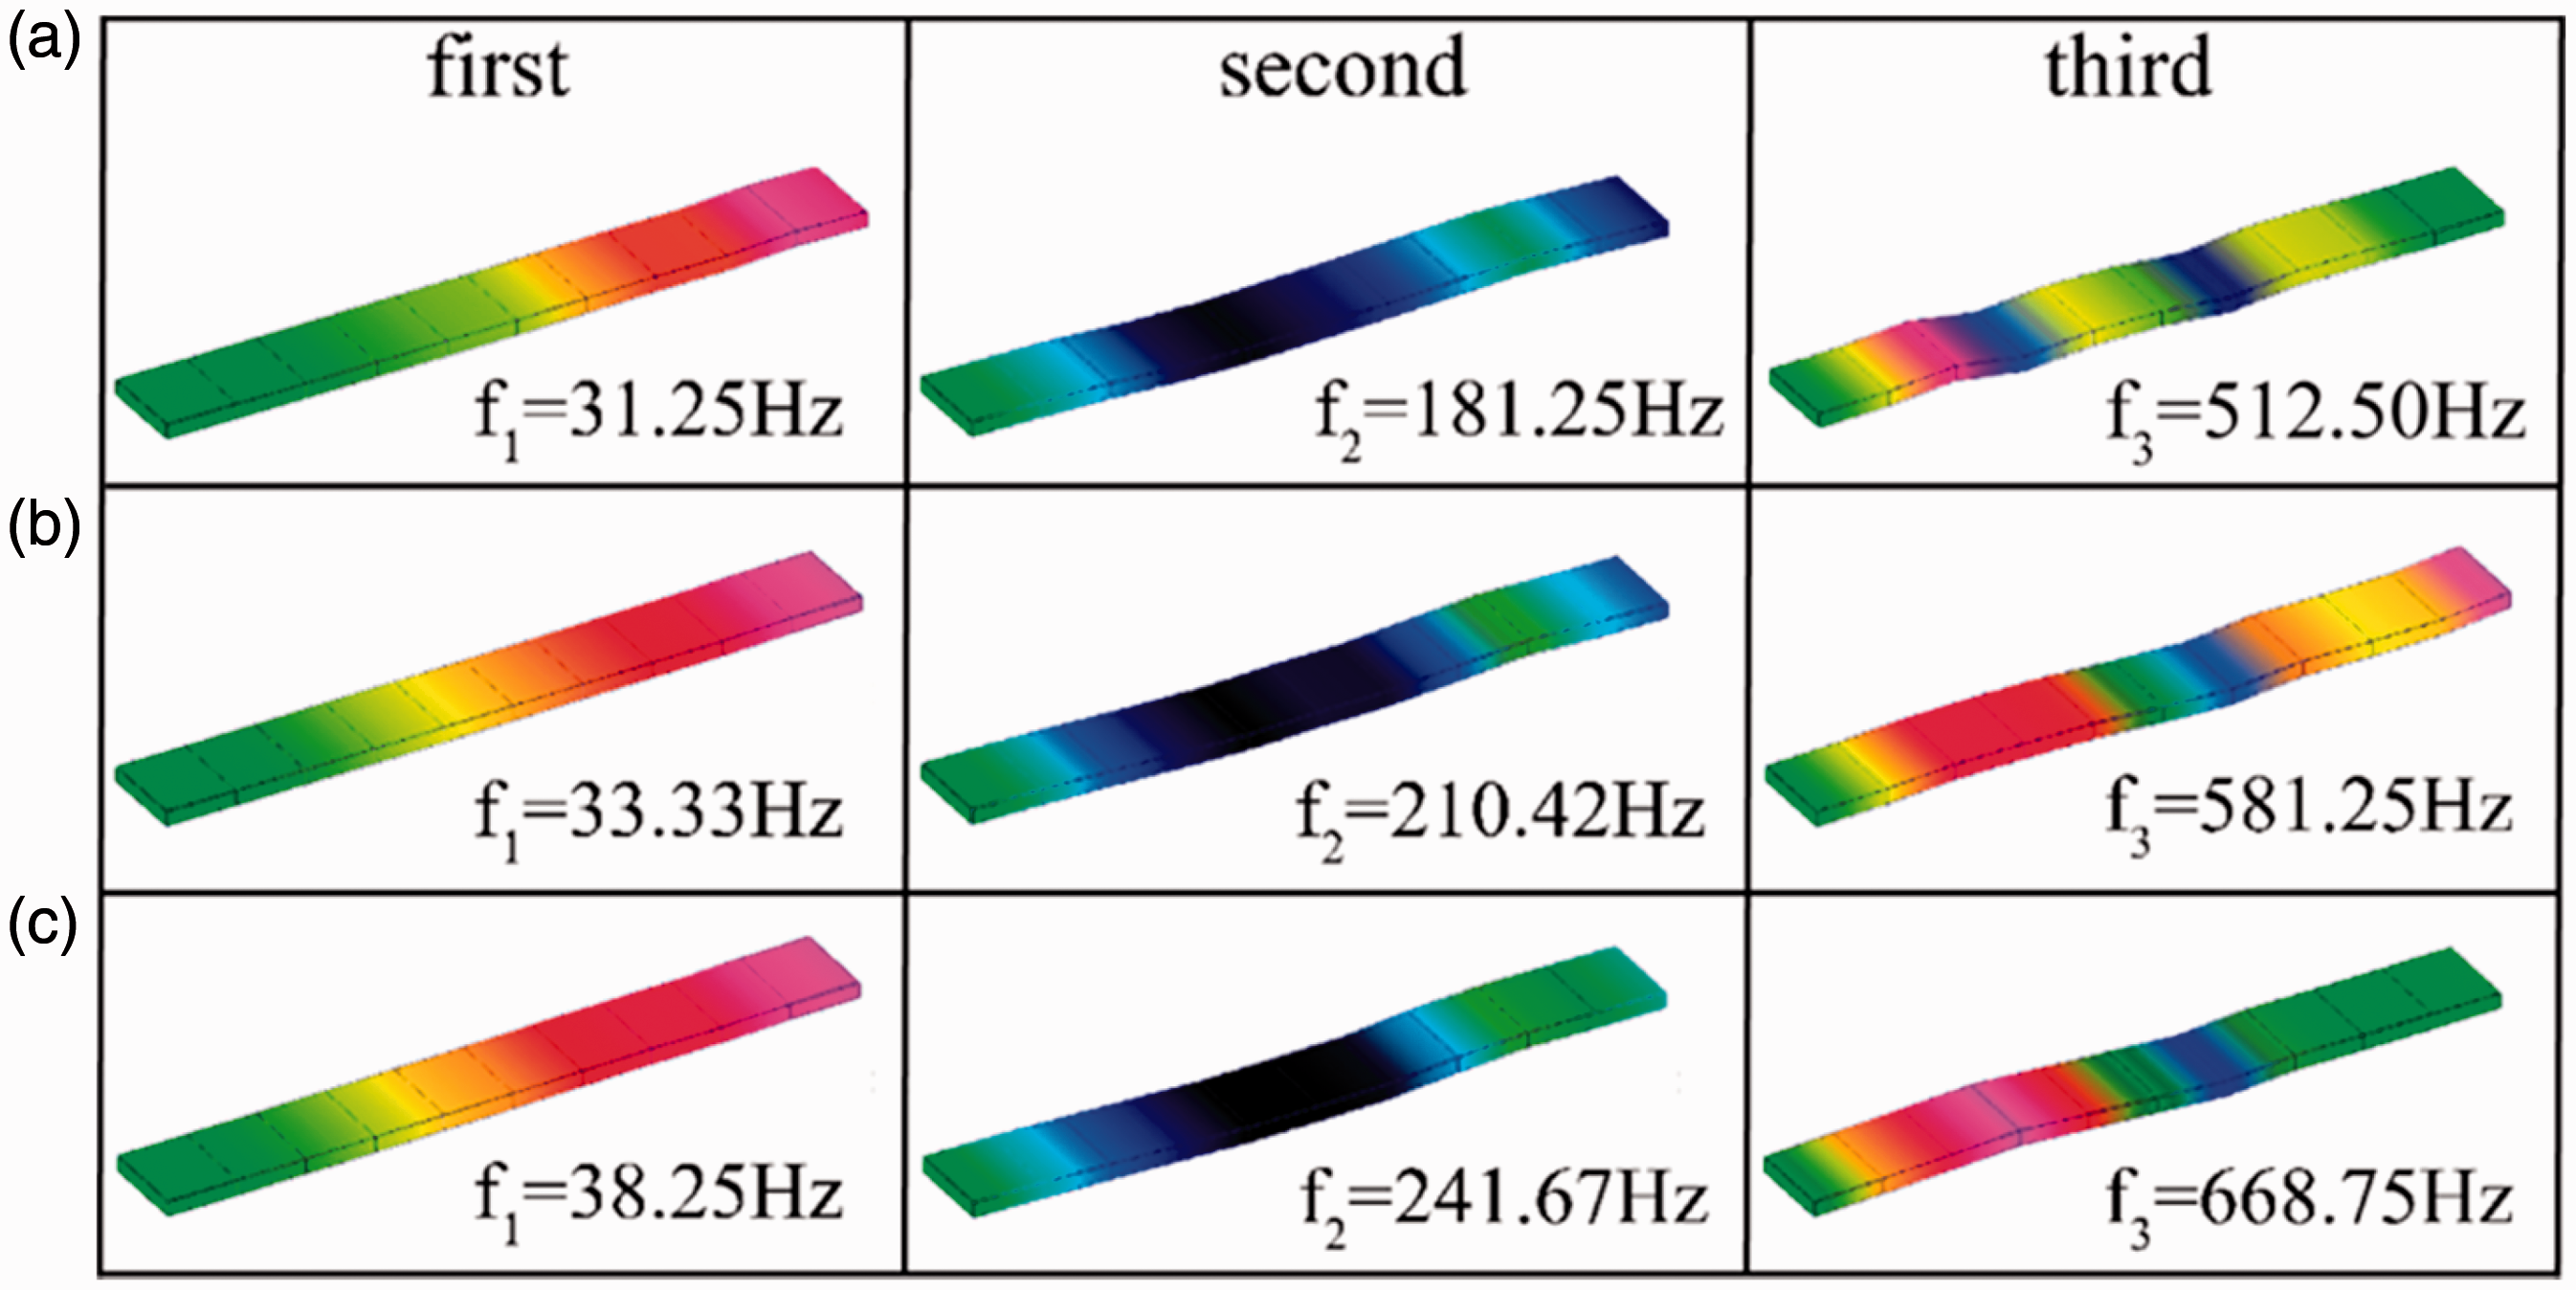
Effect of ND
Figure 12 displays the variation of the natural frequency of the 3DNWCFCs with different NDs and the same FVC. The variation trend of natural frequency is that it increases at each mode from 3# to 4# 3DNWCFCs and decreases at each mode from 4# to 6# 3DNWCFCs, which illustrates that the 4# 3DNWCFC has the optimum technology parameter (ND: 373/cm2; FVC: 27.16%) compared with the other five 3DNWCFCs.
First three natural frequency results of 3#, 4#, 5# and 6# 3D needled waste cotton fiber/epoxy composites of different needling densities.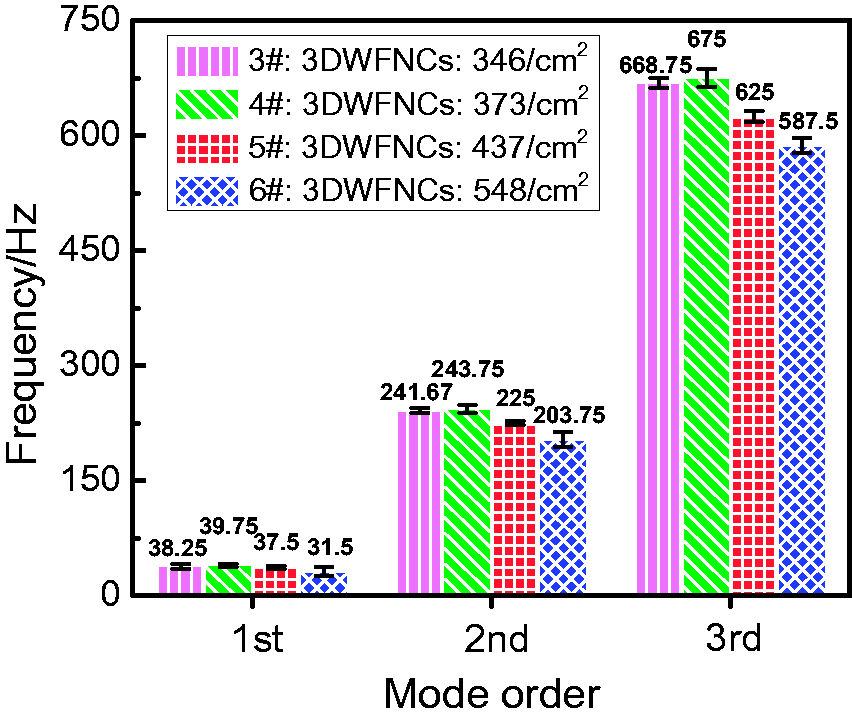
Table 5 shows the natural frequencies of the FEA results of 3#, 4#, 5# and 6# 3DNWCFCs. The original results were transformed into equivalent results using equation (1). Figure 8 shows the predicted results and experimental results of the natural frequencies of 3#, 4#, 5# and 6# 3DNWCFCs, (Figure 8(c) to (f), respectively). The relation error is less than 10%. The FEA results indicate that the natural frequencies appear to peak at 4# small-size model, which is consistent with the experimental results. On the one hand, different needle-punched holes were set on the small-size models due to the increase of NDs, which explains that the increasing ND has a positive influence on 3DNWCFCs. On the other hand, excessive needle punching leads to the decline in the modulus of the composites. Hence, transforming the modulus of the small-size models by changing the modulus of the waste cotton fibers is a method to expound the modulus of a macrostructure which has an impact on the vibration modal characteristics.
Figure 13 displays the appearance of the Z-direction fibers of 3#, 4#, 5# and 6# 3DNWCFCs. The Z-direction fibers appear more and more damaged from 3# to 6# 3DNWCFCs resulting from the increase of NDs, as is shown in Figure 13(b), (d), (f) and (h), respectively. Therefore, the natural frequencies of the 3DNWCFCs goes down gradually from 3# to 6# due to the decline of the modulus of fiber. The degree of entanglement between fibers will affect the modulus of needled felts, which will affect the modulus of the 3DNWCFCs. Because the Z-direction fibers of 4# 3DNWCFC are more tangled than that of 3# 3DNWCFC, the modal performance of 4# 3DNWCFC is greater than that of 3# 3DNWCFC, as is shown in Figure 13(a) and (c). Finally, 4# 3DNWCFC performs well.
Scanning electron microscopy images of the Z-direction fibers on the cross-sections of the 3D needled waste cotton fiber/epoxy composites: (a) 3#, (c) 4#, (e) 5# and (g) 6#; (b), (d), (f) and (h) show the enlarged morphological images corresponding to (a), (c), (e) and (g), respectively (red rectangles represent the Z-direction fibers; red circles represent the broken fibers).
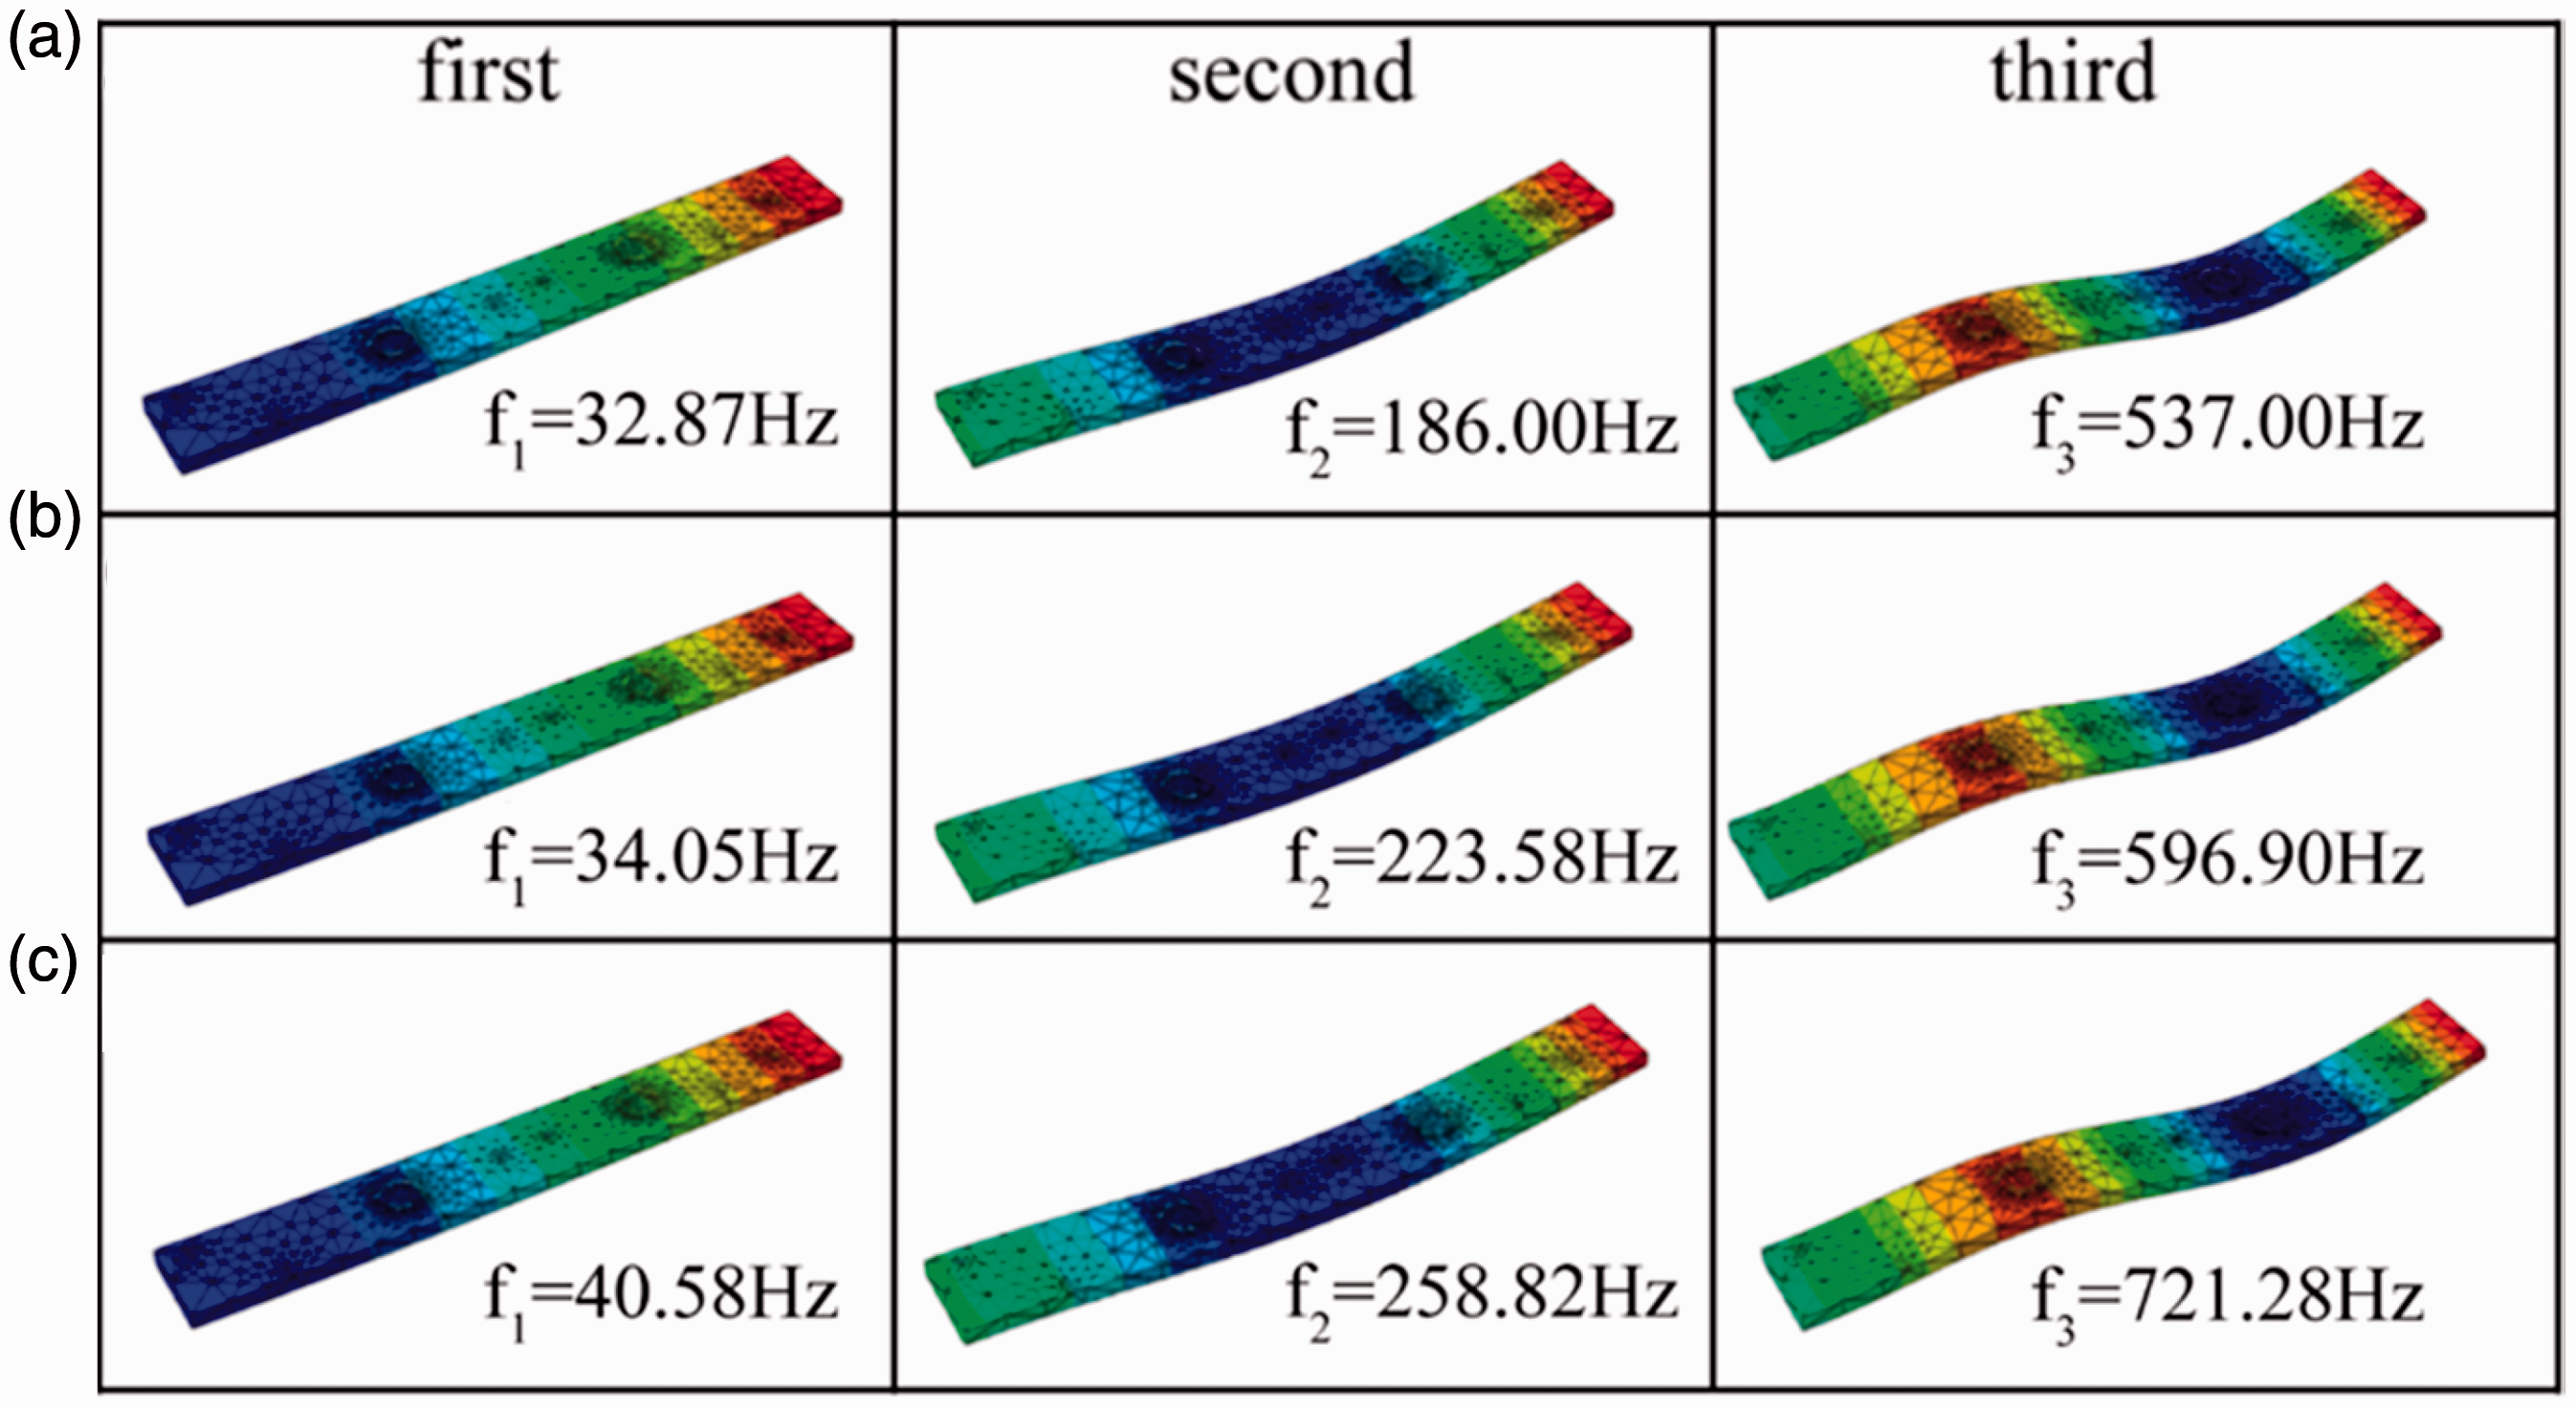
Figure 14 shows the first three orders of mode shapes of 3#, 4#, 5# and 6# 3DNWCFCs. In the third modes of the four 3DNWCFCs, the 3# and 5# 3DNWCFCs have excessive bends, whereas 4# and 6# 3DNWCFCs have no excessive bends. The vibration displacement of 4# 3DNWCFC is smaller than that of 6# 3DNWCFC, which indicates that the vibration performance of the 4# 3DNWCFC is better than that of 6# 3DNWCFC.
Three orders of the vibration mode shapes and natural frequencies of four experimental 3D needled waste cotton fiber/epoxy composites: (a) 3#; (b) 4#; (c) 5#; (d) 6#.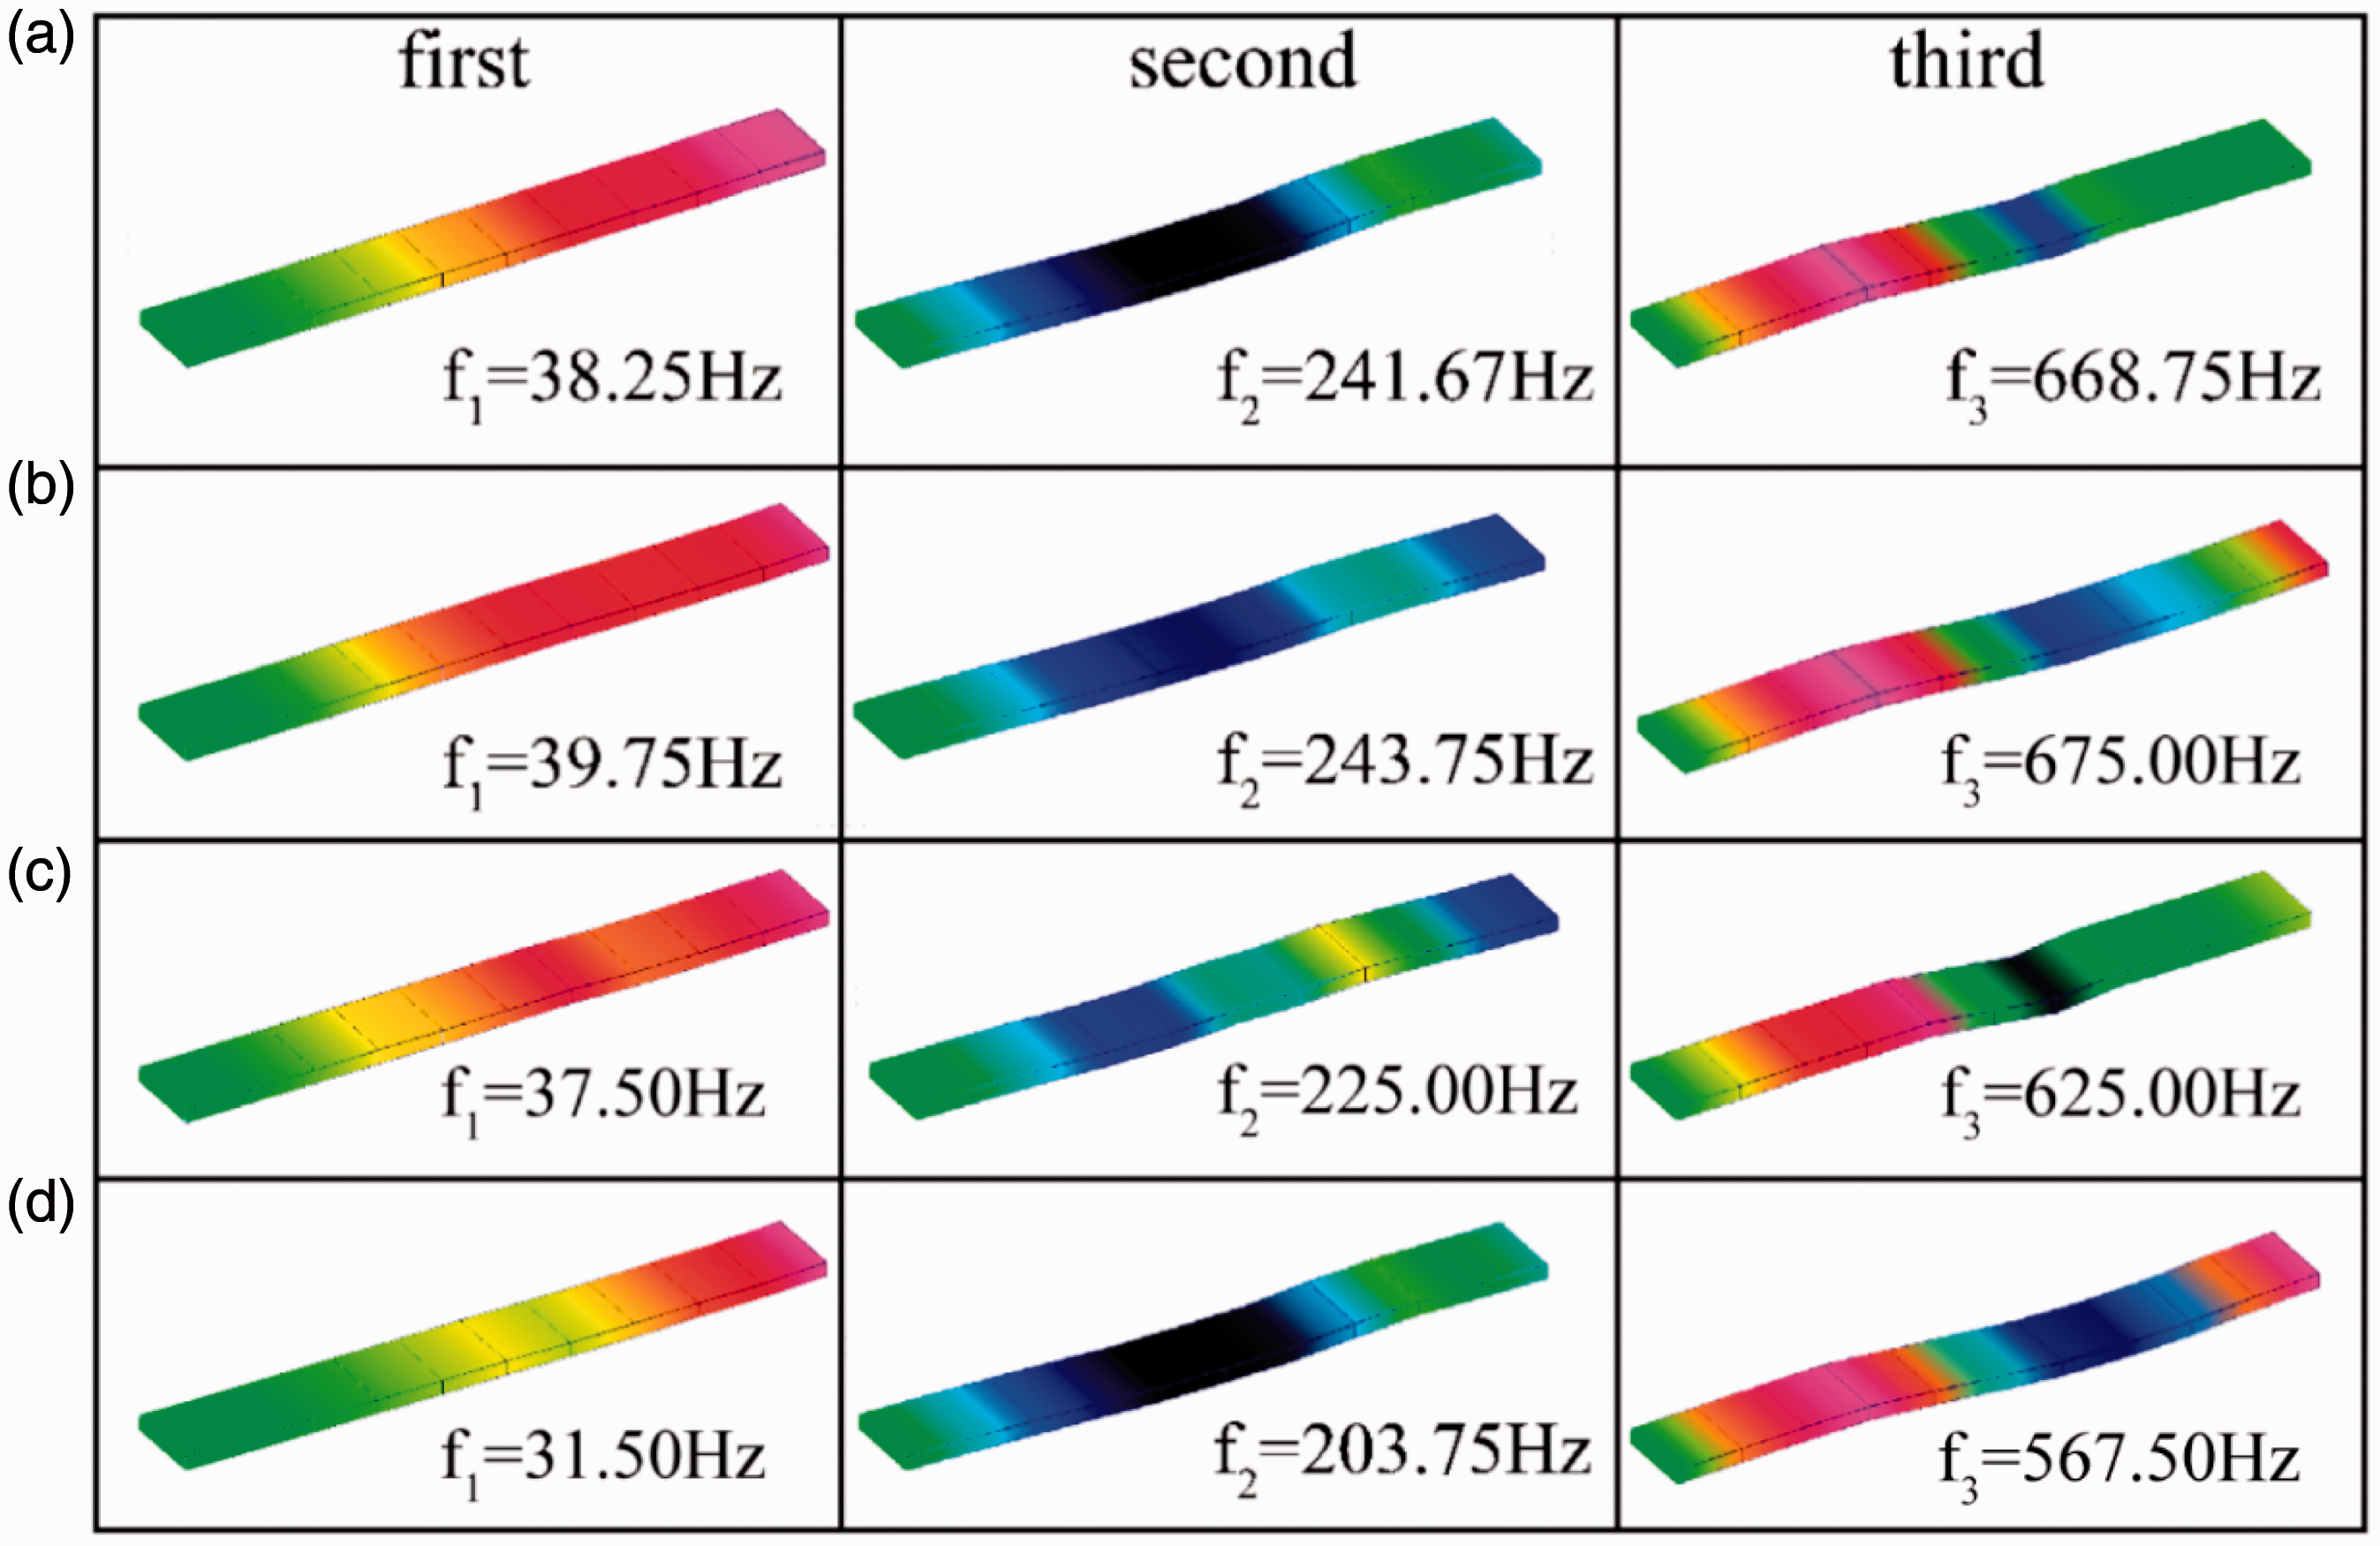
Figure 15 shows the mode shapes of the small-size models of 3DNWCFCs. The mode shapes in the first three orders are essentially unchanged and are generally consistent, compared with the experimental results without the defects in the manufacturing process.
Three orders of the vibration mode shapes and natural frequencies of four small-size models of 3D needled waste cotton fiber/epoxy composites: (a) 3#; (b) 4#; (c) 5#; (d) 6#.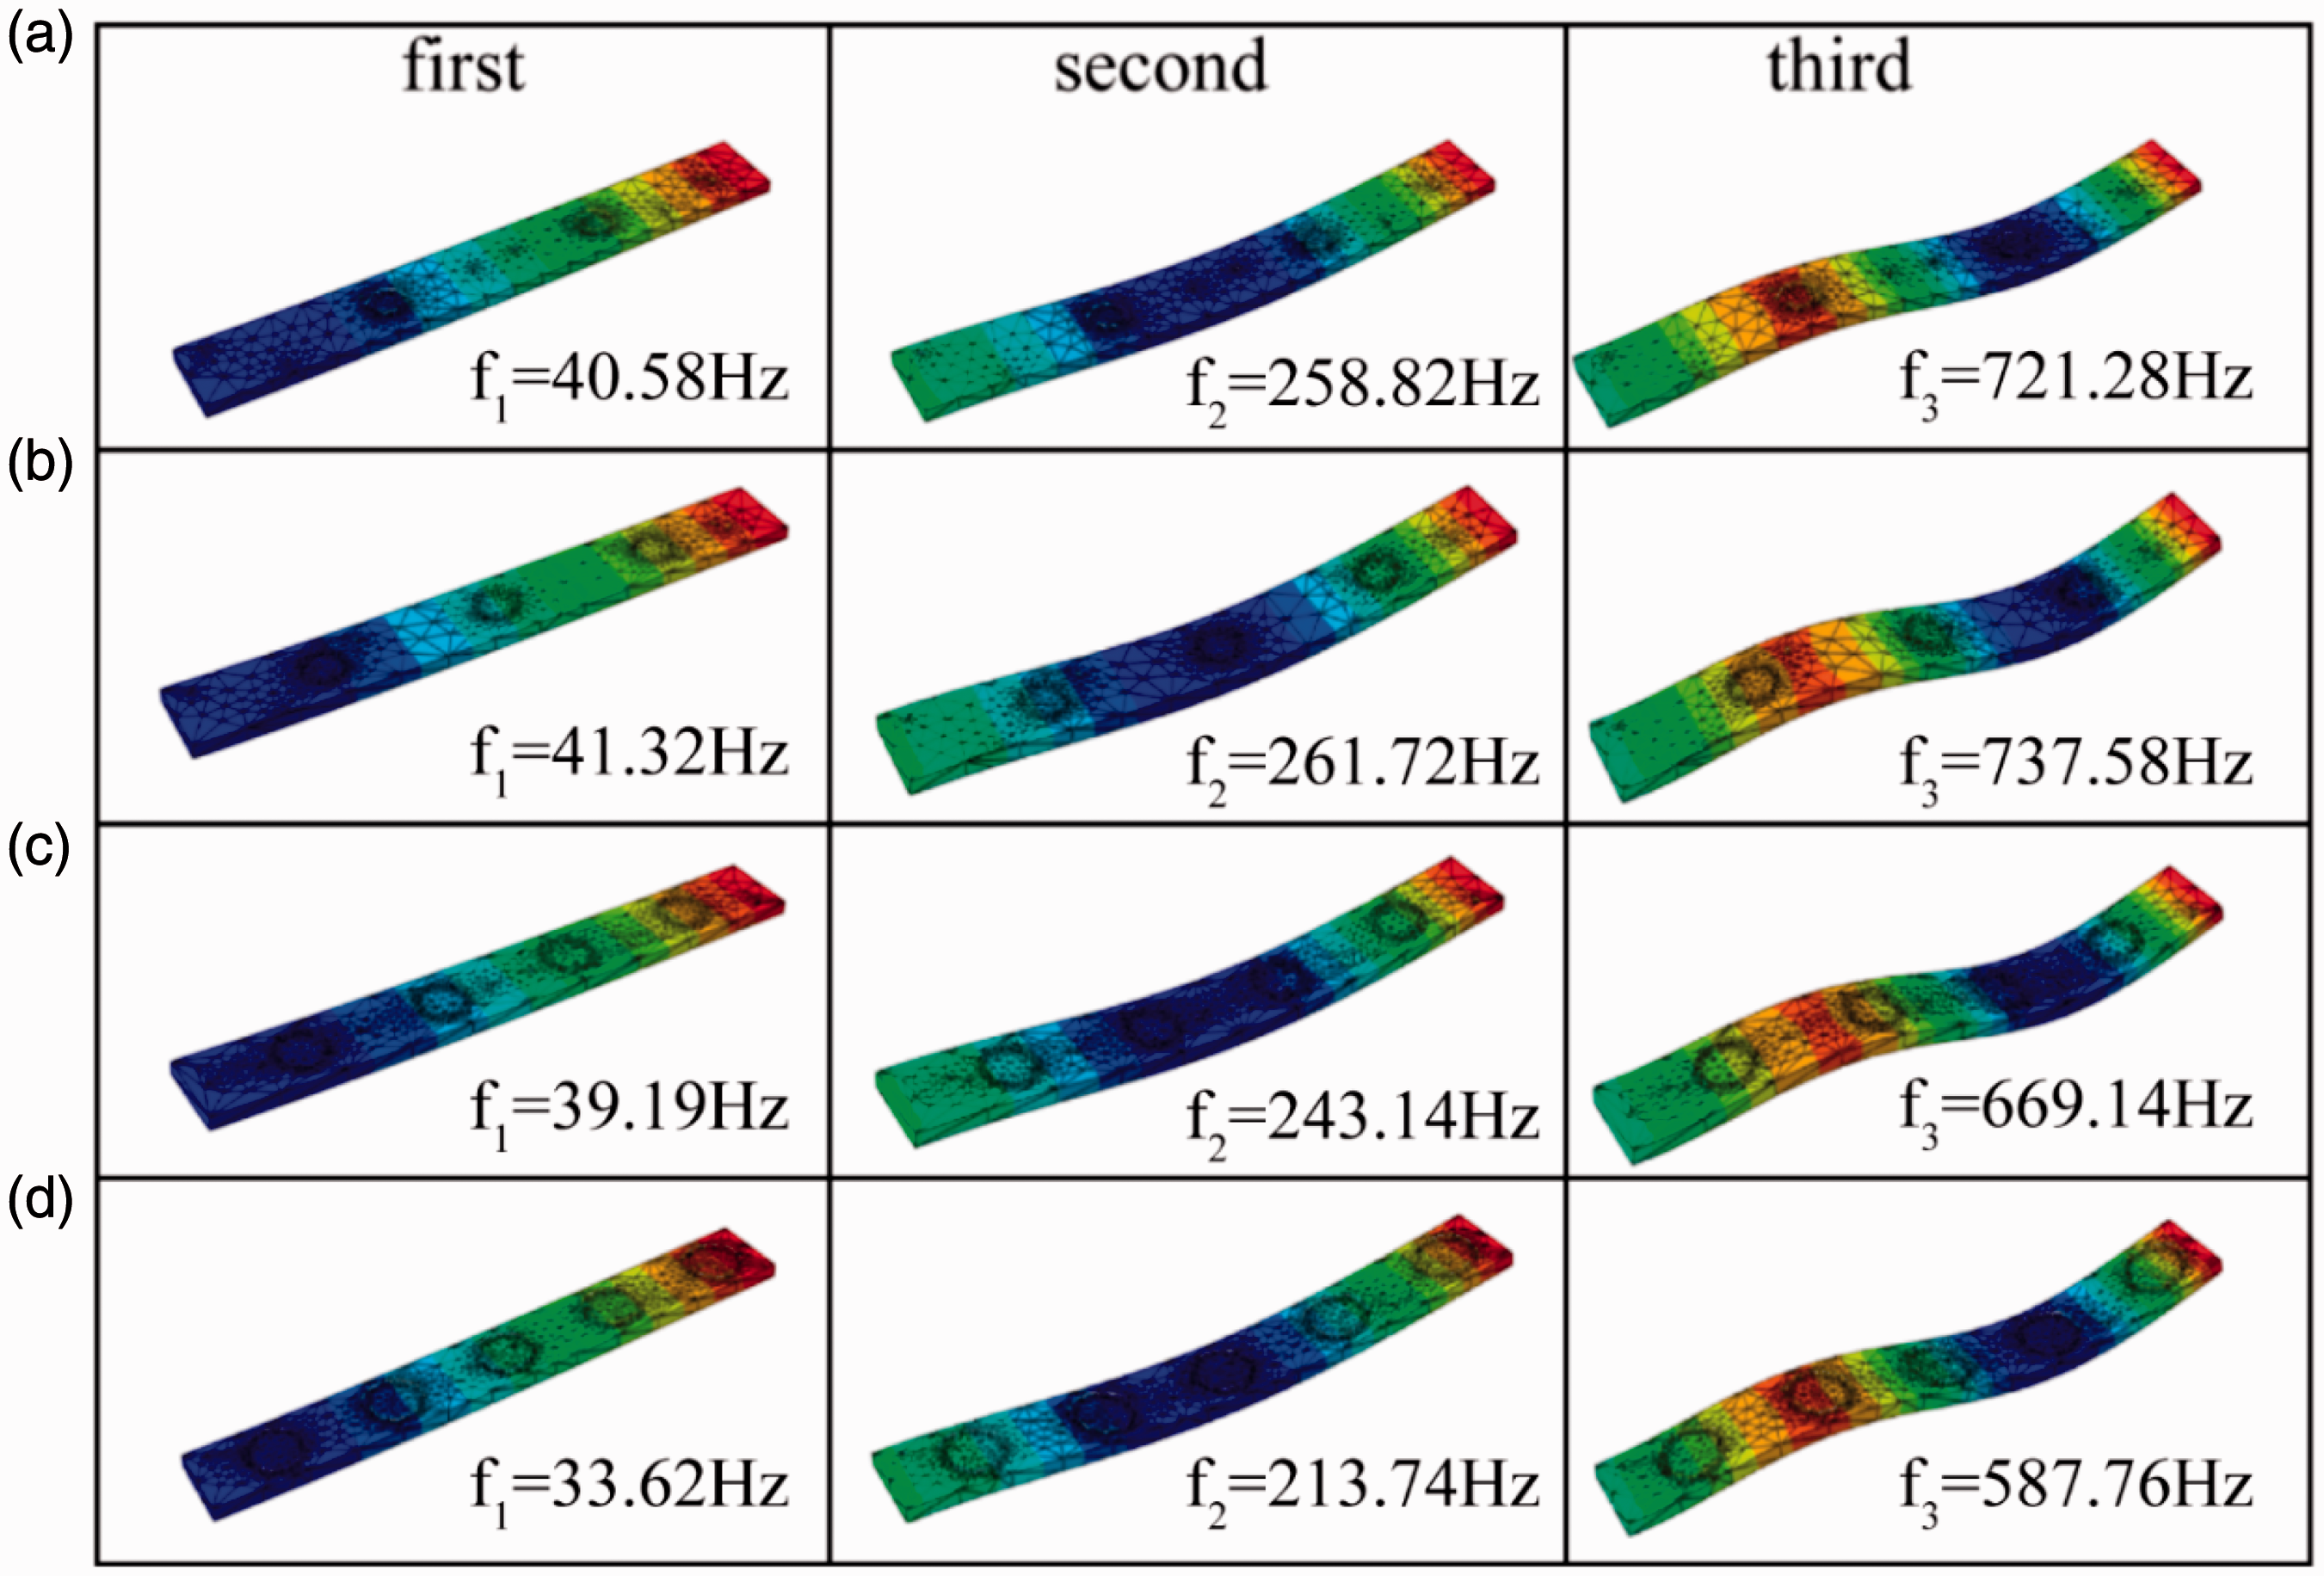
Conclusions
This study investigated the modal behavior of 3DNWCFCs with different FVC and ND using the EMA method and the FEA method. Six different kinds of 3DNWCFCs were used to study the relationship between vibration parameters (natural frequency and mode shapes) and needling process parameters (ND and FVC). Many important findings were obtained:
The natural frequency of the composites increases accompanied by the promotion of the FVC. This is because the higher FVC of the composite resulted in the higher modulus of it, and further led to a rise in its natural frequency. The increasing ND allows the fibers of the needled felts to become more tightly entwined. However, it also leads to more broken fibers. The natural frequencies first increased and then decreased with the growing ND. The 4# 3DNWCFC had the best modal performance, because 4# 3DNWCFC had the maximum FVC and suitable ND. The natural frequency of 3DNWCFCs with the predicted FEA method corresponds to the results of experiments using EMA technology. The equivalent small-size models also can be applied to other complex needled staple fiber reinforced composites. It is meaningful to optimize the processing parameters of needle punching and enhance productivity by the prediction of the modal or mechanical properties of the composite with the small-size models.
Footnotes
Declaration of conflicting interests
The authors declared no potential conflicts of interest with respect to the research, authorship, and/or publication of this article.
Funding
The authors disclosed receipt of the following financial support for the research, authorship, and/or publication of this article: This work was supported by the National Natural Science Foundation, China (Grant No. 51603163), the Scientific Research Program Funded by Shaanxi Provincial Education Department, China (Grant No. 18JS041), the sponsorship of Research Fund for the Doctoral Program of Xi'an Polytechnic University (Grant No. BS201910), the Thousand Talents Program of Shaanxi Province, and the Sanqin Scholar Foundation of Shaanxi Province, China.