
Abstract
As an indispensable part of textile processing, the fabric drying process has a great impact on product quality and overall energy consumption. To reveal the characteristics of the continuous drying process of various fabrics and optimize process parameters for improving productivity and saving energy, a finite element model is built to simulate the continuous fabric drying process, and an optimization method is applied to optimize process parameters based on the model. Specifically, a finite element model is first built; the model can predict distribution of water content and surface temperature of three kinds of fabric in the continuous drying process under different process parameters. The model is then verified by experiments, and the experimental results agree well with the numerical results: The mean absolute errors of distribution of water content and surface temperature of fabrics are 4.22% and 2.15℃, respectively. The numerical results indicate that wind velocity, wind temperature, and fabric velocity have a significant influence on the drying rate and surface temperature of fabrics in the continuous drying process, which, however, are not affected obviously by initial water content. It is also found that under the same initial and technological conditions, the drying rate and surface temperature of fabrics in the continuous drying process are lower than those in the intermittent drying process. Second, the Taguchi method is applied to design continuous fabric drying schemes, considering the interaction effect of technological parameters on the drying process. The numerical model is then applied to simulate these schemes, and the TOPSIS method is applied to analyze and compare these numerical results. The optimal technological parameters are determined; the optimal parameters can help to save energy by about 27.8% and enhance energy efficiency by about 16% in the continuous drying process. It is worth noting that the interaction effect of fabric velocity and wind temperature on the continuous drying process is more significant than their independent effects.
Keywords
The textile industry is one of the most important sectors in the world and plays an important role in human life and scientific development. 1 As an important part of textile processing, the drying process has a great impact on product quality; it is also energy intensive, accounting for about 55–60% of the total energy consumption. 2 However, many engineers adjust the technological parameters in the actual drying process according to their own experience, resulting in a considerable waste of energy. 2 Besides, without a well-controlled drying process, the dyeing strength (K/S value) is not high, 3 leading to a decline in the quality of the fabric product.4,5 To solve these problems, it is necessary to optimize process parameters in the fabric drying process. In recent years, many scholars have conducted experiments to select the optimal process parameters in the fabric drying process.
To gain the best mechanical properties of fabrics after drying, experiments in fabric drying under different wind temperatures were conducted by Vasanthan. 6 The best wind temperature was finally selected, and the best mechanical properties of fabrics were obtained as well. Phillips et al. 7 conducted experiments to further study the effect of wind temperature and drying span on the quality of fabric in the drying process. By carrying out fabric drying experiments under different wind temperatures and drying spans, the best combination of wind temperature and drying span was obtained, under which the quality of fabric was high after drying. Huang et al. 8 established an experimental platform of fabric hot air drying, carried out fabric drying under different temperatures on this platform, and identified the best air temperature under which energy efficiency is the highest. Similarly, Xiang et al. 9 optimized the angle of the air jet in the fabric drying process based on an experimental system. Specifically, with other process conditions being fixed, the fabric drying experiments were carried out to analyze the effects of angles of the air jet on the drying area and the drying rate. The best range of angles was determined in which both the fabric drying rate and energy efficiency were high.
Although conducting experiments can help to optimize the process parameters of fabric drying, there are several problems with this approach. Conducting experiments is a time-consuming and labor-intensive process. What's more, when carrying out experiments to optimize process parameters, only limited data can be obtained and experimental errors cannot be avoided. By contrast, numerical simulation technology can help to simulate the fabric drying process on a computer, and a large amount of data can be obtained with minimal errors. This can also save much time and material resources. In recent years, more and more researchers have optimized the process parameters of fabric drying on the basis of numerical models.
Beckwith and Beard 10 represented the fabric as a wet layer sandwiched between two dry outer layers, and a simple one-dimensional numerical model of fabric drying was established. The model was used to predict the fabric drying process under different drying spans, and to calculate the amount of energy consumed in the drying process. The best drying span was determined; then, when drying fabric with regard to the predicted water content, 15–30% energy can be saved under this drying span. Wei et al. 11 established a finite element model which can calculate the coupling phenomenon between environment and fabric in the drying process. Then, this model was applied to analyze the effect of wind velocity on the drying rate and product quality in the drying process, and the effect of heating power on the drying rate and product quality was also analyzed based on the model. Finally, the optimal wind velocity and heating power were determined separately. Ji and Yue 12 established a finite element model based on research of Wei et al., 11 and the effect of pressure and substance concentration gradients on the drying process was also considered. Then, several schemes of fabric drying were designed by Taguchi design method, 13 and the model was used to simulate the drying process of these schemes. Next, the numerical results were directly compared and the optimal technological parameters were selected, under which the best distribution of water content in the fabric during the drying process is identified. Wang et al. 14 also considered the influence between environment and fabric in drying process, and built a two-dimensional finite element model. This model was applied to optimize the distribution of air jets in the fabric drying process. Finally, the scheme of the distribution of air jets was identifies. After optimizing the distribution of the air jets, the distribution of temperature on the fabric surface was more even in the drying process and fabric quality was enhanced.
Establishing numerical models of fabric drying can help to gain insight into the fabric drying process, and the model can be used to optimize process parameters with high accuracy and low resource consumption. But in actual production, to enhance productivity and stability of product quality, 15 models of continuous drying of fabric are applied in most factories. And few researchers have built numerical models of continuous drying of fabric to optimize process parameters. Besides, few researchers efficiently choose methods to design fabric drying schemes, and few researchers use scientific methods to optimize process parameters with multiple evaluation indicators. Furthermore, when designing experimental schemes of fabric drying, there is almost no research considering the interaction effects of process parameters on the fabric drying process. 16 It is worth noting that in most cases, it is necessary to consider interaction effects, as the influence of each factor on experimental results is not independent.
In this paper, to solve the problems mentioned above, a finite element model for continuous fabric drying process is developed; in addition, a method for efficiently designing experimental schemes of fabric continuous drying is proposed, and the scientific optimization method to select the optimal process parameters according to multiple evaluation indicators is also proposed. Specifically, the next section presents the complete parameterized characterization system of various fabrics, and this system is built on the base of work done by Wang et al.
17
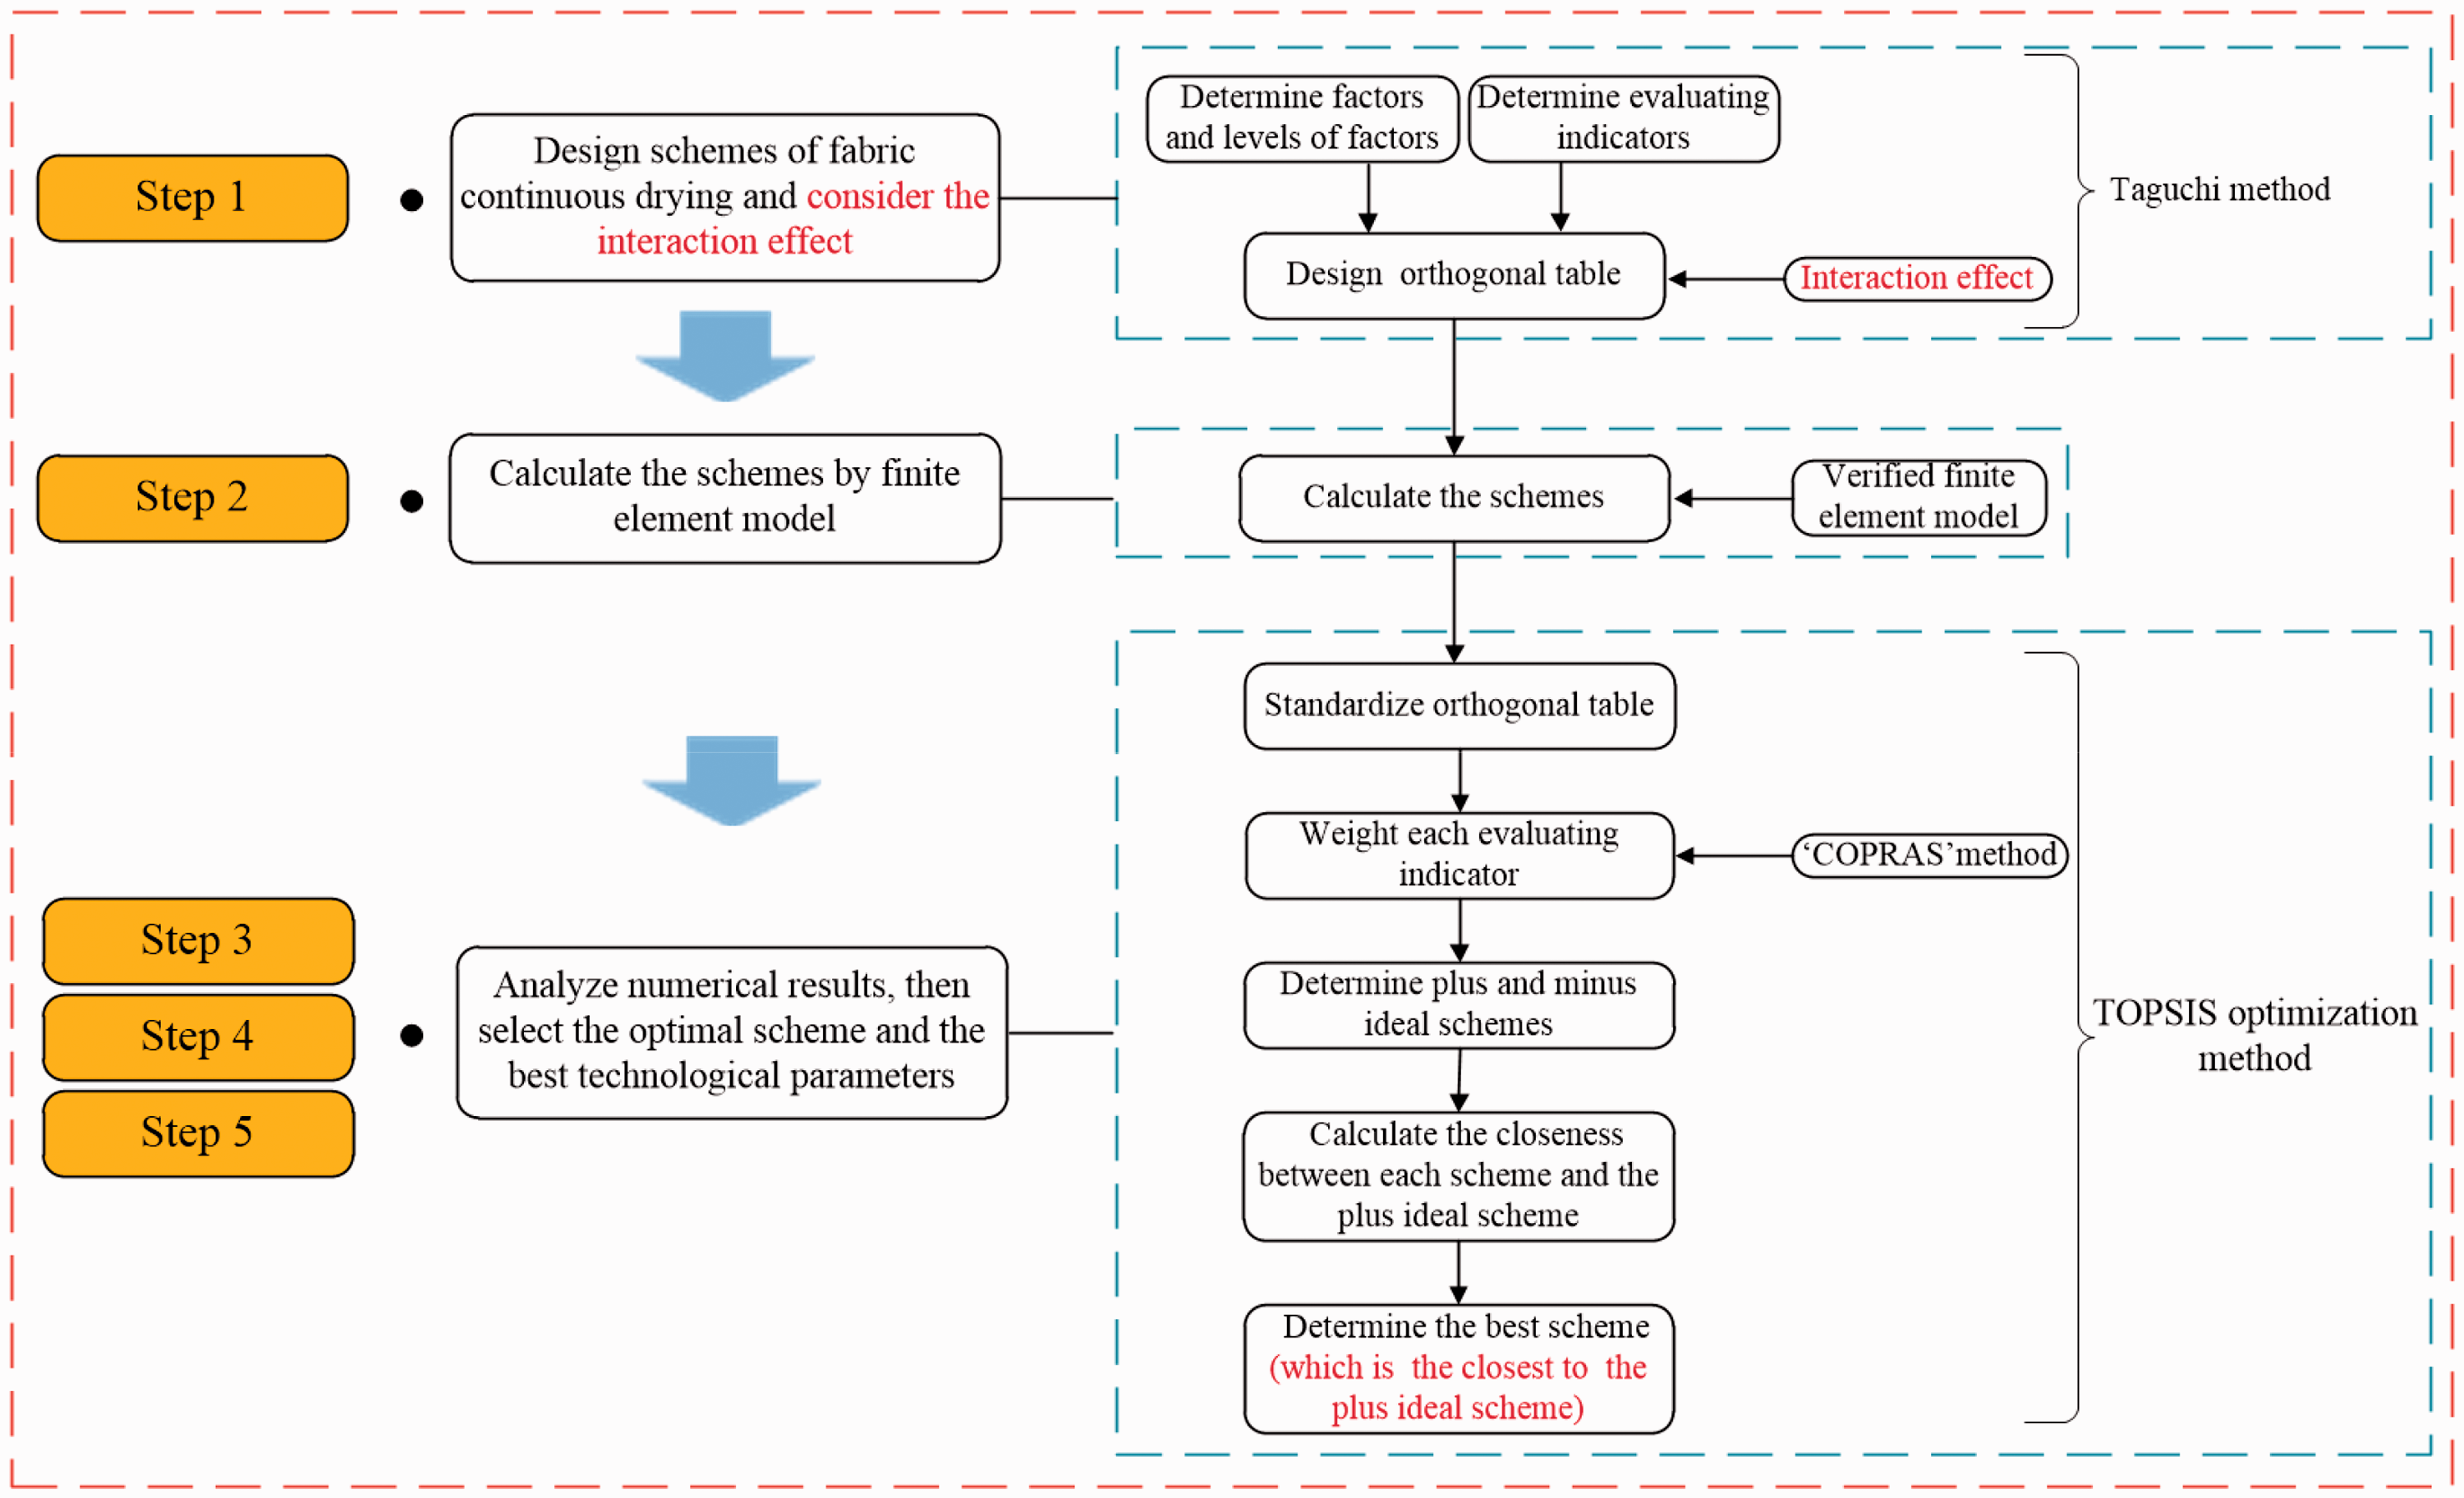
Then, a finite element model is built to simulate continuous drying process of different fabrics under different process conditions. And the numerical model is verified by experiments. The following section gives the process of designing schemes of fabric continuous drying considering the interaction effect based on the Taguchi method. Then, the numerical model is used to simulate these schemes. The TOPSIS method (Technique for Order Preference by Similarity to Ideal Solution) is applied to analyze the numerical results and choose the optimal process parameters. Finally, to choose the globally optimal process parameters, a second optimization is carried out to further identify the optimal process parameters by the same methods and steps. Based on the finite element model, experiment design method, and optimization method proposed in this paper, scholars can have a deep understanding of the characteristics of the continuous fabric drying process, and the optimal process parameters can be chosen accurately and scientifically in actual production. To increase the readability of this paper, the research route is given in the form of a flow chart (shown in Figure 1).
The research process of this paper.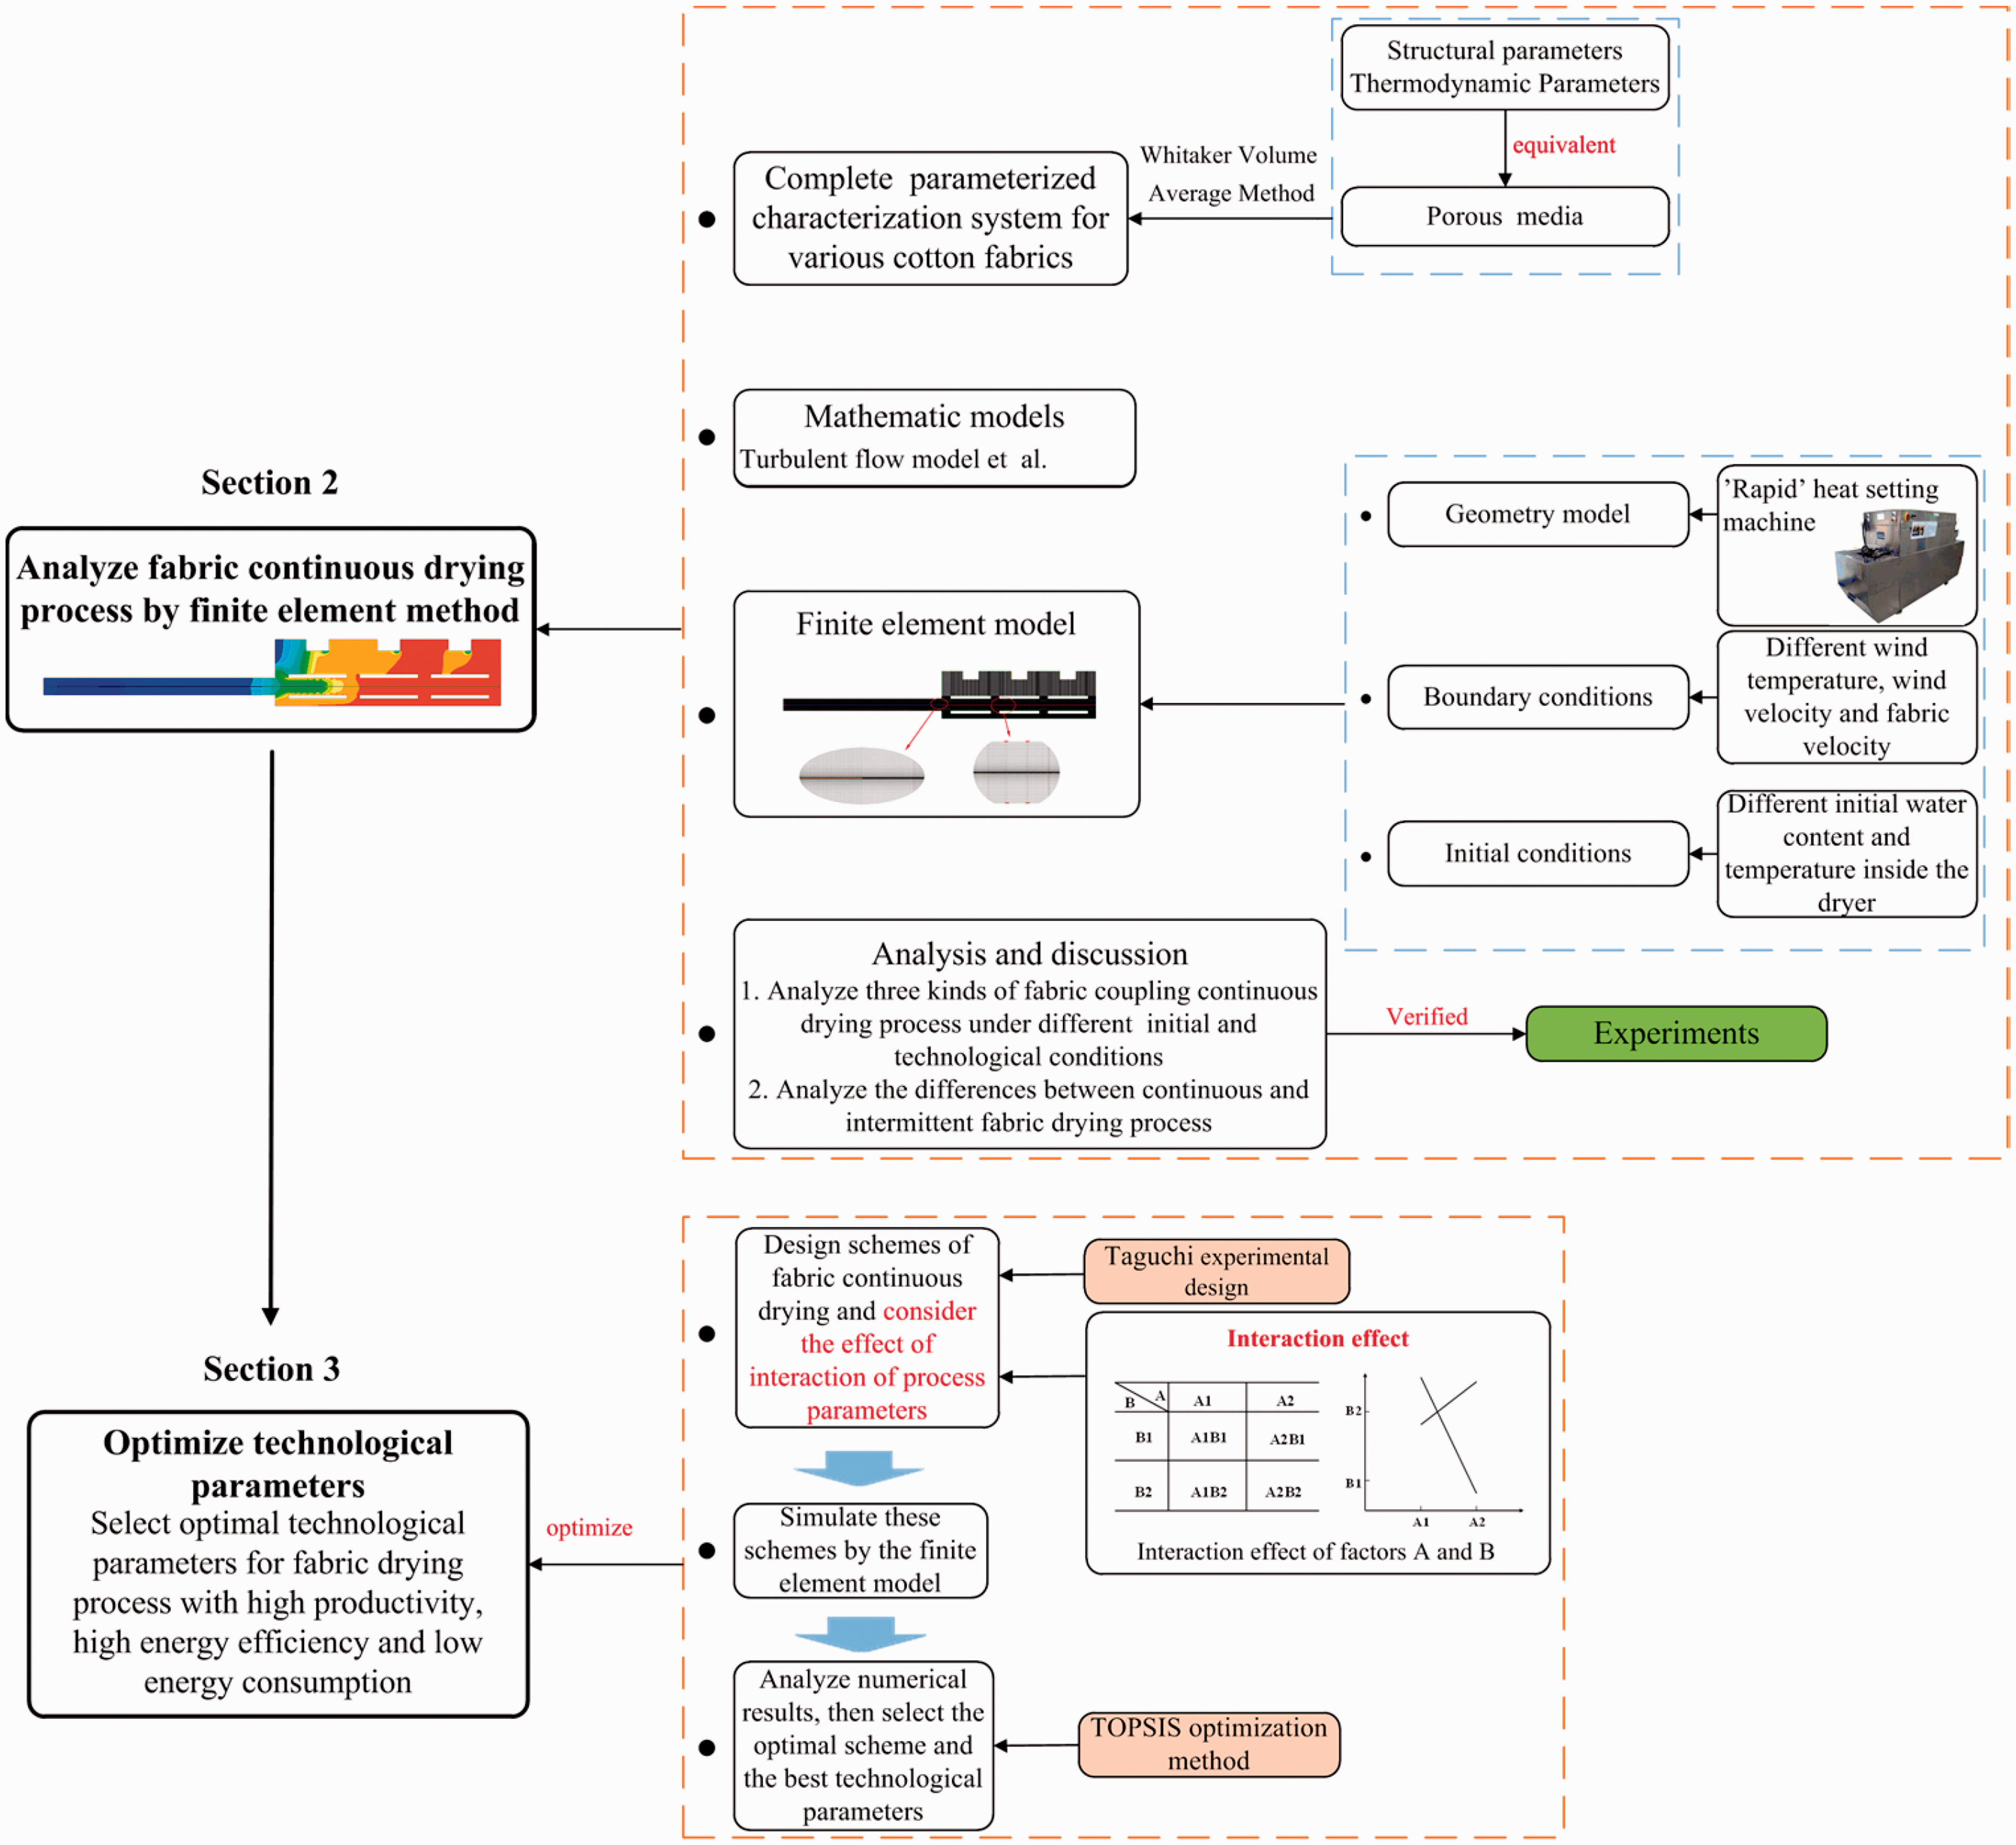
Applying the finite element method to analyze the fabric continuous drying process
Problem description
Drying is an integral part of the fabric printing and dyeing industry. There are several ways to dry fabrics in actual production; 18 in this paper, the hot air drying method is applied.
There are some methods of predicting the fabric drying process. For example, an output/input model can be established to detect the relationship between process parameters and the fabric drying process based on machine learning. 19 In this paper, the numerical simulation method is used. 20 On the basis of drying equipment and three kinds of fabric, fabric continuous drying processes are simulated on the software platform of FLUENT (Computational Fluid Dynamics software). Specifically, distribution of water content and surface temperature of the fabric along the direction of movement in the drying process are simulated under different process parameters.
Fabrics equivalent to porous media
A porous media model can be used to characterize porous materials. Porous materials consist of solid materials and a large number of tiny pores evenly separated by a skeleton. Similarly, fabrics are composed of yards and the spaces separated by the yards. Based on previous studies on heat and mass transfer during fabric drying,14,21 the fabric is equivalent to porous media in this paper. It is worth noting that the structure of porous media is difficult to describe at the macroscopic and microscopic levels. Whitaker uses mathematical methods to rigorously derive a volume average method (termed Whitaker Volume Average Method in many papers), 22 becoming the standard theoretical method to describe porous media in the simulation of the drying process. 23 The whole behavior of porous media can be described by certain eigenvalues through the volume average method, so that the porous media can be regarded as virtually continuous to study. As a result, the heat and mass transfer phenomena of porous media can be studied and analyzed using the continuous method.
Three kinds of fabrics are applied to simulate the fabric continuous drying process in this paper. The structural parameters, thermodynamic parameters, liquid phase parameters and gas phase parameters of water-bearing fabrics are obtained; then, the parameters of equivalent porous media are obtained as well.
Fabric parameters
No.1 fabric is a plain-woven fabric; No.2 and No.3 are weft-knitted fabrics, and the three kinds of fabric are single jersey structures. The two kinds of structures of the fabrics are shown in Figure 2-1. The study in this paper is on the base of research of Shuangqing Wang et al[17]. The thermodynamic and structural parameters of the fabrics have been measured in previous work. And the actual macrostructures and microstructures of three fabrics have also been illustrated in previous work.
Structures of woven and knitted fabrics.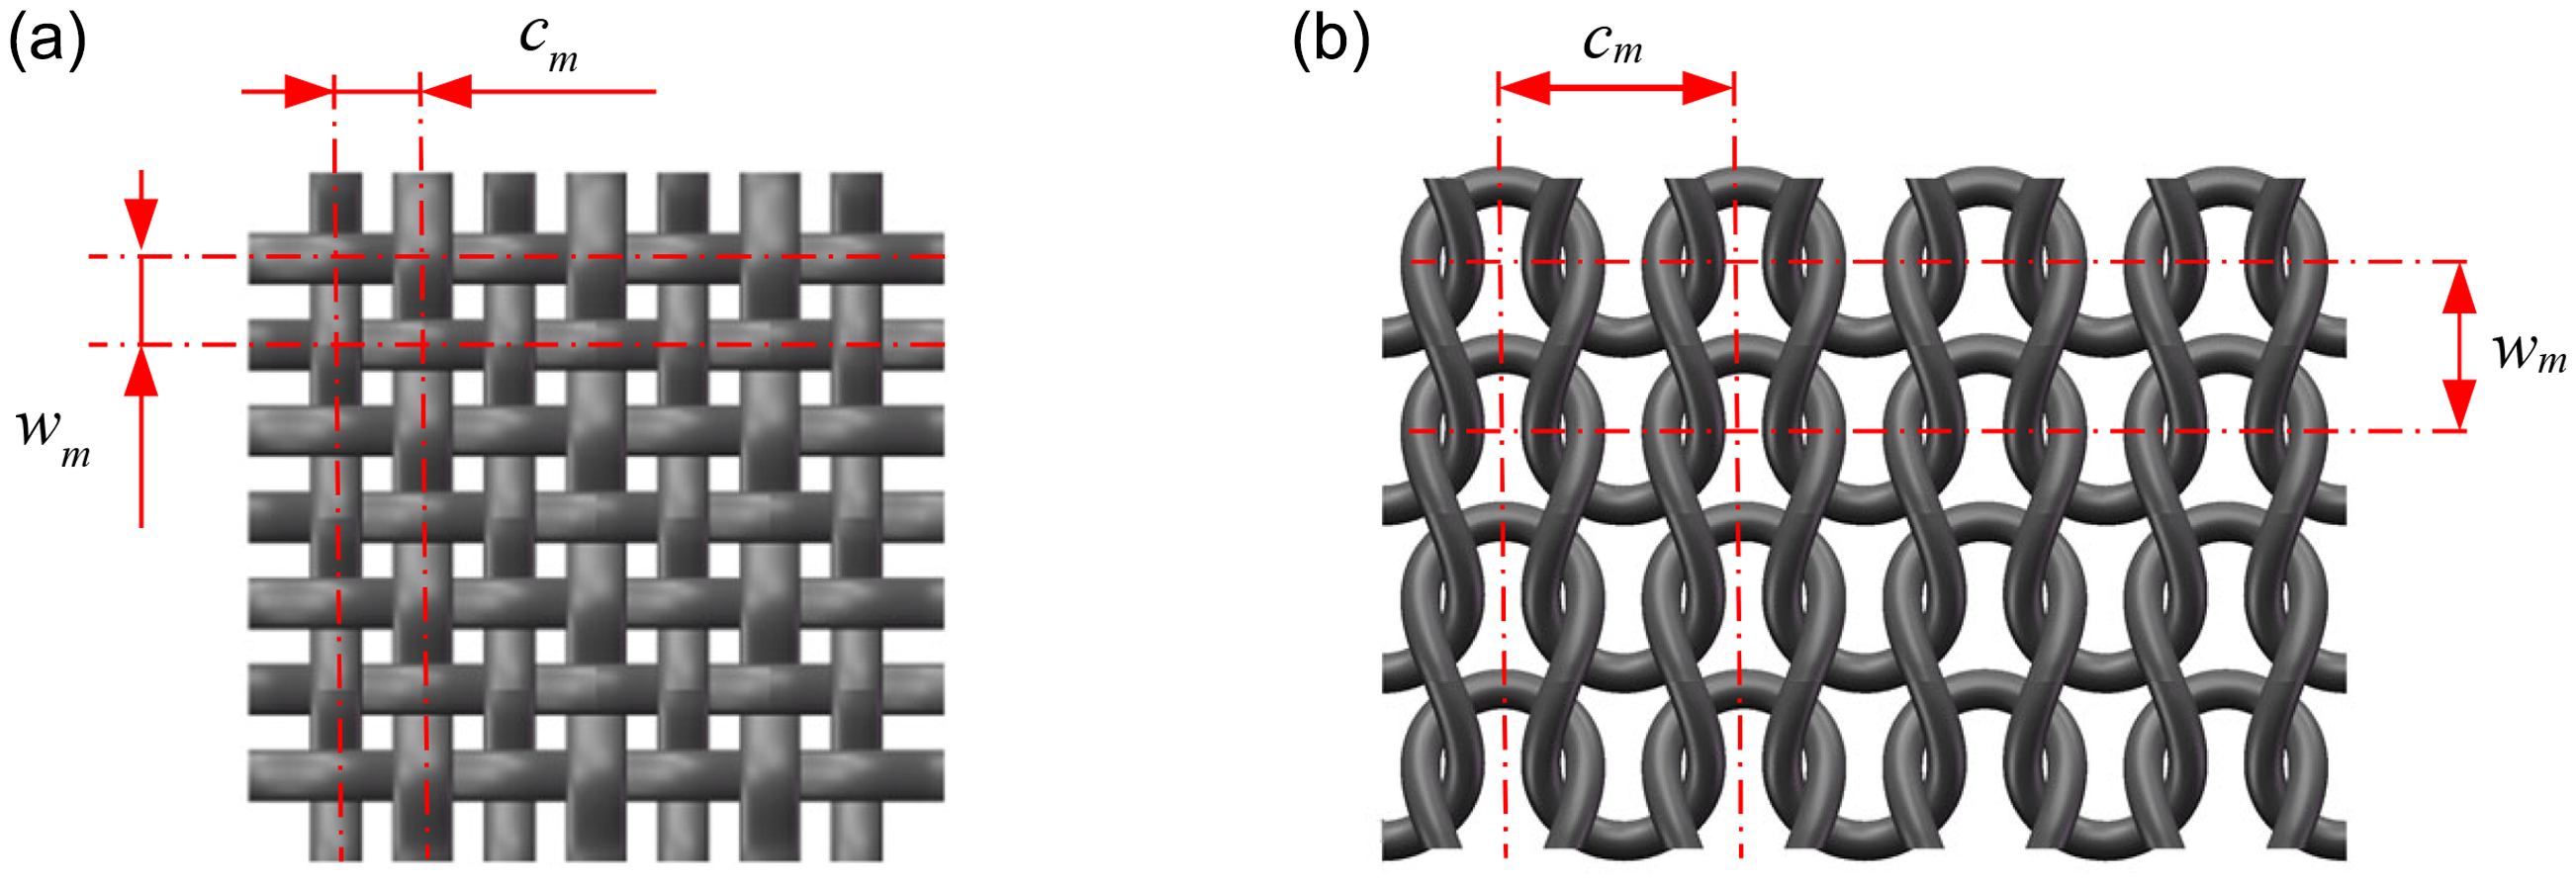
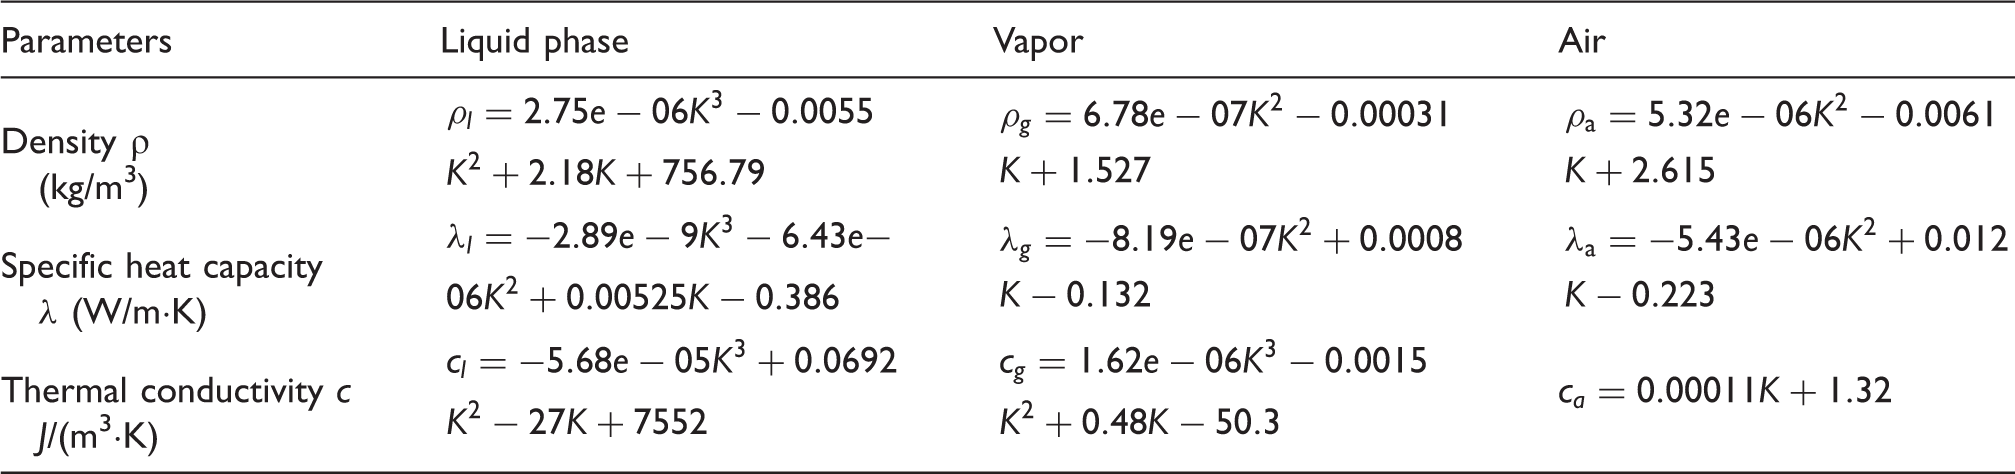
Liquid and gas phase parameters
Parameters of liquid and gas phases
Parameters of equivalent porous media
Data mining is a process of finding valuable and potentially useful information and knowledge hidden in a massive and random database, and it can also help make decisions. For instance, a set of sleep-related biophysical and geometric features are extracted from a high-resolution pressure-sensitive e-textile bed sheet. 25 Then, based on the technology of data mining, the relationship between the features and sleep stage identification can be detected. Data mining can be also used to classify consumers by analyzing their activities and behaviors on shopping websites. 26 Finally, the personalized shopping experience on smartphones can be developed to meet the need of different types of consumers.
Parameters of equivalent porous media
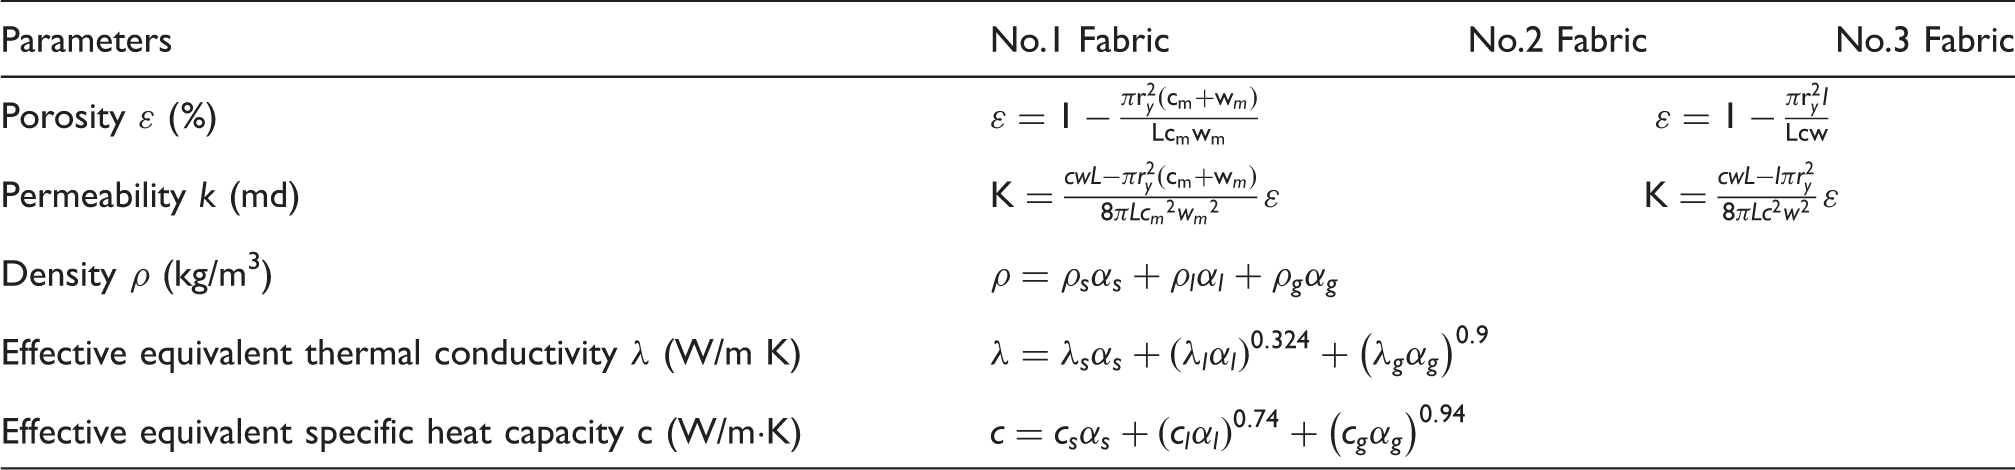
αl, αg and αs are the volume proportion of water, gas, and yards of moist fabrics, respectively.
Mathematic model
Based on the principle of conversation of mass, heat, pressure, and momentum, mathematic models were selected to quantitatively analyze the two-dimensional continuous fabrics drying process in the tenter. The study in this paper is based on Wang et al.'s research into the intermittent fabric drying process, 17 meaning that flow and transport models of the flow field in the tenter including mixture multiphase flow model, species transportation model and turbulence model, and fabrics heat-mass transfer models including energy conversation equation inside the fabric, surface heat transfer model and phase transformation model are all the same as the mathematical models in that paper. 17 In addition, a dynamic grid model and sliding grid model were selected to describe the continuous drying process with moving fabric. To achieve the integrity and readability of this paper, dynamic grid and sliding grid models are briefly described in this section. 32
Assumption
In the drying process, the shrinkage deformation of moving fabrics is neglected and the change of fabric shape is not considered. The drying air and the fabric are homogeneous, and the moisture content of the fabric is initially distributed evenly. The absolute humidity of drying air is 0%. It is considered that there is only heat conduction and convection heat transfer in the continuous drying process of fabric, and the effect of heat radiation is ignored.
Dynamic grid model
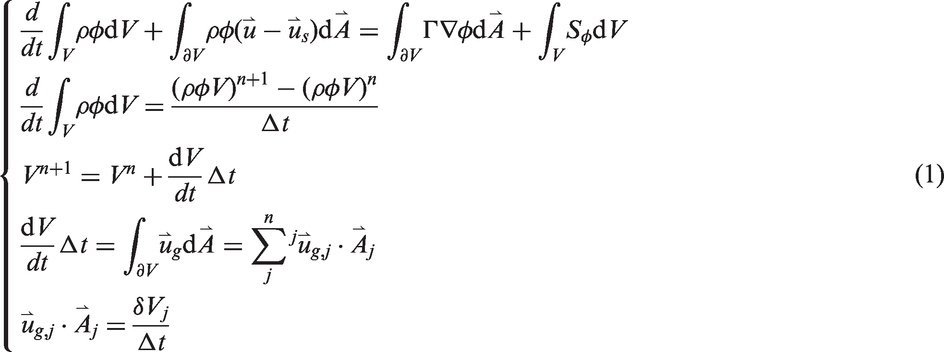
The dynamic grid model can be used to simulate the flow with changing flow fields caused by changing boundaries. 33 The volume of the present grids is calculated based on the grids in last step; flow situations of the next step are calculated based on present steps. By reasonably setting up the changes in dynamic grids, this model can accurately describe flow situations with changing boundaries. The model is as follows:
Conservation equation of the flux in each control unit:
Sliding grid model
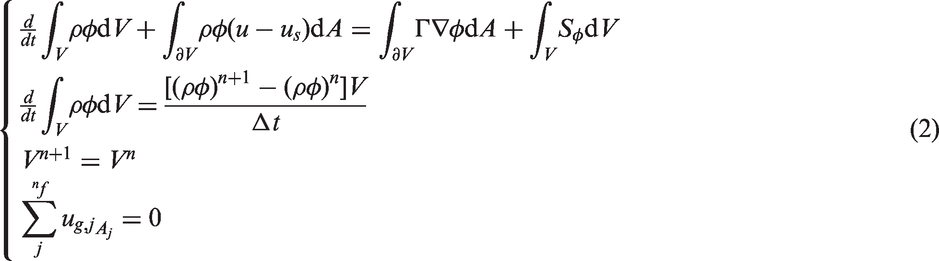
The sliding grid model allows relative sliding between adjacent grids. 20 Only when a mobile grid moves regularly can data be transferred through the interface. To calculate the flow on both sides of the interface, the positions of interfaces are determined based on the present step. The flux of heat and mass through interfaces are only calculated in coincided areas.
Conservation equation of the flux in each control unit:
Finite element model
Geometry model and grids
On the basis of a mini-tenter (a fabric drying machine used in the laboratory and produced by ‘Rapid’ company), the physical models of continuous drying process of the three kinds of fabric were built. These physical models are the same except for the thickness of the fabric. Next, the processes of building these physical models and grids are shown in Figure 3. Specifically, Figure 3(a) is the real tenter; the geometric model of the tenter is built according to its real sizes (as shown in Figure 3(b)), and the position of the fabric is also given. To reduce the amount of computation, a representative plane of this geometry is cut to analyze continuous drying process of fabric as shown in Figure 3(b). The grids of this cut plane are shown in Figure 3(c), and the position of the fabric is also given in Figure 3(c). To enhance the simulation accuracy, grids near the fabric are refined and details of the refined grids are shown in Figure 3(c).
Geometry and grids of the fabric drying model. (a) ‘Rapid’ Mini-Tenter; (b) geometry of the tenter and (c) grids.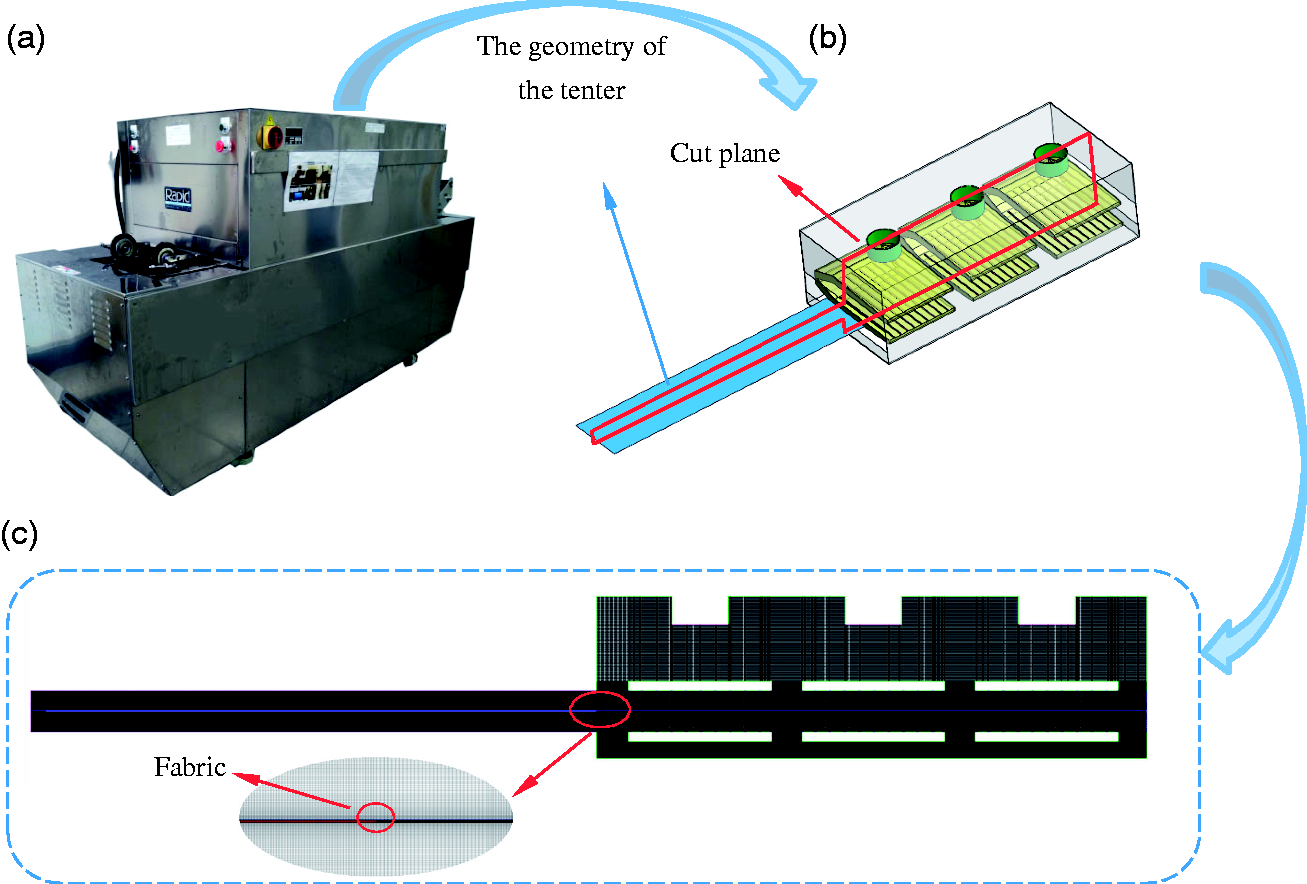
Boundary conditions and initial conditions
Boundary and initial conditions of this finite element model (as shown in Figure 4) are described in detail in this section. Furthermore, the front view and side view of the tenter are given (as shown in Figure 4(a–c)) to specifically describe the drying process. The geometry of this drying device (146 × 40 × 40 cm3) and the fabric are shown in Figure 4(a); air inlets, air outlets, and walls of the tenter are given in Figure 4(a). There are also two cut planes showing the front view and side view of the tenter. The side view is shown in Figure 4(b), in which the drying air circulation process including how air enters and goes out of the dryer is shown. The front view is shown in Figure 4(c); it is also the analysis plane of the finite element model. To be specific, positions of air inlets are given and the boundary types are velocity inlets; the orange lines represent the outlets of this model and the boundary types are pressure outlets, and the residual lines represent the walls of this model and the boundary types are insulated walls.
Boundary conditions of fabric drying model. (a) The geometry of the tenter; (b) the side view of the tenter and (c) the front view of the tenter.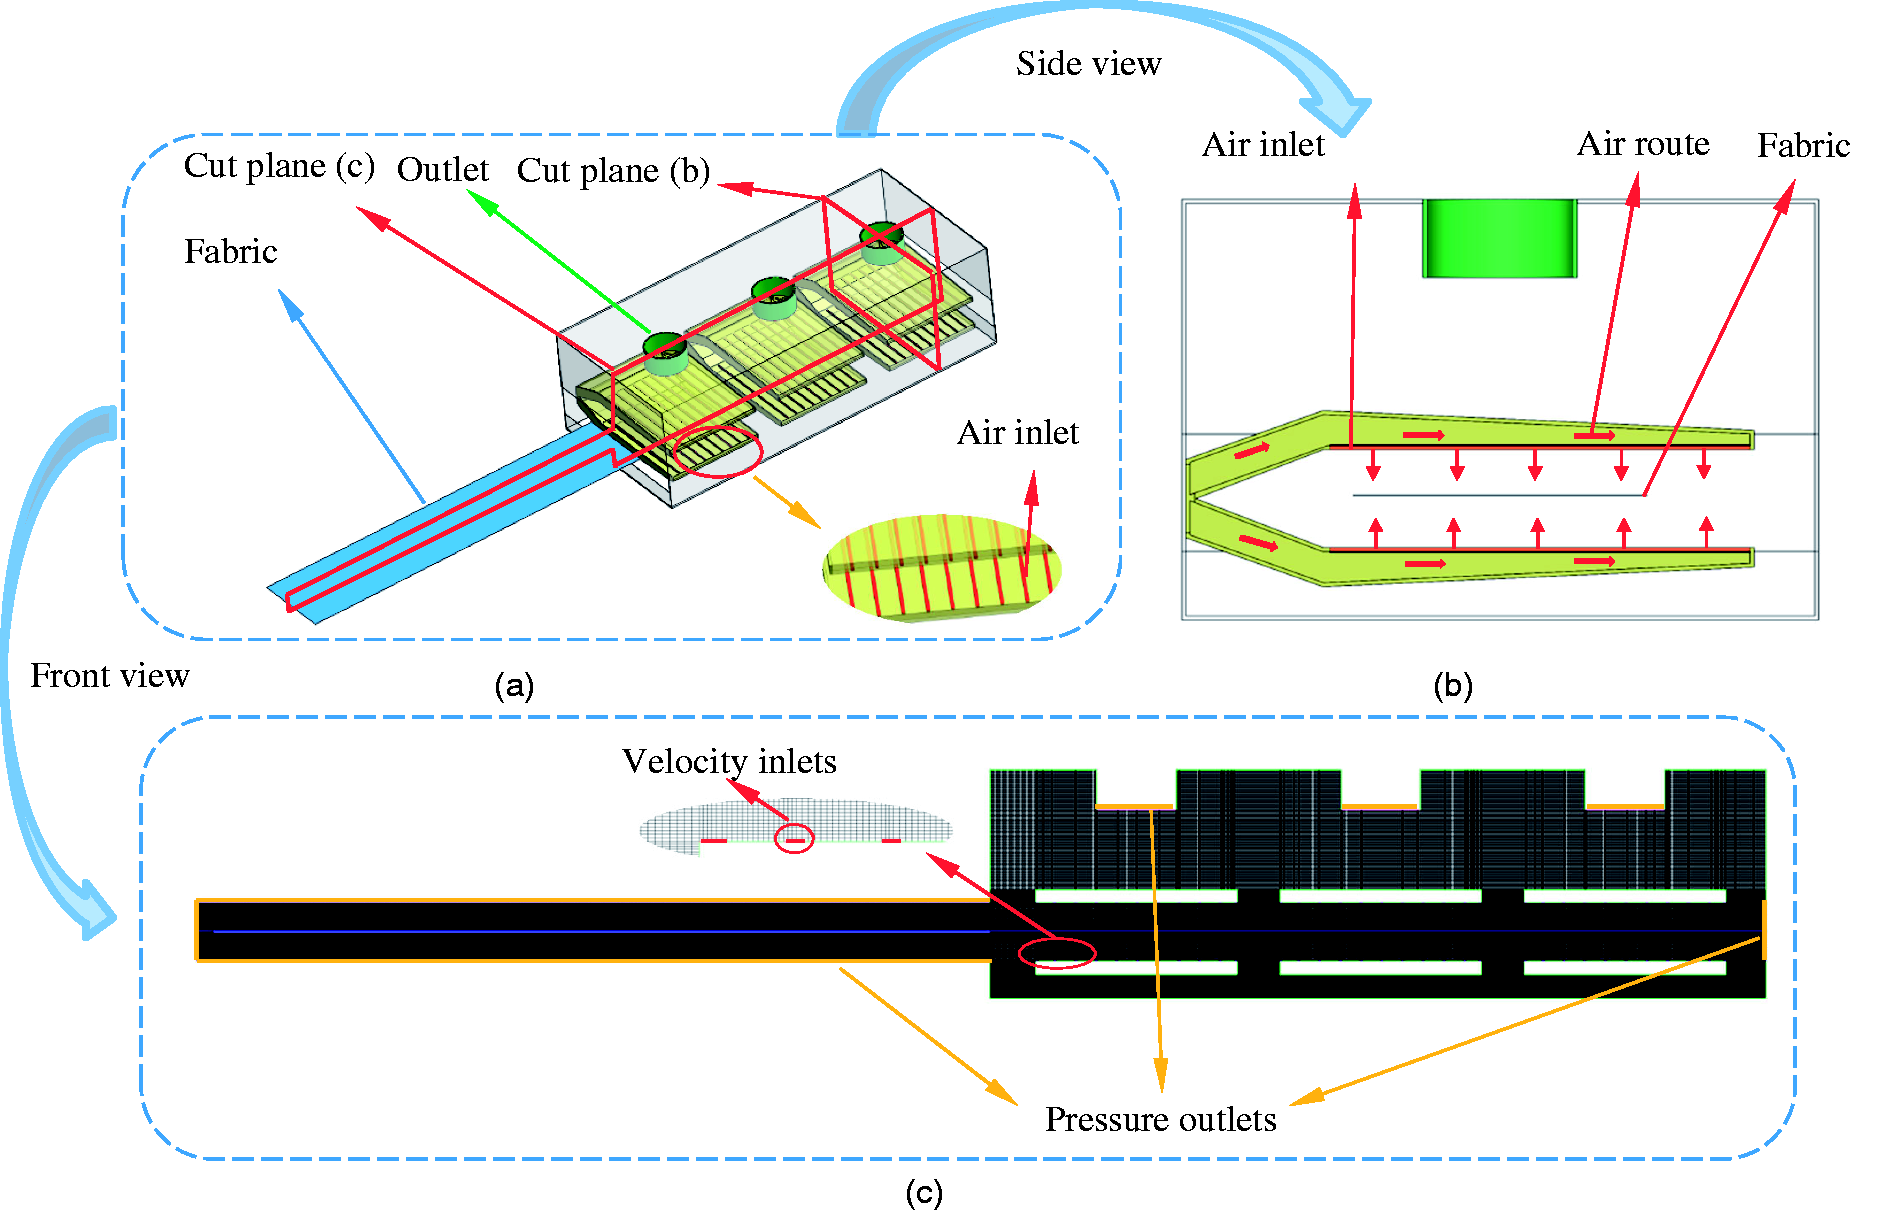
Boundary conditions and initial conditions

Fabric drying experiment
Experimental preparation
To verify the accuracy of the numerical results, corresponding experiments were carried out using the tenter. In these experiments, the three kinds of fabric are exactly the same as those used in the numerical models, with a size of 146 × 26 cm2 for each sample. All the technological conditions and initial environmental conditions in the tenter in the experiments are exactly the same as those in the numerical models, so there are 20 groups of experiment for each type of fabric.
Experimental materials Fabrics used in the experiments are exactly the same as those used in numerical models: No.1 fabric is a plain-woven fabric; No.2 and No.3 are weft-knitted fabrics, and the three kinds of fabric are single jersey structures. Fabric drying process The fabric drying process is shown in Figure 5. Specifically, Figure 5(a) shows the state at the beginning of the continuous drying process, giving the direction of movement of the fabric as well as the end points of the fabric (points A and B). When fabric drying begins, fabrics start to move in the direction of motion. When fabrics are fully in the tenter (as shown in Figure 5(b)), the drying process is complete. Data measuring Both fabric samples and the tenter used for the experiments are 146 cm long. For the fabric samples, the first 140 cm of the fabric sample is evenly divided into seven sections, each of which is 20 cm. The measure point is in the middle of each section. A section with a length of 6 cm remains, and the measure point is also in its middle. Hence, there are eight measure points in total (as shown in Figure 6). The distribution of surface temperature and water content of the three fabrics in the direction of motion during the drying process when they are fully in the tenter are measured at the measure points. Size of fabric sample. The whole process of fabric drying.
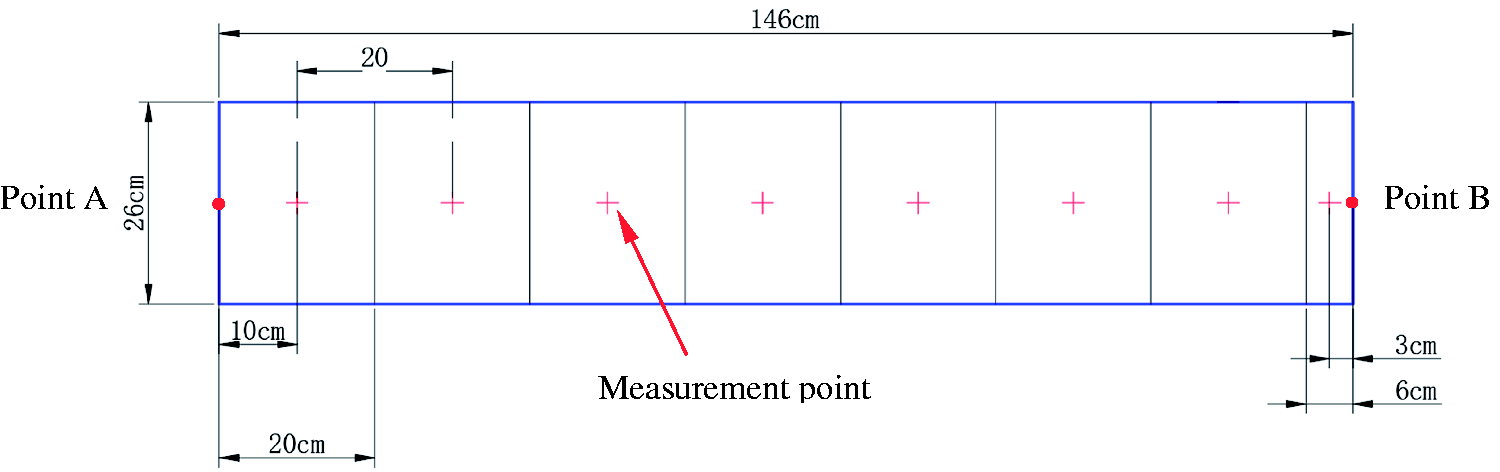
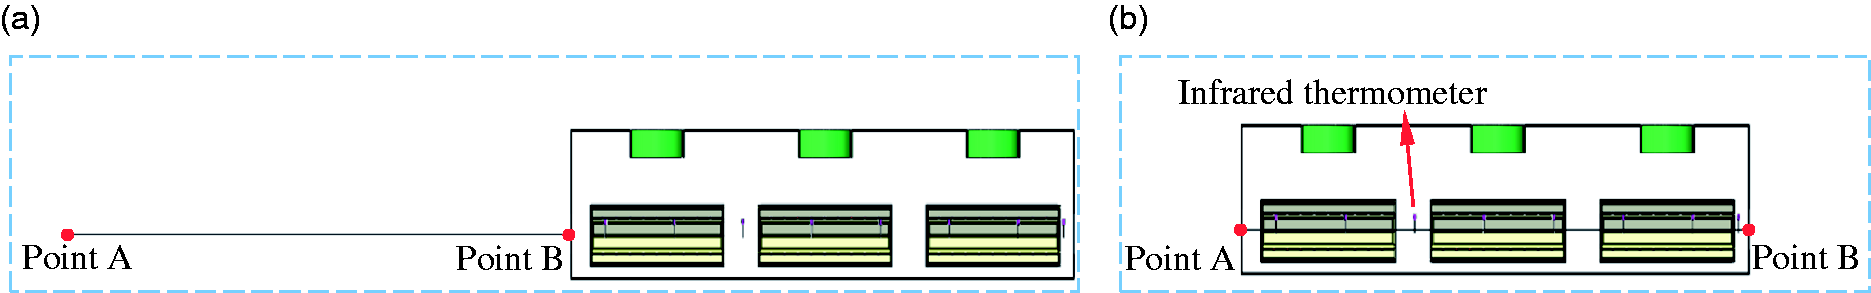
To measure the fabric surface temperature at these measure points in the drying process, an infrared thermometer is applied. The infrared thermometer is positioned directly over these points when fabrics totally enter the tenter (as shown in Figure 5). As a result, the surface temperature of the fabric can be measured instantaneously at the end of the drying process.
Experimental process
Step 1. The dry weight of fabric samples is measured by an electronic scale. Step 2. The fabric samples are immersed in water and then are taken out when they are immersed completely. Step 3. The wet fabric samples are rolled by the padder uniformly and water inside the fabric is partially pressed out. Step 4. The weight of the rolled fabric samples is measured by an electronic scale. Step 5. The rolled fabric samples are fixed on the frame and they gradually enter the tenter. Step 6. When fabrics completely enter the tenter, the fabric surface temperature at the measure points is measured. As a result, the distribution of fabric surface temperature in the direction of motion during the drying process is obtained. Step 7. When the surface temperature is measured, the fabric sample is taken out at the same time and its water content at the measure points is measured by a tester. In particular, at any part of the fabric where the rate of water content in the measure point exceeds 100%, this part of fabric will be cut down and the water content of this part will be measured by weighing method. As a result, the distribution of water content in the direction of motion in drying process can be obtained.
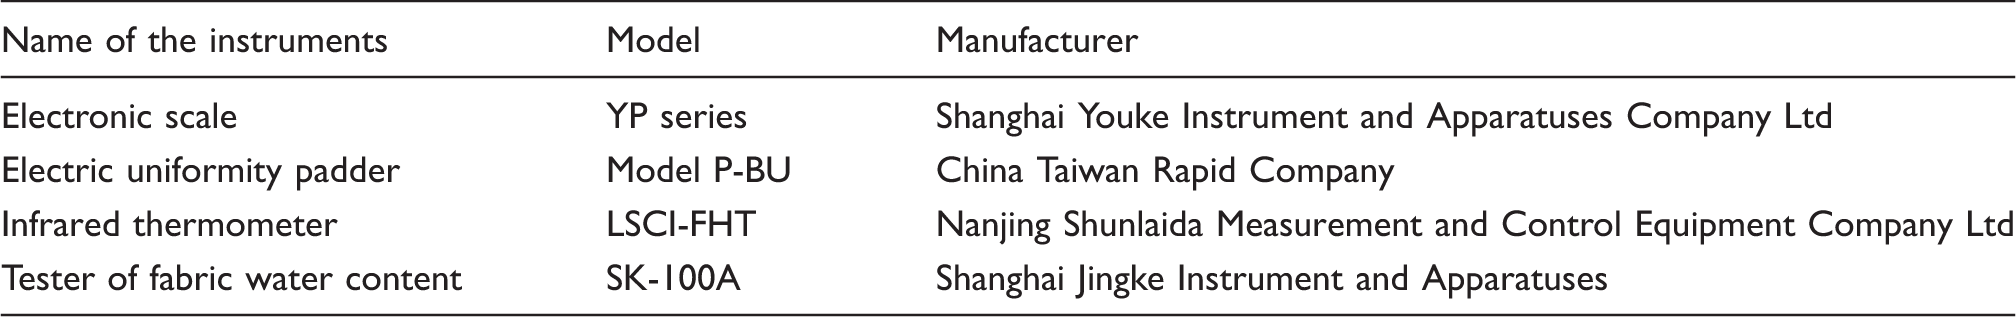
Experimental instruments
Comparison between experimental and numerical results
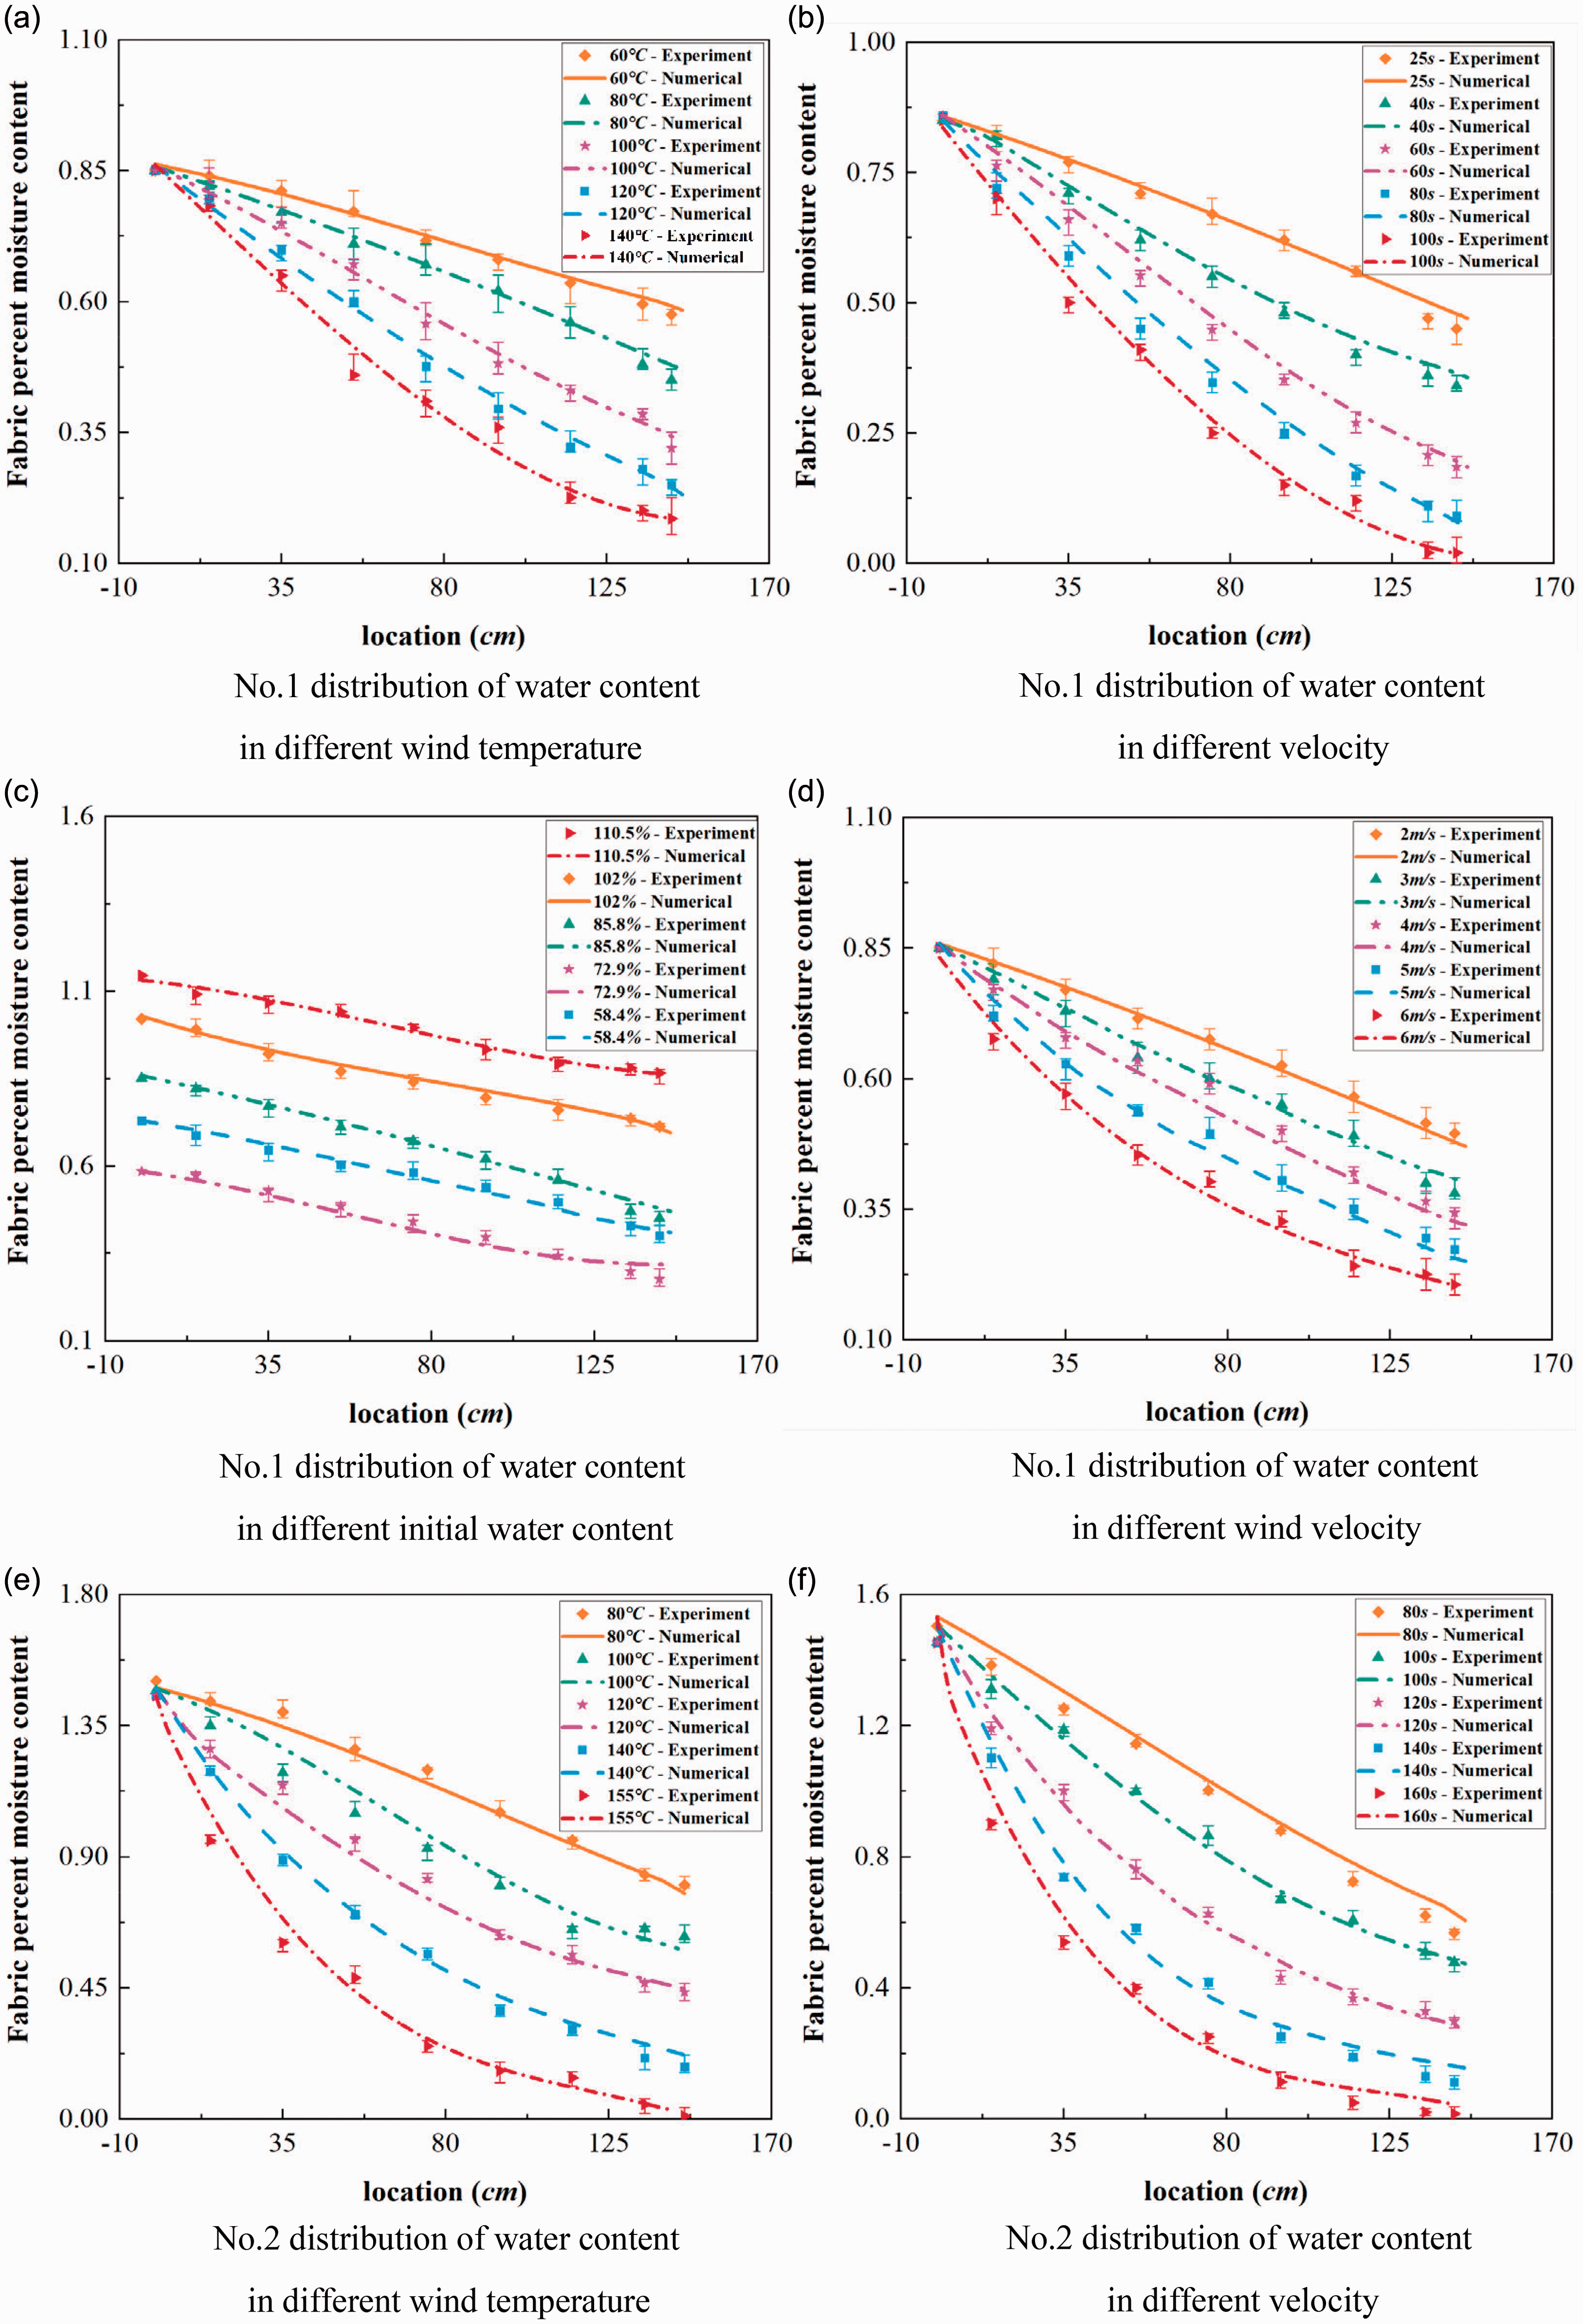
The numerical model proposed in this paper is applied to calculate the distribution of surface temperature and water content of the three kinds of fabric along the moving direction when fabrics completely enter the tenter in the continuous drying process. The validity of this model is verified through absolute errors between numerical and experimental results (as shown in Figures 7 and 8). There are three groups of experimental data in Figure 7 and Figure 8 with the same initial and process parameters, and the error bars are used to show the experimental results. The center point is the average value of three experimental measurements, and the upper and lower points are the maximum and minimum values. As can be seen in Figure 7, the distribution of surface temperature of these fabrics in different wind temperatures, fabric velocities, initial water contents, wind velocities, and fabric species when the fabric completely enters the tenter in the drying process predicted by this model are in good agreement with the corresponding experimental values: the mean absolute error is less than 2.15℃ and the biggest absolute error is 4.35℃. Predicted values of distribution of fabric water content along the moving direction under different process parameters when fabrics completely enter the dryer in the drying process, together with corresponding experimental results, are plotted in Figure 8. As can be seen, there is a good agreement between experimental and predicted values with the average absolute error (4.22%) and maximum absolute error (7.71%). The errors are small. In addition, the calculation error of the finite element model is only about 0.01%, so the calculation error of the model can be ignored. As a result, this indicates that the finite element model built in this paper can effectively predict the continuous drying process of different kinds of fabric under different initial situations and technological conditions.
Comparison of results of simulations and experiments of distribution of fabrics surface temperature along the moving direction. Comparison of results of simulations and experiments of distribution of fabrics water content along the moving direction.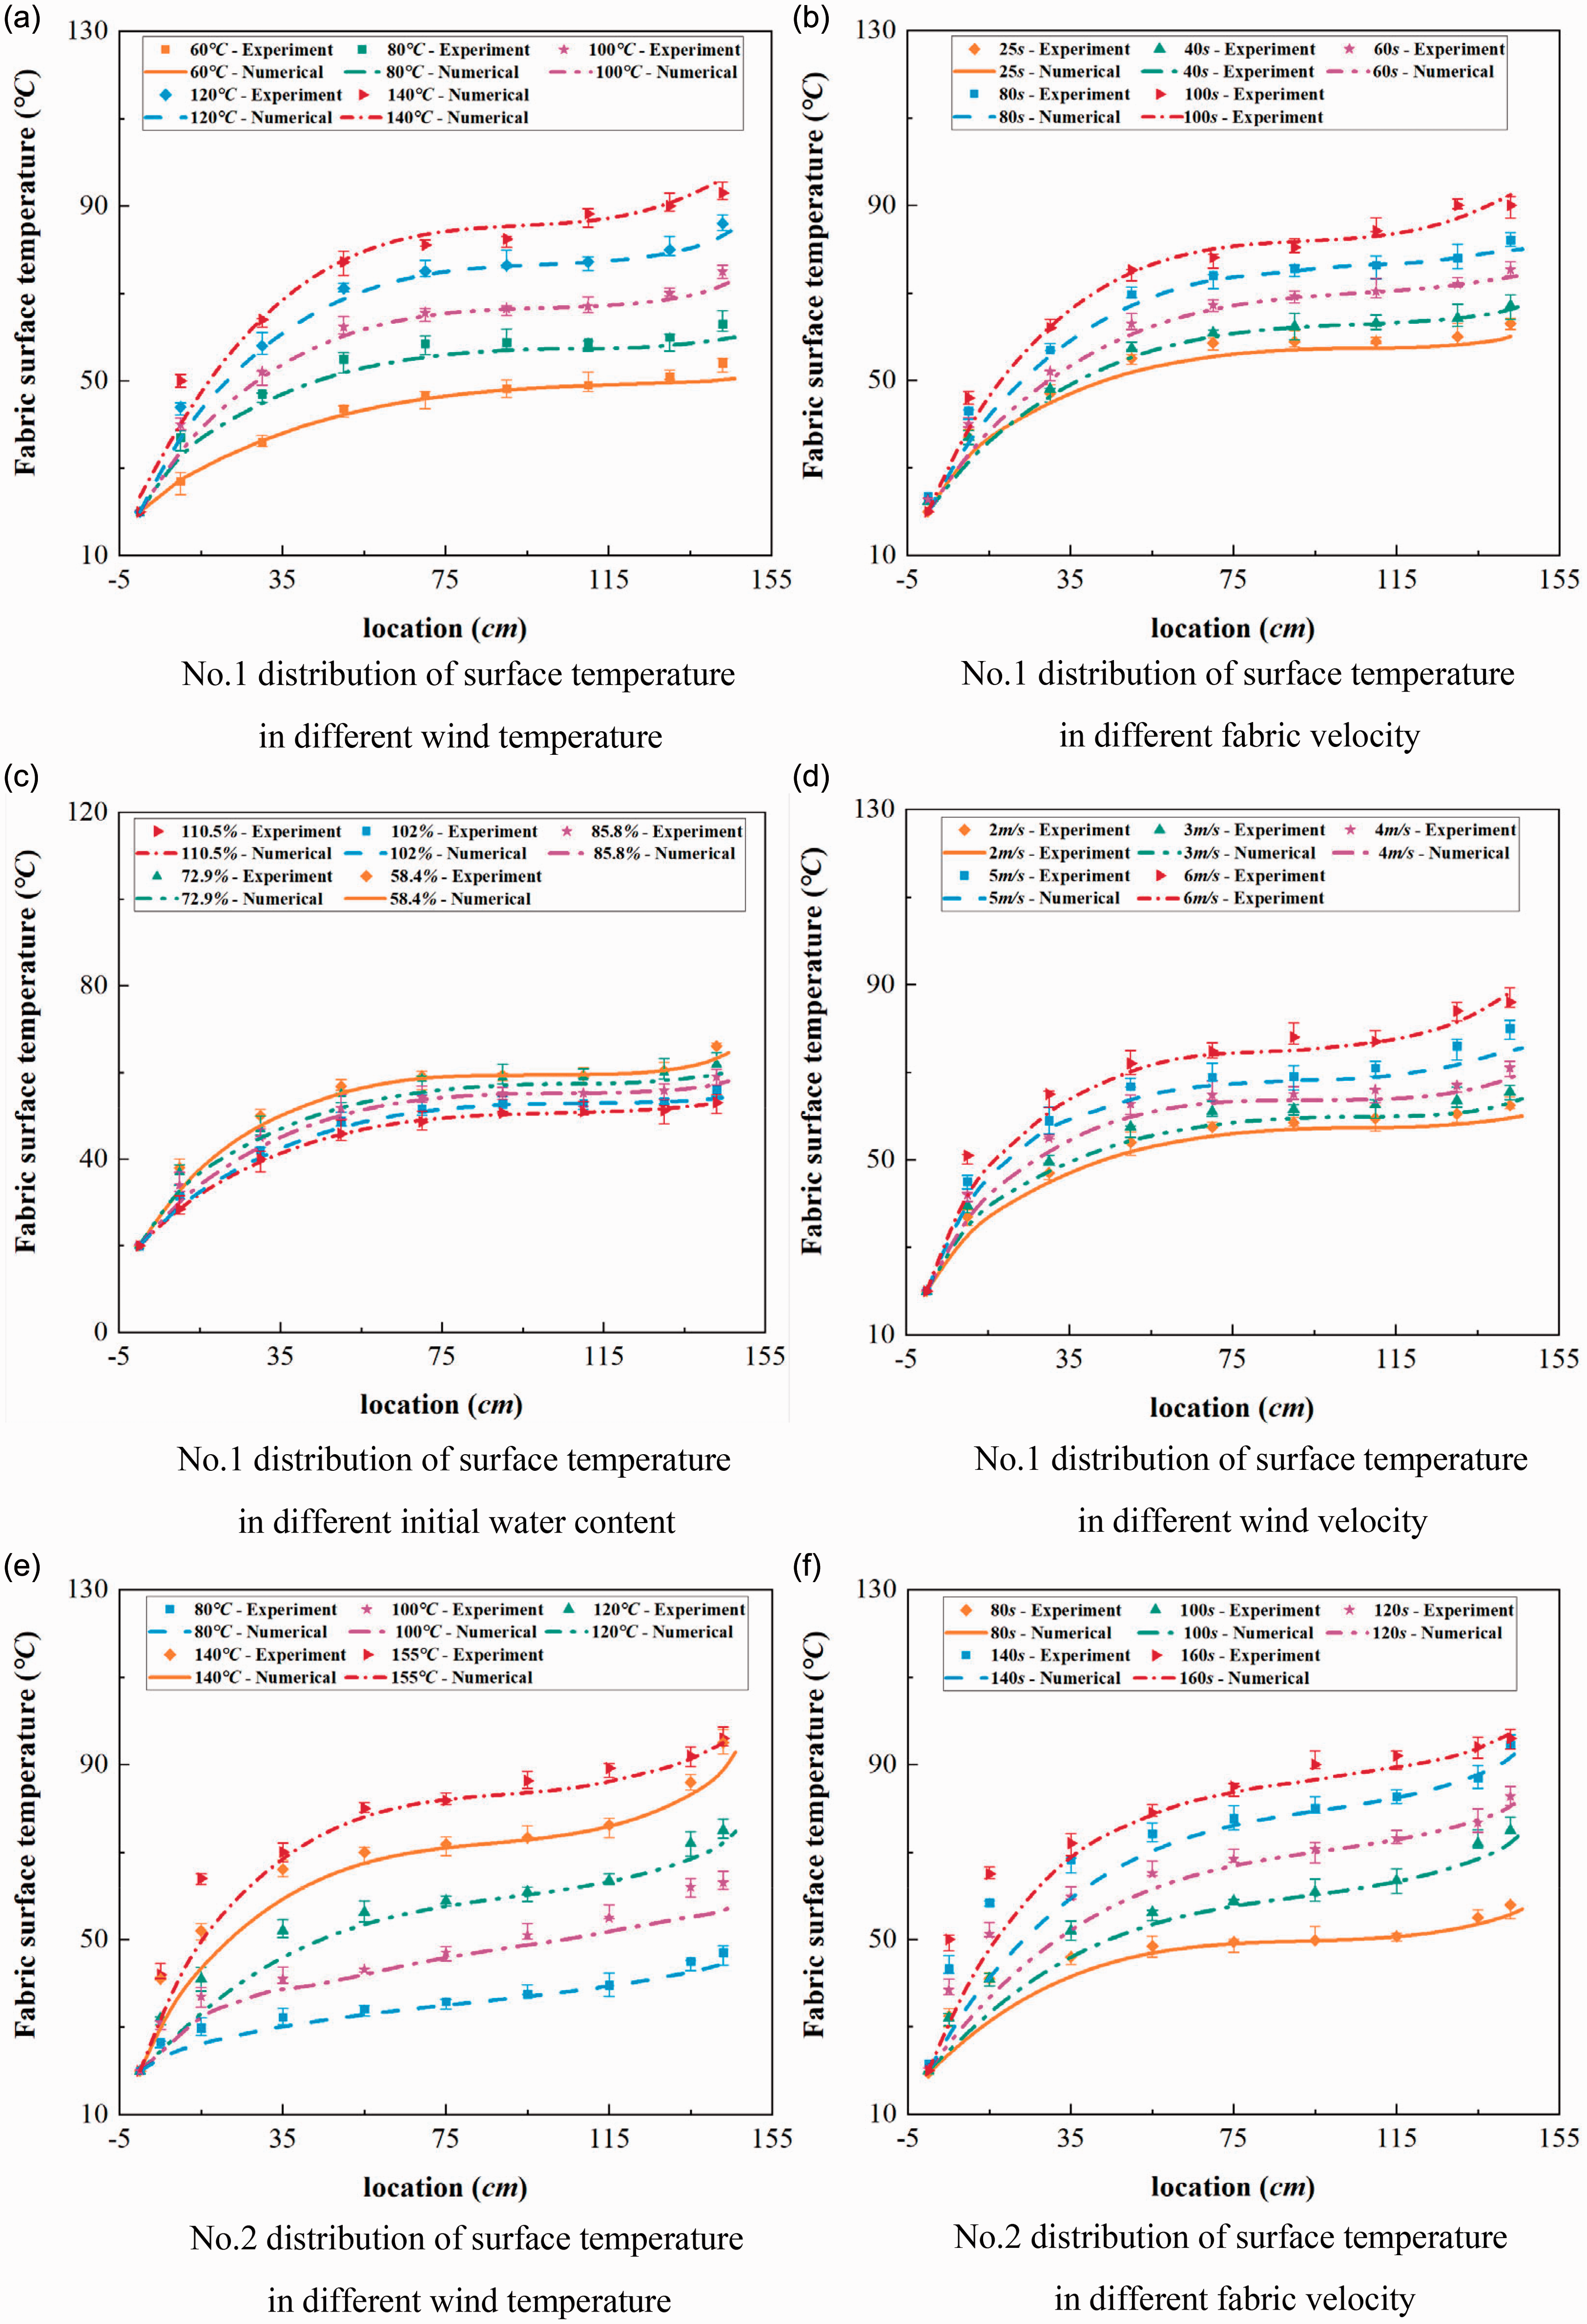
Results and discussion
Factors influencing drying process
As shown in Figure 7 and Figure 8, there are three drying stages in the fabric drying process.34 The first is a stage of rapid temperature increase. When fabrics begin to enter the tenter, the temperature between fabrics and environment in the tenter is high, so the wet fabrics absorb energy rapidly, most of which is used to raise their temperature. As a result, surface temperature of the fabrics will rise quickly in a very short time but the drying rate will be small. The change of water contents during the drying process cannot be found in Figure 8 because this stage is short. Then, the drying process reaches the second stage (temperature stabilization stage). In this stage, most of the energy absorbed by the fabrics is used to evaporate water in the fabrics, so the drying rate is large but their surface temperature rises slowly. Subsequently, when the water content inside fabrics is lower than the critical saturation,30 the drying process reaches the third stage (secondary temperature rising stage). In this period, with the water content inside the fabrics lower than the critical saturation, the moisture cannot spread to the surface of the fabrics for evaporation. Consequently, the heat reaches the surface and then passes to the fabric interior for moisture evaporation; as a result, the evaporation rate reduces. Meanwhile, at this stage, with a small amount of heat used to evaporate moisture, most of the heat is used to raise the fabric temperature. As a result, the surface temperature of the fabrics increases more quickly again.
Both numerical and experimental results are shown in Figure 7. As can be seen from Figure 7(a), (e), and (i), wind temperature and drying span can obviously influence fabric surface temperature in the continuous drying process. With the decrease in wind temperature, it will take more time to reach the second stage of fabric drying, and the second stage will become longer. When wind temperature is too low, the fabric drying process cannot even enter the third stage. Similarly, as shown in Figure 7(b), (f),and (j), when the fabric drying span is too short, the fabric drying process cannot enter the third stage. This is because with different wind temperature and drying time, a different amount of energy is provided. The lower the wind temperature and the shorter the drying time, the smaller the amount of energy that is provided in drying process and the lower surface temperature of fabrics will be. 35 As shown in Figure 7(d), (h), and (l), when the wind velocity decreases, fabric surface temperature will increase slowly, and the first and second stages of fabric drying will be longer. This is because with different wind velocity, a different amount of energy is provided, and the surface temperature of fabrics will be different. It is worth noting that wind velocity has a less significant influence on the surface temperature of fabrics than wind temperature and drying time, because wind velocity does not change significantly in different fabric drying processes (just 1 m/s). As a result, the effect of different wind velocities on fabric surface temperature is relatively small. As shown in Figure 7(c), (g), and (k), when the initial water content is higher, the fabric surface temperature will rise more slowly, and it will take more time to reach the third stage of fabric drying. It cannot even enter the third stage when the initial water content is too high. This is because the higher the initial water content, the more energy is needed to raise the water temperature. The initial water content has a small impact on fabric surface temperature in the drying process: when the initial water content increases about 14%, fabric surface temperature increases only about 2.21℃ on average.
To better understand the mechanism of the fabric continuous drying process, the experimental results and predicted values of the drying rate during the drying process are plotted in Figure 8. As shown in Figure 8(a), (e), and (i), wind temperature and drying span can affect the drying rate of the drying process greatly. When wind temperature decreases, the fabric drying rate will be smaller. The first and second stages of fabric drying will become longer, and fabric drying cannot even enter the third stage when the wind temperature is too low. Similarly, as shown in Figure 8(b), (f), and (j), when the drying span is too short, the third stage of fabric drying is not reached. This is because with the lower wind temperature and shorter drying span, a smaller amount of energy is provided, and the smaller the drying rate is. As shown in Figure 8(d), (h), and (l), with the decrease in wind velocity, the fabric drying rate will be smaller, and the first and second stages of fabric drying will last longer. When the wind velocity is too low, drying cannot even enter the third stage. This because the lower the wind velocity, the smaller the amount of energy that is provided, and the smaller the drying rate is. However, wind velocity cannot affect the drying rate as significantly as wind temperature and drying span can, because wind velocity does not change significantly in different drying processes (just 1 m/s). Meanwhile, as shown in Figure 8(c), (g), and (k), when the initial water content is larger, it will take a longer time to enter the third stage of fabric drying. When the initial water is too high, drying cannot even enter the third stage. The reason is that the greater the initial water content in the fabric, the more water is required to evaporate and the smaller the drying rate will be. However, initial water content has a small effect on the drying rate.
Differences between intermittent and continuous drying processes
It is worth noting that compared with the results of fabric surface temperature and drying rate in the intermittent drying process from Wang et al., 17 the values of surface temperature and drying rate of moving fabrics in the continuous drying process under the same technological conditions are lower in this paper. The reason is that in the continuous drying process, fabrics with high water content are delivered to the dryer constantly; the rate of drying is fast all the time in the front part of the dryer, and a large amount of vapor is constantly and rapidly generated and cannot be completely discharged in time, leading to high humidity and a low temperature of the environment inside the dryer. By contrast, in the intermittent drying process, the water content in fabrics is fixed, so the water vapor inside the dryer from the moist fabric will reduce with time. As a result, in the intermittent drying process, the environmental humidity is lower and the temperature is higher in the tenter compared with the continuous drying process under the same process conditions, so the fabric surface and fabric drying rate is higher.
From the comparison between intermittent and continuous drying processes of fabrics, there are obvious differences due to the constantly high drying rate of moist fabrics, as well as the fast and constant generation of a large amount of vapor in the continuous drying process. Thus, the continuous fabric drying process is more complex, and it is also more worthwhile to study considering most factories use continuous fabric drying molds.
Optimizing technology parameters of the fabric drying process
The finite element model can calculate the fabric drying process under different process parameters accurately. However, it is not easy to use the model to directly select the optimal process conditions of fabric drying, as it will waste much time and considerable computing resources without a scientific optimization method.
In this section, based on the numerical model, an efficient experimental design method and a scientific optimization method are proposed to optimize the process parameters of the continuous fabric drying process.
Optimization methods
To choose a group of optimal technological parameters for the continuous drying process and improve productivity and energy consumption, the Taguchi method is applied to design fabric continuous drying schemes. 13 The influence of reciprocal actions of process parameters on fabric drying process is also considered. The strong point of this method is that it enables fewer representative experiments to represent all the experiments, thereby reducing the number of experiments. Valuable results can be obtained by analyzing the results of less representative experiments. This method can also discover the interaction effect of influencing factors on experimental results, and can also identify the influence intensity of each factor and thus determine the main factor that affects experimental results. 36 The drawback of this method is that it can only choose the best solution among the experiments which have been designed, and cannot choose the globally optimal solution. It is also difficult to identify the law of the change of factors on experimental results. However, these problems have been tackled. The method of finding the globally optimal solution is shown in the following sections, and the change of water content and surface temperature in the fabric continuous drying process with different process parameters is also presented.
Next, the finite element model verified in the above sections is applied to simulate the fabric continuous drying process according to these schemes. Finally, the TOPSIS method is applied to analyze and compare the numerical results according to given evaluation indicators.
37
While the TOPSIS method is used to analyze and compare results of these schemes, the COPRAS method (Complex Proportional Assessment of Alternatives) is applied to determine the weight coefficient of each evaluation indicator.
38
The TOPSIS method can make full use of raw data and analysis of its results can accurately show the differences among the schemes.
39
The TOPSIS method also has a wide range of application, because there is no strict restriction on the data distribution and sample size. The COPRAS method is used to determine the importance of evaluation indicators according to experience of experts. This method has the strength of easy calculation, wide application, and better valuation effect. The indicators proposed in this paper are according to experience of engineers in actual production, so this method is suitable to weigh these indicators. The drawback of the TOPSIS method is that it can only shown the differences of experiments which have been designed; it cannot show the distance between each scheme and the global optimal scheme. But this problem has been tackled in the following sections. The TOPSIS method and COPRAS method also have the drawback that both methods are subjective to a certain extent: the evaluation indicators are given and their respective importance is explained by engineers. This problem has been tackled, as in different factories the requirements of the fabric drying process are different, so in actual production, the evaluation indicators and the importance of indicators should be ensured by engineers according to actual conditions. If readers are interested in Taguchi, TOPSIS, and COPRAS methods, there is some useful literature to consult.13,36−38 On the base of the Taguchi method and the TOPSIS method, the steps of optimizing process parameters according to evaluation indicators are shown in Figure 9.
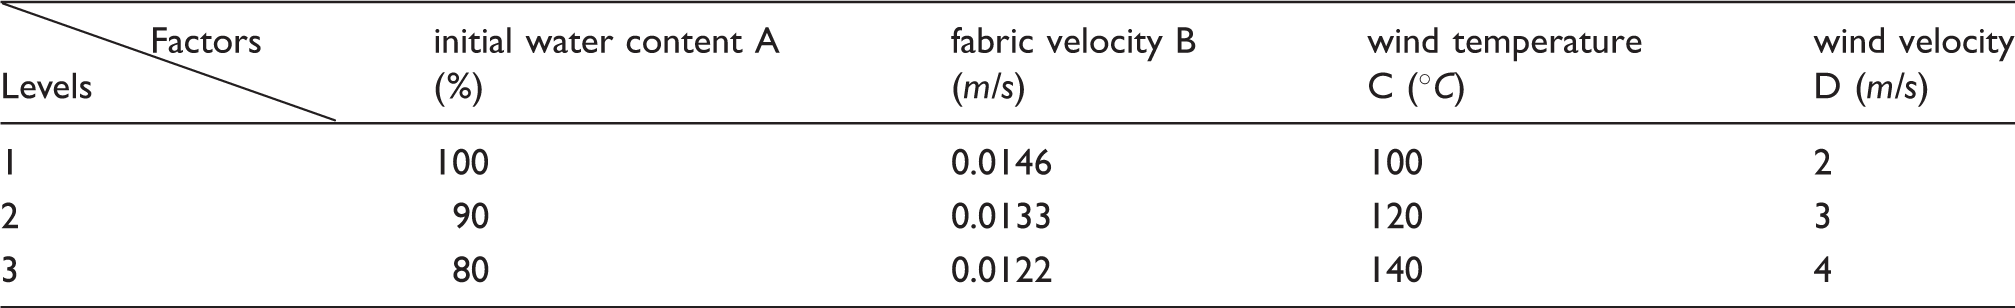
Step 1. Design schemes of the continuous fabric drying process. In this section, No.2 fabric is applied to select a group of optimal process parameters of the fabric drying process. When using the Taguchi method to design fabric drying schemes, there are three points: optimization objects, levels of optimization objects, and evaluation indicators. Specifically, there are four optimization objects and three levels of optimization object. Optimization objects are initial water content of fabrics (A), fabric velocity (B), wind temperature (C), and wind velocity (D). Three evaluation indicators of drying span, energy consumption, and energy efficiency are proposed to rate the fabric drying schemes designed by the Taguchi method. The equations of these evaluation indicators are shown in Appendix A. It is worth noting that these evaluation indicators are usually used to rate technological parameters in actual production.40,41 Step 2. Simulate the continuous fabric drying process schemes. After designing fabric drying schemes, the finite element model is used to simulate these schemes. Then, the TOPSIS method is applied to analyze the numerical results and select the optimal process parameters. Step 3. Standardize evaluation indicators. The evaluation indicators of the schemes should be standardized because they have different dimensions. If there are m schemes A1, A2, … , Am, and n evaluation indicators X1, X2, … , Xn, the value of evaluation indicator Xj of schemes Ai is x
ij
(i = 1, 2, … , m; j = 1, 2, … , n). Standardize data: When x
ij
is the beneficial data
42
:
When x
ij
is the cost data
42
:
Step 4. Weigh each evaluation indicator. When the fabric drying schemes are analyzed and compared according to evaluation indicators, different weights should be given to different indicators.
Steps of optimizing technology parameters.


The COPRAS method is used to obtain the weight coefficient of each evaluation indicator. The COPRAS method is described in Appendix A.
Step 5. The closeness between each scheme and plus ideal scheme.
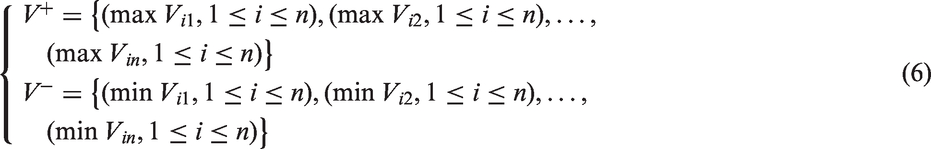
The plus and minus ideal value of each evaluation indicator:
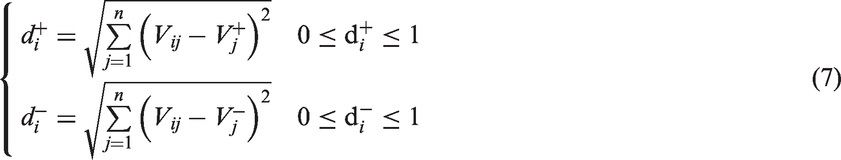
The distance between each scheme and the ideal scheme:
The closeness between each scheme and the plus ideal scheme:

Optimization process
Experimental design
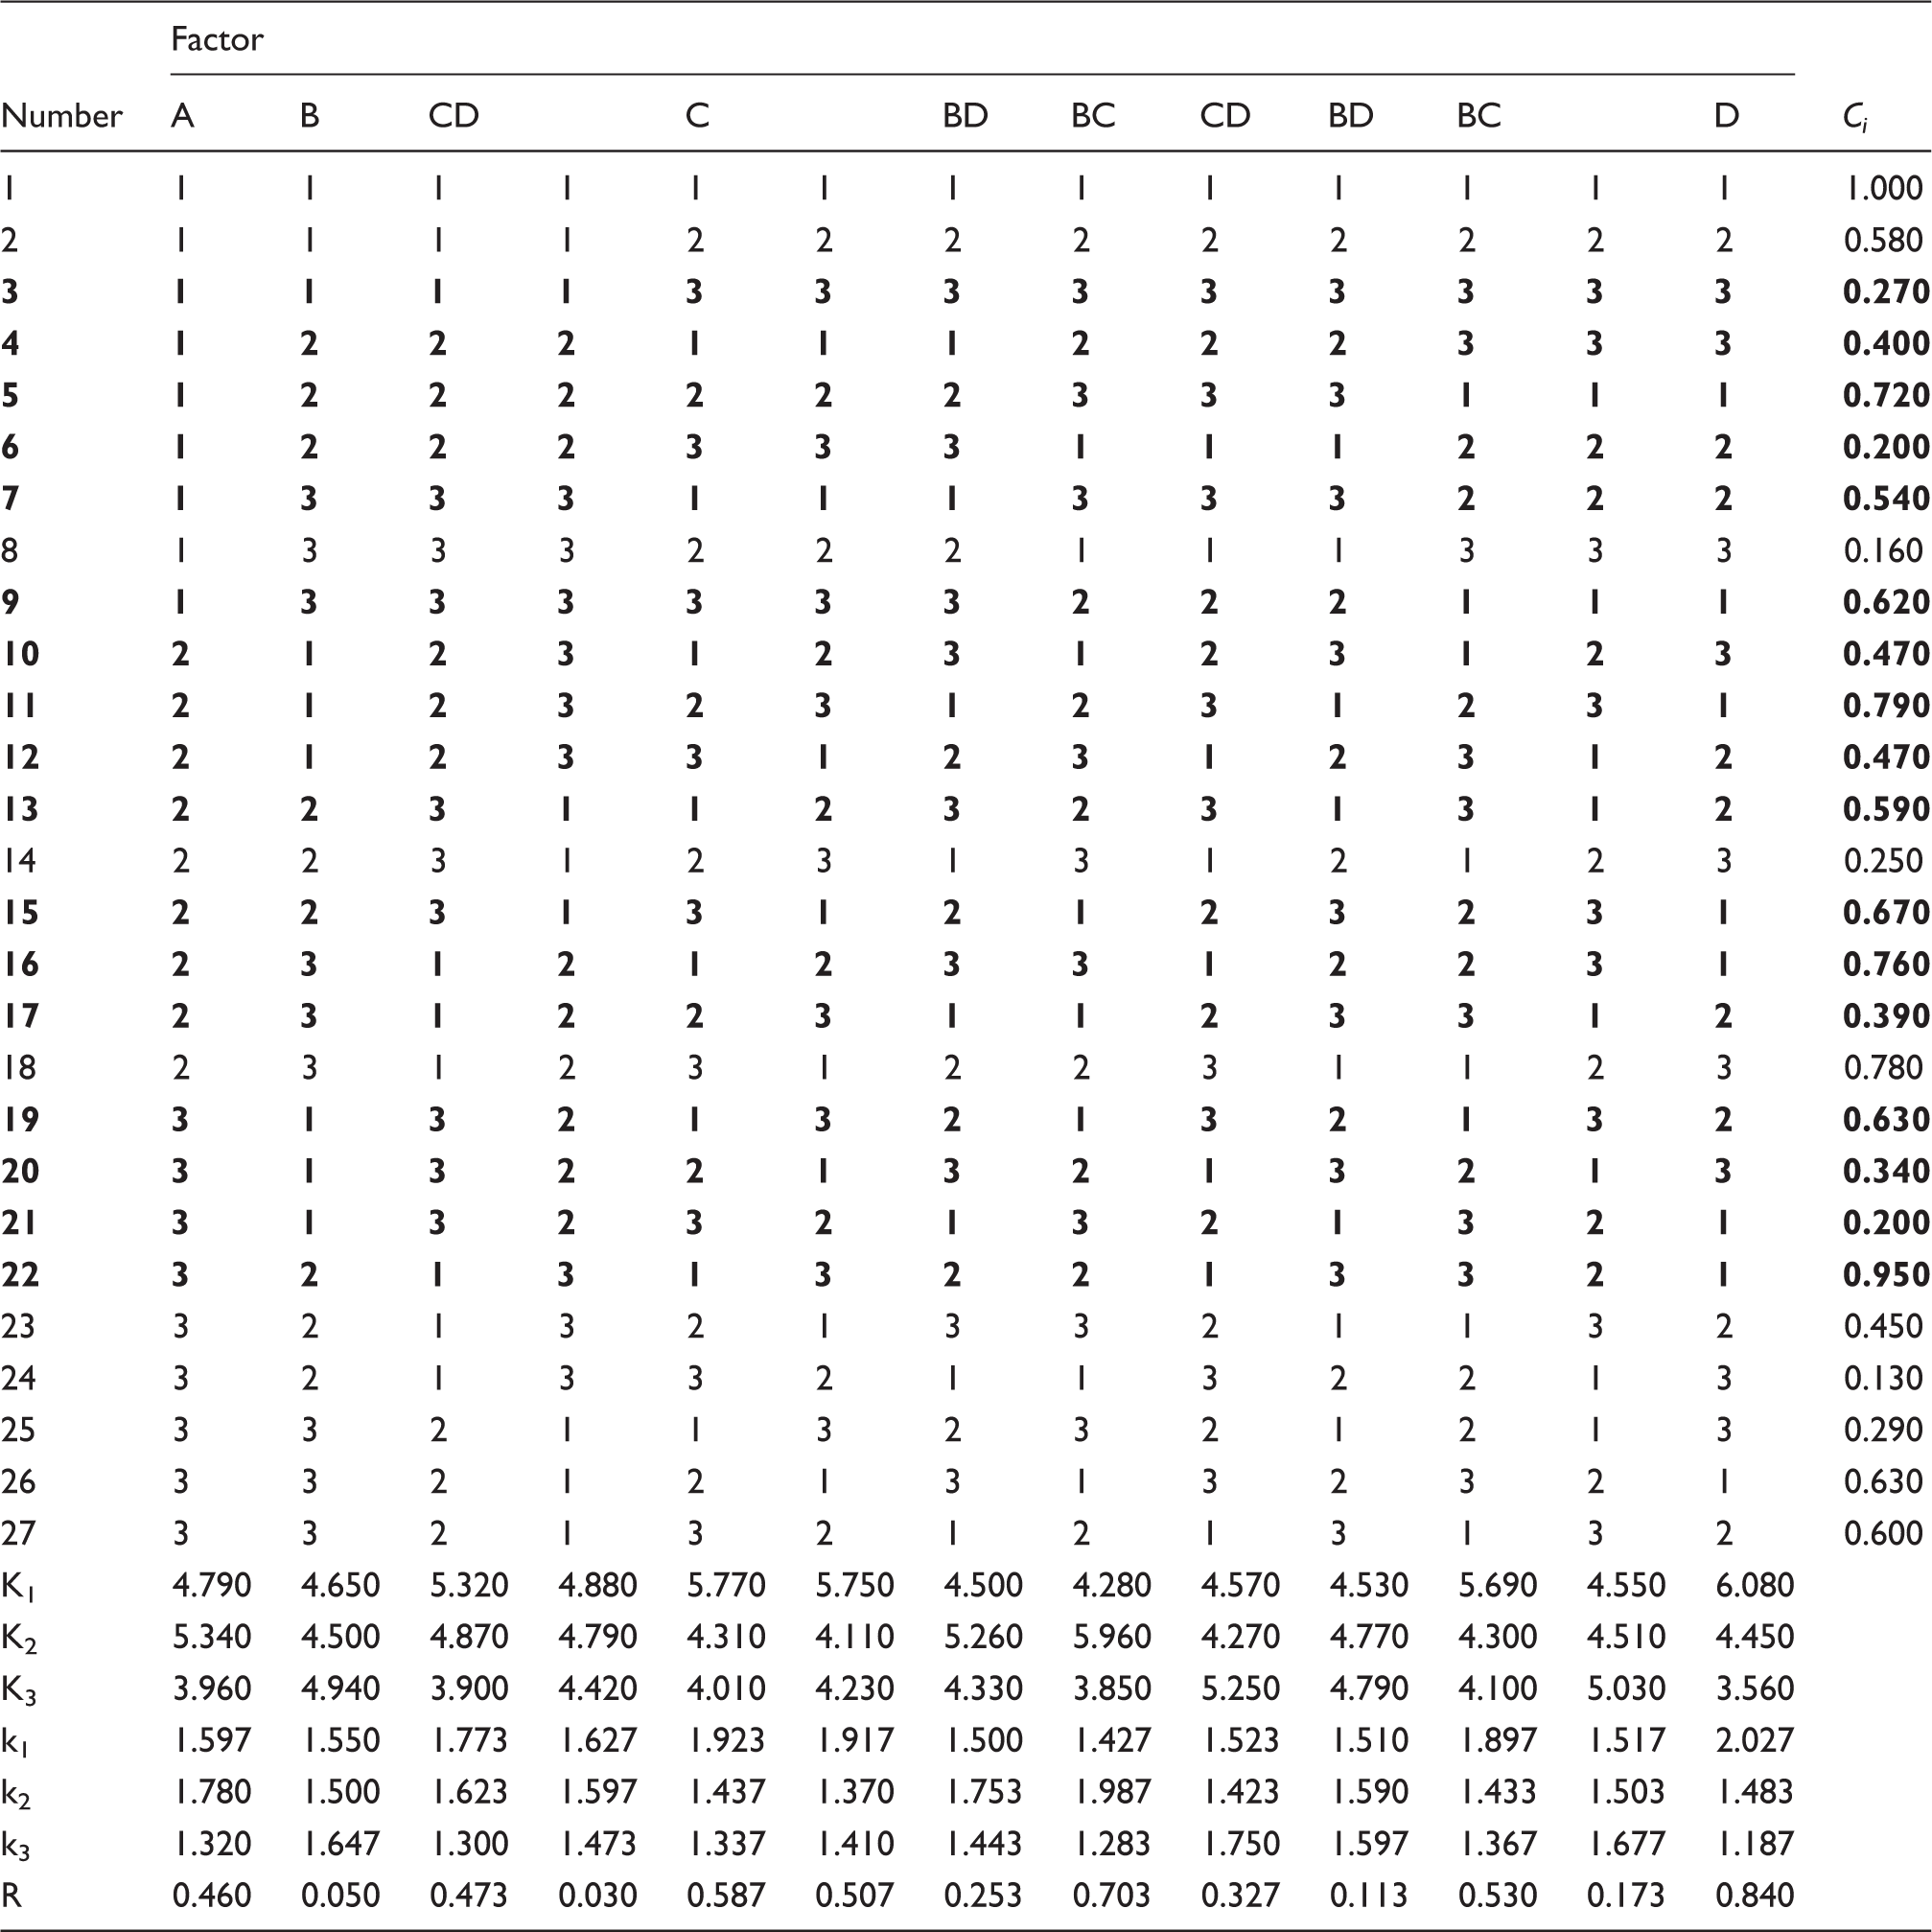
Orthogonal table of schemes of fabric continuous drying
Numerical results
Analysis of experimental results
Step 1. Numerical results
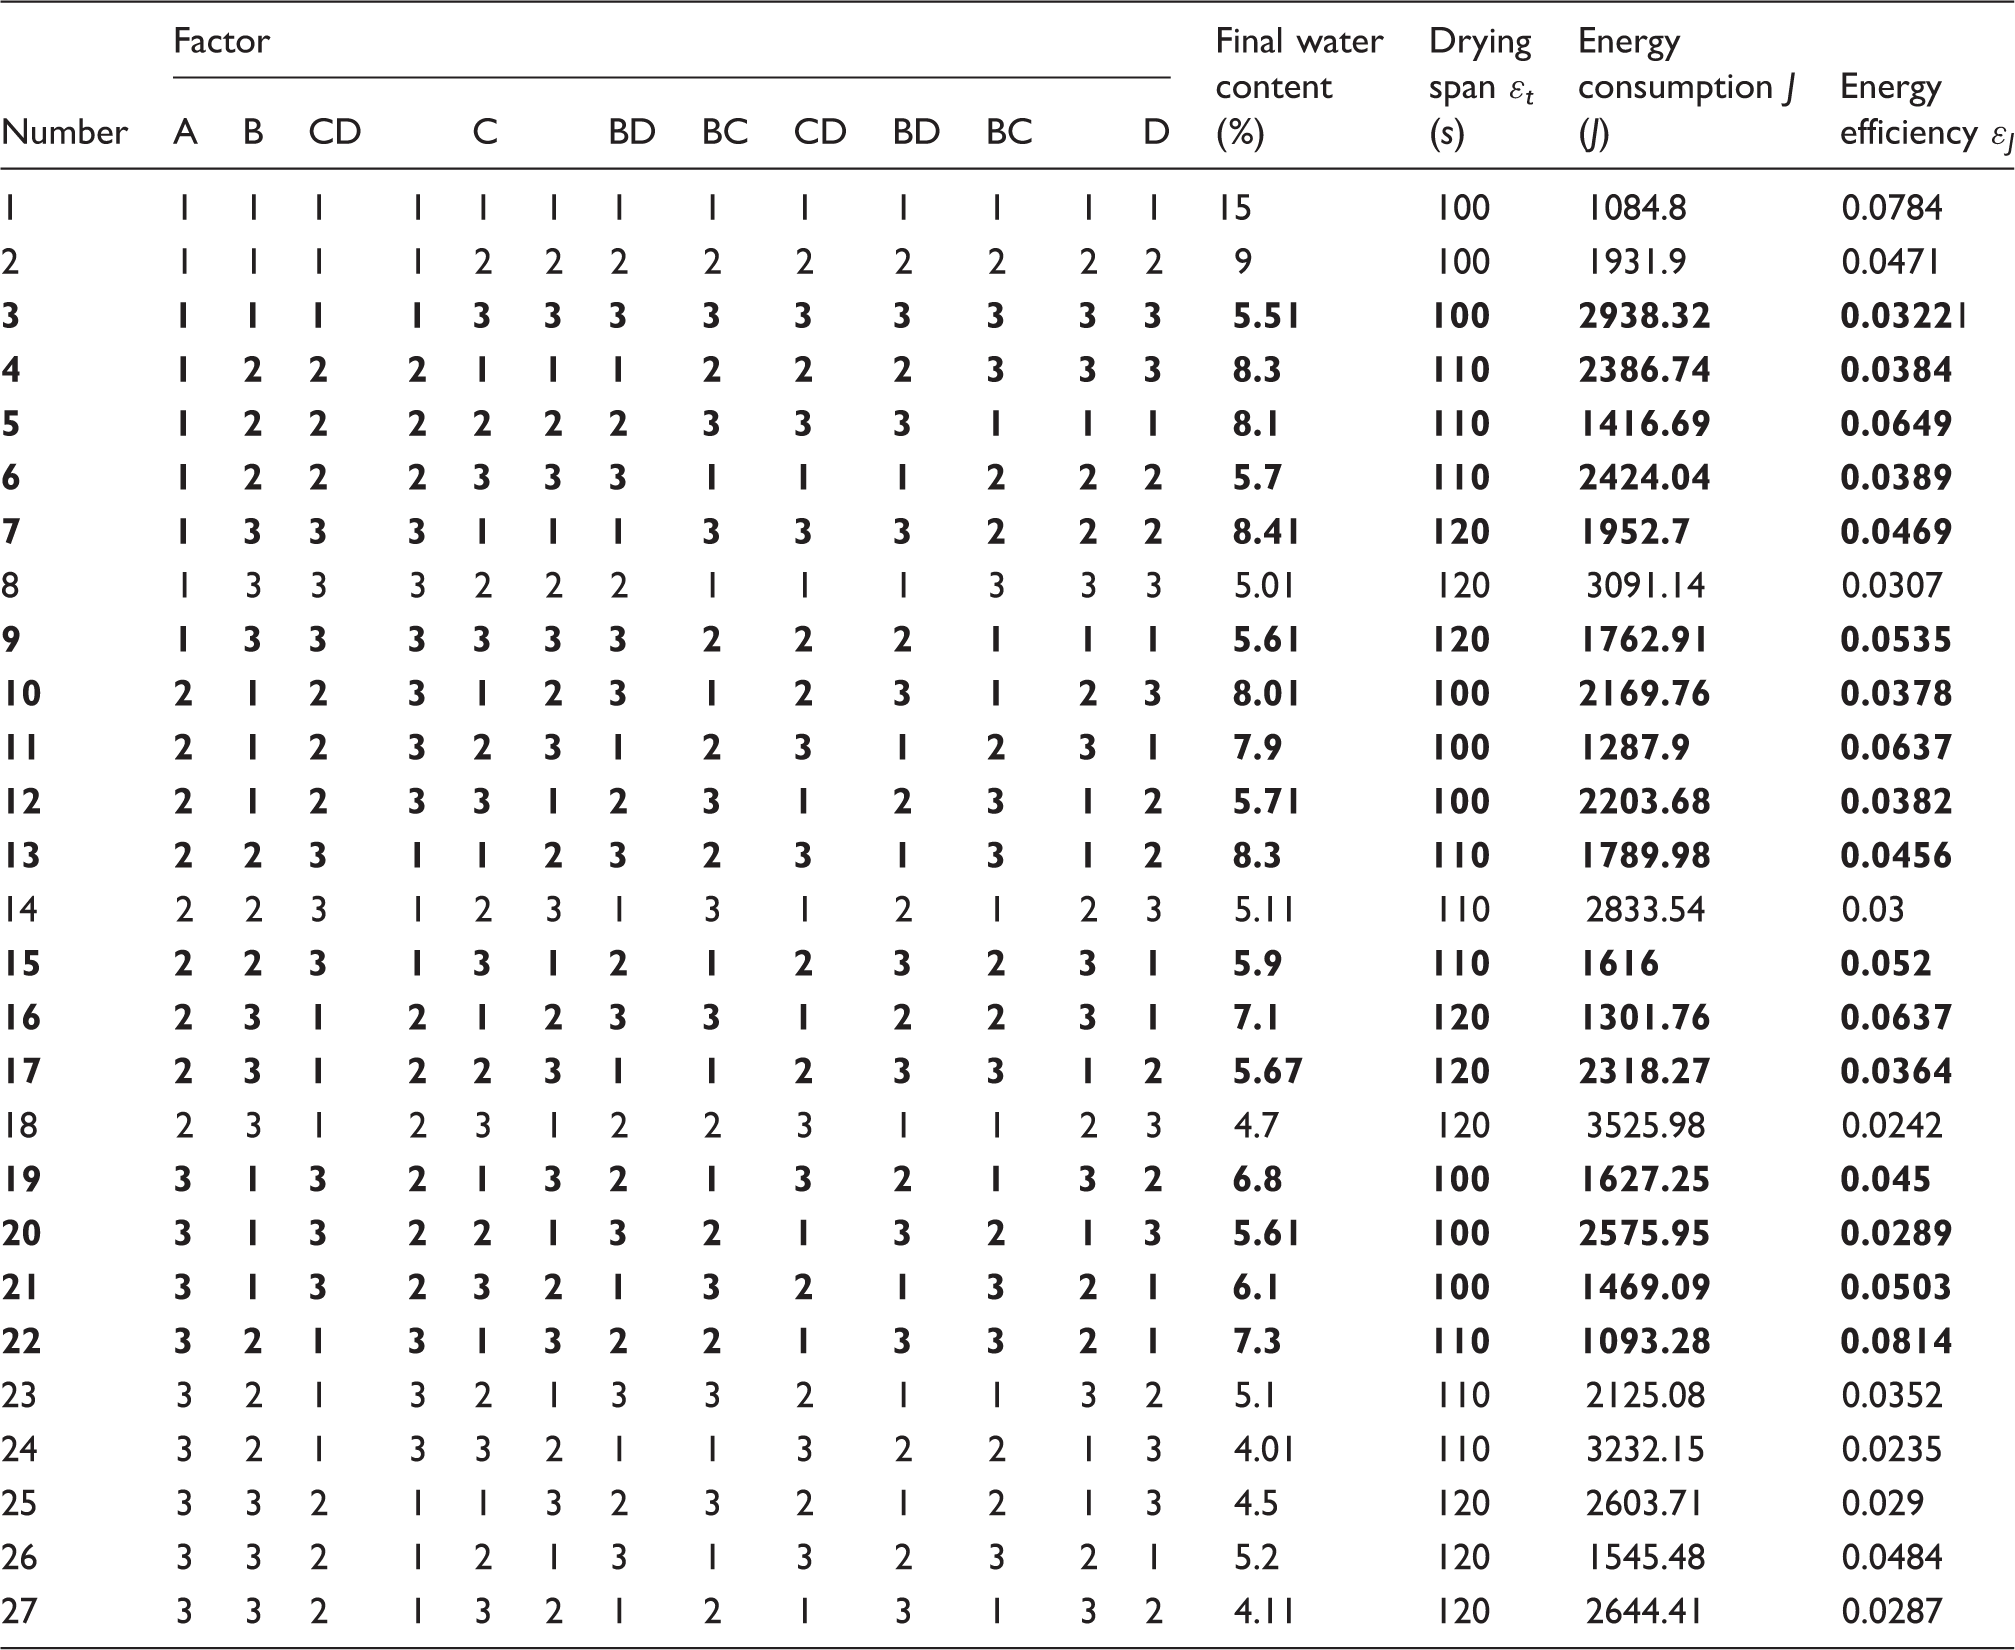
The fabric drying schemes designed by the Taguchi method are calculated by the verified model, and the numerical results are shown in Table 6.
It is worth noting that the fabrics used in this study are cotton fabrics, the standard moisture regain of cotton fabrics is 8.5%, 44 and the equilibrium moisture content (moisture content of fabric after drying in the ordinary environment) of cotton fabrics is 5–8.5%. 45 Therefore, only when the final water content of the simulated fabric reaches 5–8.5% can it meet the requirements of actual production. Schemes No. 3, 4, 5, 6, 7, 9, 10, 11, 12, 13, 15, 16, 17, 19, 20, 21, and 22 meet the requirements, and the optimal process parameters are chosen from these schemes.
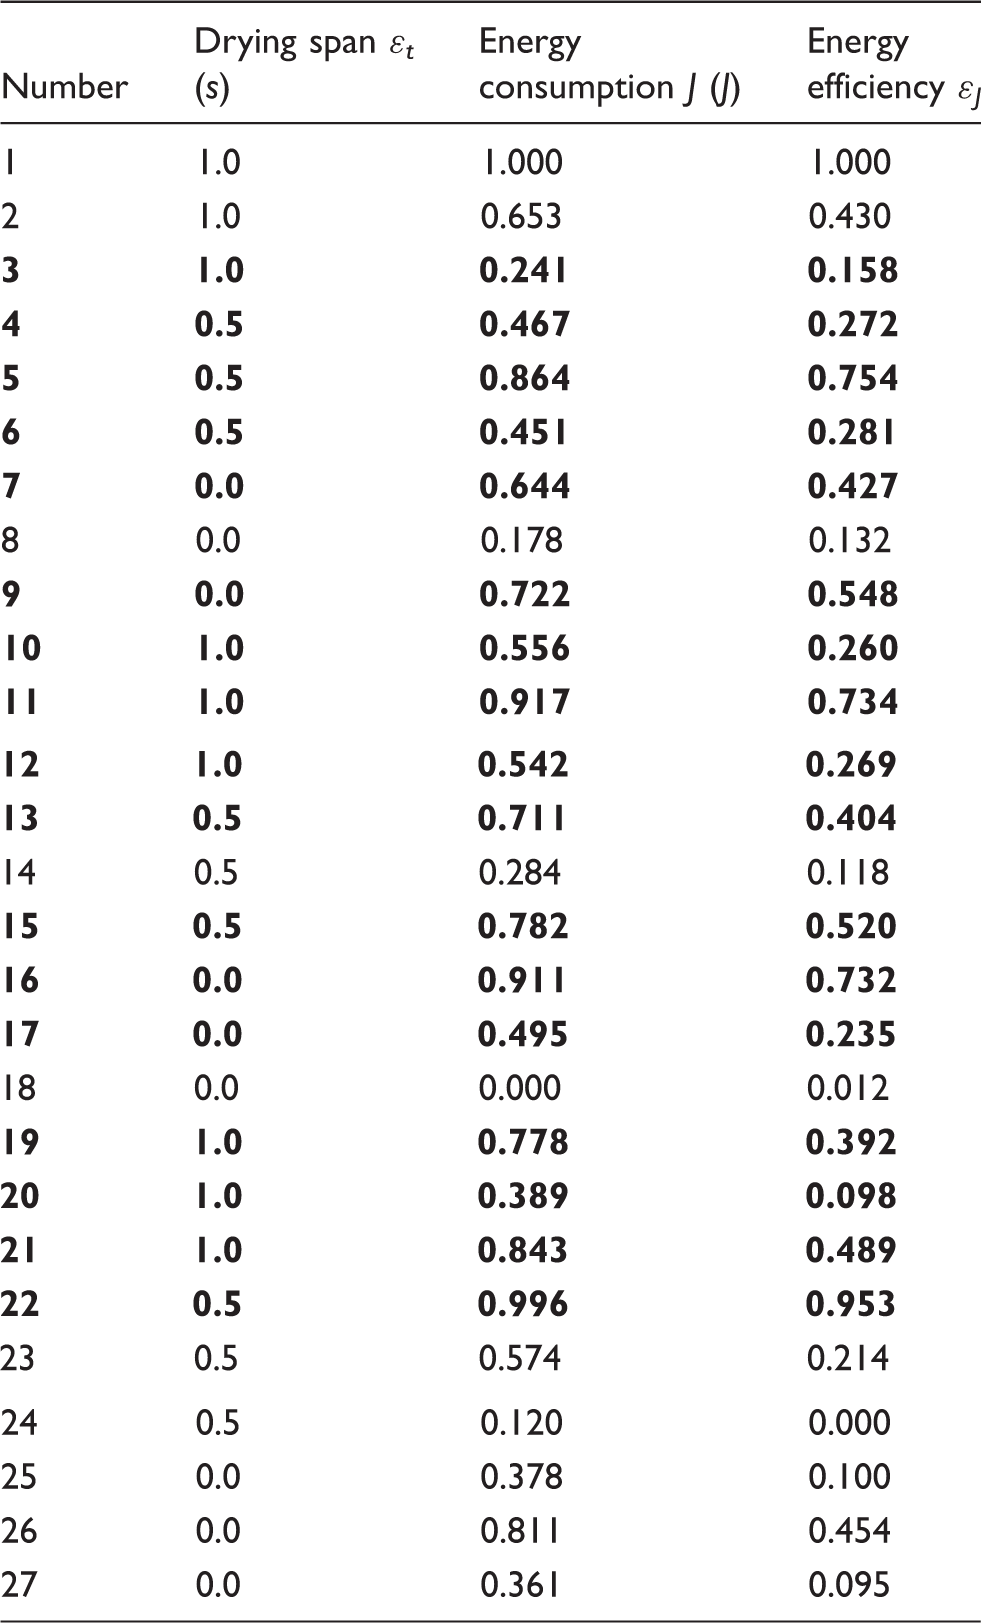
Step 2. Data standardization
Drying span and energy consumption are cost indicators, and energy efficiency is a beneficial indicator. The results of data standardization are shown in Table 7.
Data standardization
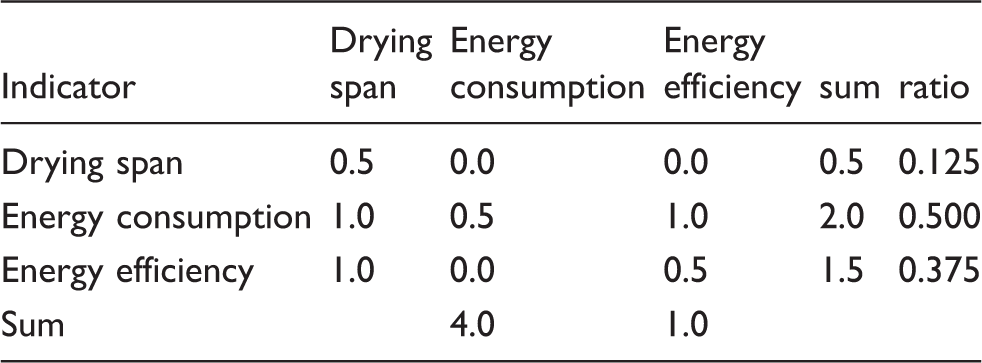
Energy consumption is the most important indicator, 40 the second most important indicator is energy efficiency, and the least important indicator is drying span. The process of calculating the coefficient of weight of each indicator according to the COPRAS method is shown in Table 8. On the basis of the weight coefficients, the standardized data after weighing can be further obtained.
Weight coefficient of each indicator
The plus and minus ideal schemes of fabric continuous drying can be obtained by standardizing and weighing data, and the distance between each scheme and the ideal scheme can be calculated. The results of the closeness between each scheme and the plus ideal scheme can be finally obtained, as shown in Table 9.
Closeness between each scheme and the plus ideal scheme
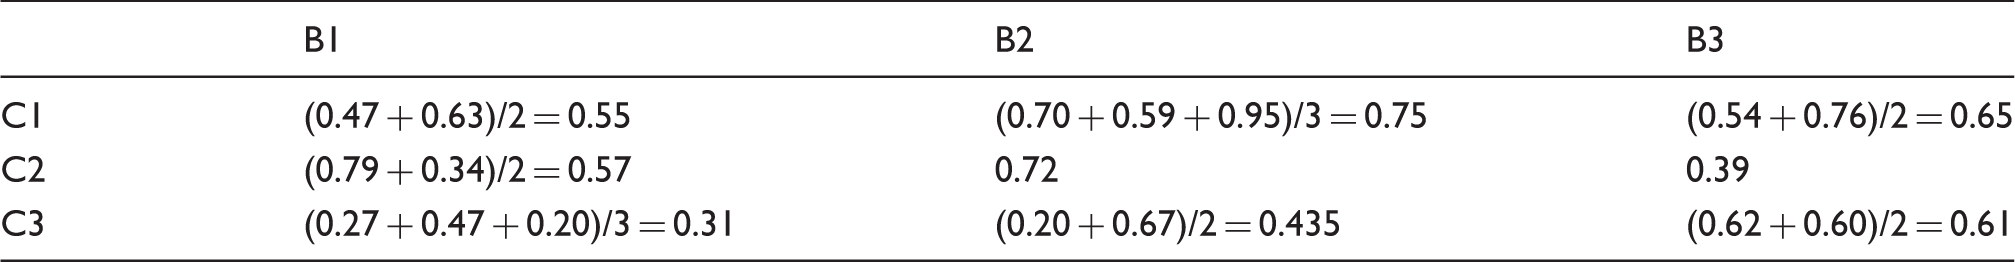
Analysis of the reciprocal actions of factors B and C
Analysis of optimization results
Three evaluation indicators of drying span, energy consumption, and energy efficiency are proposed in this paper. It can be seen from the optimal scheme of continuous drying that, first of all, the wind speed is only 2 m/s (the minimum level), that is, a low wind velocity can effectively reduce energy consumption. Although increasing wind speed can obviously improve the drying rate, energy consumption is not proportional to drying rate. In addition, the lower the wind velocity, the longer the drying time, and the greater the damage to the fabric, but drying span is the least important evaluation indicator. Also, this paper did not consider the damage caused by longer drying time. Therefore, if the negative effect of prolonged drying on fabric quality is not important, reducing wind velocity is an effective way to save energy during continuous drying. Second, the level of initial water content is the lowest. This is a predicted result, which means that, in the fabric drying process, if the initial water content is lower, then less water in the fabric needs to be evaporated for it to reach its predicted content (5–8.5%, as mentioned earlier). As less water needs to be evaporated, less energy will be needed in the drying process. Therefore, in actual production, for wet fabric before drying, the moisture content should be as low as possible to achieve the predicted situation in the drying process. Finally, the strong interaction between fabric velocity and wind temperature means that the determination of fabric velocity and wind temperature during continuous drying is difficult and complex, and they cannot be determined simply according to the experience of the engineer. The results show that the optimization method proposed in this paper can scientifically select the best technological parameters.
According to the three evaluation indicators proposed in this paper, the corresponding optimal technological parameters are determined. In addition, through the experimental scheme design method and optimization method proposed in this paper, engineers can design their own experimental scheme in actual production according to their own evaluation indicators and the weight coefficient of each evaluation indicator, and quickly and accurately select the optimal technological parameters.
Second optimization of process parameters
With the Taguchi method and TOPSIS method, the best group of technological parameters of fabric continuous drying was obtained. However, the step size of the optimization based on the Taguchi method is fixed, which means the best set of process parameters is just the optimal solution of the current experimental schemes, not the global best solution. To find the global optimal solution, the process parameters should be optimized for a second time based on the best group of process parameters chosen from the first optimization through the same methods and steps, and the distance of levels of optimization objects in the second optimization is half of the distance in the first optimization. As a result, the best group of process parameters of the secondary optimization is 75% initial water content, 0.0139 m/s fabric velocity, 105℃ wind temperature, and 1.5 m/s wind velocity. Compared with the first optimization, the energy consumed in drying process can be reduced by about 18.4% and energy efficiency can be enhanced by about 0.7% in the second optimization.
Conclusion
In this paper, to research heat and mass transfer mechanisms of the continuous drying processes of various fabrics and to optimize process parameters on the basis of the study of the intermittent fabric drying process of Wang et al.,
17
a finite element model was built to simulate the fabric continuous drying process under different technological situations; then, the numerical model was verified by corresponding experiments. After that, the effects of different process parameters on the fabric continuous drying process were analyzed, and the difference between intermittent and continuous fabric drying process was also analyzed and discussed. In addition, the best group of process parameters of fabric continuous drying was chosen through the Taguchi method and TOPSIS method, and the influence of reciprocal actions of process parameters on fabric the continuous drying process was also analyzed. The following conclusions are shown:
On the platform of FLUENT, a finite element model was developed; this model can describe coupling phenomenon between environment inside the tenter and the moving fabrics. Then, this model was used to simulate the continuous drying process of three kinds of fabrics under different initial water content, fabric velocity, wind temperature, and wind velocity. The numerical results agree well with corresponding experiment values: the absolute mean errors of distribution of surface temperature and water content of fabrics along moving direction are 2.15℃ and 4.22%, respectively. Results show that wind velocity, wind temperature, and fabric velocity can obviously influence fabric surface temperature and fabric drying rate in the drying process; initial water content has a very small influence on fabric surface temperature and fabric drying rate in the drying process. It is worth noting that with the same initial and process conditions, the drying rate of moist fabrics in the continuous drying process is lower than in the intermittent drying process due to higher humidity and lower temperature in the dryer caused by the constantly high drying rate of moist fabrics and fast generation of a large amount of vapor. The Taguchi method was applied to design fabric continuous drying schemes considering the influence of reciprocal actions of process parameters on the fabric continuous drying process. There are four optimization process parameters, and three evaluation indicators were proposed in this paper. These schemes were calculated by the verified finite element model. The TOPSIS method was applied to analyze the numerical results of the schemes. It is worth noting that the influence of reciprocal actions between wind temperature and wind velocity on the fabric continuous drying process is larger than that of wind temperature and wind velocity. Finally, the best group of process parameters was obtained: 80% initial water content, 0.0133 m/s fabric velocity, 100° wind temperature, and 2 m/s wind velocity. On the basis of the best group of process parameters chosen through optimization method, the secondary optimization was carried out to further choose the best group of process parameters with the same methods and steps; the best group of process parameters for the second time is 75% initial water content, 0.0139 m/s of fabric velocity, 105° wind temperature, and 1.5 m/s wind velocity.
In the future, it is expected that the model and the optimization method proposed in this paper can be applied together to help to deeply understand the fabric continuous drying process and choose optimal technological parameters precisely in actual production, thereby helping reduce energy consumption and enhance productivity. Continuous fabric drying is a complex process, and many factors, such as air humidity, that influence the fabric drying process will be studied in the future. And in the future, a three-dimensional finite element model that can be used to simulate the continuous fabric drying process more comprehensively will be built. The continuous fabric drying process studied in this paper ends when fabric samples completely enter the tenter. This has raised a question: when fabric is heated in the tenter for a longer term, are the conditions inside the tenter the same as the conditions presented in this study? This problem will be discussed and studied in the future.
Footnotes
Declaration of conflicting interests
The authors declared no potential conflicts of interest with respect to the research, authorship, and/or publication of this article.
Funding
The authors received no financial support for the research, authorship, and/or publication of this article.