
Abstract
In order to facilitate the design of a hybrid filament before spinning, a k-m (Kubelka-Munk) iteration model was proposed, which was based on the calculation method for reflectance of a translucent object and needed to be used in conjunction with a fabric model that can reflect the arrangement order of monofilaments. Therefore, the model can not only calculate the color of each point on the fabric surface, but also the mixed color of the fabric. Twenty fabrics with five different blending ratios of black monofilaments and white monofilaments, four multifilament fineness and three fabric weave types were woven. The relationship between the gray distribution of all points on the fabric surface captured by the camera in a DigiEye colorimeter and calculated by the k-m iteration model was analyzed, and the color difference between the mixed color of the fabric tested by the Datacolor spectrophotometer and that calculated by the k-m iteration model was calculated. The results show that the intersection distance and Pearson correlation coefficient between the gray histogram of the photographed fabric image and that of the calculated fabric image were 0.79 and 0.89, respectively. The average color difference obtained by the k-m iteration model was 0.92 Color Measurement Committee (2:1) units, which was best compared with the calculation results of other models. By discussing the fabric structure parameters causing the lightness difference, it was concluded that the calculated lightness was smaller than the measured lightness difference for fabric with a longer float length, smaller multifilament fineness and a larger black monofilament blending ratio.
Keywords
Compared with traditional printing and dyeing, natural color cotton and melt direct spinning, chip spinning is not only green, but also convenient for changing products. Therefore, it can better meet the market demand for the small-batch and multi-variety production of colored fibers. However, in chip spinning it is necessary to store a large number of color masterbatches, and it also necessary to consume a large amount transition materials to flush the runner when changing products. In order to improve the chip spinning, Wang et al.1 and Pi et al. 2 proposed a spinning method based on chip spinning and named its product the hybrid multifilament. Figure 1 shows the spinning process of a two-component hybrid multifilament. The mixtures, composed of different color masterbatches and spinning chips, are converged into the same spinning pack through their respective spinning channels, and extruded through different spinneret holes of the same spinneret to form different colored monofilaments. These monofilaments are held together to get the final hybrid multifilament.
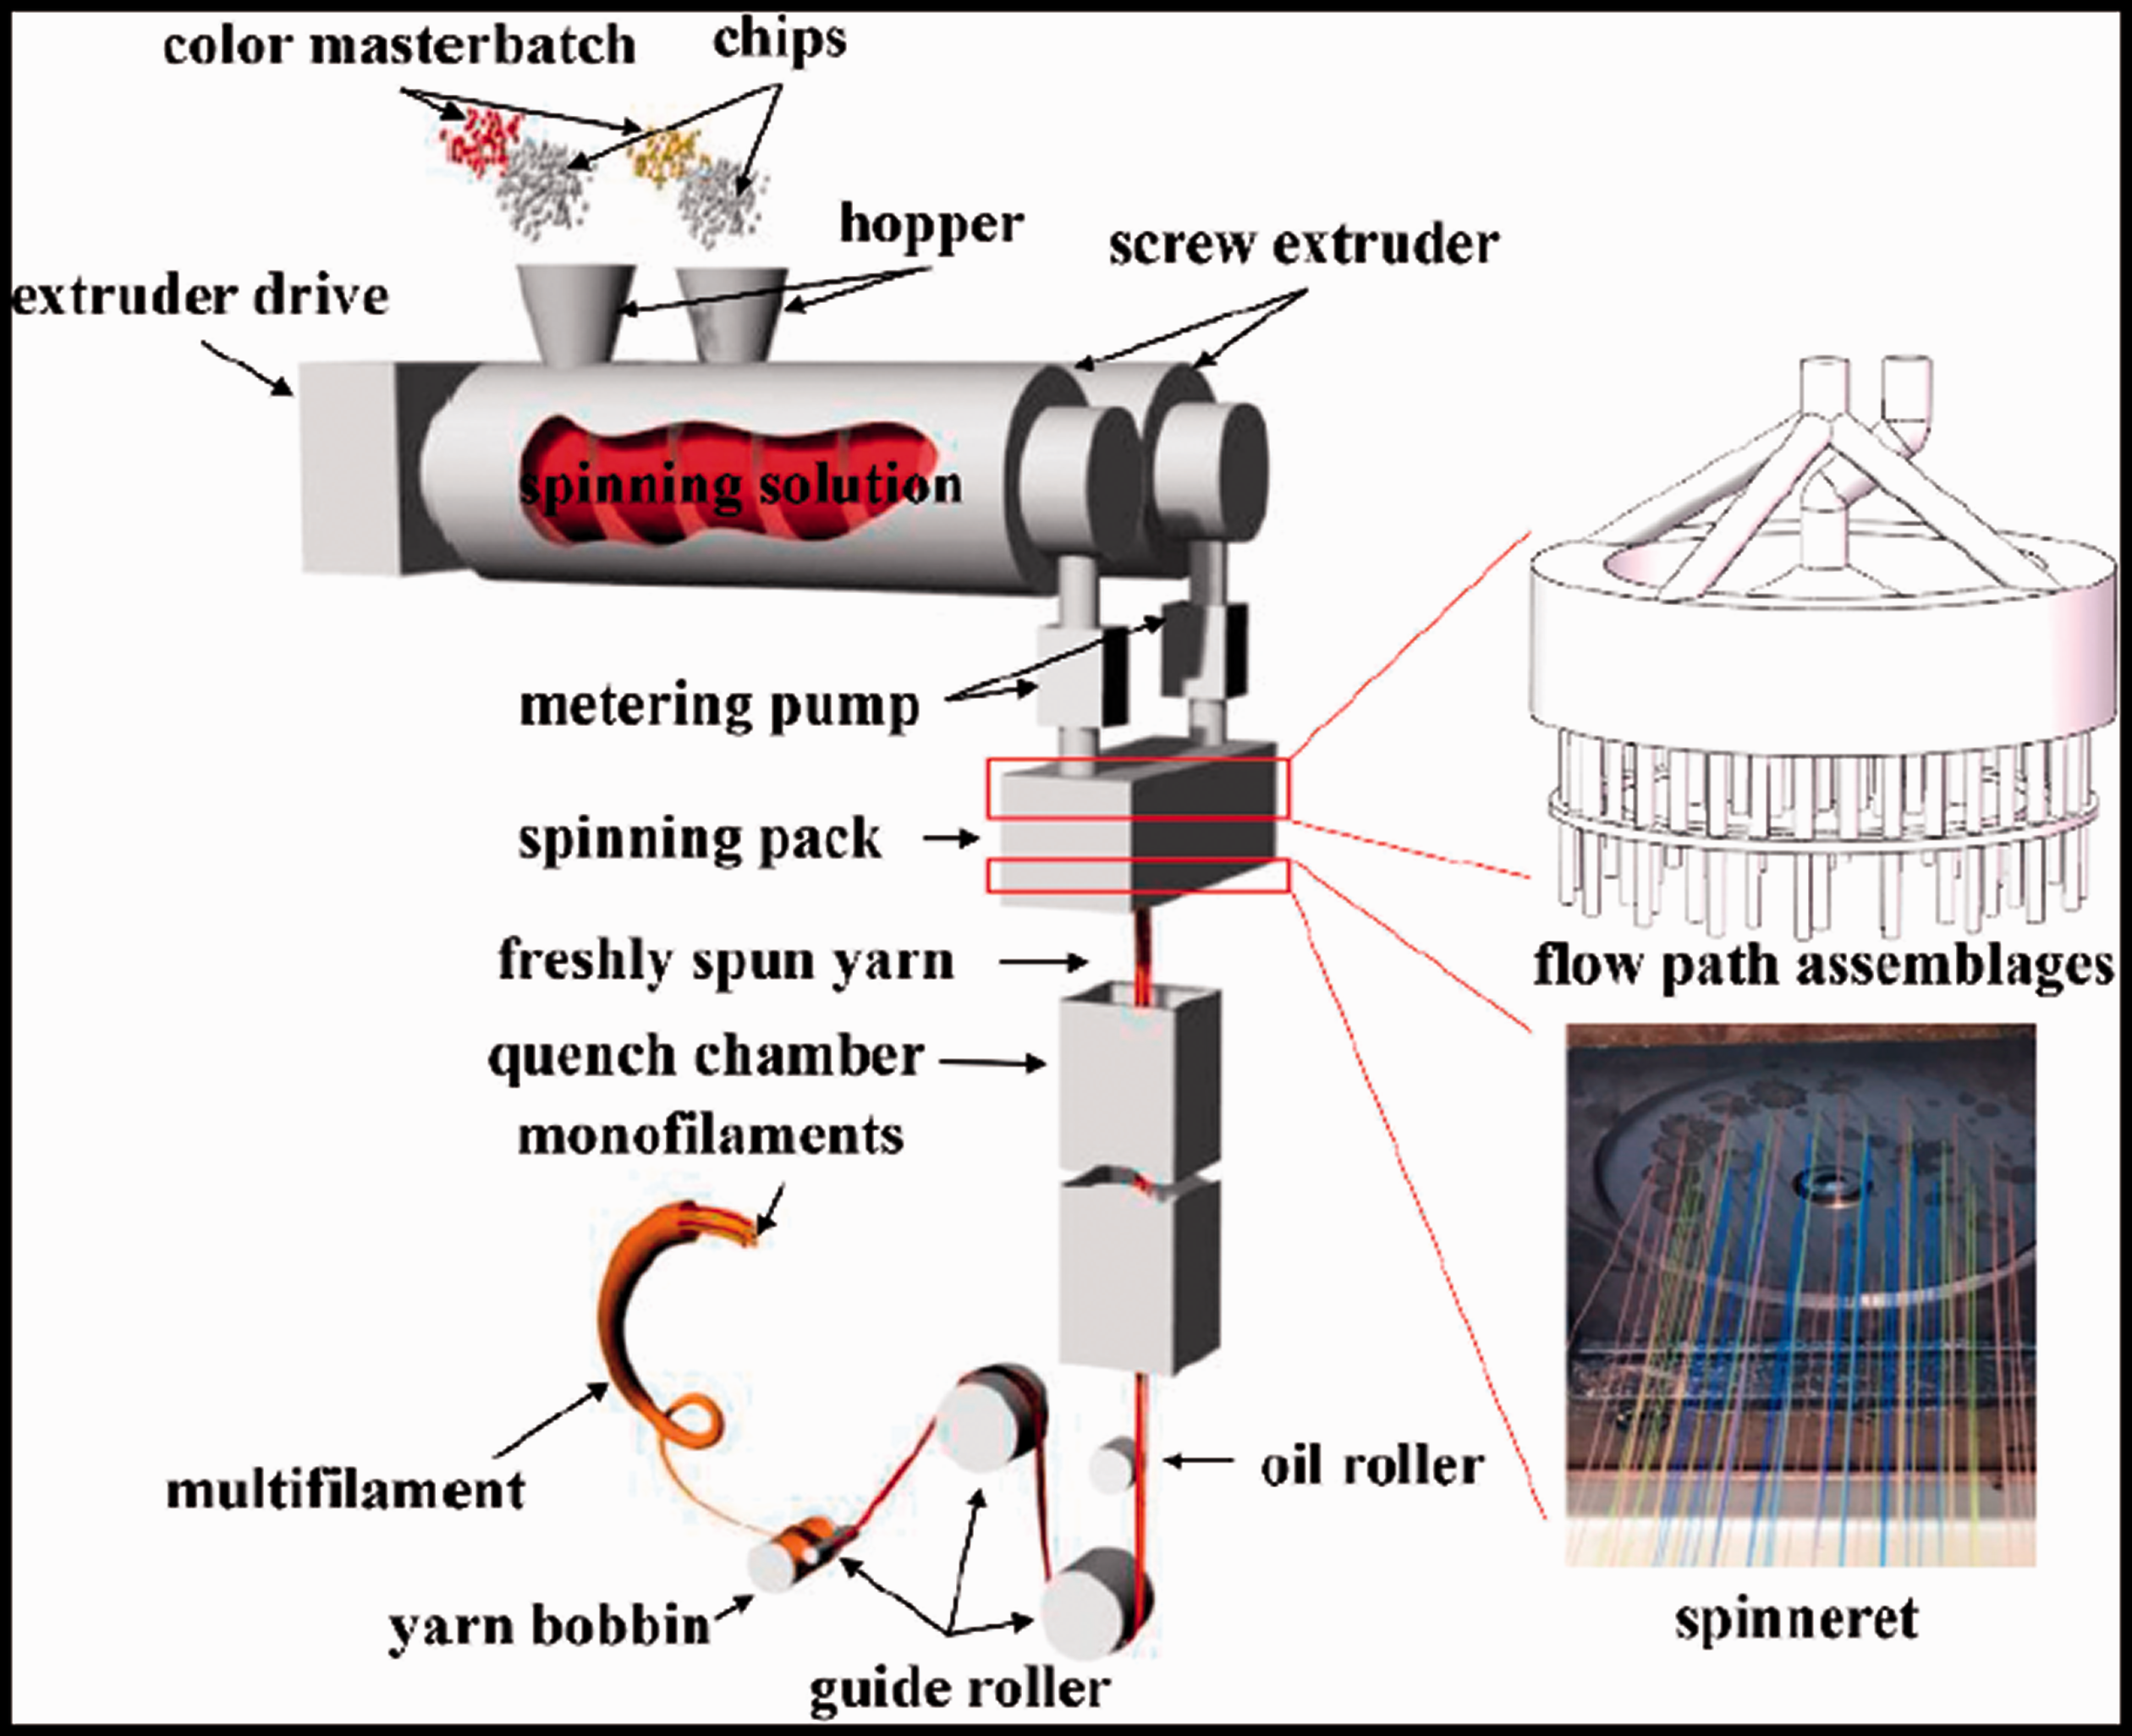
The spinning process of the hybrid multifilament.
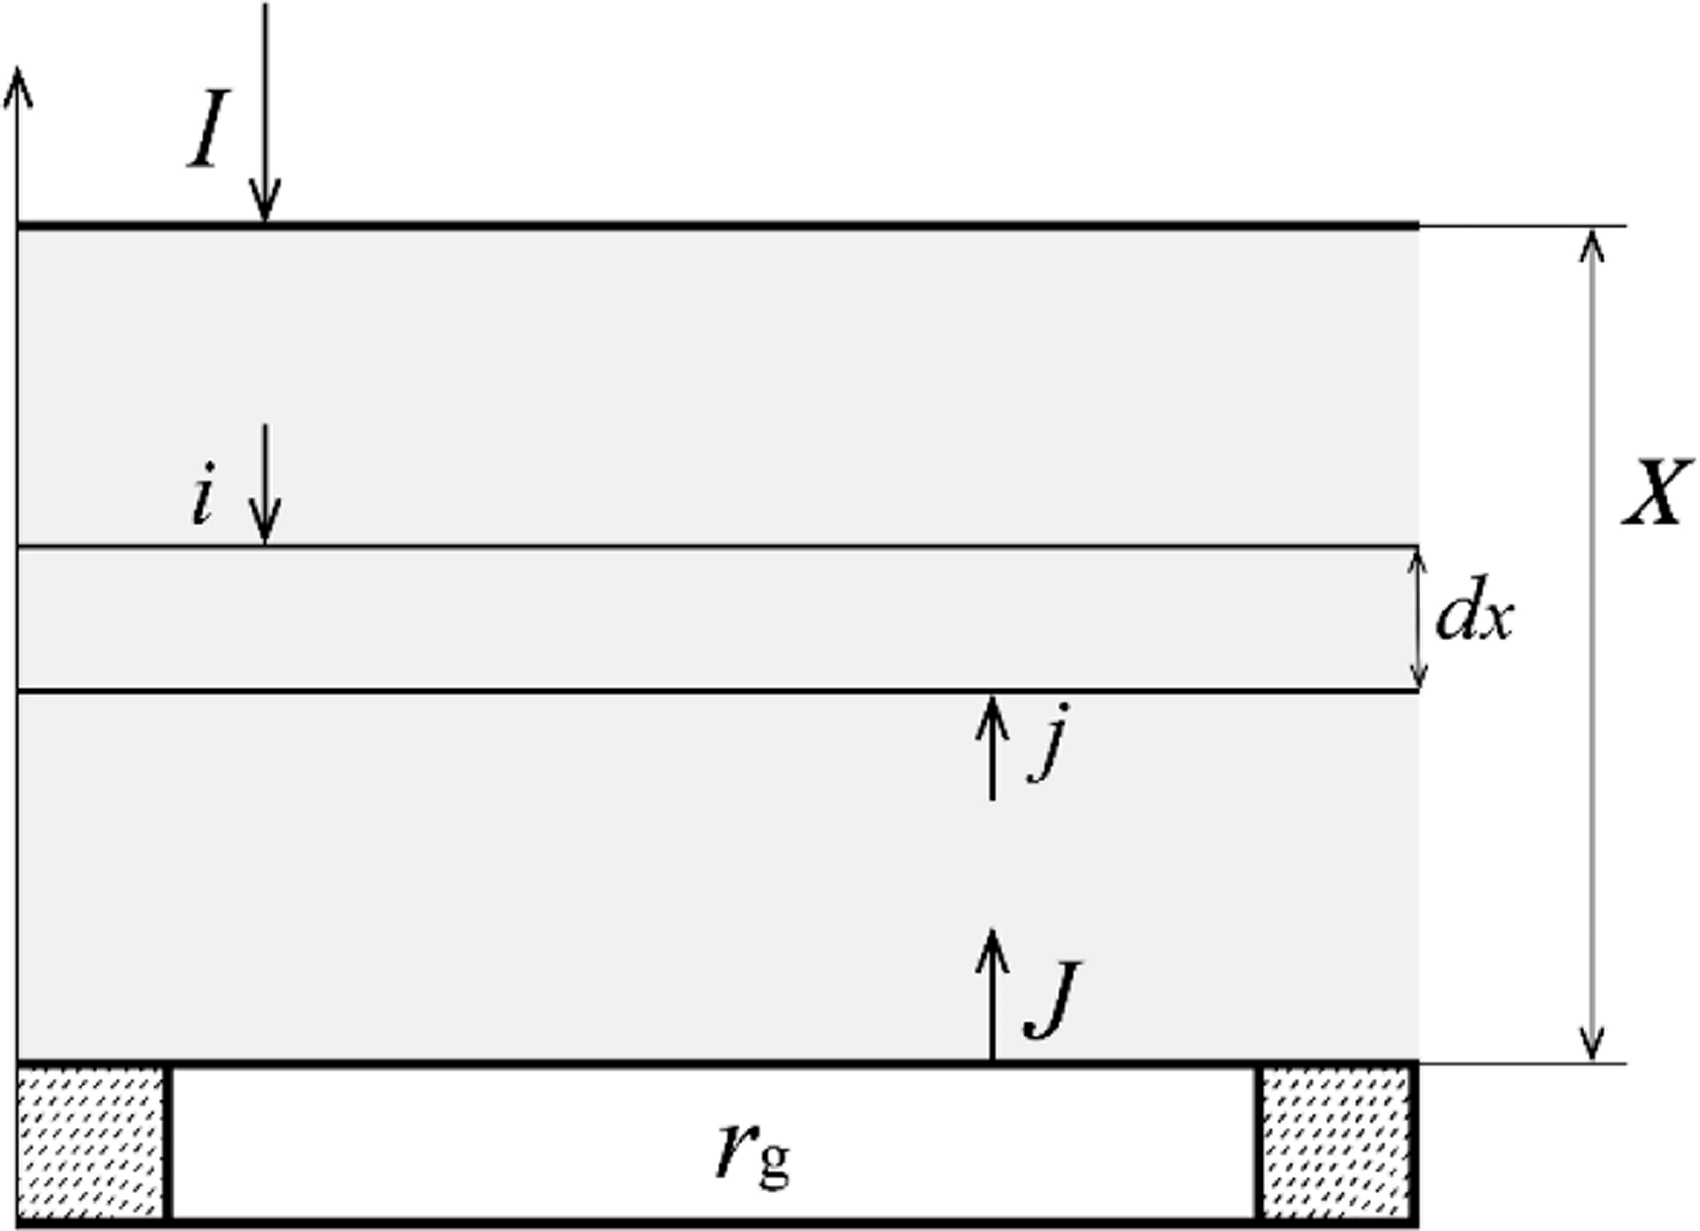
A simple schematic diagram of the propagation of light in an object.
If the monofilament is thin enough and relatively evenly mixed in the multifilament, it is difficult to find the color difference between different parts of the multifilament surface when observing from a certain distance. This is due to the color mixing characteristics of the human eye. 3 According to the color mixing principle of colorimetry, any color can be obtained by mixing the three primary colors with different blending ratios. Thus, there is no need to store a large number of masterbatches, and different colored multifilaments can be produced just by changing the blending ratio of different colored monofilaments. However, this method is still in the stage of trial-and-error spinning, which is time-consuming, laborious and costly, and cannot give full play to the characteristics of spinning technology. To address this dilemma, there is an urgent need to put forward a color prediction model for this spinning method to facilitate the pre-spinning design.
In the textile industry, the Kubelka–Munk (K-M) model, 4 Friele (F) model 5 and Stearns–Noechel (S-N) model 6 are the common color prediction models. The K-M model was derived from the law of spectral radiation and is still used in most colorimeter software. The F model is similar to the S-N model, both of which are empirical formulas based on experimental data. 7 For these models, scholars have done a great deal of in-depth research. Walowit et al. 8 proposed an approach to calculate the absorption and scattering coefficients in the K-M model based on linear least-squares techniques, which greatly simplified the original solution method and improved the calculation accuracy. Through a series of systematic experiments, data processing and analysis, Yang et al. 9 checked the K-M theory and found that there were some differences between the experimental evidence and the color mixing law of turbid materials. Wei et al. 10 believed that the better the linear relationship between the transfer function of the S-N model and the mass ratio, the higher the accuracy of the model. Based on this, the original transfer function has been improved. The prediction accuracy of the improved model is significantly higher than that of the original S-N model. Yang et al. 11 compared the prediction effect of K-M model based on linear least-squares techniques and the relative value method. The results show that the prediction effect of the K-M model based on the least-squares method was better. Yang et al. 12 optimized the solving methods of unknown parameters in the F model and S-N model by three methods based on the median, wavelength and composition, and analyzed the applicability of each method. Hemingray and Westland, 13 Furferi et al. 14 and Shen et al. 15 introduced a new hybrid model by combining the K-M model and S-N model with a neural network. The prediction accuracy of this type of model is very high, but a large number of samples are needed as training data. It can be seen that with the deepening of research, the accuracy of the prediction model of textiles is becoming higher and higher. However, these models are usually used to predict the mixed color of the textile as a whole, and cannot predict the color of a local area or even a point of the textile. Therefore, the surface color appearance of colored textiles with uneven color mixing cannot be characterized with these models. This results in the problem that the spectra of batch samples and standard samples are the same, but their color appearance is different. 16 Although there have been some reports about simulating the appearance of colored textiles,17,18 the methods reported are either too complex or not well combined with the parameters of samples. In recent research, Wang et al.19,20 explored a color prediction model for the hybrid multifilament fabric, but the model needs to make the equivalent film of the monofilament and modify the calculation results.
In conclusion, it is necessary to put forward a model that can calculate the color of the whole, part or even a point of the hybrid multifilament fabric more conveniently and accurately. The research content of this article is mainly divided into four parts: introducing the calculation method and characteristics of the prediction model; verifying the performance of the model; analyzing the factors causing color difference; and comparing the model with other models.
Simple radiation theory
In 19394, Kubelka and Munk derived a relatively simple theory from the holonomic radiation theory, which is simplified as shown in Figure 2.
The incident light I vertically irradiates the translucent object with the thickness of X. Some of it enters the object and irradiates the sub-layer with the thickness of


Here,
Here,
Kubelka-Munk iterative model
Calculation method of color of each point on the multifilament surface
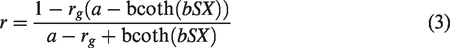
Since a single monofilament is also translucent, its reflectance can be calculated by Equation (3). As for the multifilament or fabric formed by stacking monofilaments, the reflectance can be calculated by the iterative method. Figure 3(a) shows a cross-section of a squashed multifilament, assuming that the positions of the monofilaments are arranged in parallel in different columns along the vertical direction. The color of each point on the fabric surface is the mixed color of the monofilaments in each column.
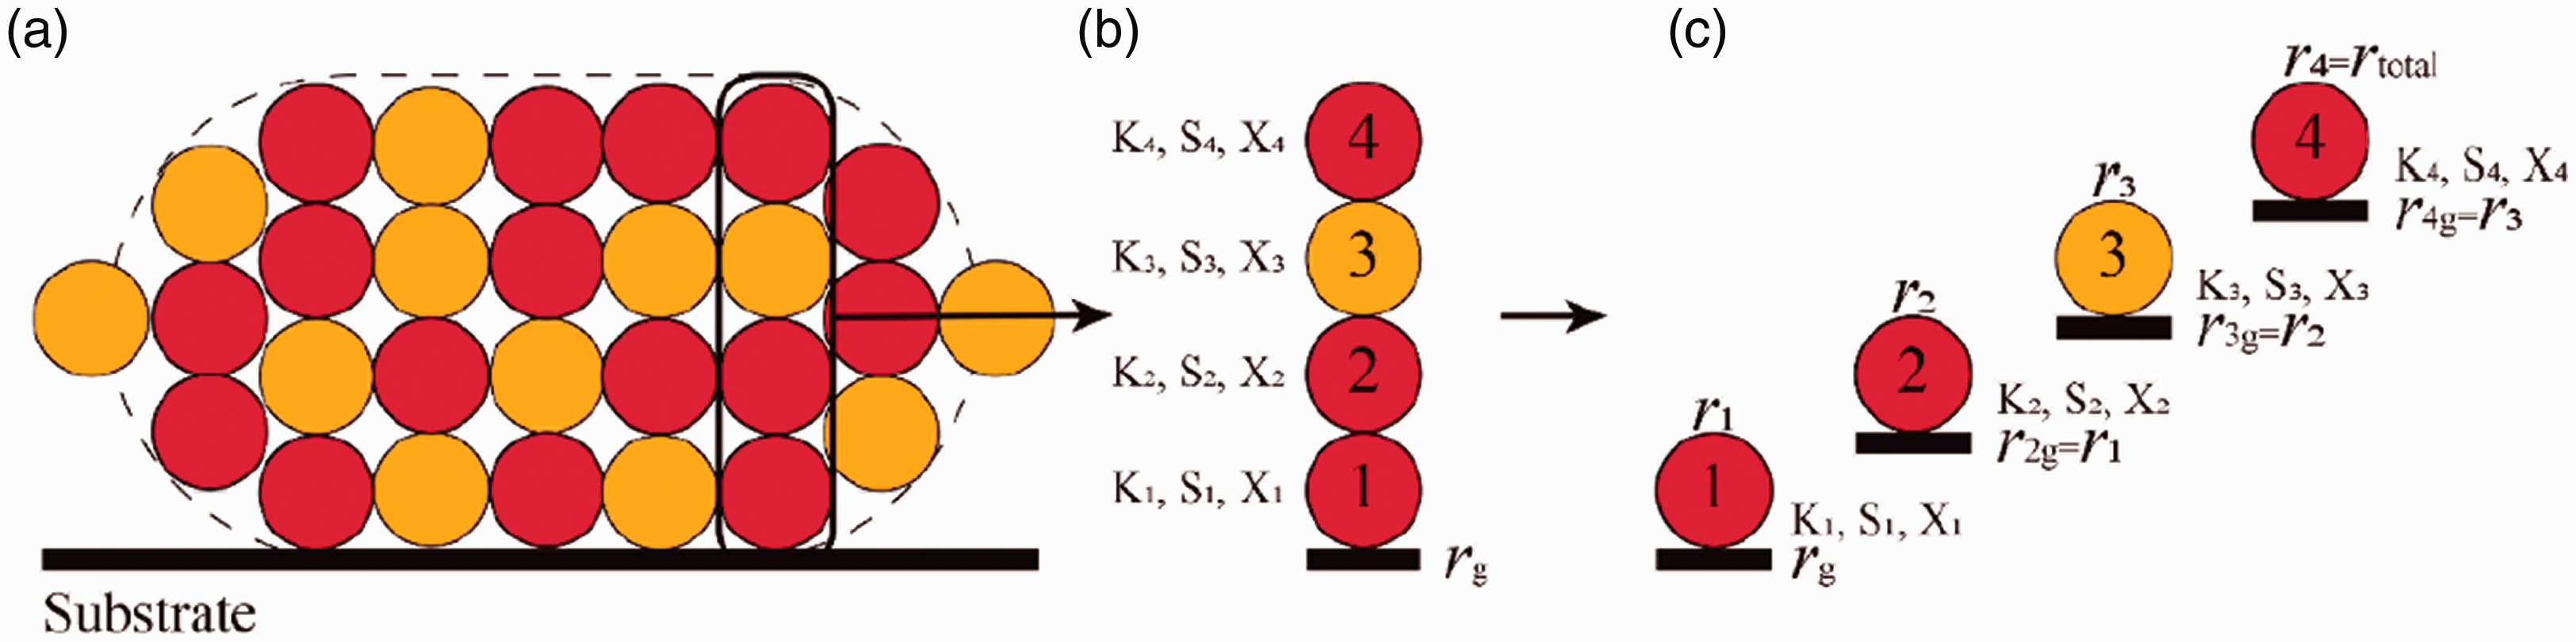
Schematic diagram of the iterative calculation method: (a) cross-section of the multifilament; (b) one of the columns composed of monofilaments in the multifilament; (c) the iterative calculation process.
One column composed of the monofilaments is taken as an example to illustrate the solution method of its mixed color, as shown in Figure 3(b). The absorption coefficient K, scattering coefficient S and thickness X of these monofilaments and the reflectivity
Calculation method of the mixed color of the multifilament fabric
When the reflectivity of each column composed of monofilaments is calculated, the function in MATLAB was used to convert it to CIE XYZ. Then, according to the linear relationship between the tristimulus values of the monochromatic colors and the mixed color,
21
the mixed color of the fabric can be calculated
Here,
Kubelka–Munk model
When the sample is an opaque medium, or the reflectivity of the sample remains unchanged with the increase of the sample thickness, the influence of the background can be ignored. Therefore,
By solving
Here,
Difference between the Kubelka -Munk iterative model and the Kubelka–Munk model
The main differences between the k-m iterative model and the K-M model are as follows.
The K-M model is also based on the simple radiation theory, but is suitable for the case in which the arrangement order of the internal components of the object does not need to be considered and the thickness of the object is infinite or the result is not affected by the color of the substrate. The k-m iterative model is used when the order of the internal components of the object needs to be considered, and the object can be infinitely thick or finitely thick.
Therefore, the K-M model can only calculate the mixed color of the fabric, while the k-m iterative model can calculate the color of each point on the fabric surface as well as the mixed color of the fabric.
Digital hybrid multifilament fabric model
In order to cooperate with the k-m iterative model, it is necessary to establish a fabric model that can reflect the arrangement of the monofilaments. The establishment of the fabric model can be divided into three steps, namely the establishment of the cross-section, multifilament and fabric.
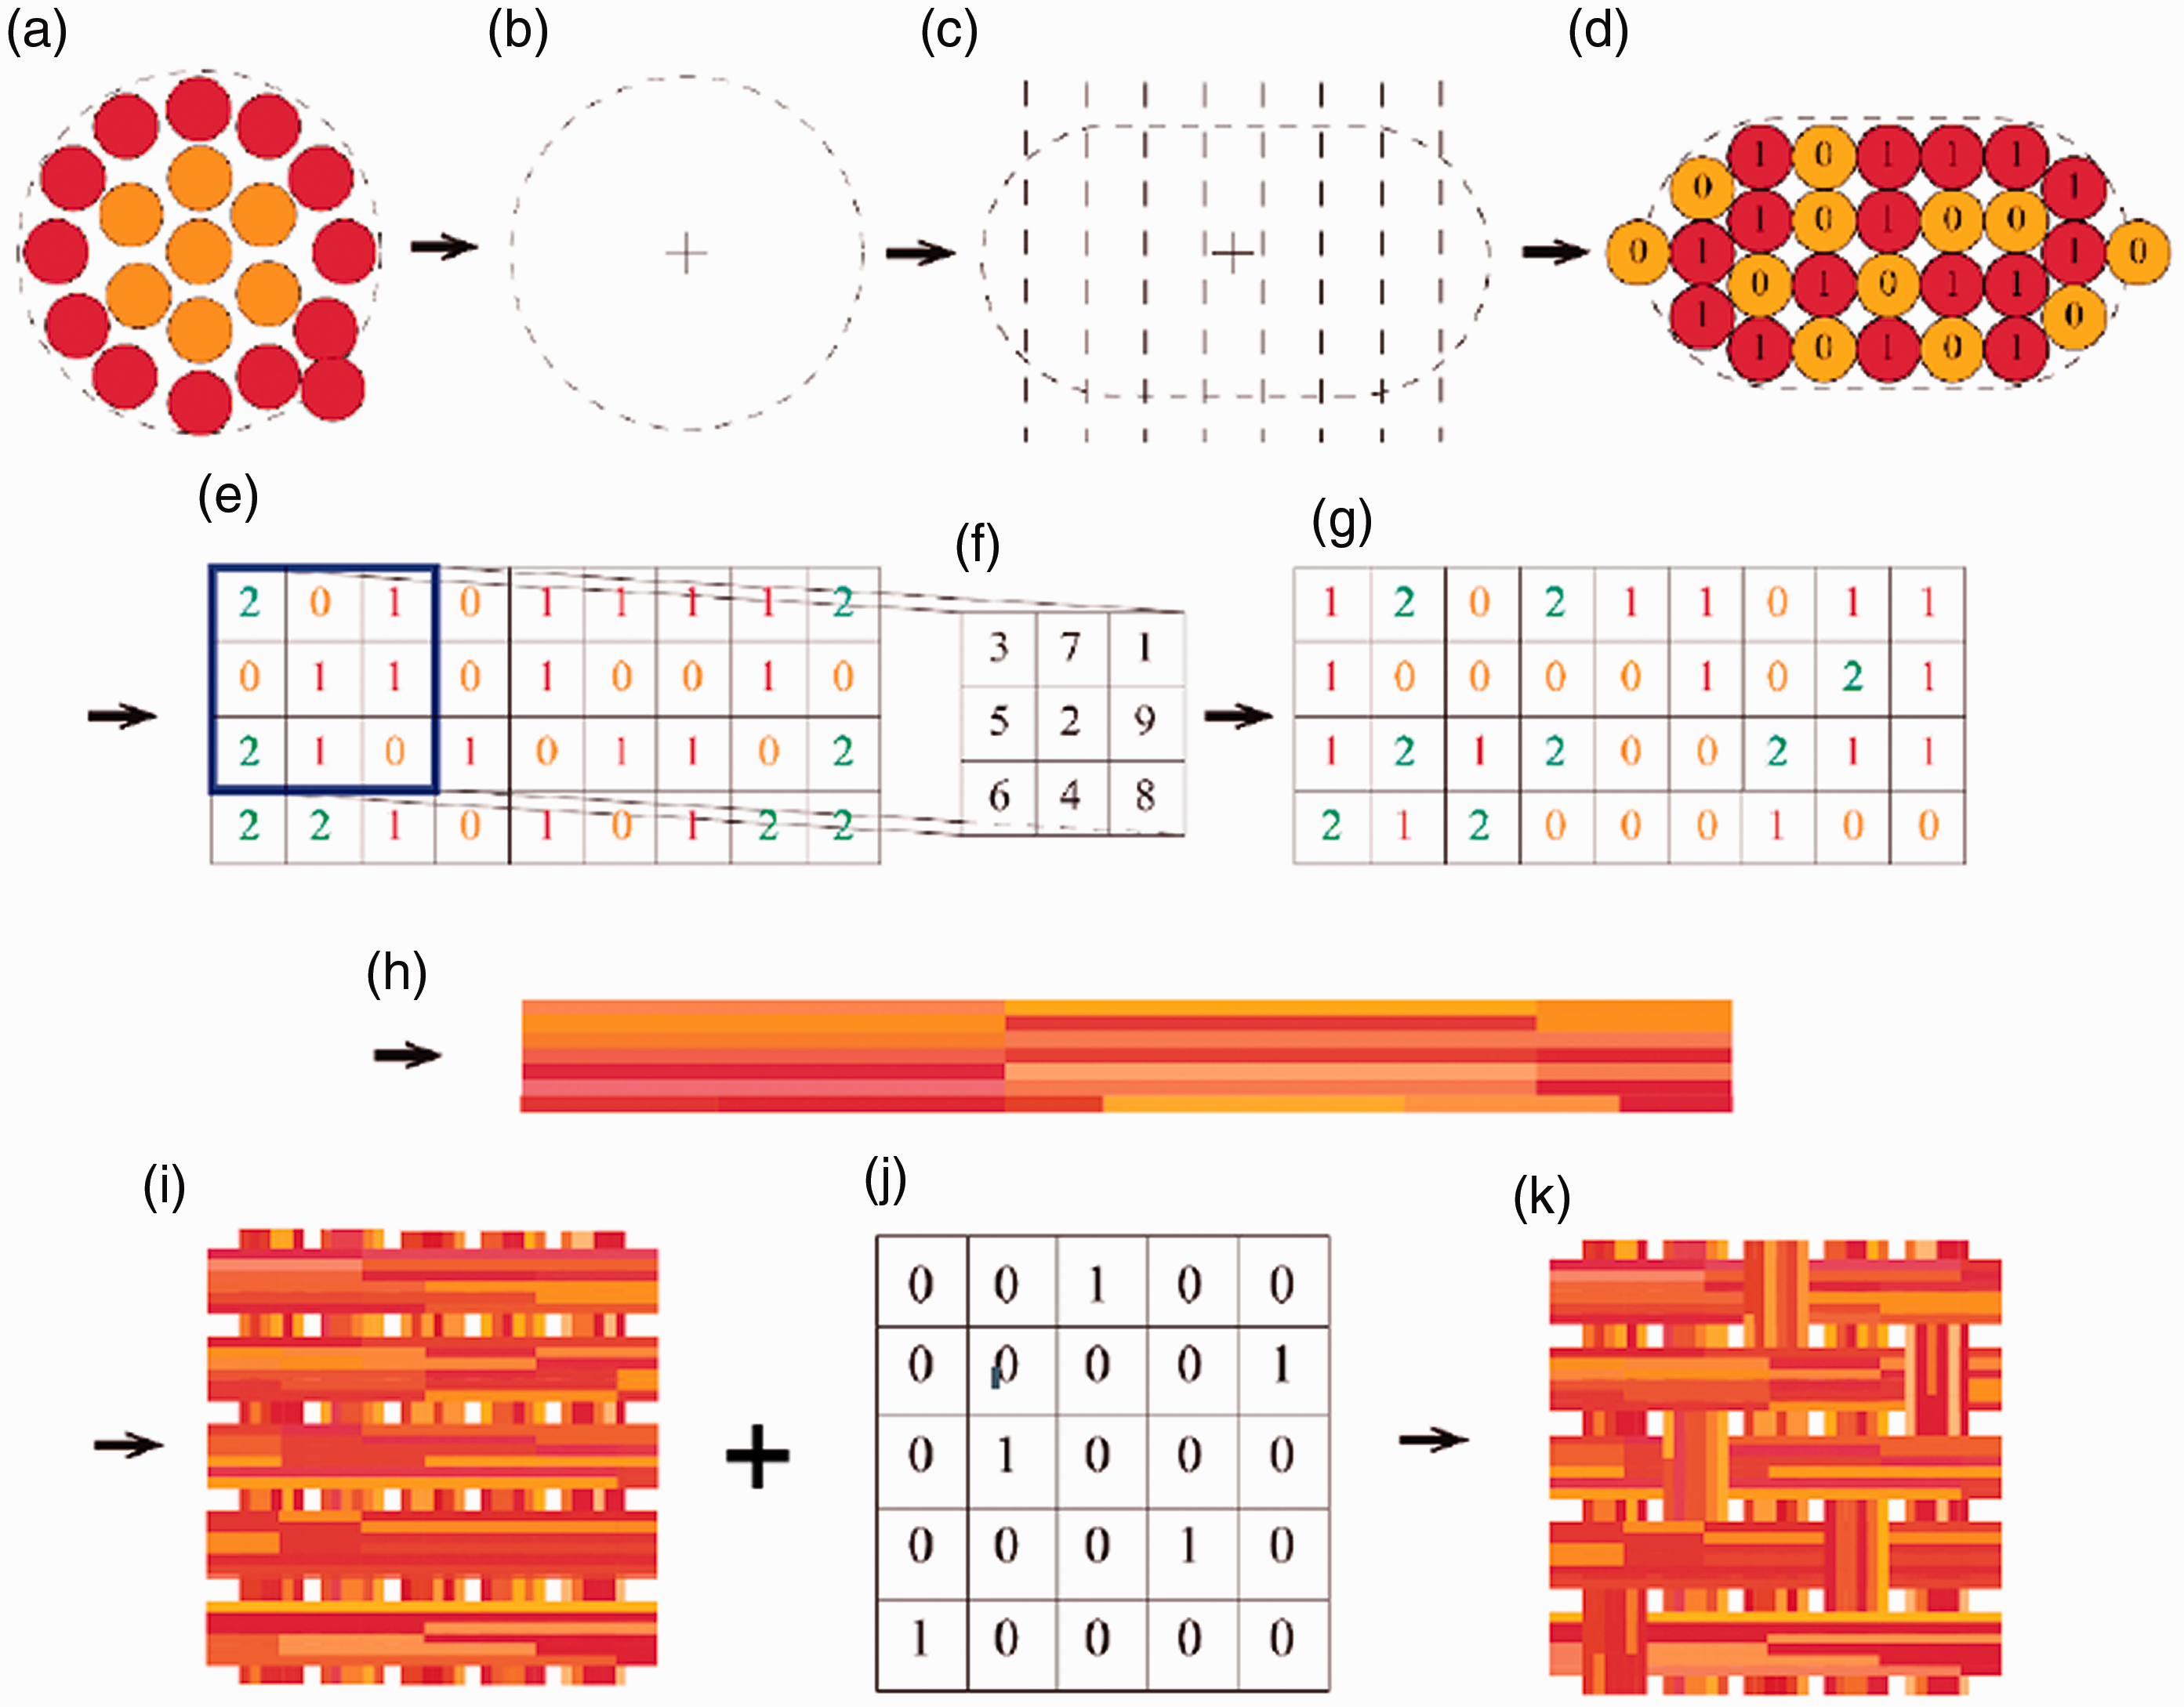
The establishment of the cross-section. In the process of constructing the cross-section, the problem to be solved is the arrangement and color distribution of the monofilament. As shown in Figures 4(a)–(e), if the cross-section of the multifilament not squashed it is assumed to be circular; its perimeter can be obtained by referring to Li.
22
Assuming that the perimeter of the multifilament before and after flattening remains unchanged, the shape of the flattened cross-section can be calculated. The cross-section of the flattened multifilament is divided into several columns based on the diameter of the monofilament. By calculating the maximum number of monofilaments that can be accommodated in each column, the arrangement of monofilaments in the cross-section of the multifilament can be obtained. Then, according to the blending ratio of different colored monofilaments, different colors are randomly assigned to the monofilaments at different positions. Finally, different numbers are used to represent different colored monofilaments to form the array of the monofilament arrangement. The blank part in the array is filled with another number.
The modeling process of the digital hybrid multifilament fabric model: (a) cross-section of the multifilament not squashed; (b) perimeter of the multifilament not squashed; (c) dividing the cross-section of the squashed multifilament; (d) cross-section of the squashed multifilament filled with different colored monofilaments; (e) digital matrix of the arrangement of the monofilaments in the cross-section; (f) matrix for adjusting the position; (g) digital matrix of the arrangement of the monofilaments in the new cross-section; (h) the surface of a multifilament; (i) the surface of the primary fabric model; (j) the Boolean matrix of the fabric texture; (k) the surface of the final fabric model. The establishment of the multifilament. The position of the monofilament will change along the length of the multifilament. In order to reflect this phenomenon, a multifilament is considered to be composed of several multifilament segments. The arrangement of the monofilament in the same multifilament segment remains unchanged, that is, it has the same cross-section; the arrangement of the monofilament is different among different multifilament segments, that is, the cross-section is different. As shown in Figures 4(e)–(g), the small matrix is formed and used to adjust the arrangement of monofilaments in the cross-section to obtain a new cross-section. Finally, the multifilament assembled by different multifilament segments is as shown in Figure 4(h). The establishment of the fabric. In this process, the key is how to reflect the fabric weave type. The Boolean matrix, as shown in Figure 4(j), is used to represent different fabric weave types, and the position of the warp and weft yarns at the weaving point is adjusted according to the Boolean matrix. The final fabric model is shown in Figure 4(k).
Experimental details
Hybrid multifilament fabric
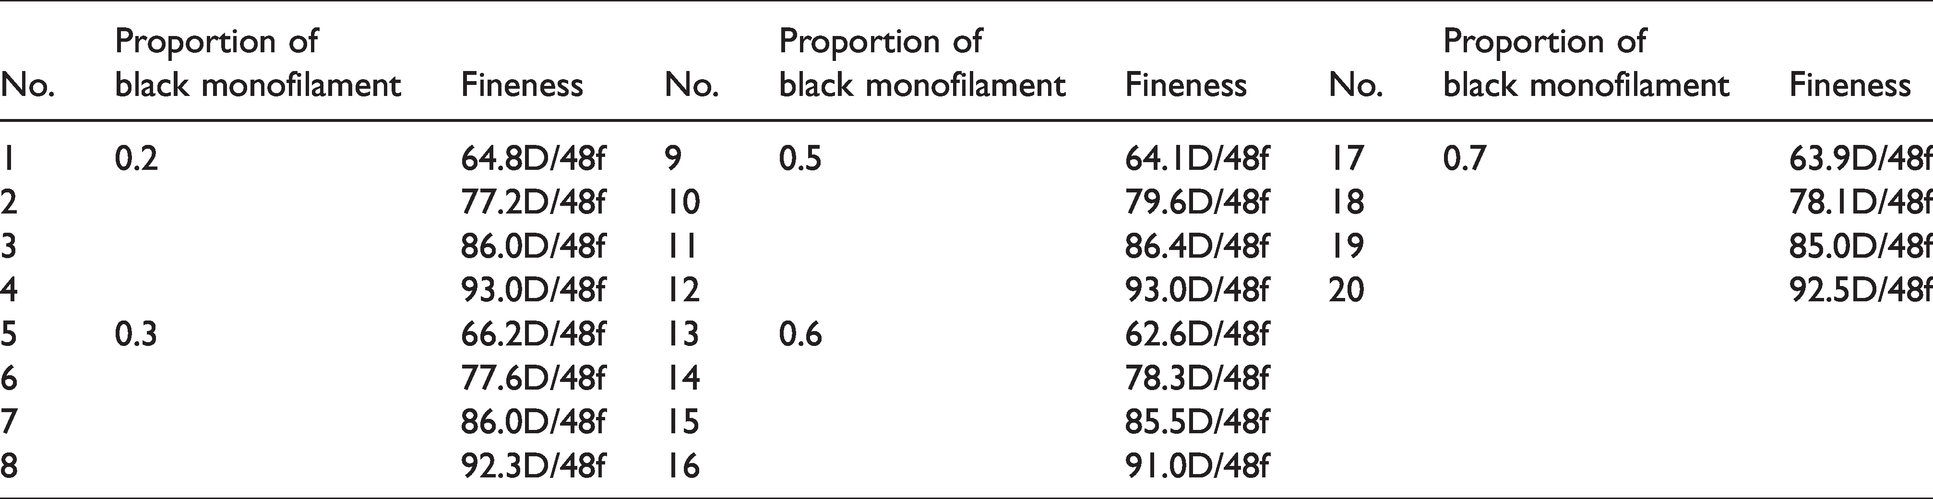
The black polyethylene terephthalate (PET) masterbatch and PET chip with a matting agent were obtained from Suzhou Baolidi Material Technology Co., Ltd. The black monofilament was produced by adding 3% black masterbatch to the chip, and the white monofilament was directly made from the chip. A total of 20 kinds of multifilaments with four types of fineness and five blending ratios of black monofilaments were obtained (Table 1). Since the strength of the single multifilament was too low, three multifilaments were combined into one yarn before weaving. Each kind of multifilament is woven into three kinds of fabrics, namely plain, 1/1 right twill and 5/3 weft satin fabric, using a semi-automatic loom, model SGA598/20″. The average warp and weft density of these fabrics were 280 pieces/10 cm and 200 pieces/10 cm, respectively.
Structural parameters of the multifilament
Color measurement
A Datacolor 850 spectrophotometer, with D65,
The absorption and scattering coefficient of the black and white monofilaments in the fabric calculated by the K-M model (please refer to Walowit et al. 8 for the specific calculation method) are shown in Figure 5.
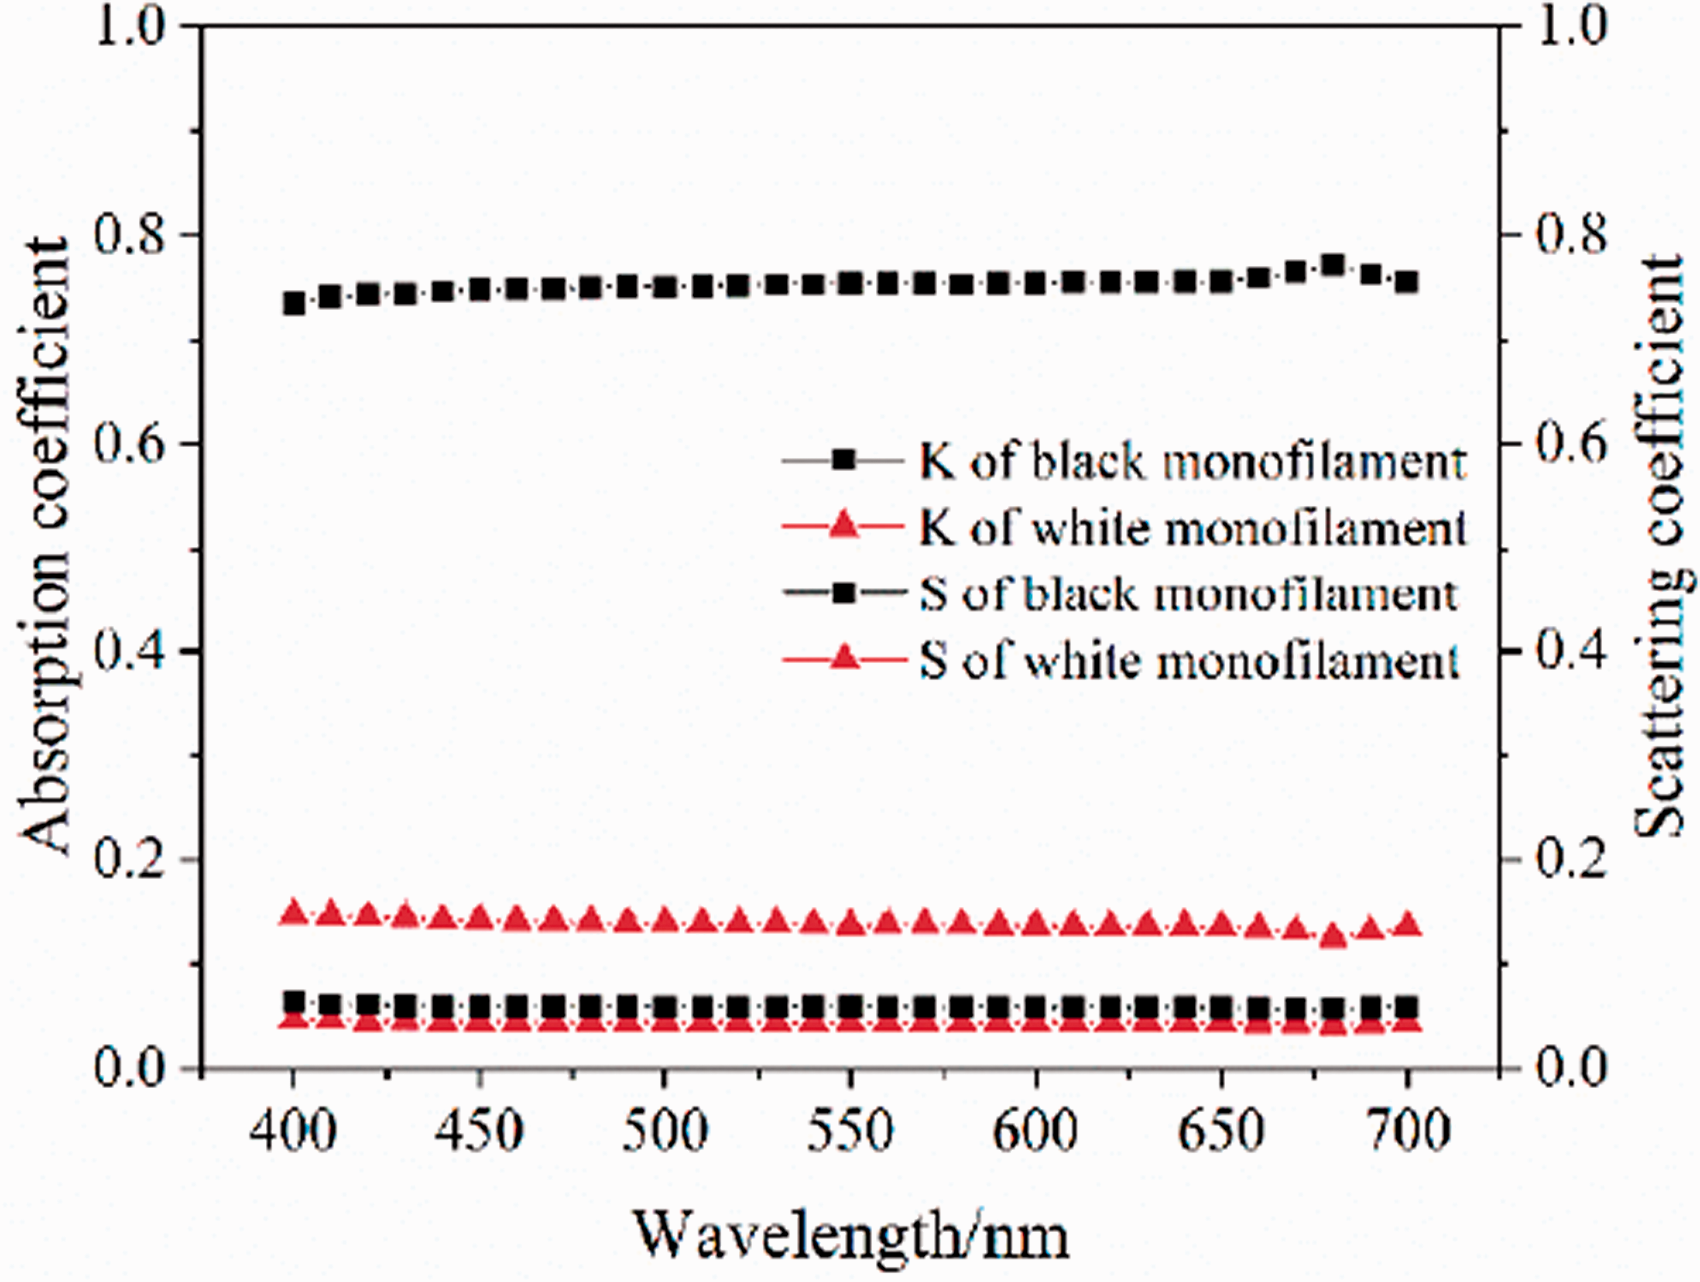
Absorption and scattering coefficient of the black and white monofilaments.
Prediction effect on the color of each point
Although the DigiEye colorimeter can capture the color at any point on the surface of the fabric, it does not know the arrangement of the monofilaments below that point. Therefore, the k-m iterative model cannot directly calculate the color of this point. In other words, it is difficult to verify the effect of the k-m iterative model on the color of a point. However, the effect of the k-m iterative model on the color of a point can be indirectly verified by analyzing the relationship between the color of all points on the real fabric surface and the calculated fabric model surface. The higher the similarity between the color distribution of the real fabric surface and that of the simulated fabric surface, the better the prediction effect of the k-m iterative model on the color of the points.
Since the absorption coefficient and scattering coefficient of the monofilament were calculated based on the mixed colors of the fabric tested by the Datacolor spectrophotometer, and the color of each point on the fabric surface was taken with the DigiEye colorimeter, the calculation results needed to be corrected to avoid the difference between the instruments. The relationship between the mixed color of fabric tested by Datacolor spectrophotometer and DigiEye colorimeter is shown in Figure 6. There was a very high linear relationship between CIE L* and CIE b* obtained by the two colorimeters. In order to correct the errors caused by the different instruments, 40 samples were randomly selected from 60 samples. Through the linear regression algorithm, the correction formulas of CIE L* and CIE b* of samples tested by the Datacolor spectrophotometer were obtained as follows


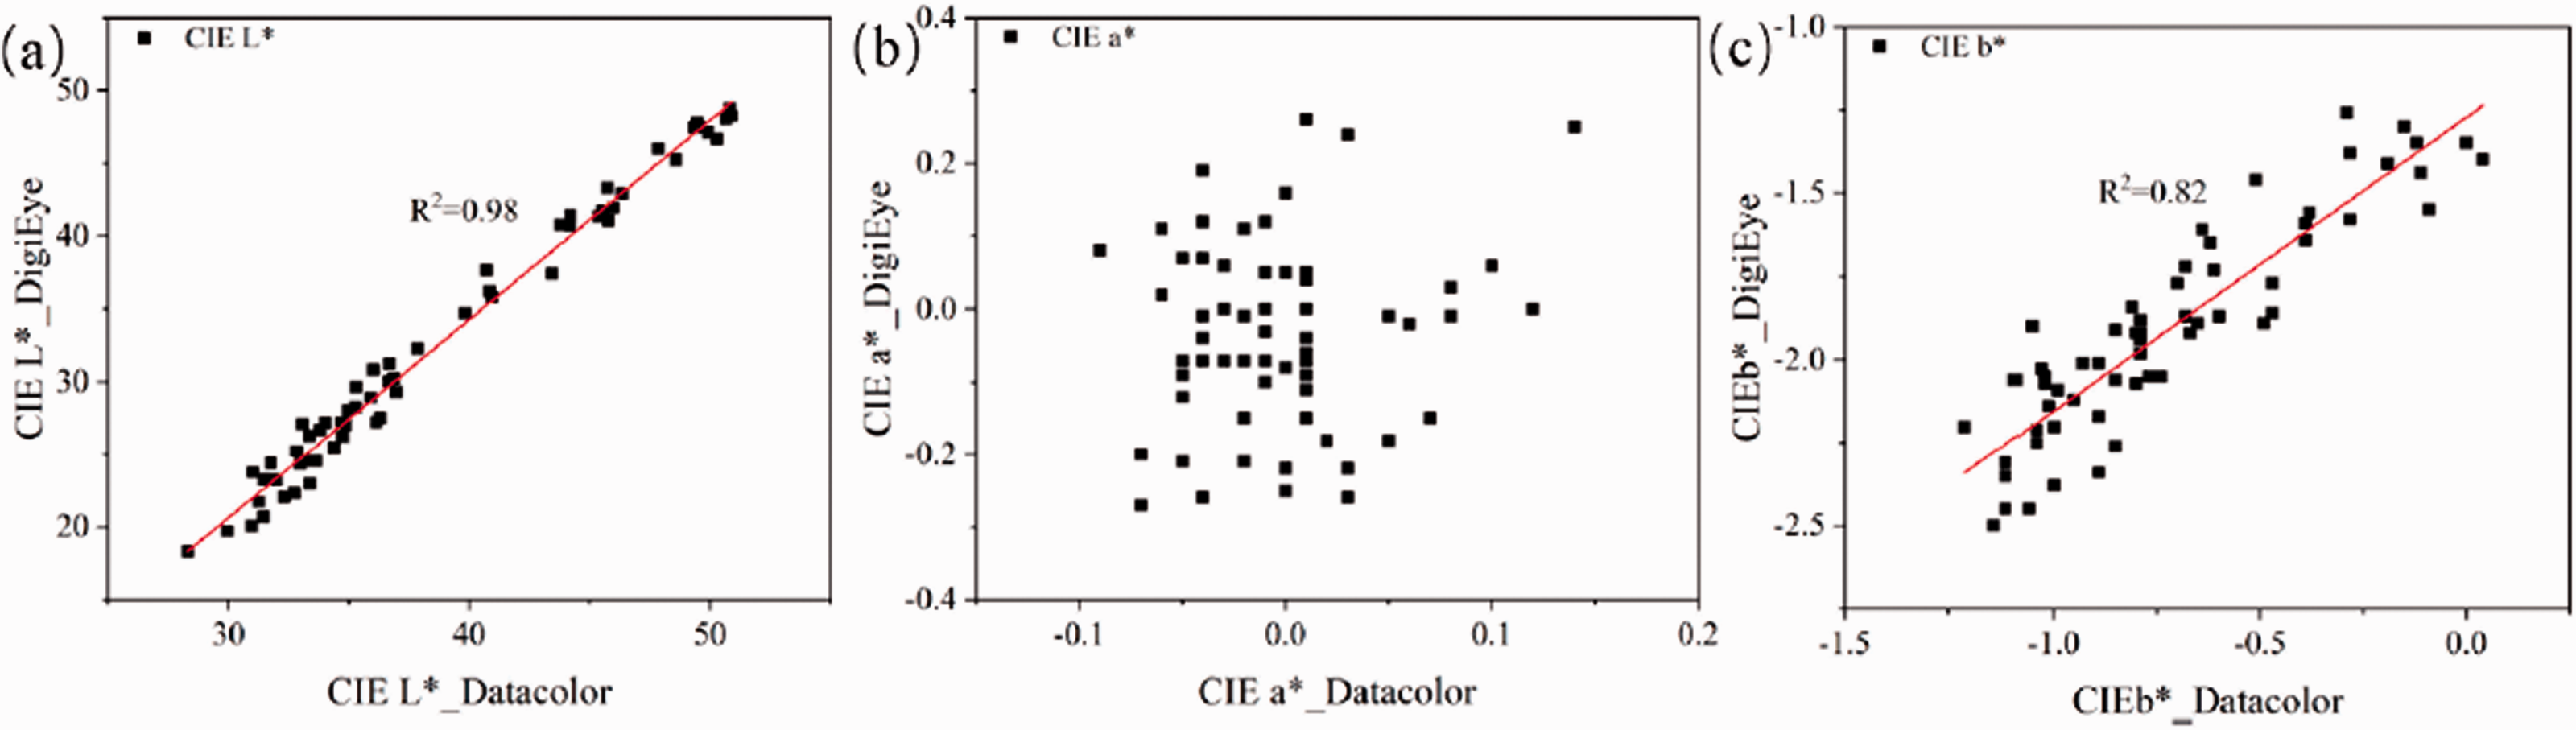
The relationship between (a) CIE L*, (b) CIE a* and (c) CIE b* measured by the Datacolor spectrophotometer and DigiEye colorimeter.
The surface color appearance of the real fabric and that calculated by the k-m iterative model are shown in Figure 7. It can be seen that the color of the points on the fabric surface is quite similar.
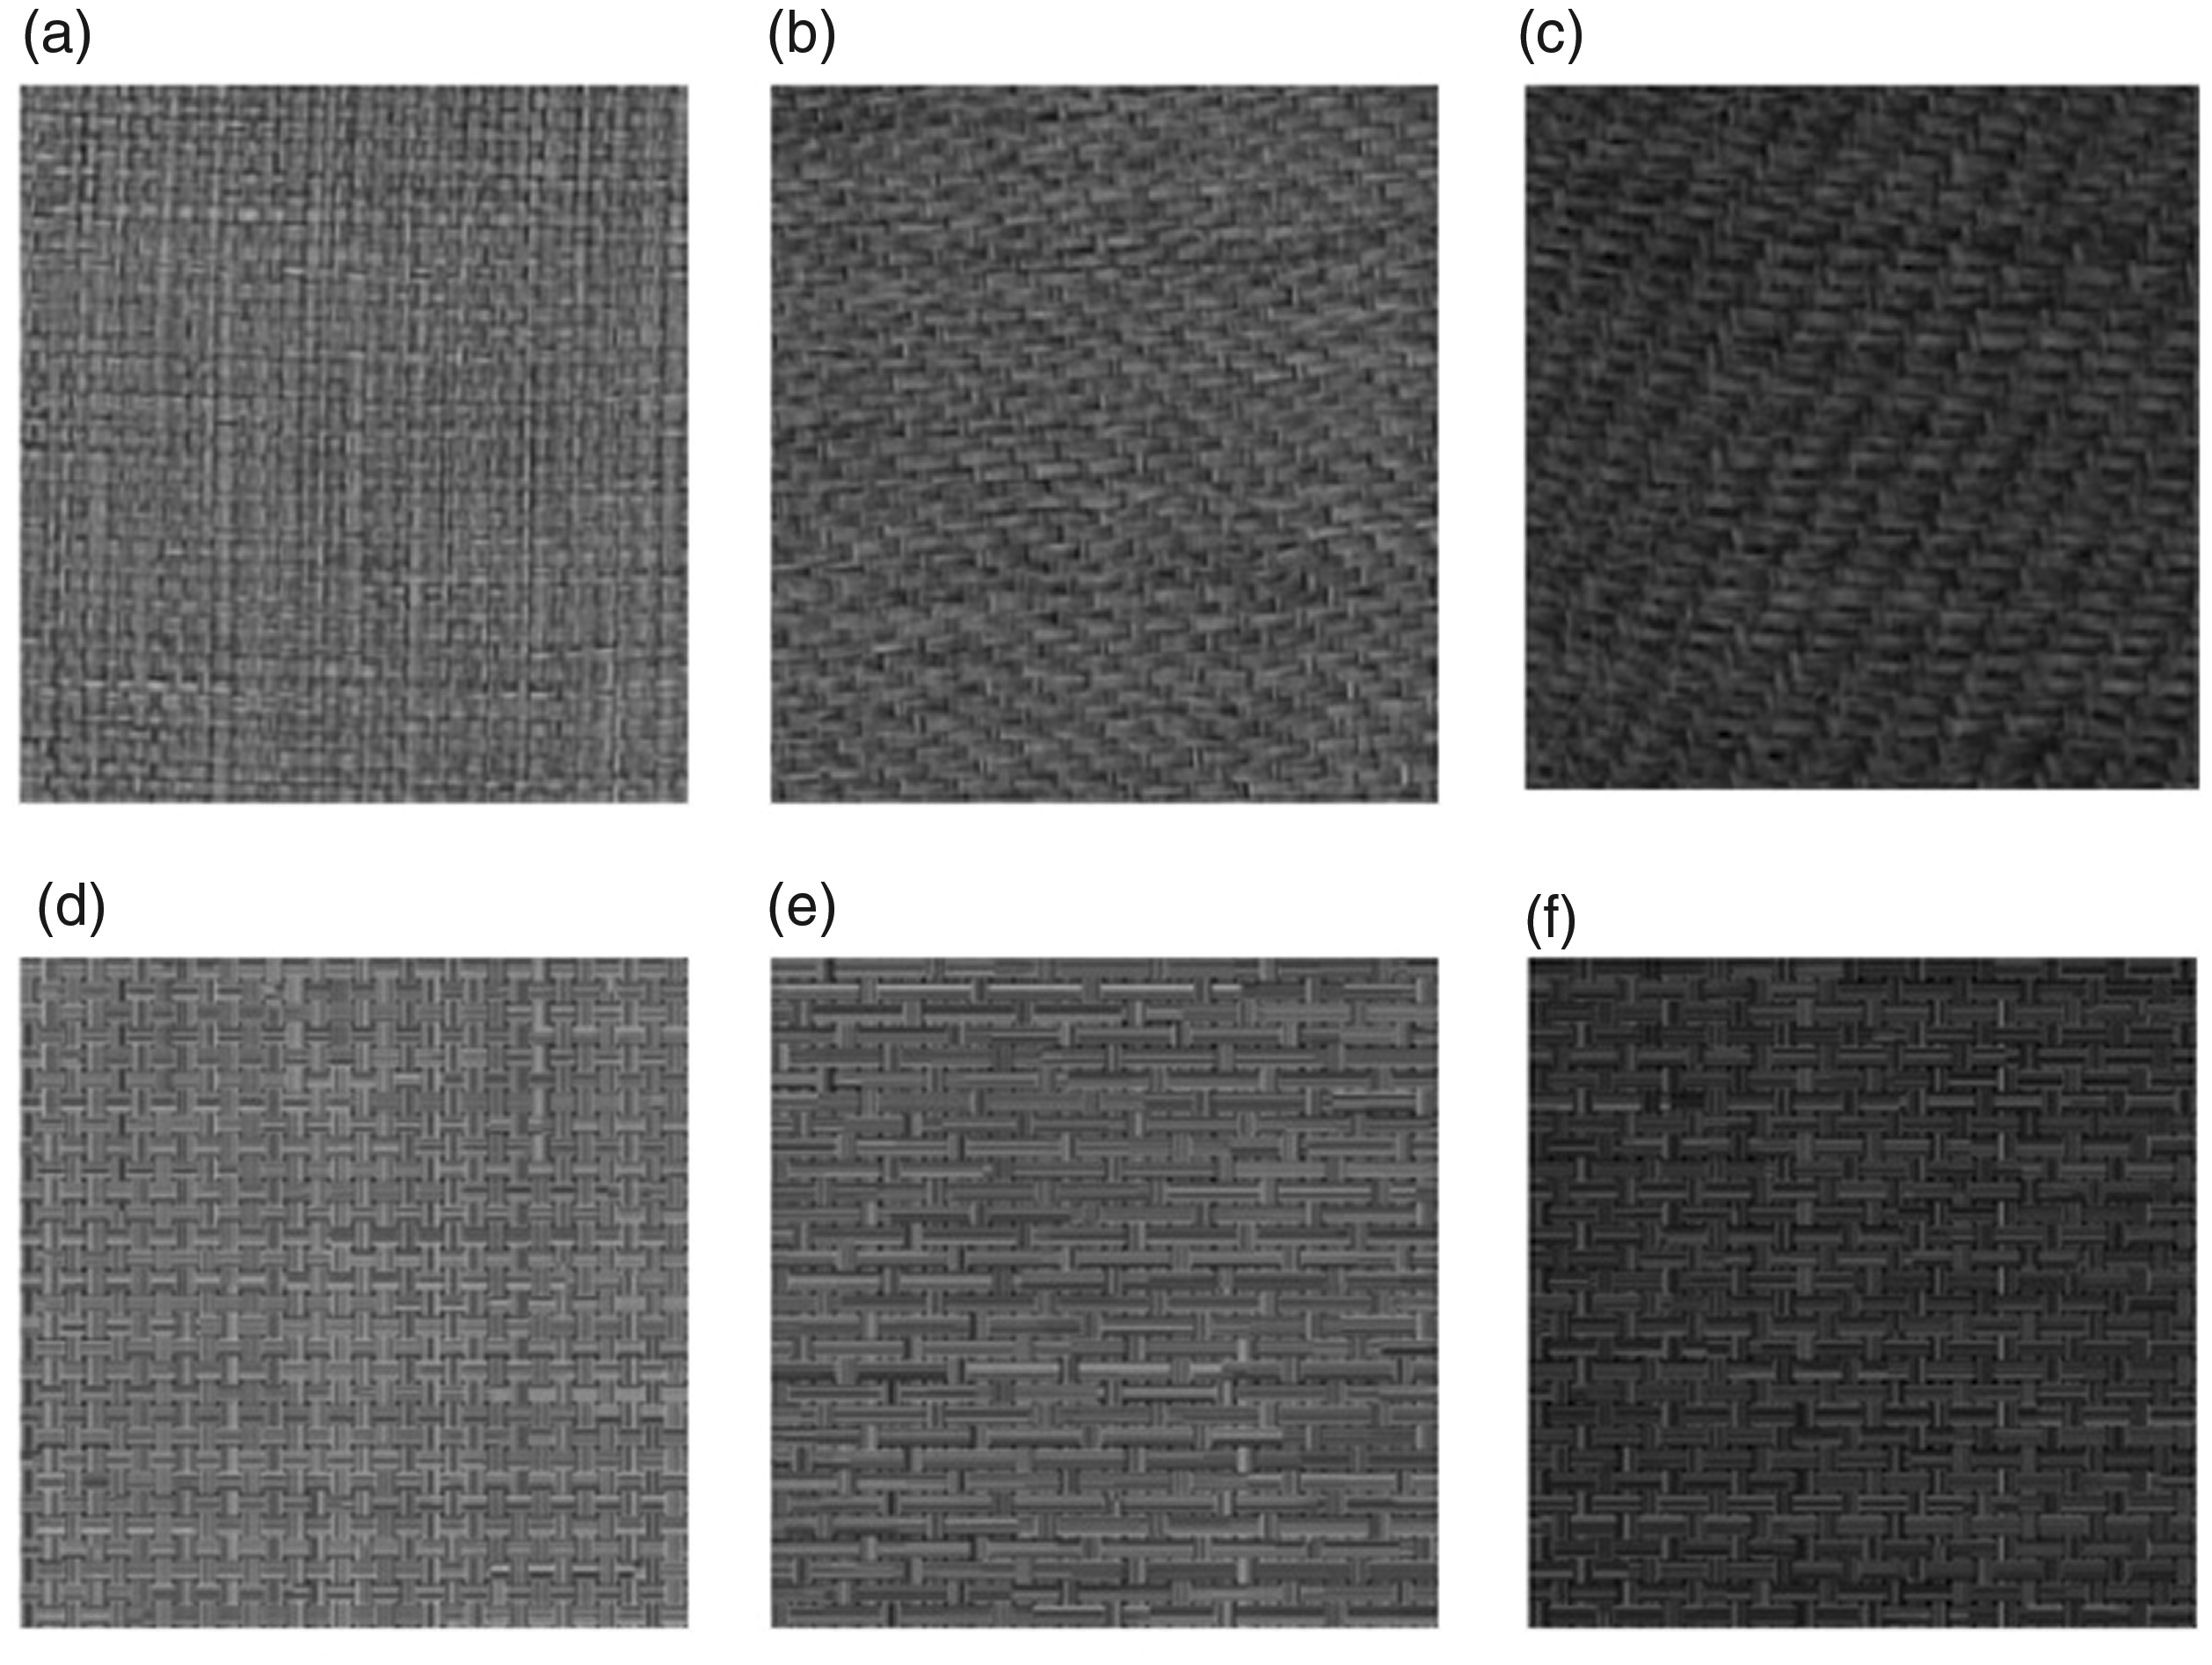
Pictures of (a) and (d) plain fabric, (b) and (e) satin fabric and (c) and (f) twill fabric taken by the DigiEye colorimeter and calculated by the k-m iterative model, respectively.
To more objectively evaluate the relationship between the color distributions on the fabric surfaces, the intersection distance (ID) and Pearson correlation coefficient (PCC) between the gray histograms of the remaining 20 fabrics and the corresponding simulated fabrics were calculated. The closer the two parameters are to 1, the higher the similarity is. The average ID 23 and PCC were 0.79 and 0.89, respectively, as shown in Figure 8. This shows that the distribution of color of the points on the simulated fabric surface were very similar to that on the real fabric surface.
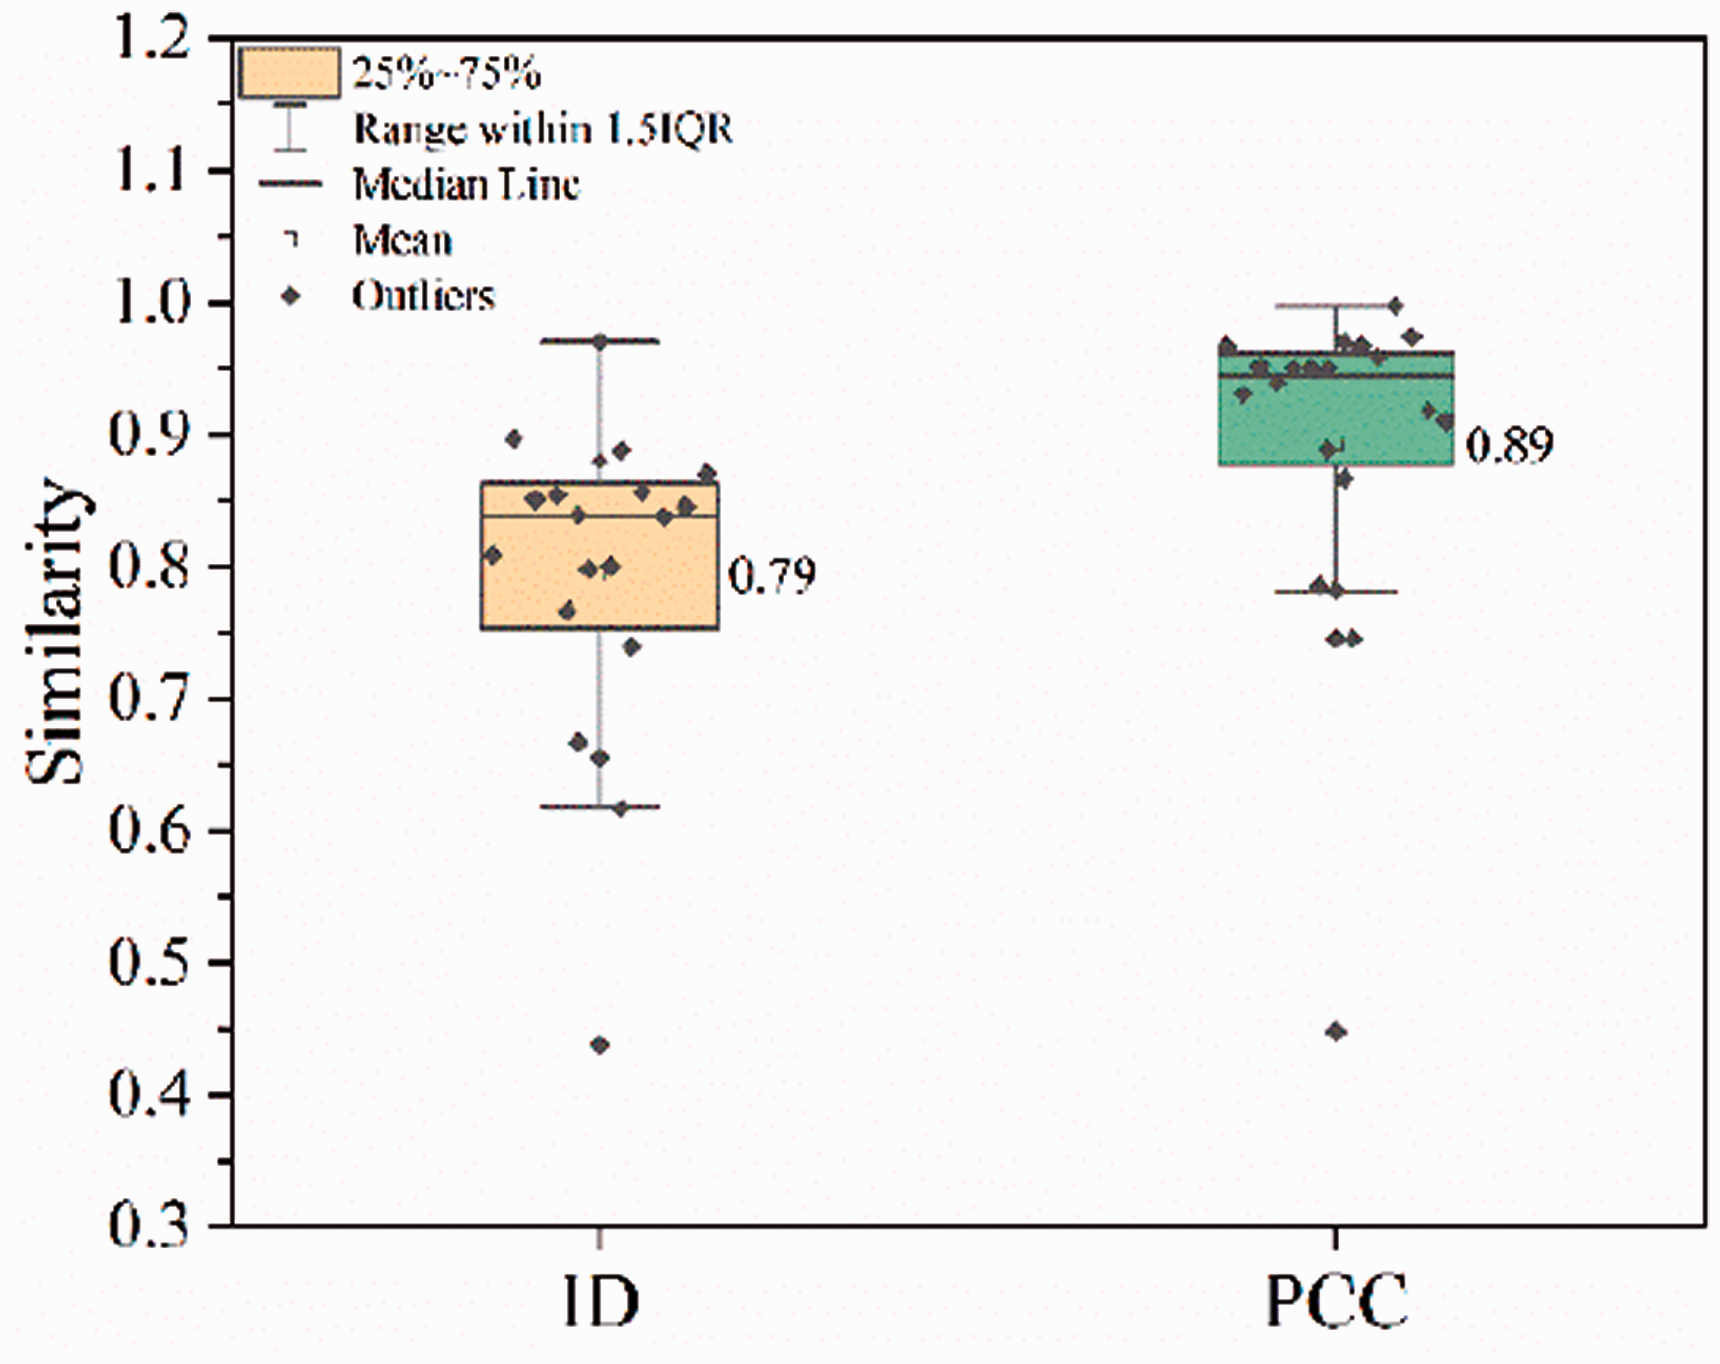
The similarity between the color points on the surface of the real fabric and the simulated fabric. ID: intersection distance; PCC: Pearson correlation coefficient.
Prediction effect on the mixed color
Figure 9(a) shows the lightness of the fabrics measured by the Datacolor spectrophotometer, calculated by the k-m iterative model and calculated by the K-M model. At the interval of 12, each 12 fabrics had the same proportion of black monofilaments, four kinds of filament fineness and three fabric types. Figure 9(b) shows the CIE a* and CIE b* of the fabrics measured by the spectrophotometer, calculated by the k-m iterative model and calculated by the K-M model. Since the arrangement of the monofilaments in the real fabric is very complex, and there are impurities, mirror light and other factors affecting the test results, the mixed color distribution of fabrics measured by the spectrophotometer was very scattered. Although the fabric model in the k-m iterative model considered the monofilament arrangement, the monofilament arrangement was relatively regular and simple, and there is no influence of impurities, mirror light or other factors. Therefore, the mixed color distribution of the fabrics calculated by the k-m iterative model was relatively concentrated. However, the K-M model only concerns the mixing ratio of the monofilament; the influence of other fabric structure parameters is not considered. Thus, the mixed color distribution of fabrics calculated by the K-M model was very concentrated.
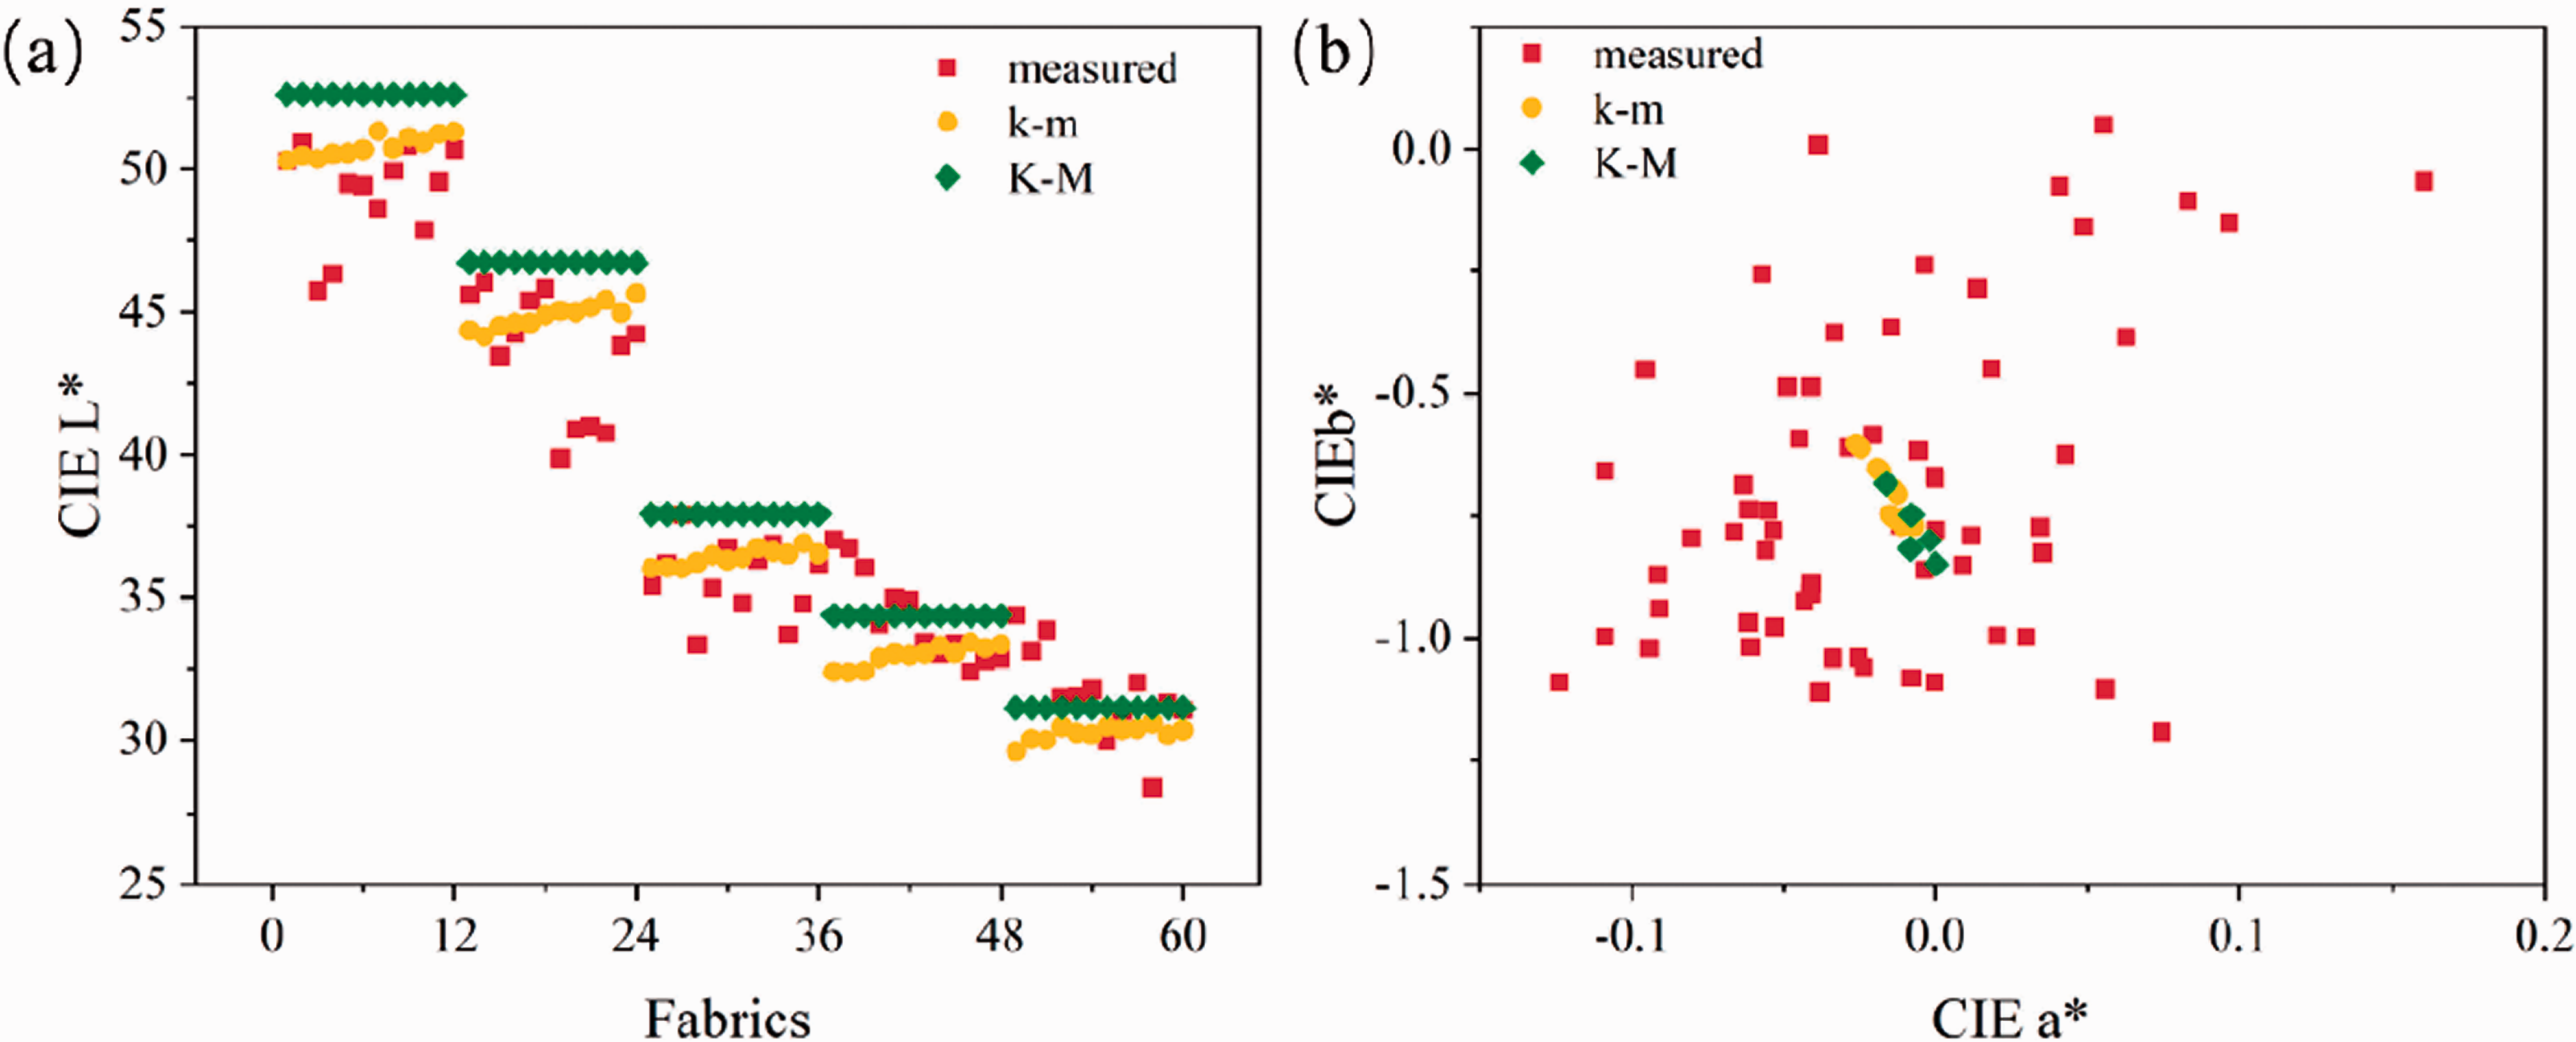
The mixed color distribution of fabrics measured by the spectrophotometer, calculated by the k-m iterative model and calculated by the Kubelka–Munk (K-M) model: (a) CIE L*; (b) CIE a* and CIE b*.
Comparison with other models
In addition to the K-M model, the S-N model and the F model are commonly used to calculate the mixed color of textiles. By comparison with the prediction effect of more models, the prediction effect of the k-m iterative model can be more fully verified. The S-N model and F model are as given in Equations (9) and (10)
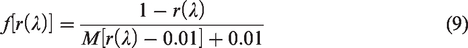

Here,
Forty fabrics were randomly selected from 60 fabric samples to solve the unknown parameters of the S-N model and the F model. Finally, their unknown parameters were set to 0.241 and 0.101, respectively. The remaining 20 fabric samples were used to verify the effect of the four models, as shown in Figure 10.
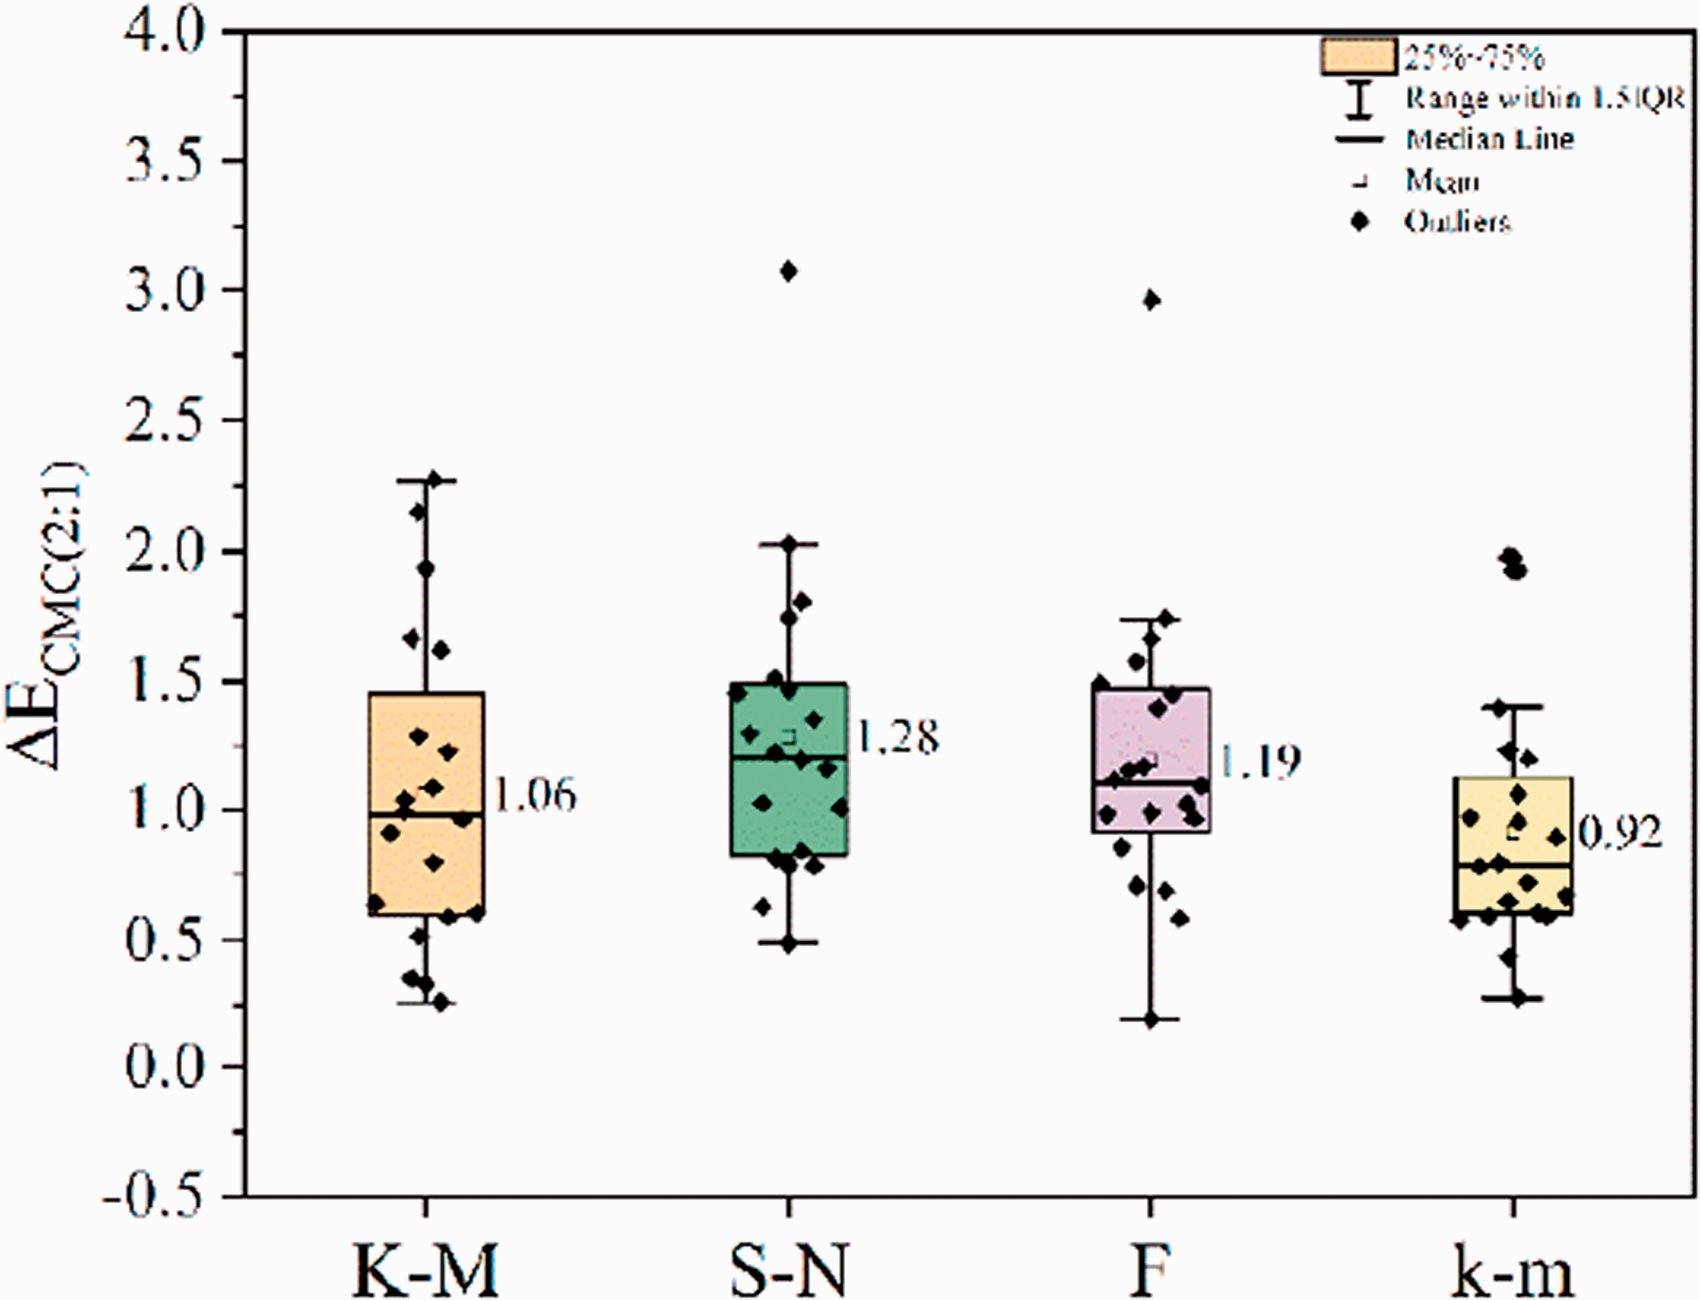
The color difference of the prediction results of different models. CMC: Color Measurement Committee; K-M: Kubelka–Munk model; S-N: Stearns–Noechel model; F: Friele model; k-m: Kubelka-Munk iterative model.
The mean values of color difference predicted by the K-M model, S-N model, F model and k-m iterative model were 1.06 Color Measurement Committee (CMC) (2:1) units, 1.28 CMC (2:1) units, 1.19 CMC (2:1) units and 0.92 CMC (2:1) units, respectively. The mean value of color difference predicted by the k-m iterative model was the smallest, which indicated that the prediction effect was satisfactory.
Influence on chromaticity difference
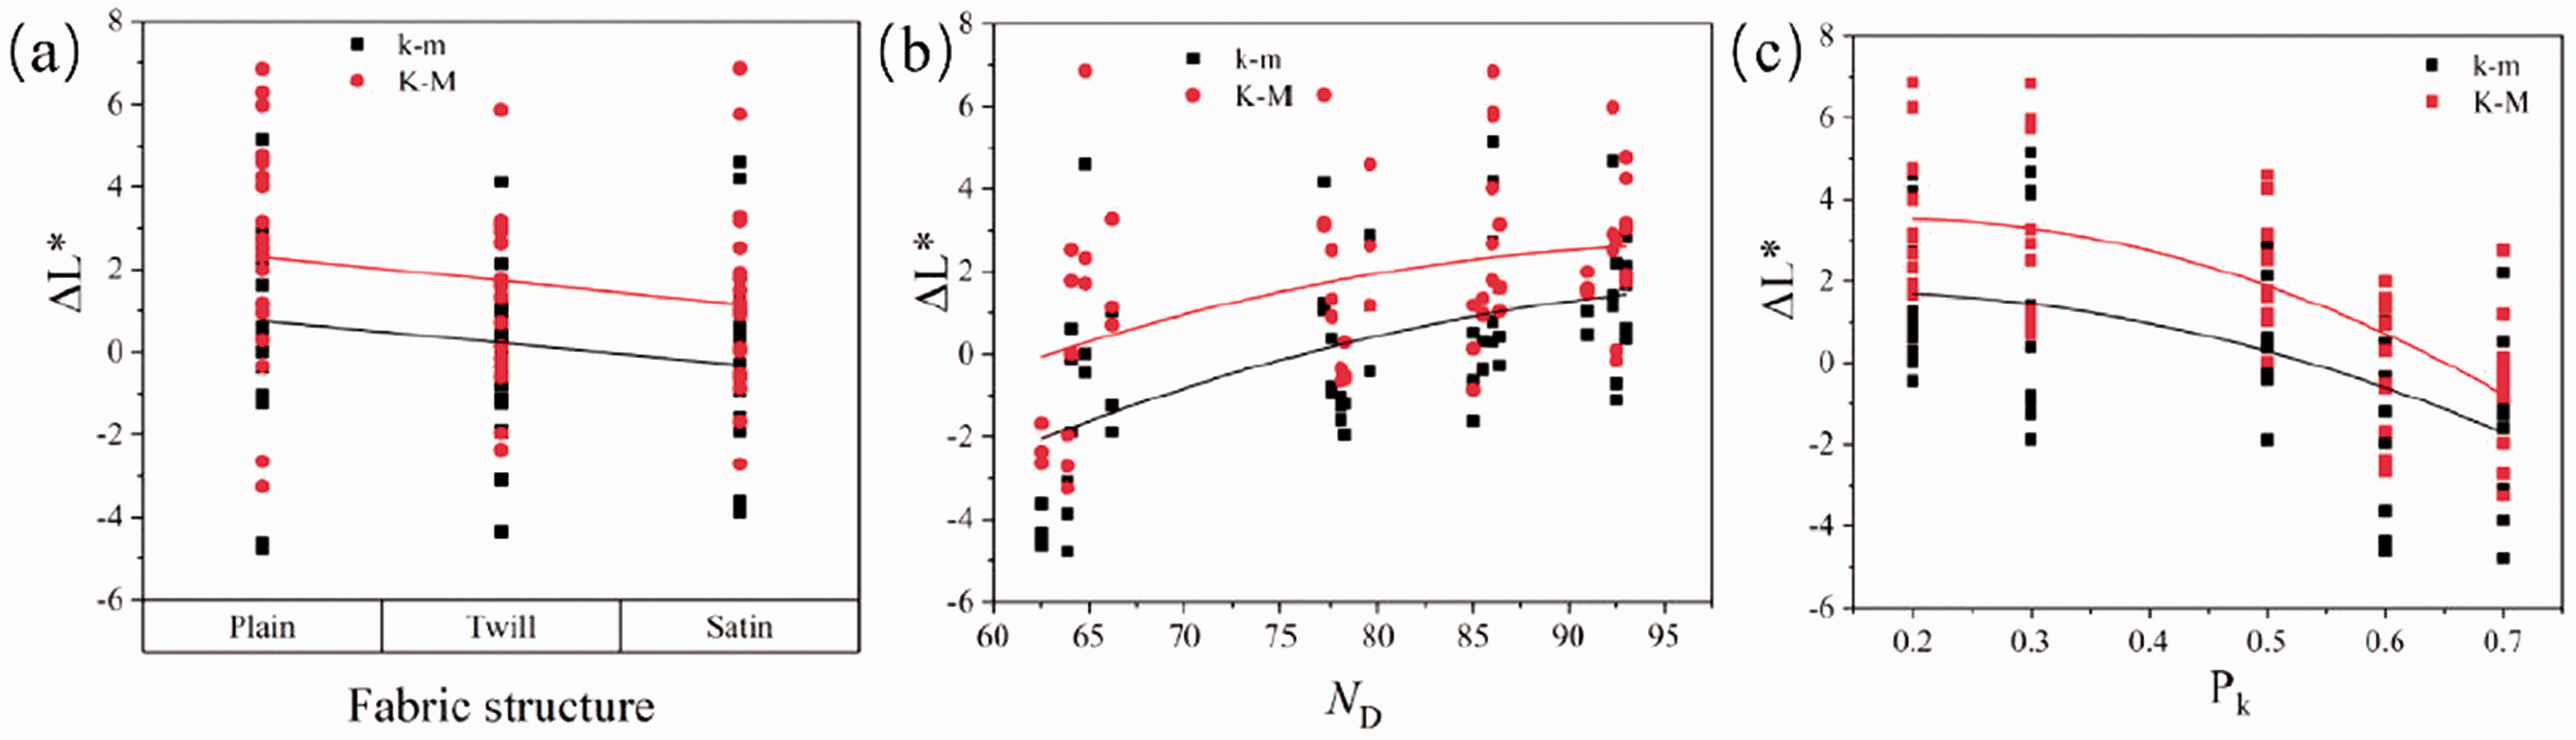
For gray fabrics, the color difference mainly comes from the lightness difference. The CIE a* and CIE b* of the fabric were very small, and they were easy to be affected by external conditions during the test. Besides, the difference between different fabrics mainly lay in the proportion of the black monofilament, multifilament fineness and fabric structure type. Therefore, the influence of these fabric structures on the lightness difference was mainly analyzed here. The relationship among them is shown in Figure 11.
Relationship among lightness difference
As can be seen from Figure 11, since both the k-m iterative model and the K-M model are derived from the simple radiation theory, the difference between the true lightness and the lightness calculated by the two models had the same trend with the fabric weave, multifilament fineness and black monofilament mixing ratio.
It can be seen from Figure 11(a) that from plain weave fabric to satin weave fabric, the
It can be seen from Figure 11(b) that with the increase of the fineness of the multifilament,
As can be seen from Figure 11(c), with the increase of Pk,
Conclusion
This paper proposed a k-m iterative model, which was based on the calculation method of the reflectance of transparent objects proposed by Kubelka and Munk,4 and was used in combination with a fabric model that can reflect the arrangement of monofilaments. Thus, the k-m iterative model can calculate the color of the points on the fabric surface and the mixed color of the fabric. By verifying the prediction effect of the model and analyzing the influencing factors, the following conclusions were drawn.
The ID and PCC between the gray histogram of the fabric picture taken by DigiEye colorimeter and that calculated by k-miterative model were 0.79 and 0.89, respectively. The mean value of color difference between the mixed color measured by the spectrophotometer and calculated by the k-m iterative model was 0.92 CMC (2:1) units, while the mean values of color difference between the mixed color tested and calculated by the K-M model, S-N model and F model were 1.06 CMC (2:1) units, 1.28 CMC (2:1) units and 1.19 CMC (2:1) units, respectively. For the fabric mixed with black monofilaments and white monofilaments, the color difference mainly comes from the lightness difference. The factors causing the lightness difference were fabric weave type, multifilament fineness and monofilament blending ratio. For fabrics with a longer float, smaller multifilament fineness or larger black monofilament blending ratio, the calculated lightness was smaller than the tested lightness.
The model is satisfactory in predicting the color of the points on the fabric surface and the overall mixed color of the fabric. However, due to the relatively simple construction of the fabric model, the color appearance of the simulated fabric is still different from that of the real fabric. Solving this problem will be very beneficial to the promotion of the hybrid multifilament.
Footnotes
Acknowledgement
The authors thank Suzhou Baolidi Material Technology Co., Ltd for providing the spinning materials.
Declaration of conflicting interests
The authors declared no potential conflicts of interest with respect to the research, authorship, and/or publication of this article.
Funding
The authors received no financial support for the research, authorship and/or publication of this article.