
Abstract
This study conducts alternative-basic-angle trapezoidal tearing and single-edge notch tearing tests on a polytetrafluoroethylene coated woven fabric, where the two methods are related through the basic angle of a trapezoid. The tearing process and failure modes are carefully examined, and load–displacement curves and tearing strength are analyzed. The tearing process comprises three stages, which are distinguished photographically or in different load–displacement curve sections. Corresponding to these stages, failure modes can be classified into three parts with varying extension directions. The effect of the basic angle is clearly illustrated. As the angle increases, three stages and parts appear in sequence; the tearing strength increases, but the larger one changes from weft to warp. The relationship between the tearing process and tearing strength is described. The three stages correspond to the increase in tearing strength, occurrence of the maximum tearing strength, and failure. Because the single-edge notch tearing method is more complex and important, it is the method that is studied mainly. Digital image correlation equipment is used to observe the strain distribution at the crack section. Moreover, the applications of four frequently used models are investigated. The results indicate that Thiele’s empirical formula offers the best simulation among the three tearing strength prediction models, and the theoretical stress distribution model also provides good simulation. Furthermore, a numerical simulation is conducted. The critical tearing strength and load–displacement curves before tearing initiates acquired through the simulation and test agree well. All results may provide basic data for future improvements in design theories.
Owing to their lightweight and unique shape design, membrane structures have been widely adopted in stadiums, transport facilities, convention centers, and other structures and buildings. Despite their widespread global application, failures of membrane structures caused by factors such as strong wind or heavy snow occur occasionally. These accidents are primarily due to possible damage, such as broken yarns, holes, or cracks in membrane materials. These damages can induce stress concentration and lead to tearing in the case of membrane structures bearing excessive snow or wind loads. The propagation of tearing ultimately results in an overall structural failure. 1 – 3 Therefore, the mechanical resistance of membrane materials is worth studying, 4 , 5 and the determination of methods for measuring the tearing strength are important research projects.
Currently, the frequently used tearing tests for membrane materials can be divided into two categories. One category comprises out-of-plane tearing tests, and the other comprises in-plane tearing tests. The former mainly includes the single- and double-tongue tearing methods, 6 while the latter mainly includes the trapezoidal tearing method, 7 – 10 the central crack tearing method, 11 and the single-edge notch tearing method. The researches on tearing tests in the early stage have mainly been focused on the single- or double-tongue tearing method and the trapezoidal tearing method. Studies on the tongue tearing method can be first attributed to Krook and Fox. 12 Based on the observation of the single-tongue tearing process of woven fabrics, they first proposed the concept of the tearing del-zone. In addition, they analyzed factors affecting the single-tongue tearing strength. Teixeira et al. 13 also found that some specific properties of fabrics, such as the weaving method and yarn structure, have significant impacts on the single-tongue tearing strength. Hager et al. 14 conducted trapezoidal tearing tests on woven fabrics and highlighted that the trapezoidal tearing strength depended on the yarn breaking elongation, yarn breaking force, and fabric structure. Steele and Gruntfest 15 derived a formula for predicting the trapezoidal tearing strength of woven fabrics, but this formula could only predict the critical trapezoidal tearing strength, not the maximum tearing strength. Chu and Chen 16 analyzed the relationship between the trapezoidal tearing strength and the properties of coated and uncoated fabrics. They proposed a formula for determining the maximum trapezoidal tearing strength. Wang et al. 17 studied the mechanism of the trapezoidal tearing method, derived a formula to predict the trapezoidal tearing strength, and compared the theoretical and test results. Wang et al. 18 adopted the finite element method to simulate the trapezoidal tearing process of coated and uncoated fabrics and investigated the factors influencing trapezoidal tearing tests. Triki et al. 19 – 21 studied the single-tongue tearing behaviors and the central crack tearing behaviors of fabrics from the perspective of the energy release rate. They calculated the energy release rate based on the load–displacement curves and established the relationship between the properties of fabrics and the strain energy density. Their results showed that the energy release rates acquired by the different tearing tests were similar. Witkowska and Frydrych 22 focused on the relationship between different tearing tests (including static and dynamic ones) and obtained the correlation between these test methods. Among these tearing methods, the trapezoidal tearing method is widely adopted by technical specifications for membrane structures because of its simple failure mode and stable results. 7 – 10 However, in this method, the tearing strength is determined by the size of the tearing del-zone, which is a triangular zone formed due to the elongation of some longitudinal yarns at the tip of the crack in a specimen. Therefore, its stress state deviates from that of actual membrane structures, which are mainly subjected to multi-axial stress and have a whole-section carried load.
Because of the drawbacks of the trapezoidal tearing method, many studies have focused on finding a suitable tearing method to reflect the actual tearing status of membrane structures. The failure modes and stress state of the central crack tearing and the single-edge notch tearing specimens are closer to those of membrane structures. Therefore, an increasing number of researches have been focused on them in recent years. These researches primarily focused on membrane materials and airship envelope materials. Maekawa et al. 23 studied the tearing properties of airship envelope materials using biaxial central crack tearing tests and inflatable cylinder tests and proposed a model wherein the stress was exponentially distributed along the slit section. The results showed that the tearing strength predicted using Thiele's empirical formula and their model was in good agreement with the test results. Bigaud et al. 24 performed uniaxial and biaxial central crack tearing tests on polyvinyl chloride (PVC) coated fabrics and analyzed the factors affecting the failure modes and tearing strength. They also used the finite element method and some theories in fracture mechanics to analyze the test results. Zhang et al. 25 conducted experimental and theoretical studies on the uniaxial central crack tearing properties of PVC coated woven fabrics and revealed the effects of the notch shape, notch size, loading rate, specimen size, and other factors on tearing behavior. They also established a model for predicting the tearing strength. He et al. 26 conducted uniaxial central crack tearing tests of polytetrafluoroethylene (PTFE) coated woven fabrics and studied the critical strain energy release rate GIC based on the virtual crack closure technique. Chen et al. 27 – 29 systematically studied the uniaxial and biaxial central crack tearing properties of airship envelope materials by taking the influencing factors, such as the notch length, notch angle, off-axis angle, and stress ratio, into consideration. They derived theoretical formulas to predict the tearing strength with and without the off-axis angle based on the Griffith energy theory and Tsai–Hill criterion, respectively. Wang et al. 30 performed uniaxial central crack tearing tests on a new airship envelope material. By assuming the stress distribution of the yarns, they proposed a tearing strength prediction model. Bao et al. 31 conducted uniaxial tearing tests, single-edge notch tearing tests, and trapezoidal tearing tests of a PVC coated fabric, while considering various influencing factors. Based on the results, the fracture toughness GIC obtained using the theoretical and test methods is introduced and compared.
Most of the above researches primarily focus on one or two tearing methods, and the study subject mainly comprises the tearing strength and its influencing factors, fracture parameters, or numerical simulations. As indicated by recent researches, the fracture toughness is receiving significant attention24,26,27,31 and is currently a hot research subject. Researches focusing on the correlation between different methods are limited. Furthermore, PTFE coated woven fabrics have widespread applications in membrane structures, but research on their tearing properties is still scarce. The trapezoidal tearing method and single-edge notch tearing method are both in-plane tearing tests and have their own characteristics and values, and the relationship between them is worth studying. Therefore, in this study, alternative-basic-angle trapezoidal tearing tests and single-edge notch tearing tests of a PTFE coated glass fiber fabric are conducted in order to determine the relation between these two methods by changing the basic angle. Based on the two tearing tests, load–displacement curves are acquired, the tearing process and failure modes are carefully observed and investigated, and the tearing strength is also recorded and researched. Furthermore, the influence of the change in the basic angle on the afore-mentioned aspects is illustrated in detail. Because of the complexity and importance of the single-edge notch tearing tests, the strain distribution at the crack section of the samples is observed using digital image correlation (DIC) equipment to deepen our understanding of this method, the application of four theoretical models is investigated, and a numerical simulation is conducted. The results show that Thiele’s empirical formula has the best simulation of test results among the three tearing strength prediction models, and the theoretical stress distribution model can also offer a good simulation in most cases. In the numerical simulation, the critical tearing strength and load–displacement curves before tearing initiates agree well with those of the test. This work focuses on the basic test results, which can provide further understanding and basic data for the theoretical analysis and finite element analysis, as well as improve the design theories of membrane structures in the future.
Materials and experimental set-up
Materials
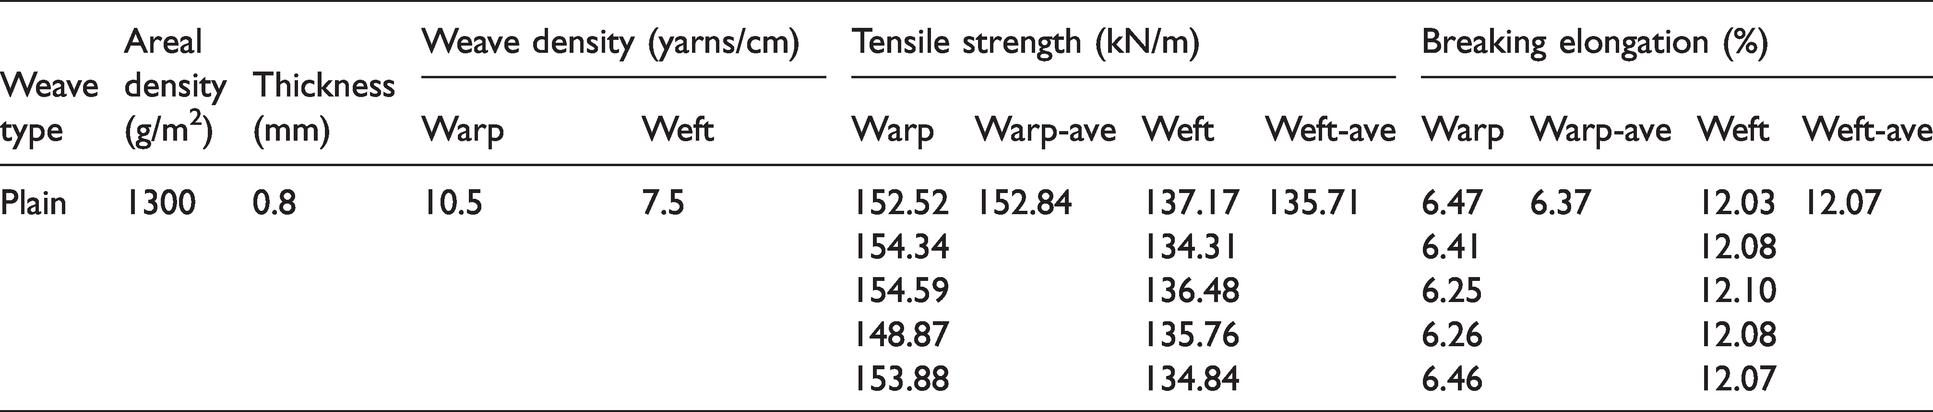
In this study, the selected material is a woven glass fiber fabric with a PTFE coating (see Figure 1). The spacings between the yarns in the warp and weft directions are 0.95 and 1.33 mm, respectively, the thickness is 0.8 mm, and the areal density is 1300 g/m2. The basic properties of the PTFE coated fabric are listed in Table 1. In the table, the uniaxial tensile tests are conducted according to the DG/TJ08-2019-2007 standard. 10 The tensile strength and breaking elongation are obtained for five specimens in the warp and weft directions, and the average values are also listed.
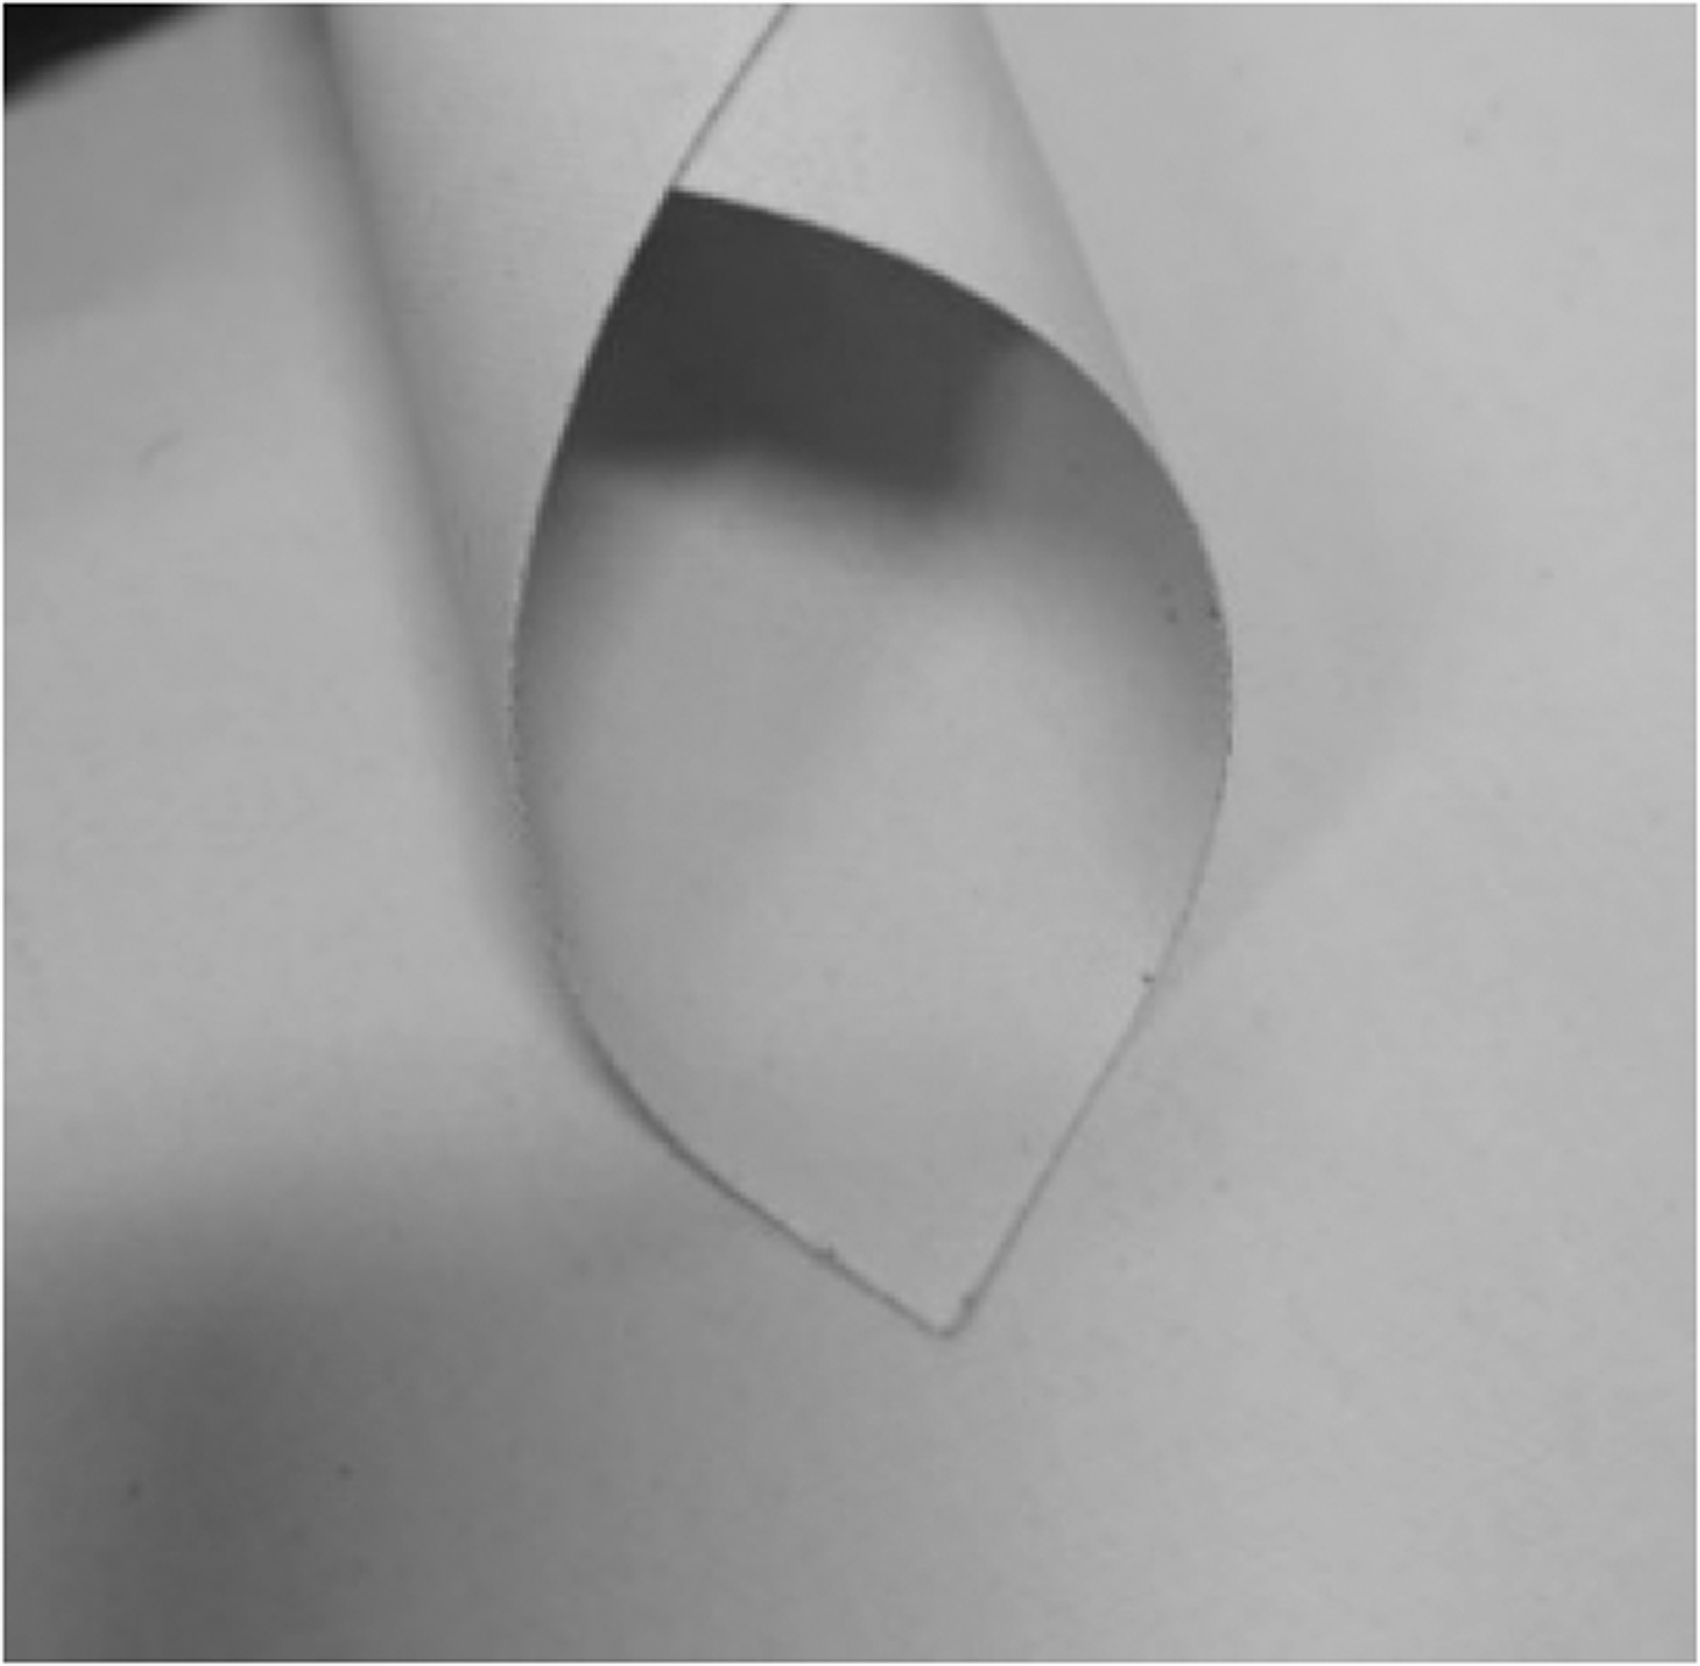
The polytetrafluoroethylene coated plain woven glass fiber fabric (FGT-800, produced by CHUKOH).
Fundamental parameters of polytetrafluoroethylene coated fabric
Specimens and test set-up
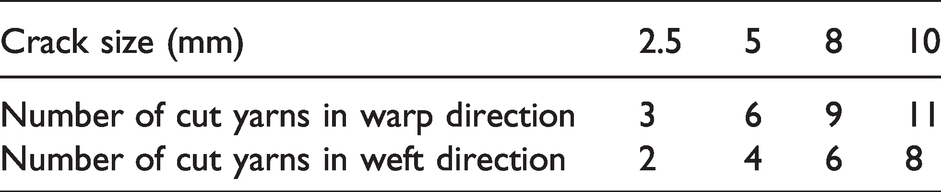
Single-edge notch tearing tests are conducted while referring to the FAA-P-8110-2-1995 standard. 11 This is because the gauge length affects the failure modes. For larger gauge lengths, brittle failure occurs with more possibilities. 31 In this work, the extension of tearing is an important research focus; in order to observe and investigate the extension process, a smaller gauge length of 200 mm 26 is accepted. The sample sizes are presented in Figure 2(a). In Figure 2(a), the initial crack “a” is located at the center of the edge of the samples. The entire length and width of the samples are 300 and 35 mm, respectively, while the measuring length is 76.2 mm. The initial lengths of the notches are set as 0, 2.5, 5, 8, and 10 mm, and three specimens are prepared for each crack length. To refine the tests and ensure the integrity of the first yarn at the crack tip, intact yarns are cut. Moreover, corresponding to each crack length along the warp and weft directions, the number of cut yarns in the warp and weft specimens is listed in Table 2. The total number of yarns in the warp and weft directions is 37 and 26, respectively. For the convenience of presenting the results, the specimens are distinguished by the crack size and indicated using the notation “loading direction-crack size-specimen number,” for example “warp-2.5-1.” In the tests, a constant loading rate is adopted and set as 3 mm/min, while the initial tensile force is set as 5 N.
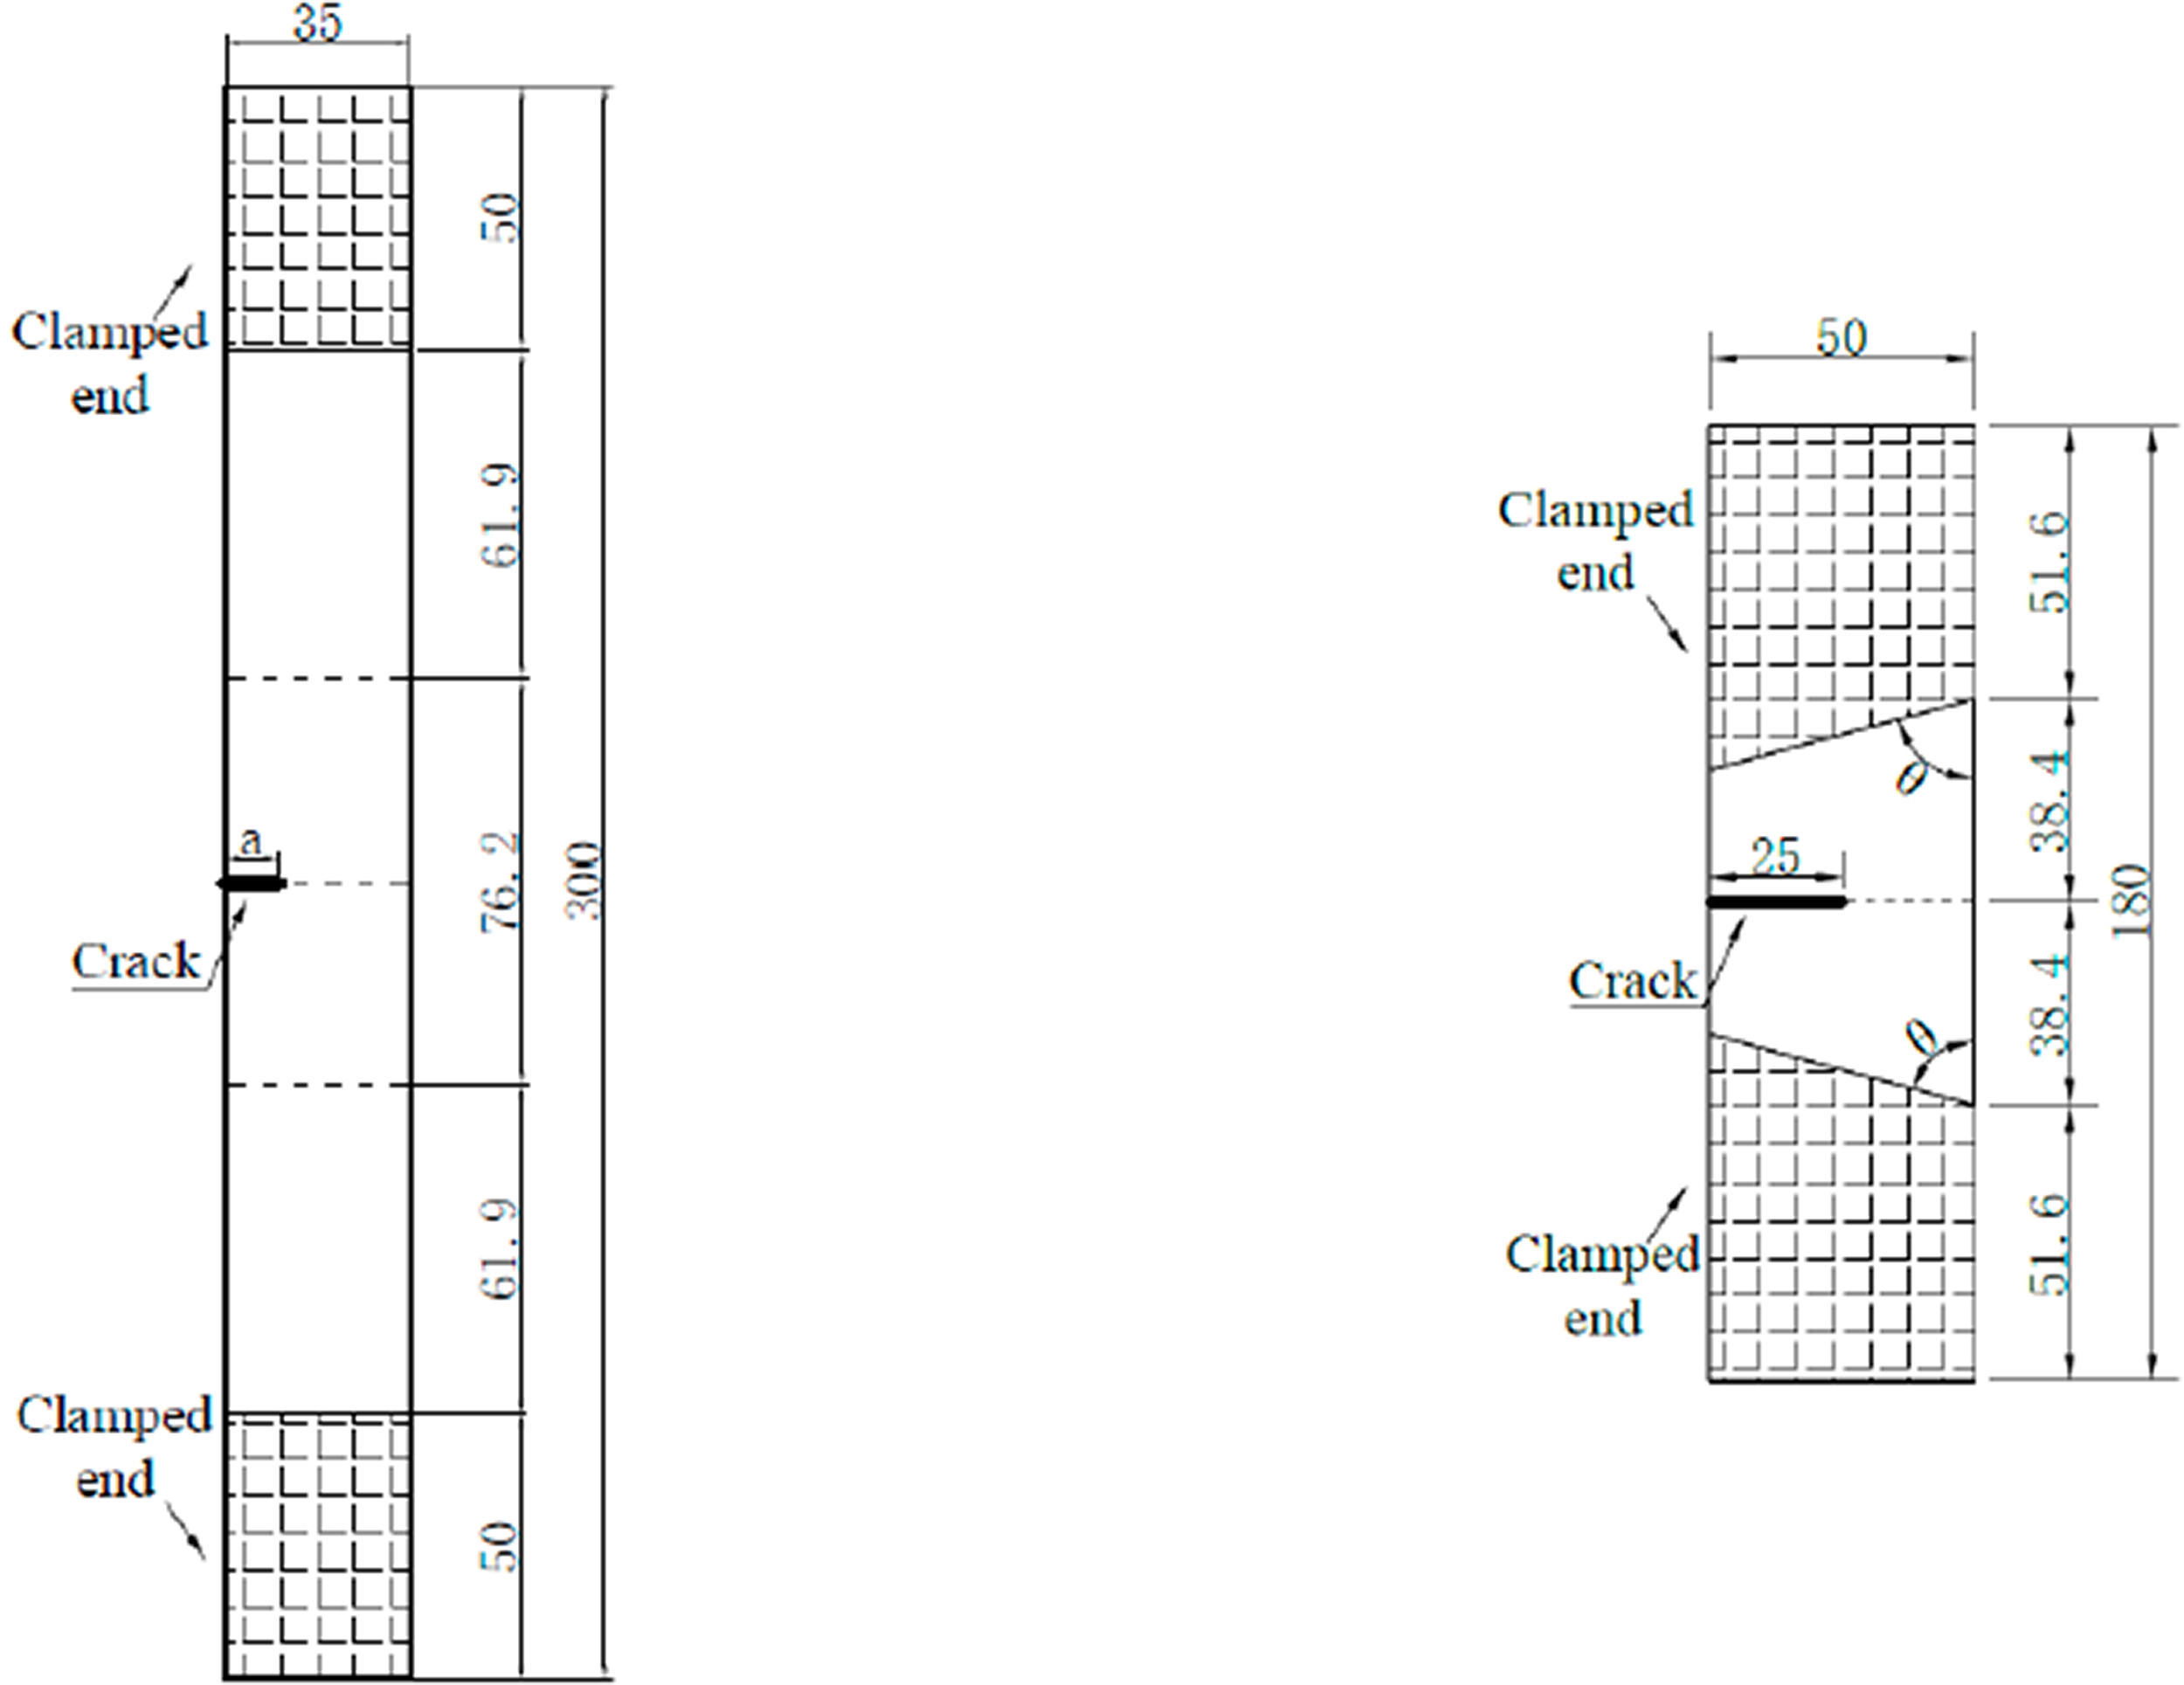
The test specimens (unit: mm) in (a) the single-edge notch tearing tests and (b) alternative-basic-angle trapezoidal tearing tests.
Number of cut yarns
In the DG/TJ08-2019-2007 standard, 10 a trapezoidal tearing sample having a basic angle of 75° is used. Compared with the single-edge notch tearing samples, the difference between them is the basic angle. Therefore, to study the correlation and distinction between the two methods, alternative-basic-angle trapezoidal tearing tests are conducted. Based on the DG/TJ08-2019-2007 standard, 10 the sizes of the samples are as presented in Figure 2(b); only the basic angle “θ” is variable. The basic angle ranges from 60° to 85° at 5° intervals, and five specimens are prepared for each θ. The samples are denoted using the format “loading direction-θ-specimen number,” for example, “warp-80°-1.” The tensile speed is 100 mm/min, according to DG/TJ08-2019-2007, and the initial tensile force is set as 5 N. A high-speed camera is used to record the test results.
In order to obtain the displacement and strain distribution of the specimens in the single-edge notch tearing tests, a three-dimensional digital speckle dynamic strain measurement and analysis system is employed (see Figure 3(a)). This system adopts the DIC method combined with binocular stereo vision technology and employs two high-speed cameras to acquire speckle images at each deformation stage of the objects in real-time. Subsequently, the image correlation algorithm is used. By smoothing the displacement data and visualizing the deformation data, the full-field strain measurement can be performed quickly, accurately, in real-time, and without contact. The DIC equipment is calibrated using a special matching calibration plate. During the calibration, a measuring volume is formed in the space by capturing images of the calibration plate at different directions and positions. The image obtained within this measuring volume is effective. The range of the strain measurement of the DIC equipment used in this study is 0.005–2000%, and its accuracy is 50 micro-strain. The spatial three-dimensional deformation can be measured. 32
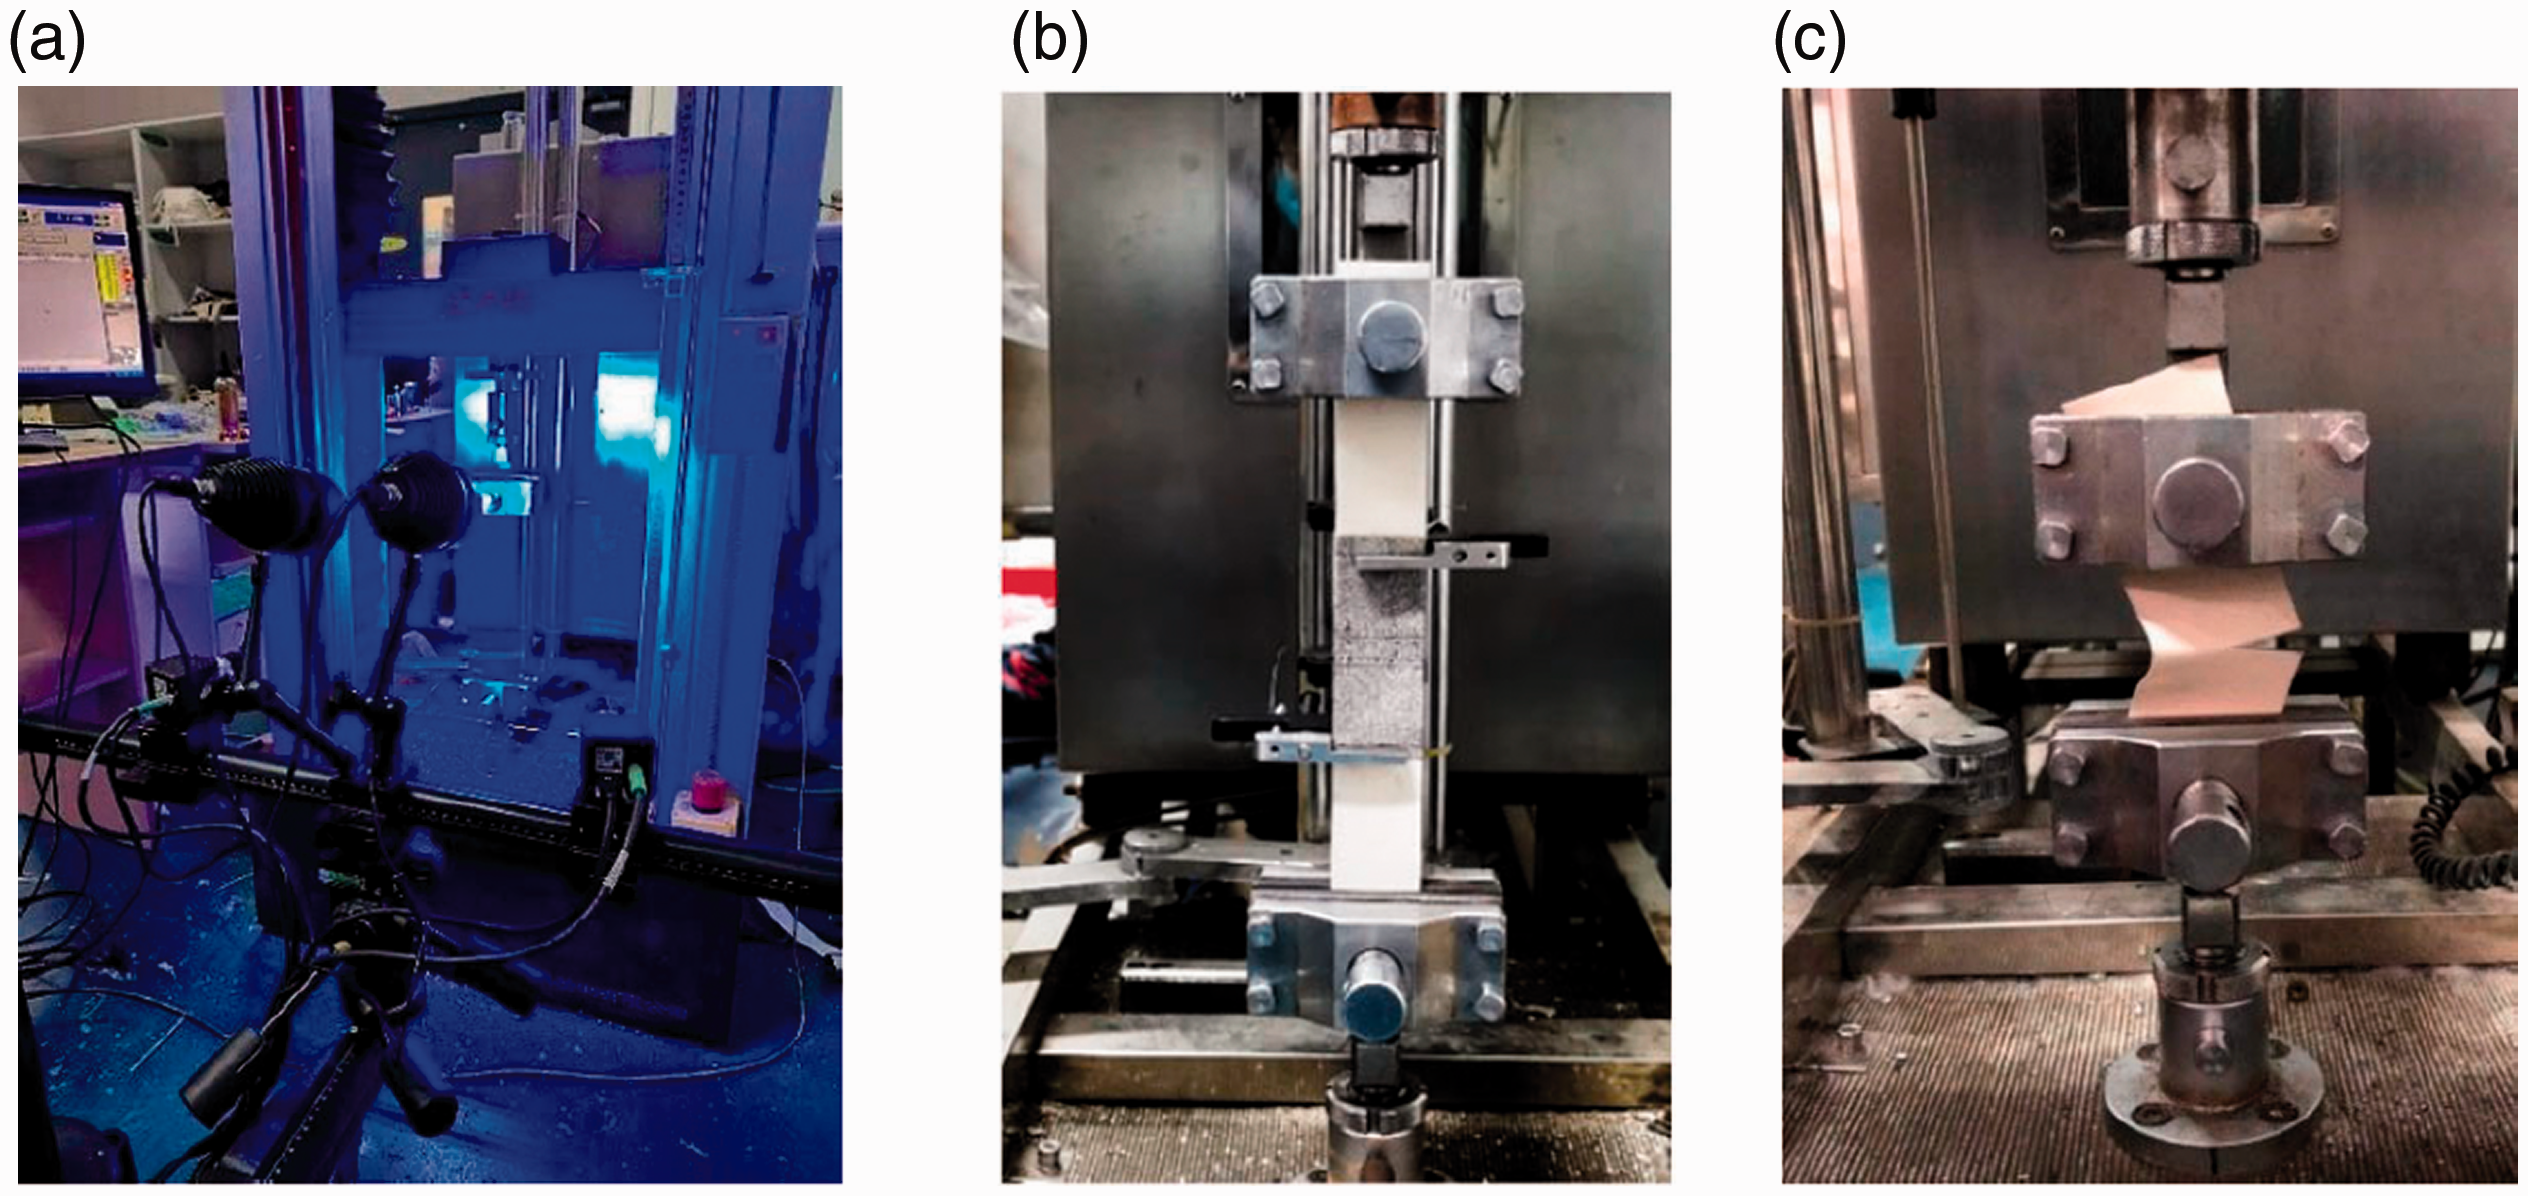
The test set-ups in (a) the digital image correlation equipment and fixture, (b) the single-edge notch tearing test, and (c) the alternative-basic-angle trapezoidal tearing test.
As shown in Figure 3, all the tests are conducted using the universal testing machine CMT4204, the clamping fixture is adopted, and the maximum load of 20 kN can meet the requirements of all the tests. All the tests are conducted at a temperature of 20 ± 2°C and a relative humidity of 65 ± 3%.
Experimental results
Load–displacement curves
In the single-edge notch tearing tests, the load–displacement curves of three samples having an identical crack size are similar; therefore, only one curve is displayed for comparison, as shown in Figure 4. From this figure, it is apparent that the existence of cracks causes a loss in strength. All the curves include an initial stage of low rigidity and are followed by a hardening stage. This phenomenon is caused by the uniaxial tensile properties of the PTFE coated glass fiber fabric. In the initial stage, the tensile deformation is small, and the coating and yarns carry the load together; thus, the rigidity is low and more uniform. Then, as the tensile deformation increases, separation between the coating and yarns gradually occurs, which results in the overall deformation increasing, but the load increases slowly; therefore, the stiffness is also low. Finally, after separation, the load is mostly carried by the yarns. The high strength and stiffness of the glass fibers cause a rapid increase in rigidity, which results in a hardening stage. 5 It can be observed that all curves exhibit little difference at the initial stage before the onset of tearing. However, when the load increases gradually, the deviations between the curves become larger, especially during the hardening stage. After the initiation of tearing, the shape of the curves varies. The curves of the samples with a minimum slit size exhibit a downward trend almost immediately, while the curves of the remaining samples exhibit various jagged increases, reach the maximum load, and then drop off.
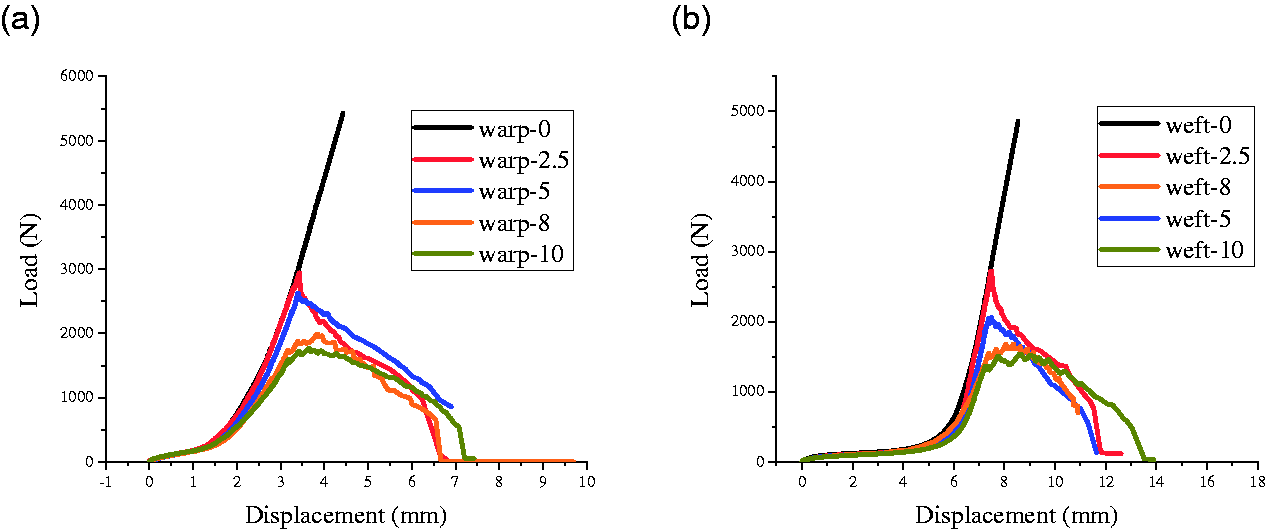
The load–displacement curves of the single-edge notch tearing tests in (a) warp samples and (b) weft samples.
Figure 5 presents the load–displacement curves of the alternative-basic-angle trapezoidal tearing specimens. The load–displacement curves of the five samples having an identical θ are almost consistent; therefore, only one curve is displayed for demonstration. It is apparent that the curves comprise zigzags after the initiation of tearing. With the increase in θ, the stiffness of the curves before tearing increases, the stiffness of the rising part on the zigzags also increases, and the total displacement decreases. The above phenomena can be attributed to the fact that, as θ increases, the yarns participating in the load-bearing increase and the tearing del-zone becomes larger. Therefore, the stiffness increases and the entire displacement decreases.
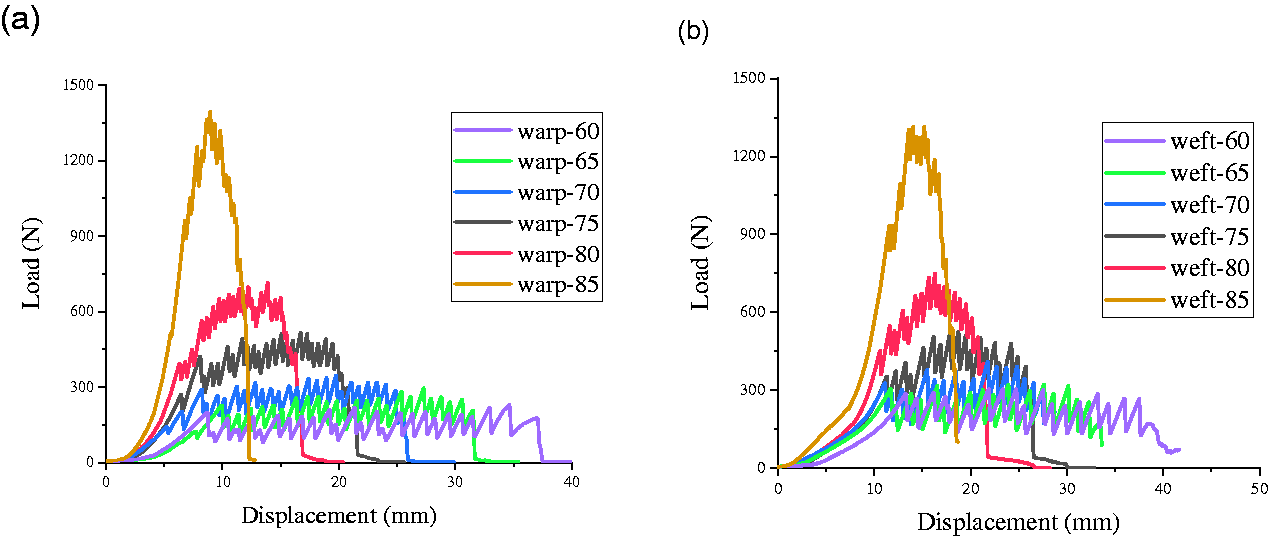
The load–displacement curves of the alternative-basic-angle trapezoidal tearing tests in (a) warp samples and (b) weft samples.
Tearing process of single-edge notch tearing specimens
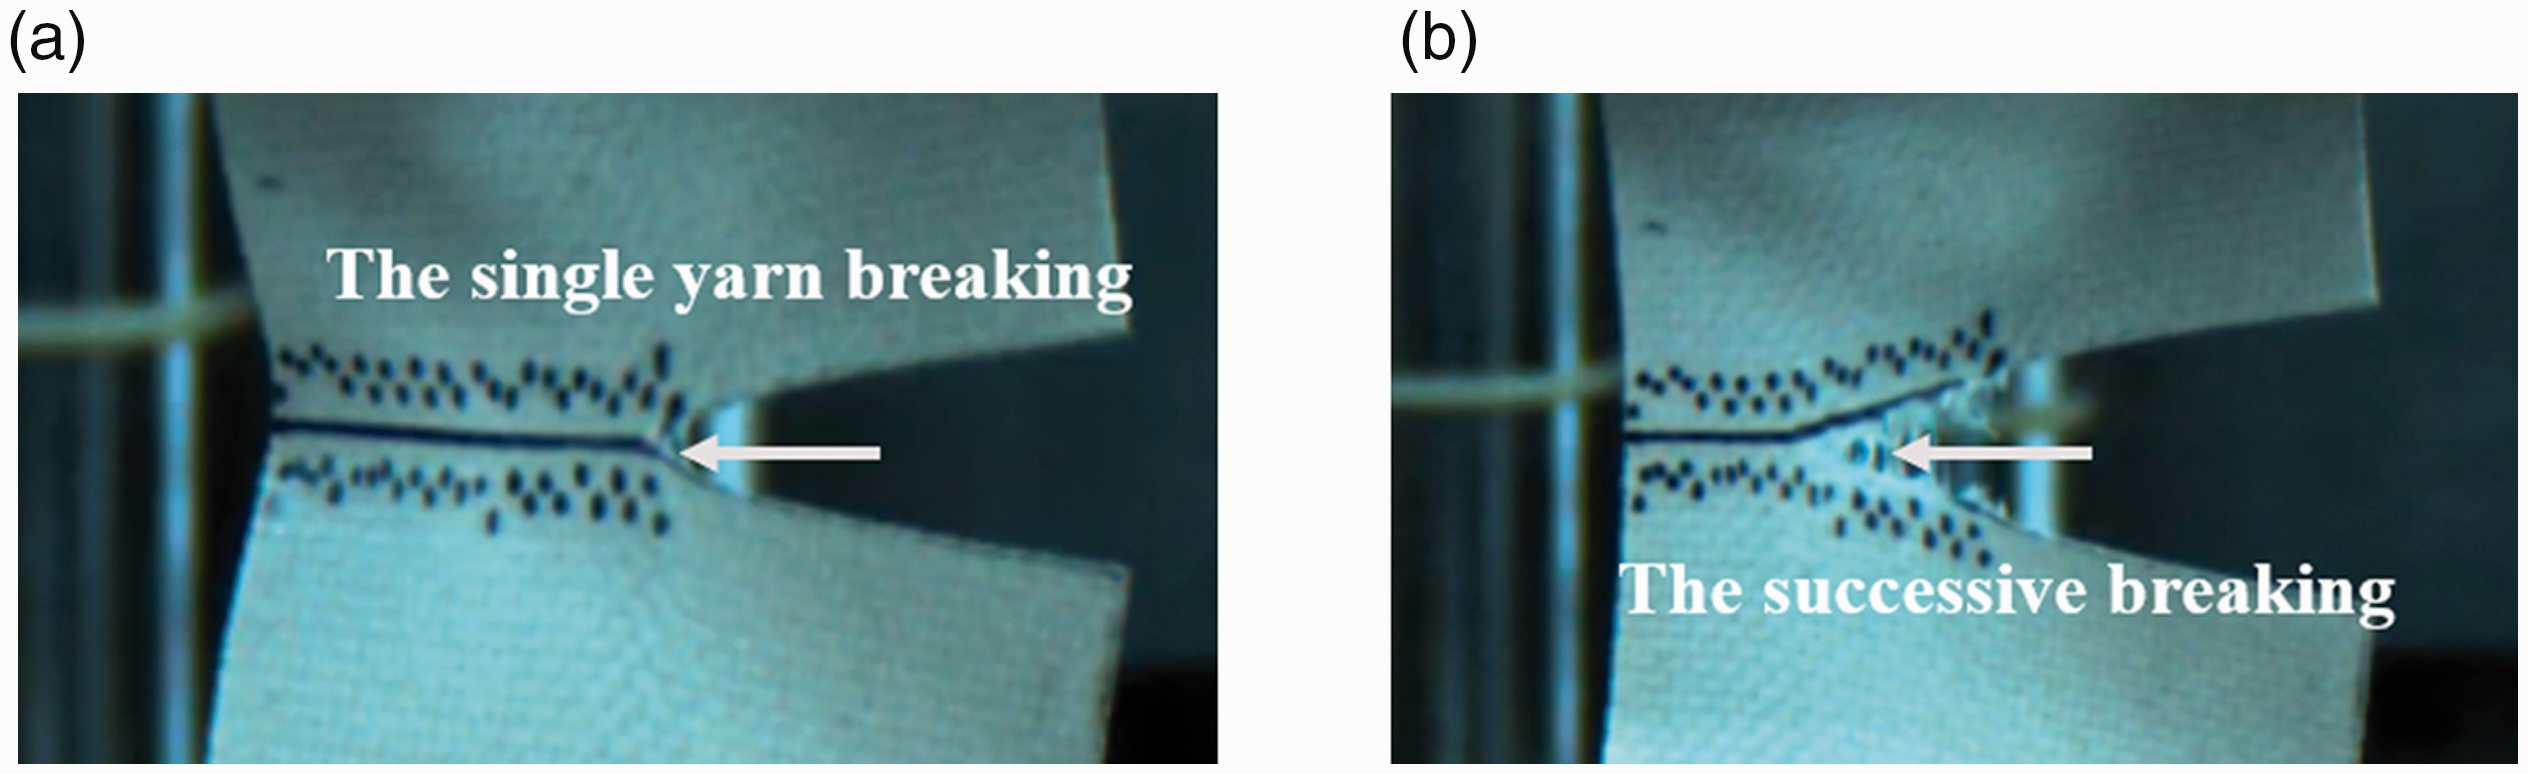
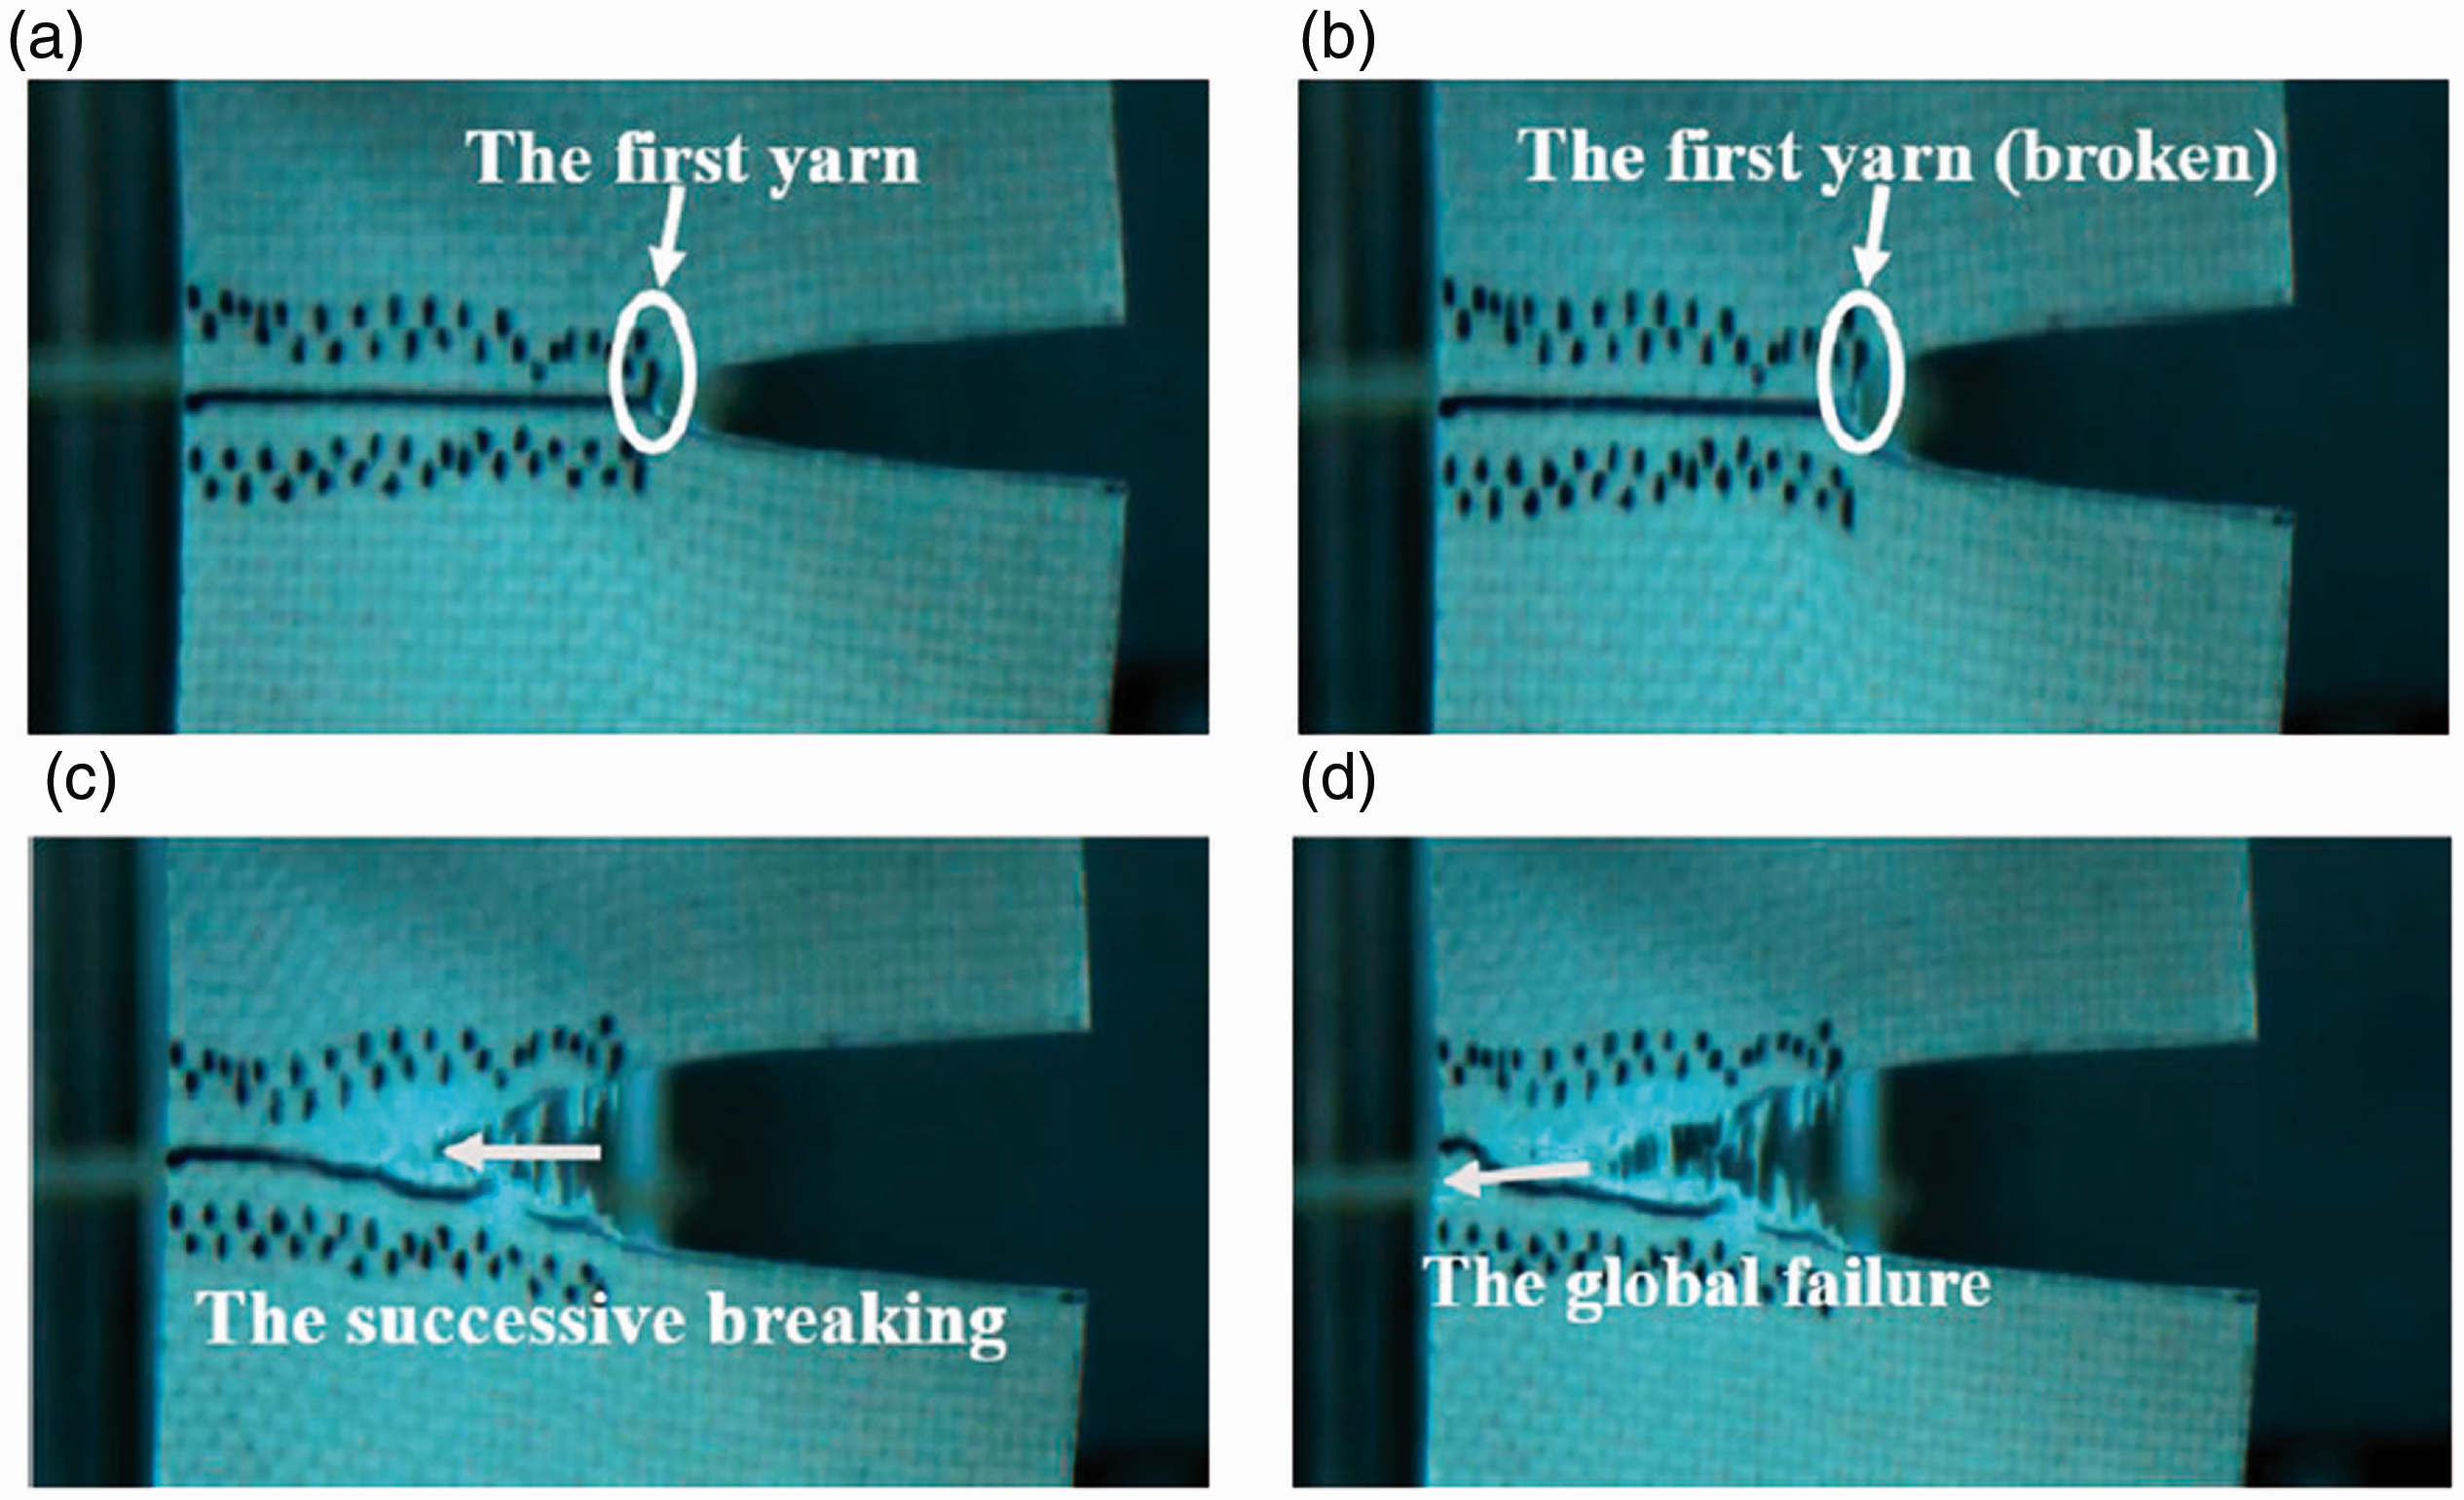
The tearing propagation process of the single-edge notch tearing specimens can be roughly divided into three stages, and the samples warp-5-3 and weft-5-1 are used as examples to illustrate this, as shown in Figures 6 and 7.
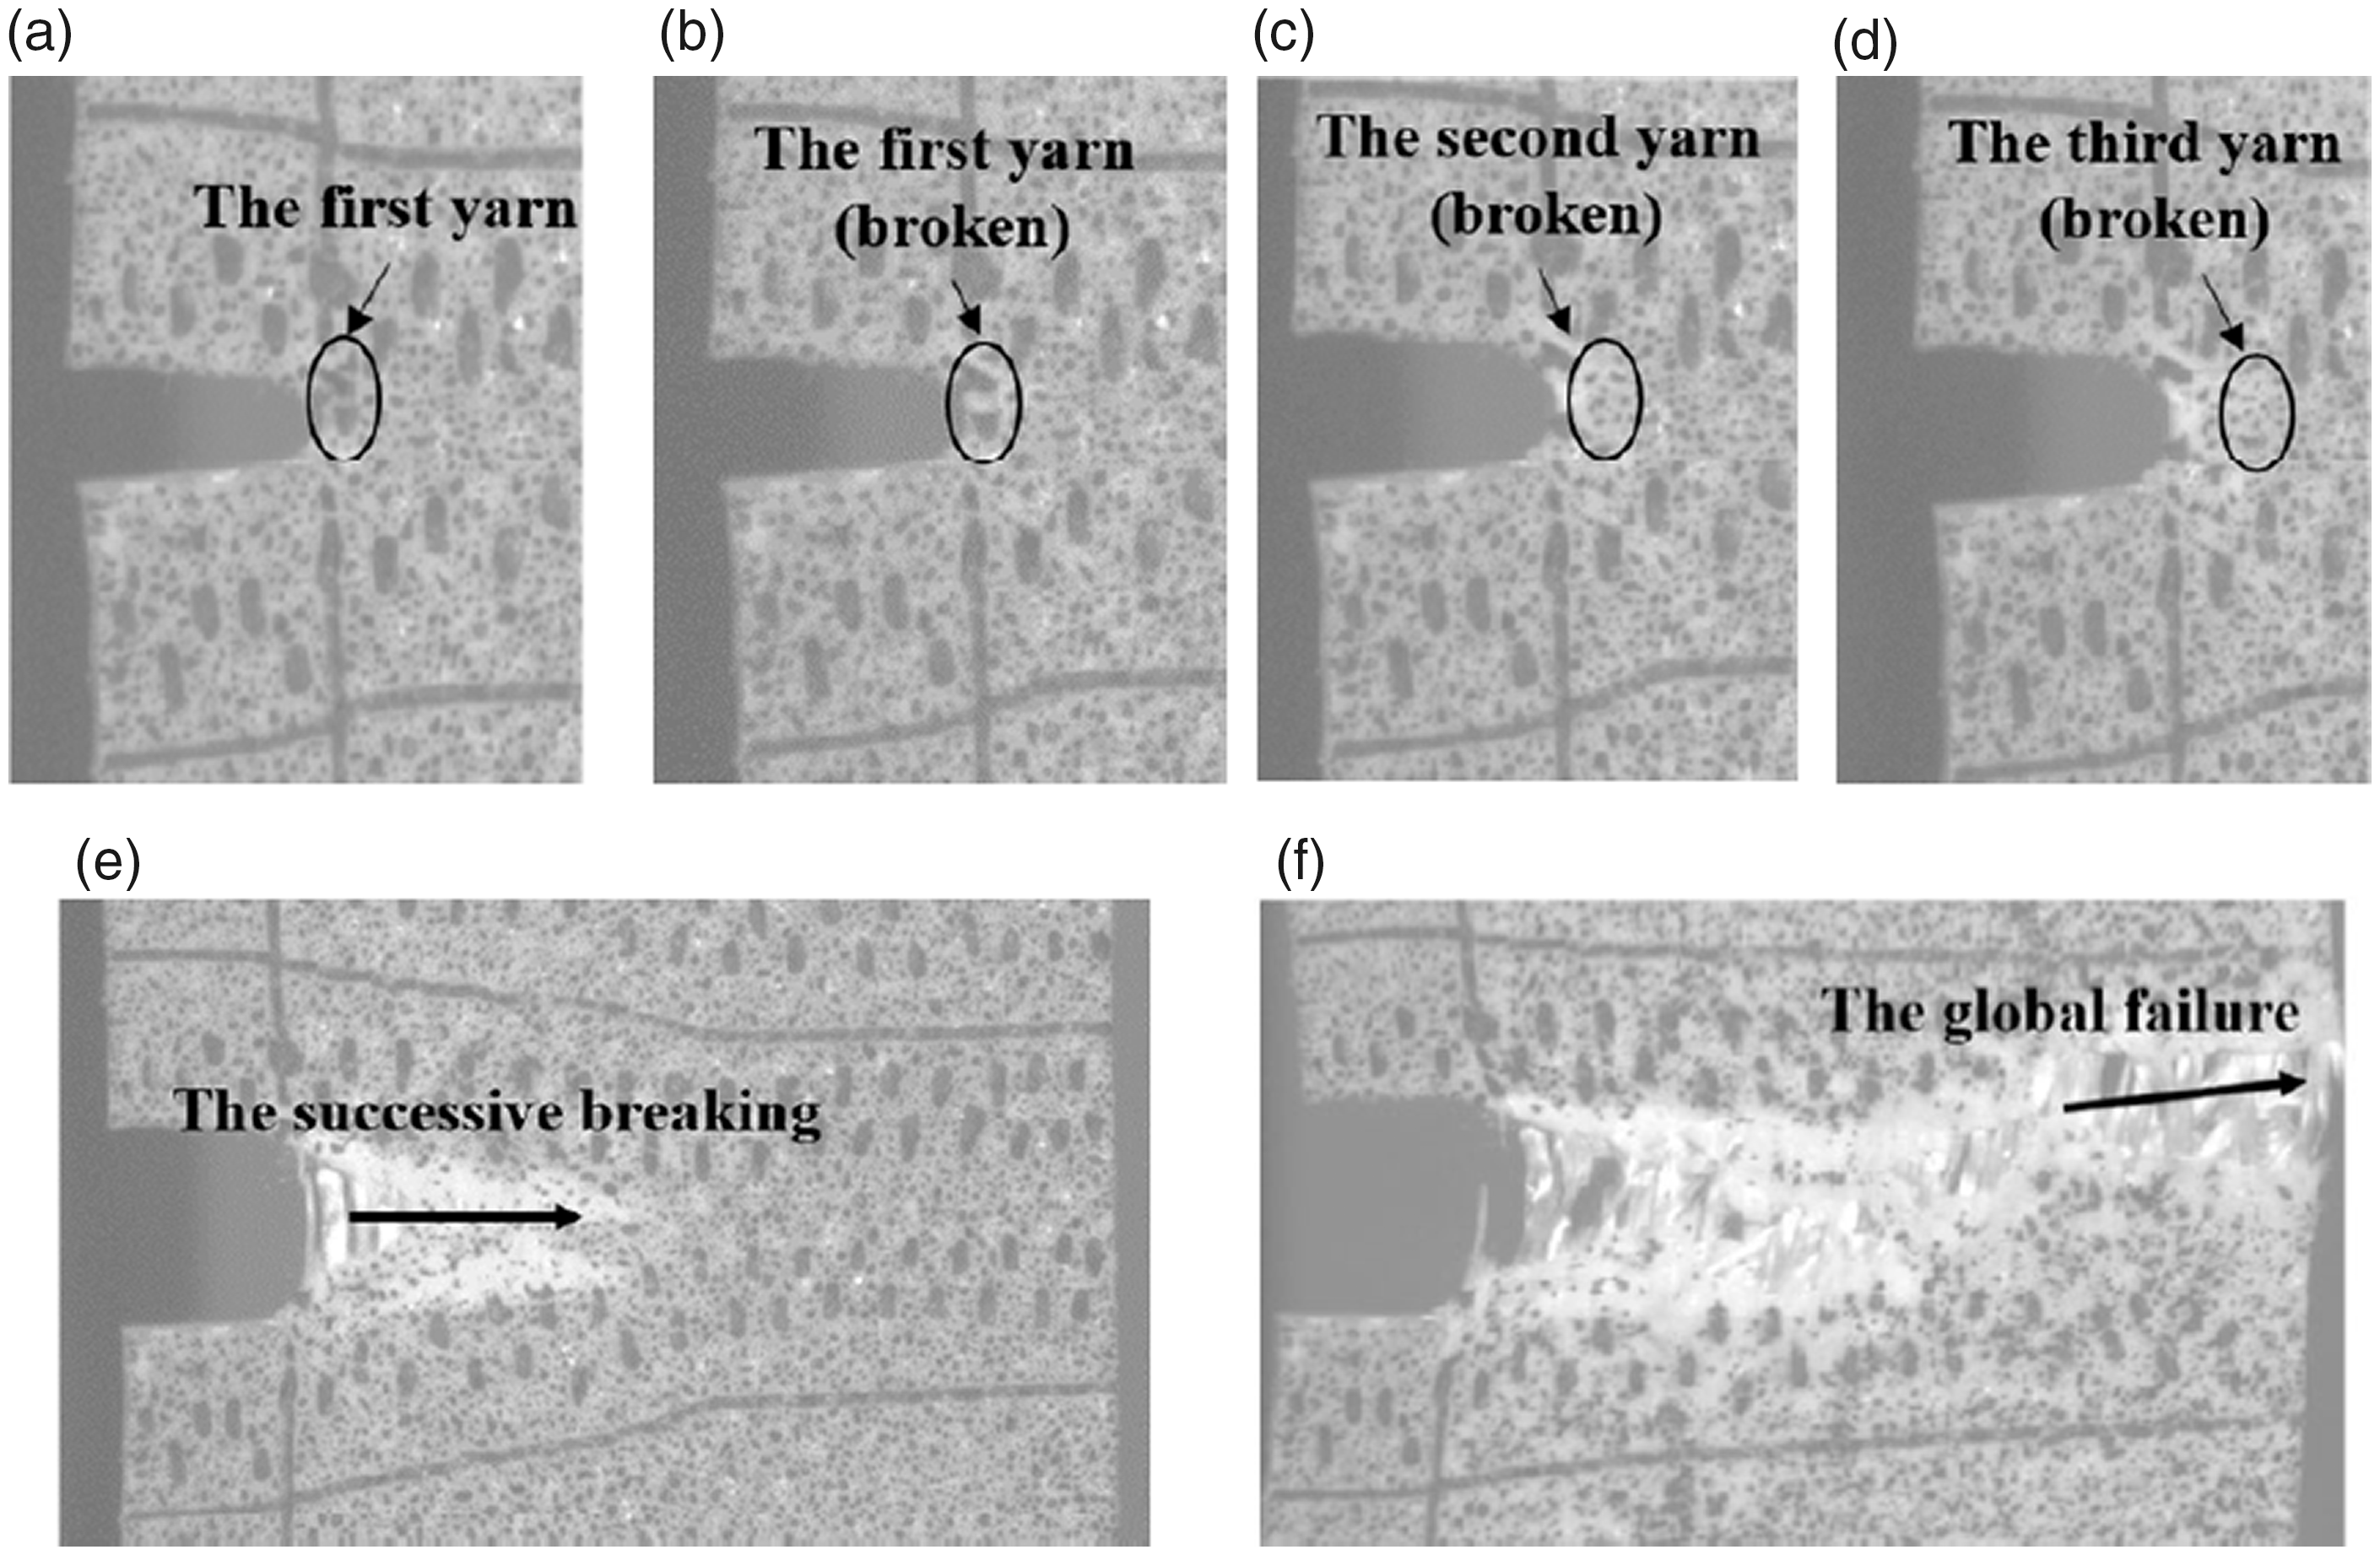
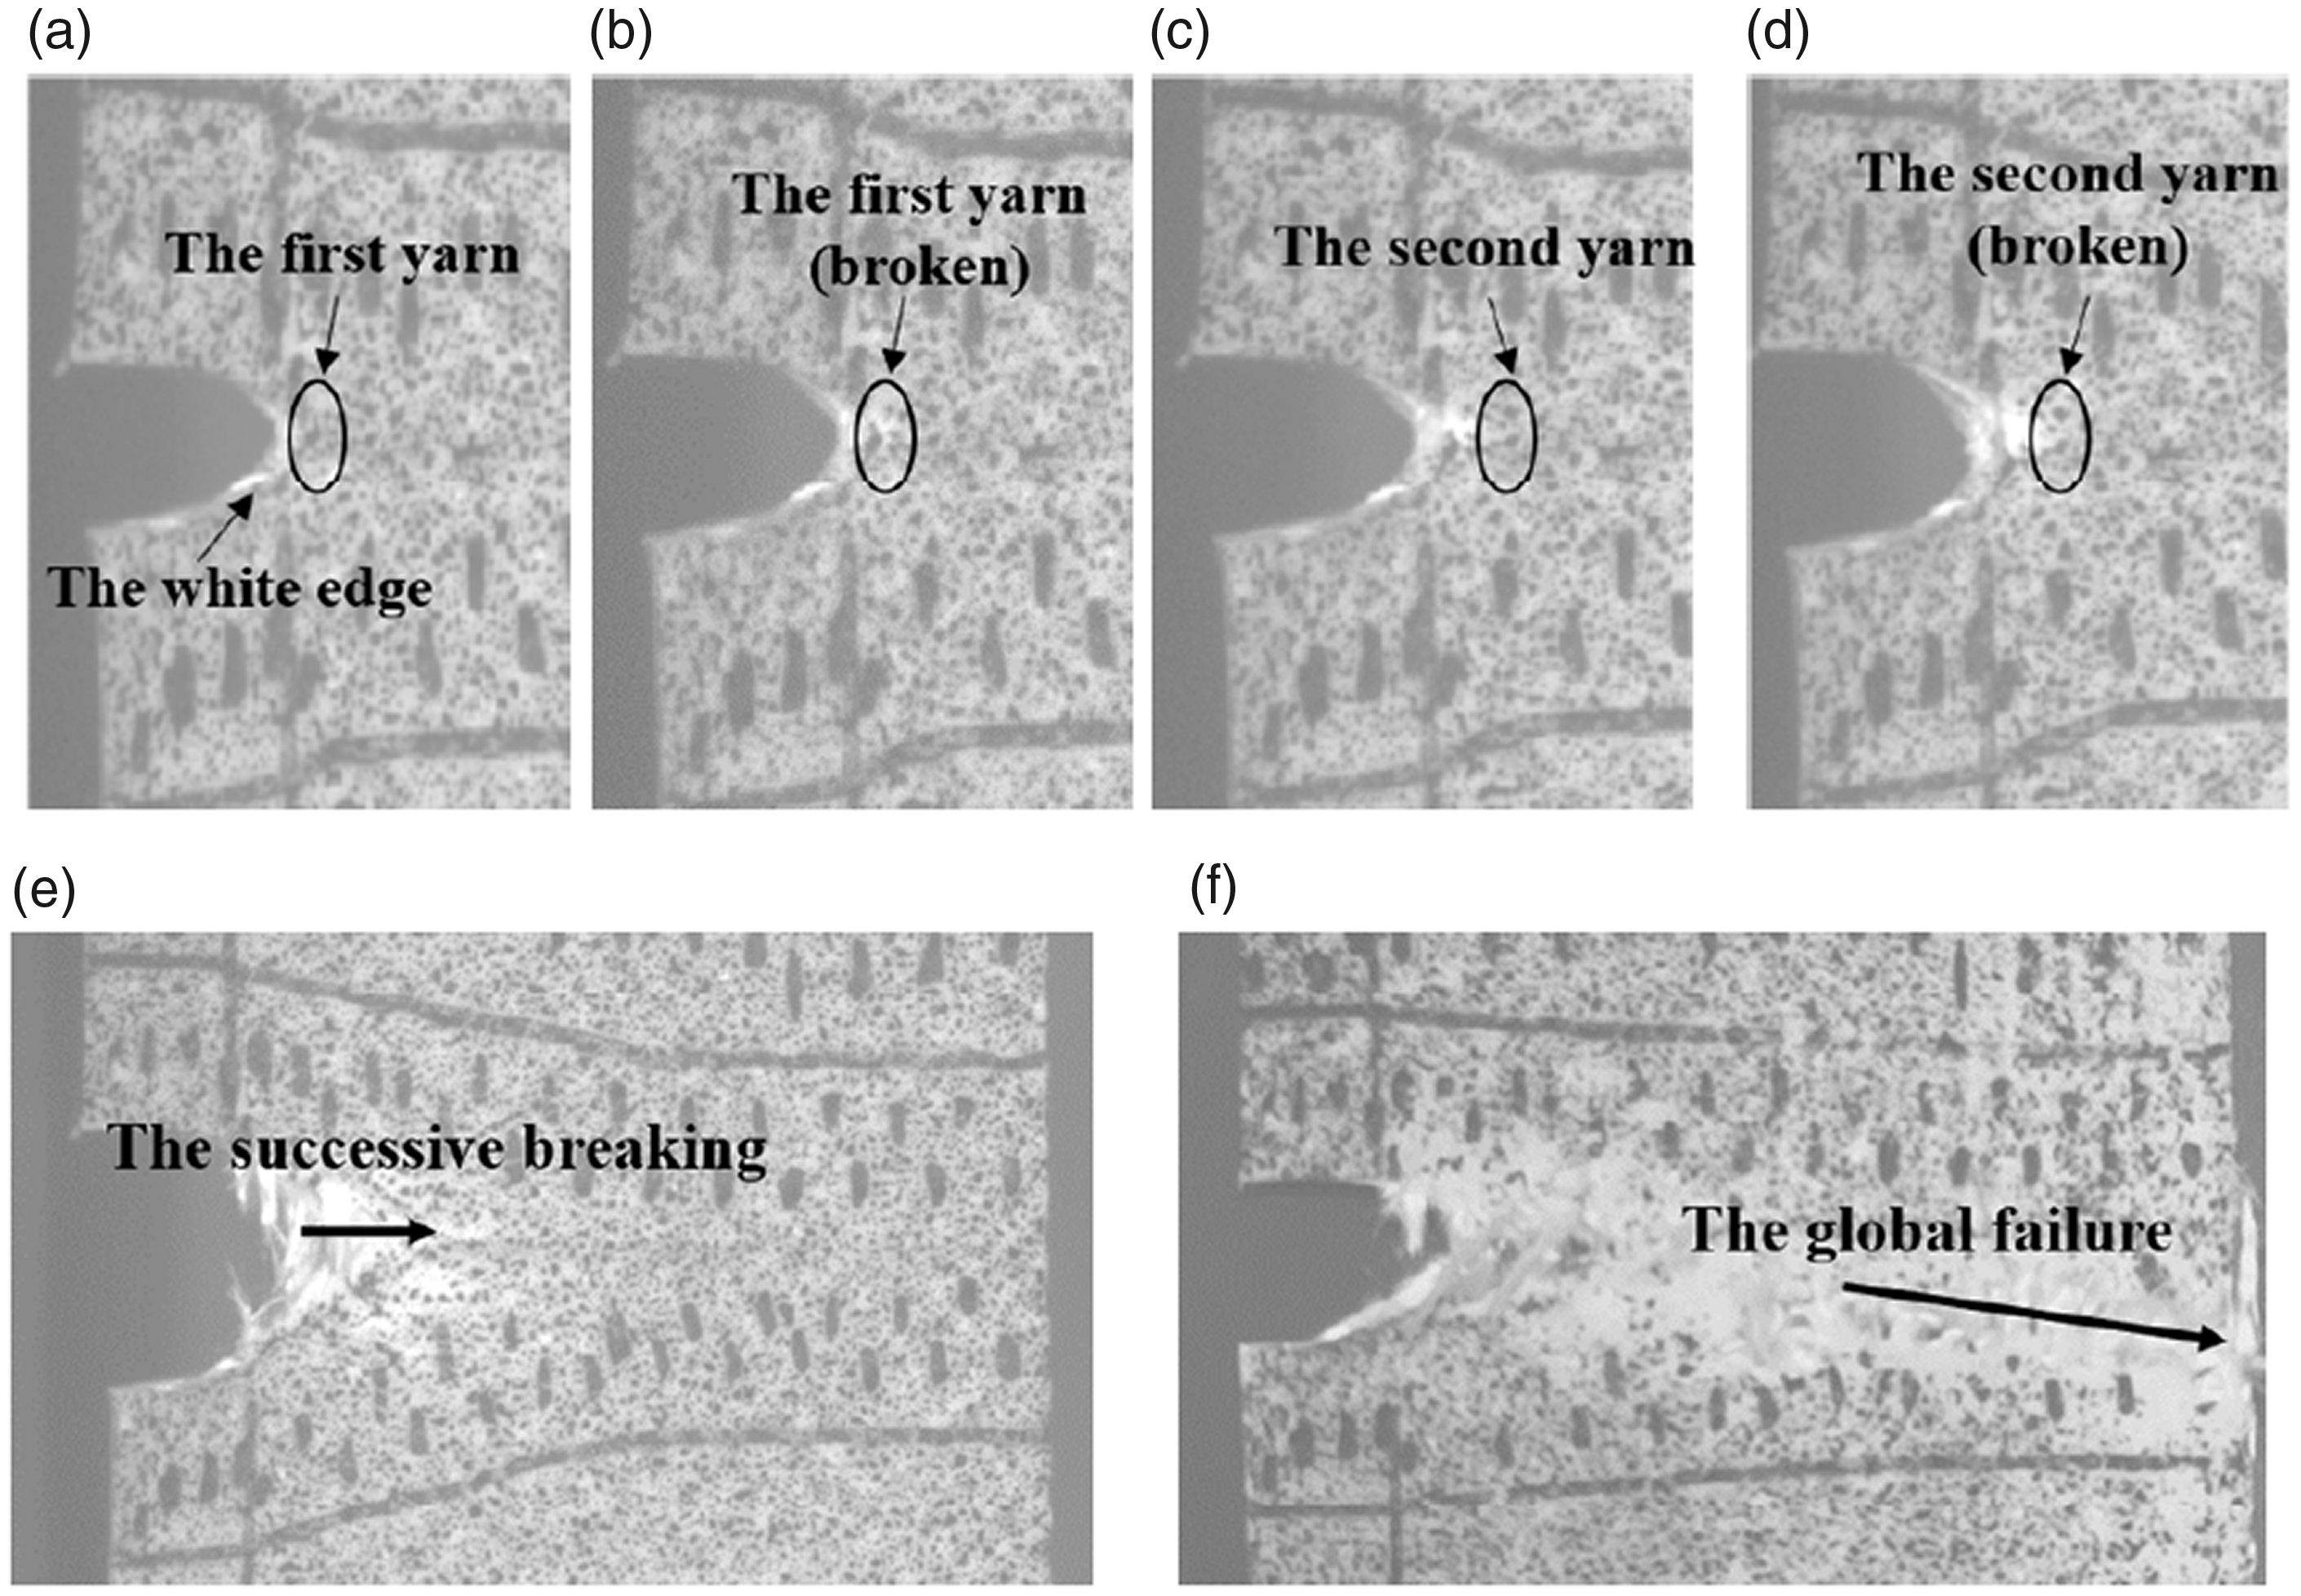
The single-edge notch tearing process of warp-5-3 in (a)–(d) the single-yarn breaking stage, (e) successive breaking stage, and (f) global failure stage.
The single-yarn breaking stage of weft-5-1 in (a)–(d) the single-edge notch tearing process, (e) successive breaking stage, and (f) global failure stage.
Single-yarn breaking stage: at this stage, the yarns break one by one and slits propagate along the direction perpendicular to the loading direction. Figures 6(a)–(d) display warp-5-3 breaking at the first, second, and third yarns at the crack tip, while Figures 7(a)–(d) present weft-5-1 breaking at the first and second yarns at the crack tip. It can be observed from the figures that, before the first yarn breaks, the slit tip becomes blunt and forms a semi-ellipse to a certain extent. As the loading continues, the semi-ellipse gradually becomes larger. Furthermore, it can also be observed that, before and after a yarn breaks, there is almost no separation between the coating and the yarns. The deformation of the weft samples is greater and their semi-ellipses are larger because of the larger breaking elongation in the weft direction (in Figure 7(a), the white edge caused by the larger deformation of the coating is obvious at the crack tip).
Successive breaking stage: as the tests proceed, the crack propagation mode changes from the one-by-one breaking of single yarns to the continuous, rapid, and flake-like breaking of several yarns, but slits still propagate along the direction perpendicular to the loading direction. Figures 6(e) and 7(e) present warp-5-3 and weft-5-1 encountering successive breaking, respectively. The yarns of PTFE coated fabrics do not separate observably from the coating when breaking; therefore, the breaking yarn in the figures is buried in the unseparated part, and the front part becomes separated due to the failure of the coating. At this stage, there is no obvious difference between the warp and weft samples and, thus, no further details are presented.
Global failure stage: after the successive breaking stage, residual yarns of the sample will fracture almost simultaneously under a too heavy load, as shown in Figures 6(f) and 7(f). Therefore, overall failure occurs rapidly. The extension mode is similar to the uniaxial tensile one and propagates along the direction inclined to the loading direction. The warp and weft samples exhibit no obvious difference at this stage, so no more examples are displayed.
These three stages can be distinguished not only by the photos but also the load–displacement curves. Figures 8 and 9 present the load–displacement curves of warp-5-3 and weft-5-1, respectively. The curve can clearly be divided into three sections corresponding to the three afore-mentioned stages. In the single-yarn breaking section, several sharp zigzags appear, and each zigzag corresponds to the breaking of a yarn. This section is the ascending portion of the curve. In the successive breaking section, a rapid, continuous, and declining fluctuation occurs, and the maximum tearing load is observed. In the global failure section, a rapid and abrupt decrease in the load is observed almost without fluctuation, which indicates that overall failure occurs.
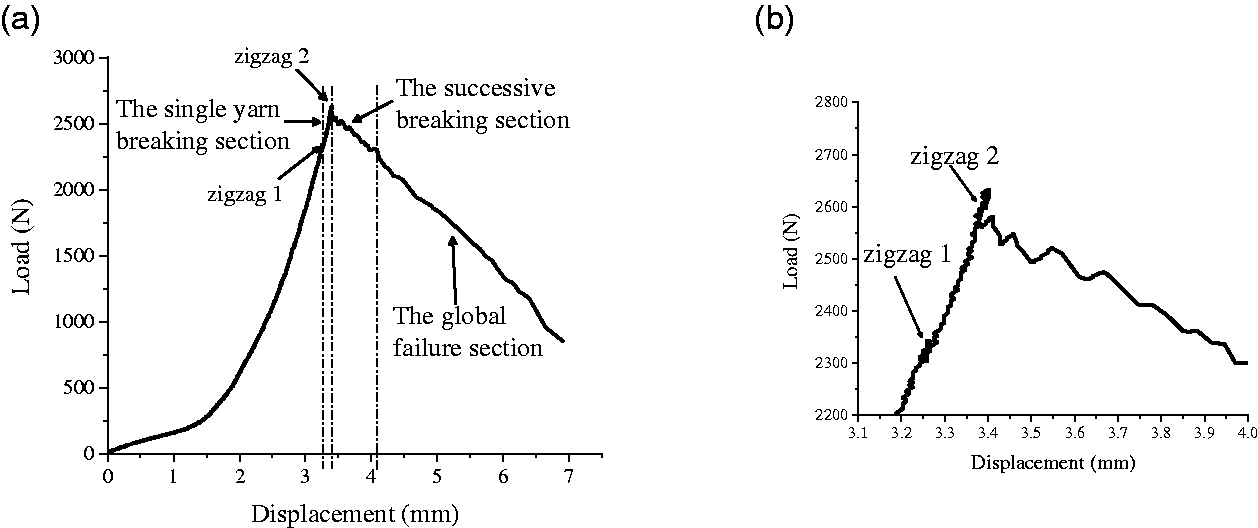
The three sections of the load–displacement curve of warp-5-3: (a) overall load–displacement curve; (b) local enlarged view.
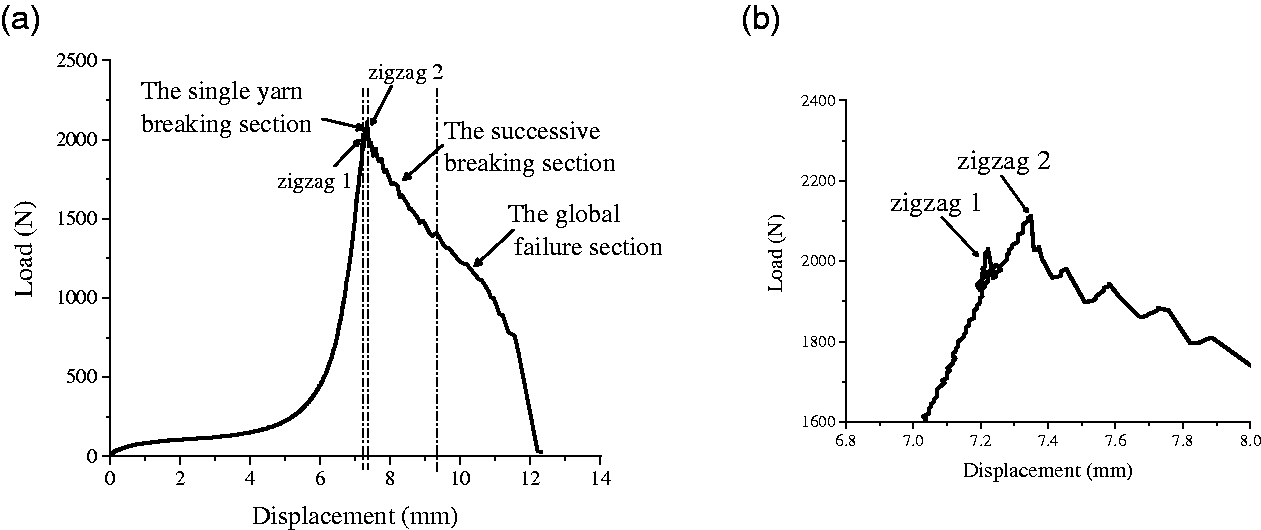
The three sections of the load–displacement curve of weft-5-1: (a) overall load–displacement curve; (b) local enlarged view.
Tearing process of alternative-basic-angle trapezoidal tearing specimens
The tearing propagation process of the alternative-basic-angle trapezoidal tearing specimens in the warp and weft directions can be classified into the following three cases.
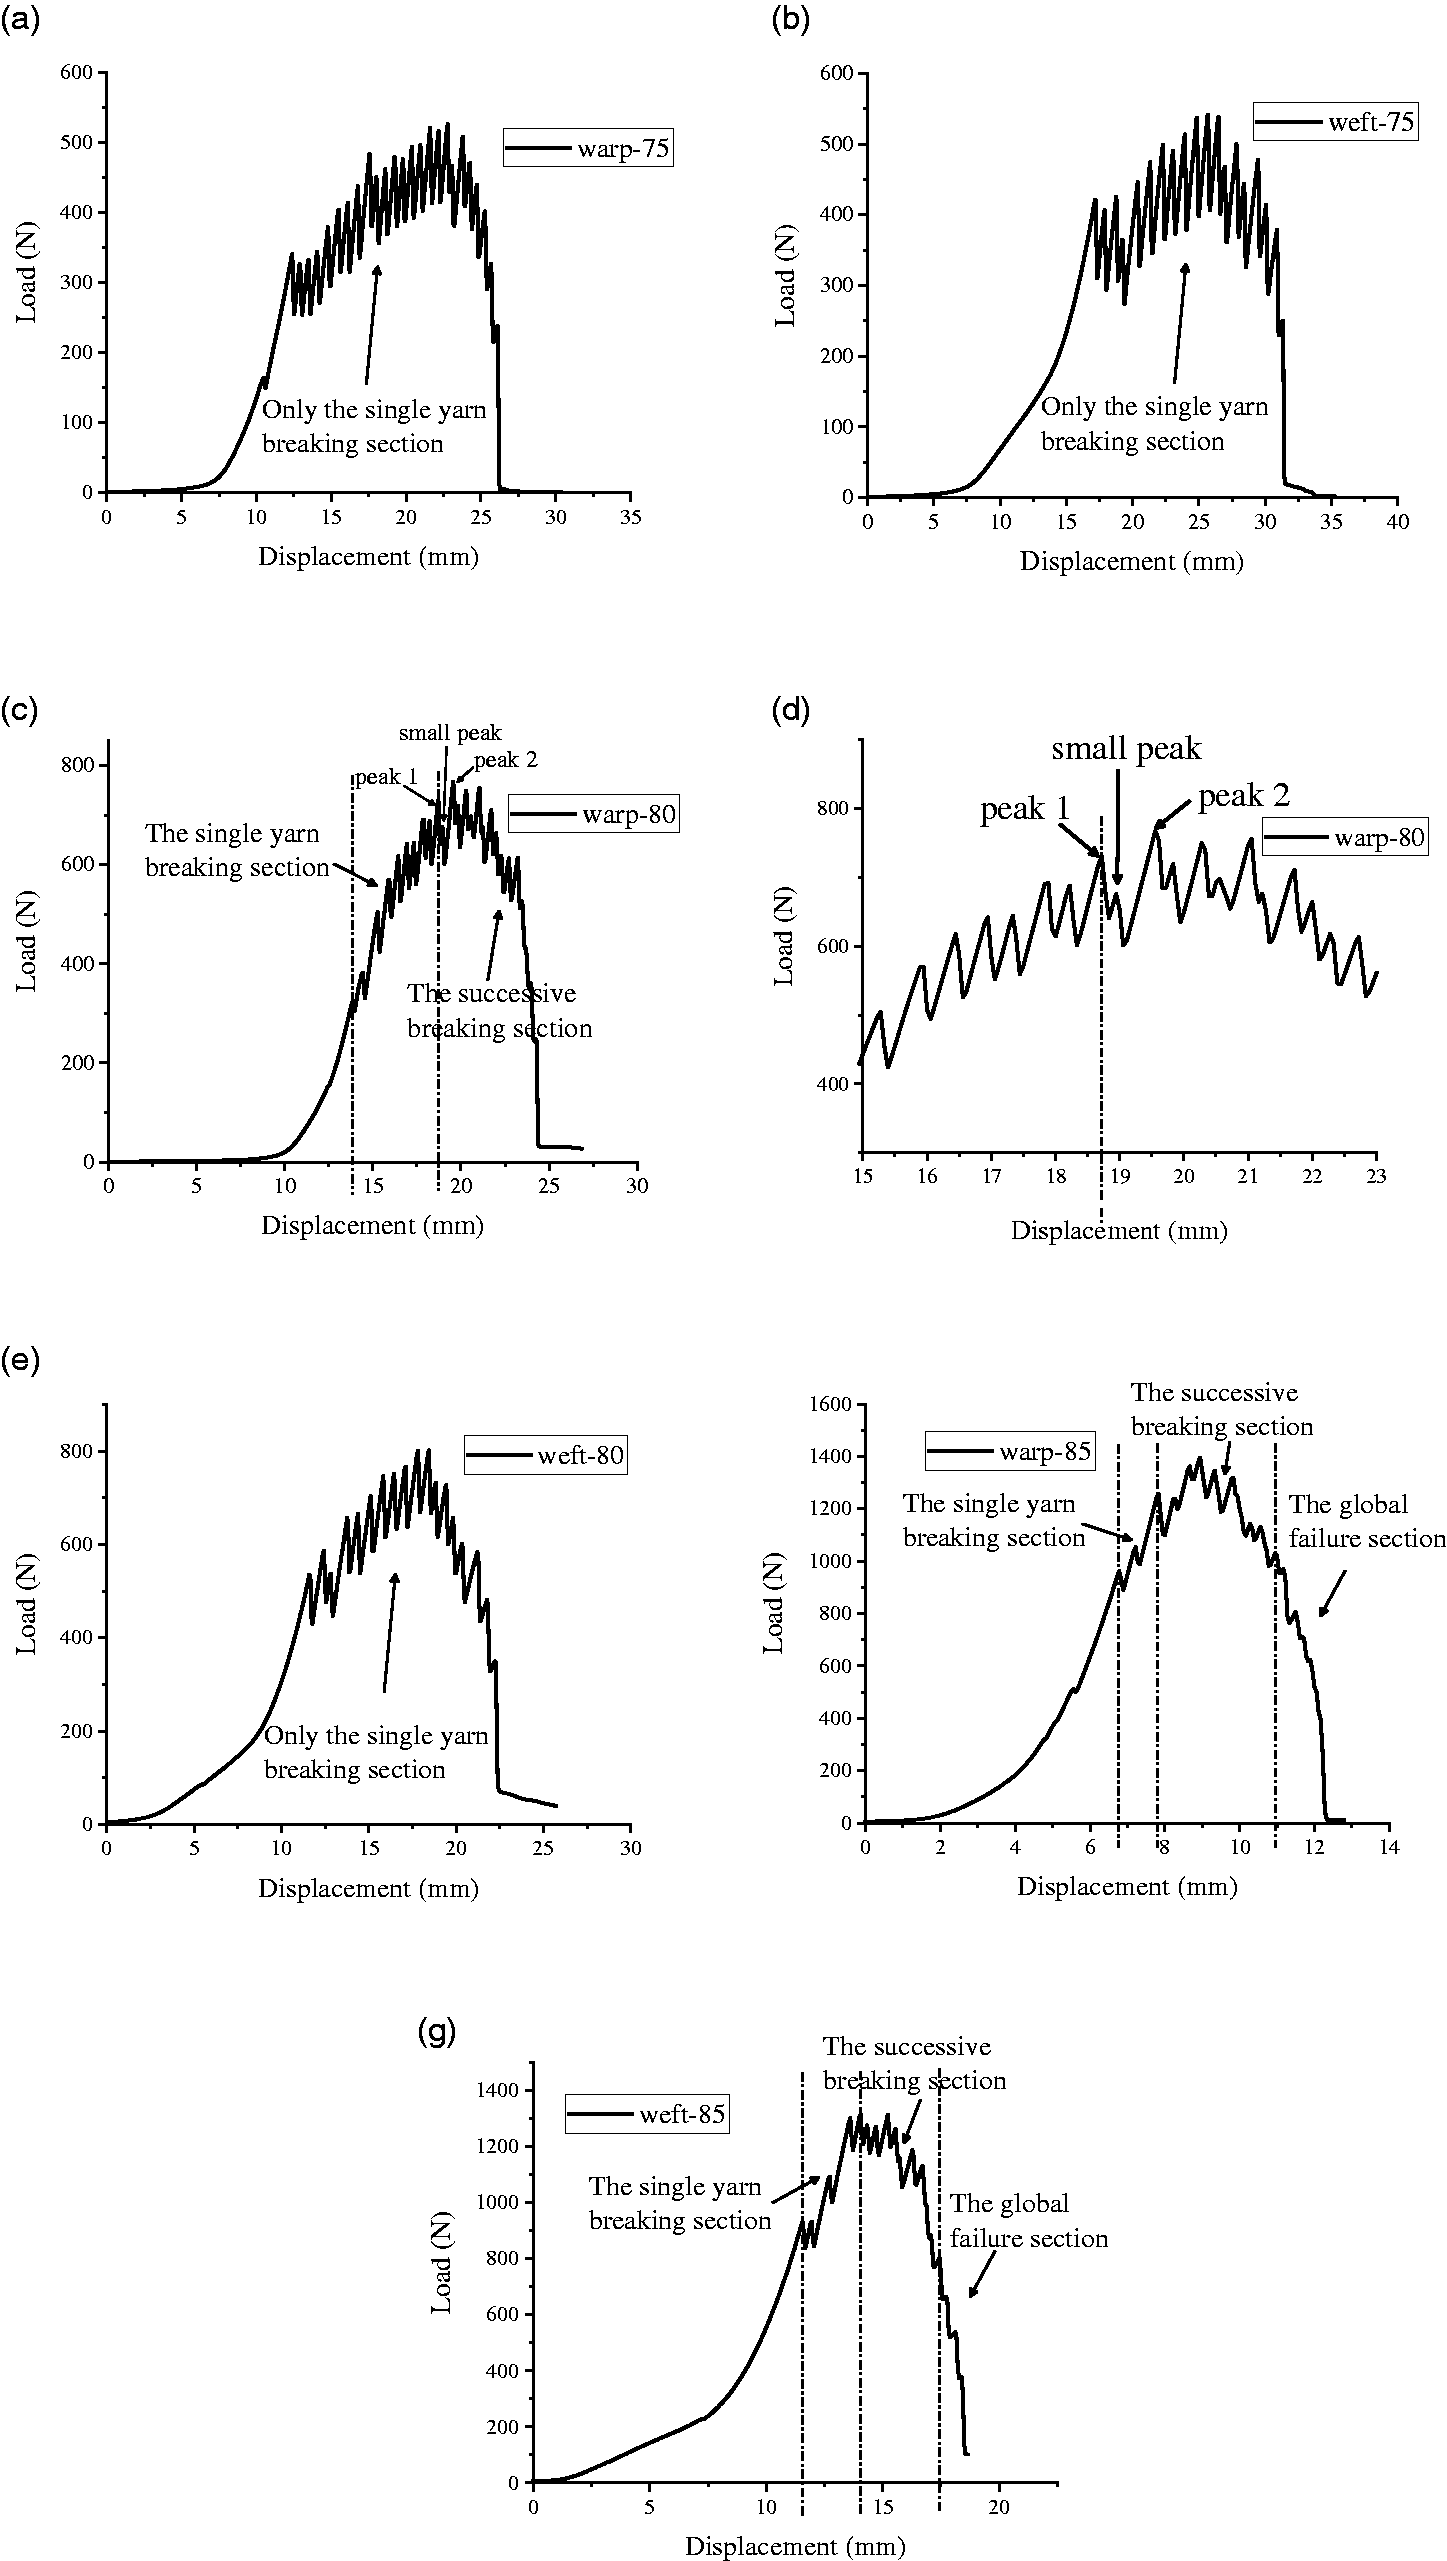
For the warp samples having θ of 60°–75° and weft samples having θ of 60°–80°, only the single-yarn breaking stage occurs, and the yarns break one by one. In the corresponding load–displacement curves, a zigzag corresponds to the breaking of a single yarn. Figures 10(a), (b), and (e) present the load–displacement curves of warp-75°, weft-75°, and weft-80°, respectively, and it is observed that every zigzag on the curves is apparent and defined.
The load–displacement curves of the alternative-basic-angle trapezoidal tearing specimens in (a) warp-75°, (b) weft-75°, (c), (d) warp-80° (figure (d) presents the local enlarged view), (e) weft-80°, (f) warp-85°, and (g) weft-85°. For warp samples having θ of 80°, the successive breaking stage starts to appear after the single-yarn breaking stage. The tearing propagation process of warp-80° is presented in Figure 11, and it is evident that the slit still propagates along the direction perpendicular to the loading direction. In contrast to the successive breaking stage observed in the single-edge notch tearing specimens, the characteristic of this stage in the case of warp-80° is that, after the fracture of a yarn, the next one or two yarns break promptly. This difference is reflected in the load–displacement curve. After the occurrence of a peak, one or two small peaks appear in a downward trend, and then another rising peak appears, as shown in Figures 10(c) and (d). This distinction can be attributed to the mechanical characteristics of trapezoidal tearing tests. In this method, the load is carried by the tearing del-zone. After the successive breaking of two or three yarns, the residual load in the remaining yarns in the tearing del-zone is small. With continuous loading, a new del-zone can be generated, and the sample can be reloaded. Therefore, the cycle of “loading → successive breaking → reloading” is observed.
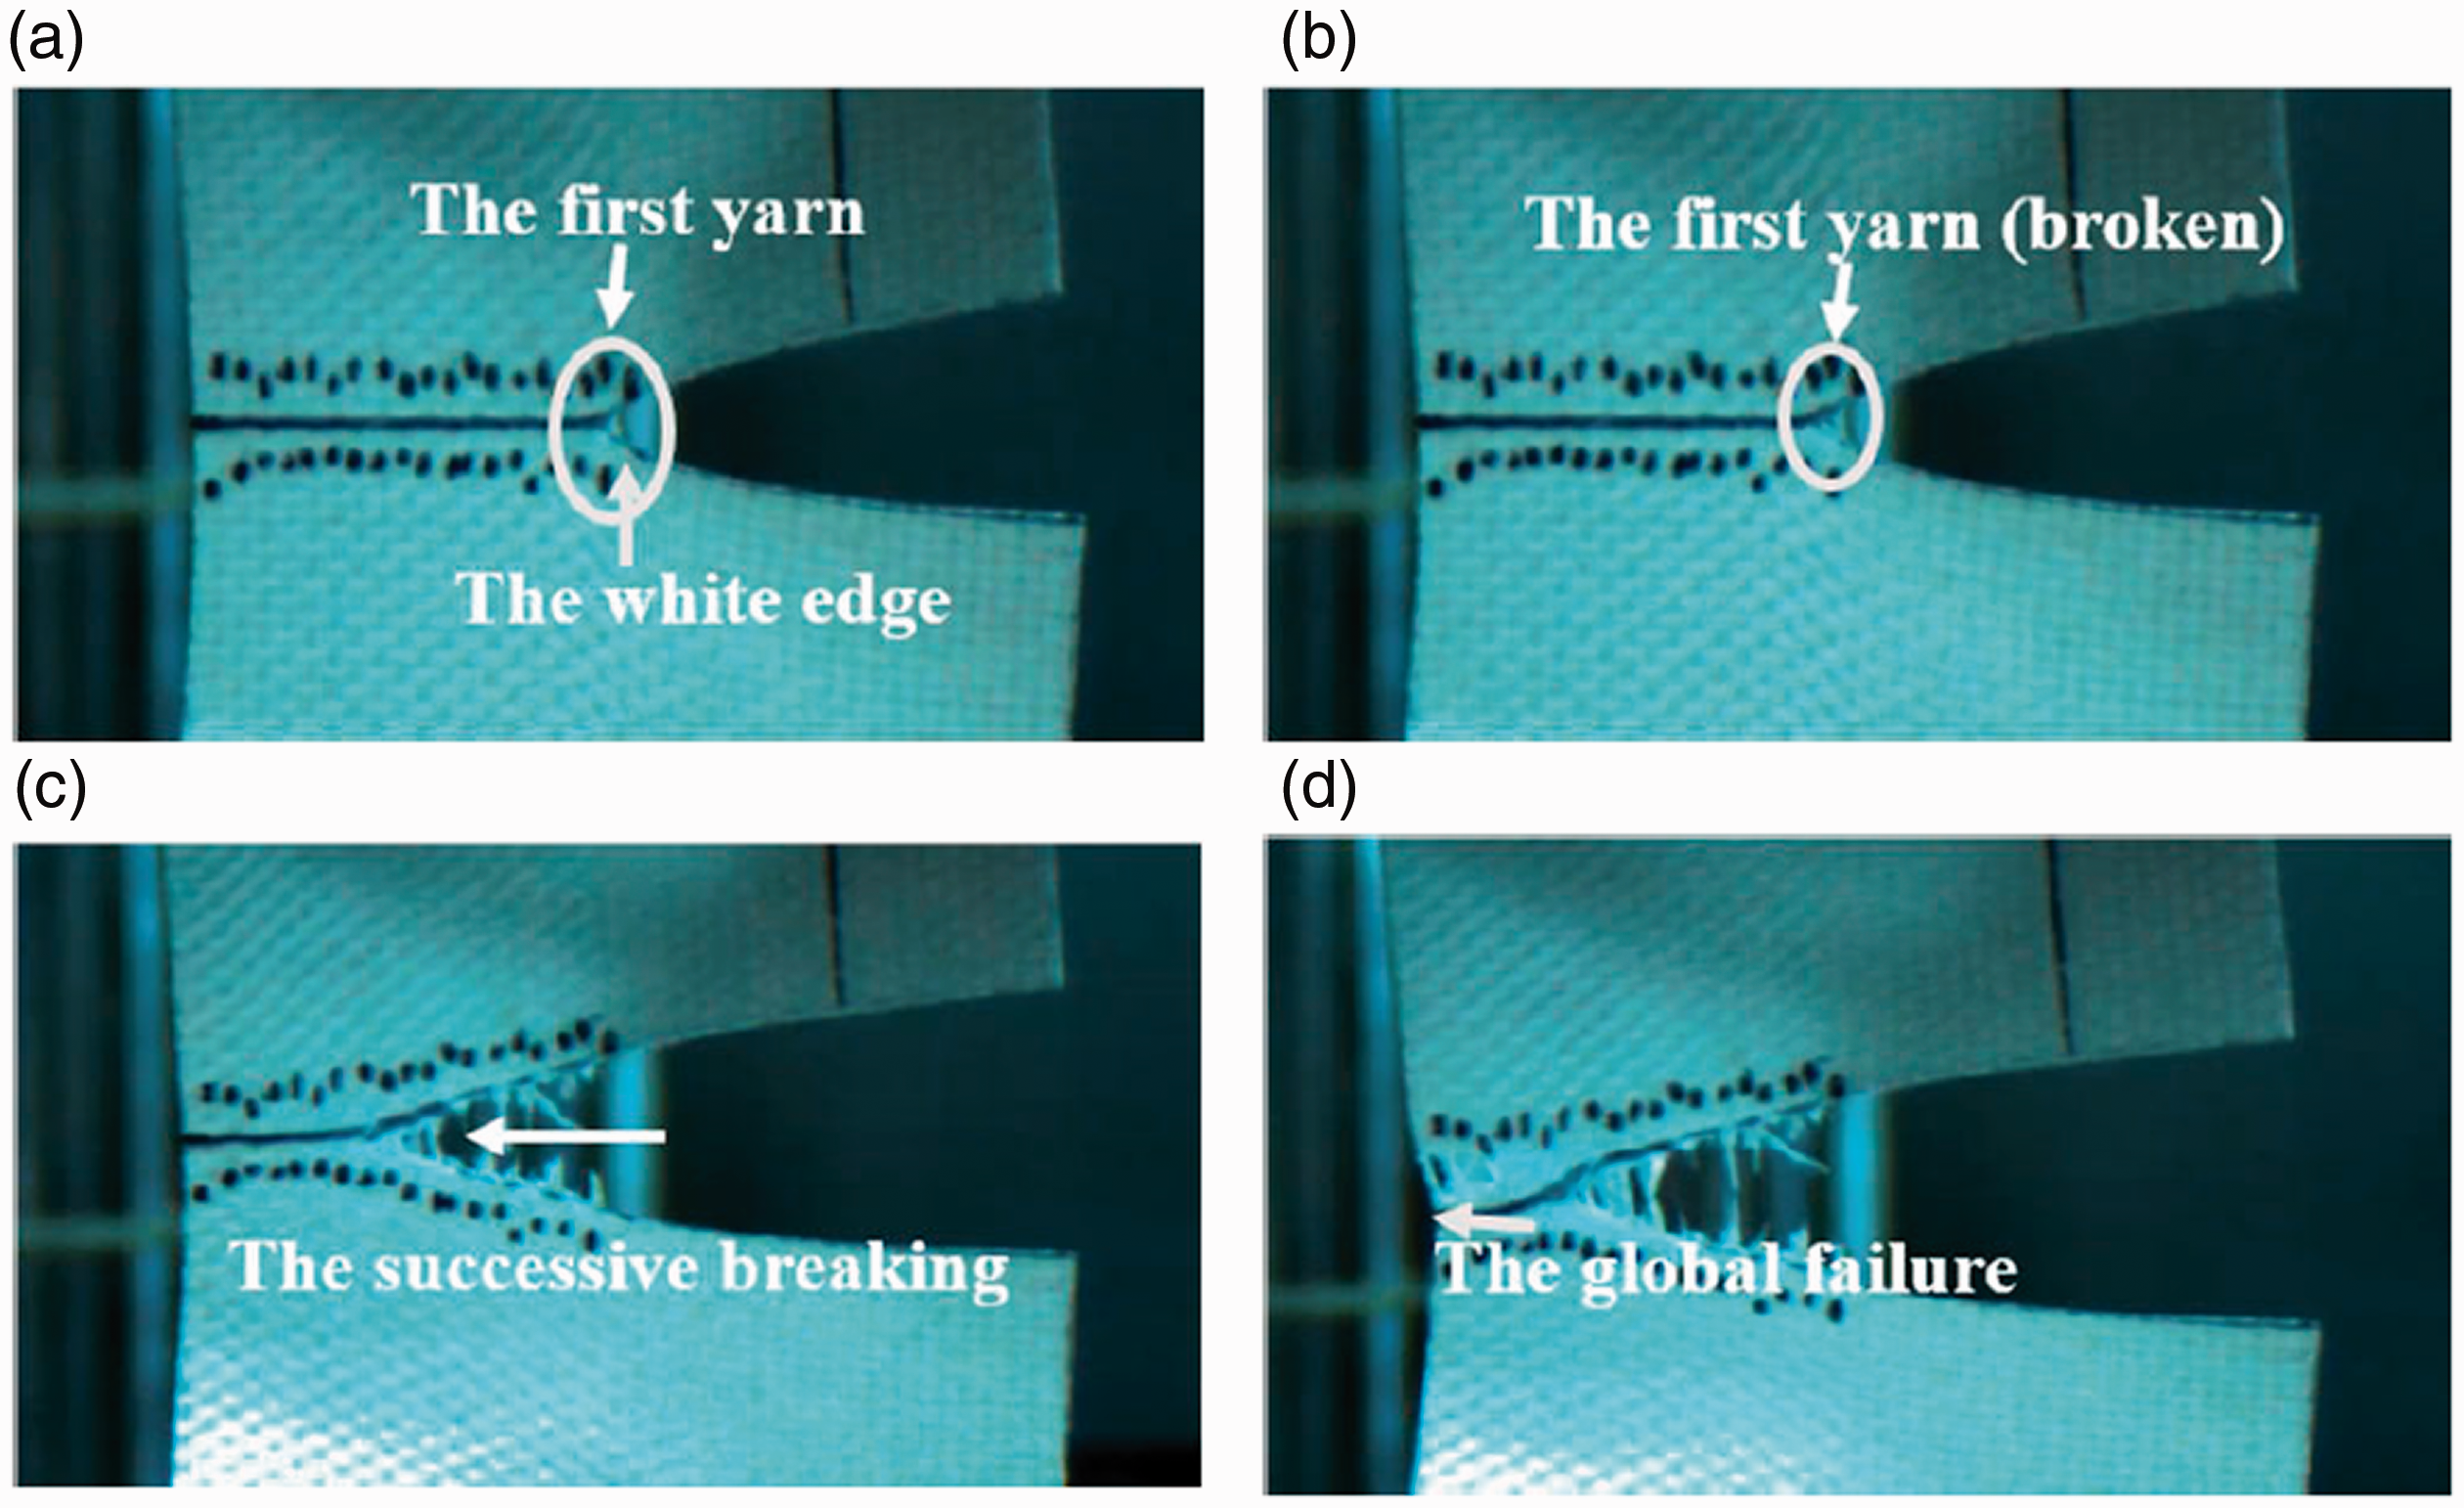
The tearing process of warp-80° in (a) the single-yarn breaking stage and (b) the successive breaking stage. For the warp and weft samples having θ of 85°, as in the case of the single-edge notch tearing specimens, they exhibit the single-yarn breaking stage, the successive breaking stage, and the global failure stage. The load–displacement curves are presented in Figures 10(f) and (g). The tearing propagation processes of warp-85° and weft-85° are presented in Figures 12 and 13, respectively. It is shown that there is little difference between the warp and weft samples, except in the deformation. As observed in Figures 12(a) and 13(a), the opening of the crack is larger and the deformation is greater in weft-85° because of the larger breaking elongation in the weft direction (the white edge in weft-85° at the slit tip is more apparent).
The tearing process of warp-85° in (a), (b) the single-yarn breaking stage, (c) successive breaking stage, and (d) global failure stage. The tearing process of weft-85° in (a), (b) the single-yarn breaking stage, (c) successive breaking stage, and (d) global failure stage.
Failure modes
In the single-edge notch tearing tests, the failure mode can be divided into three parts: the single-yarn breaking part, successive breaking part, and global failure part. The former two parts propagate along the crack with distinct tearing characteristics, although they differ in the tearing propagation process and the shapes of the load–displacement curves. The third part propagates at an incline to the crack with characteristics similar to those of uniaxial tensile failure, which extends along the weakest position of the yarns. Figures 14(a) and (b) present the failure modes of the warp samples with crack sizes of 5 and 10 mm, respectively.
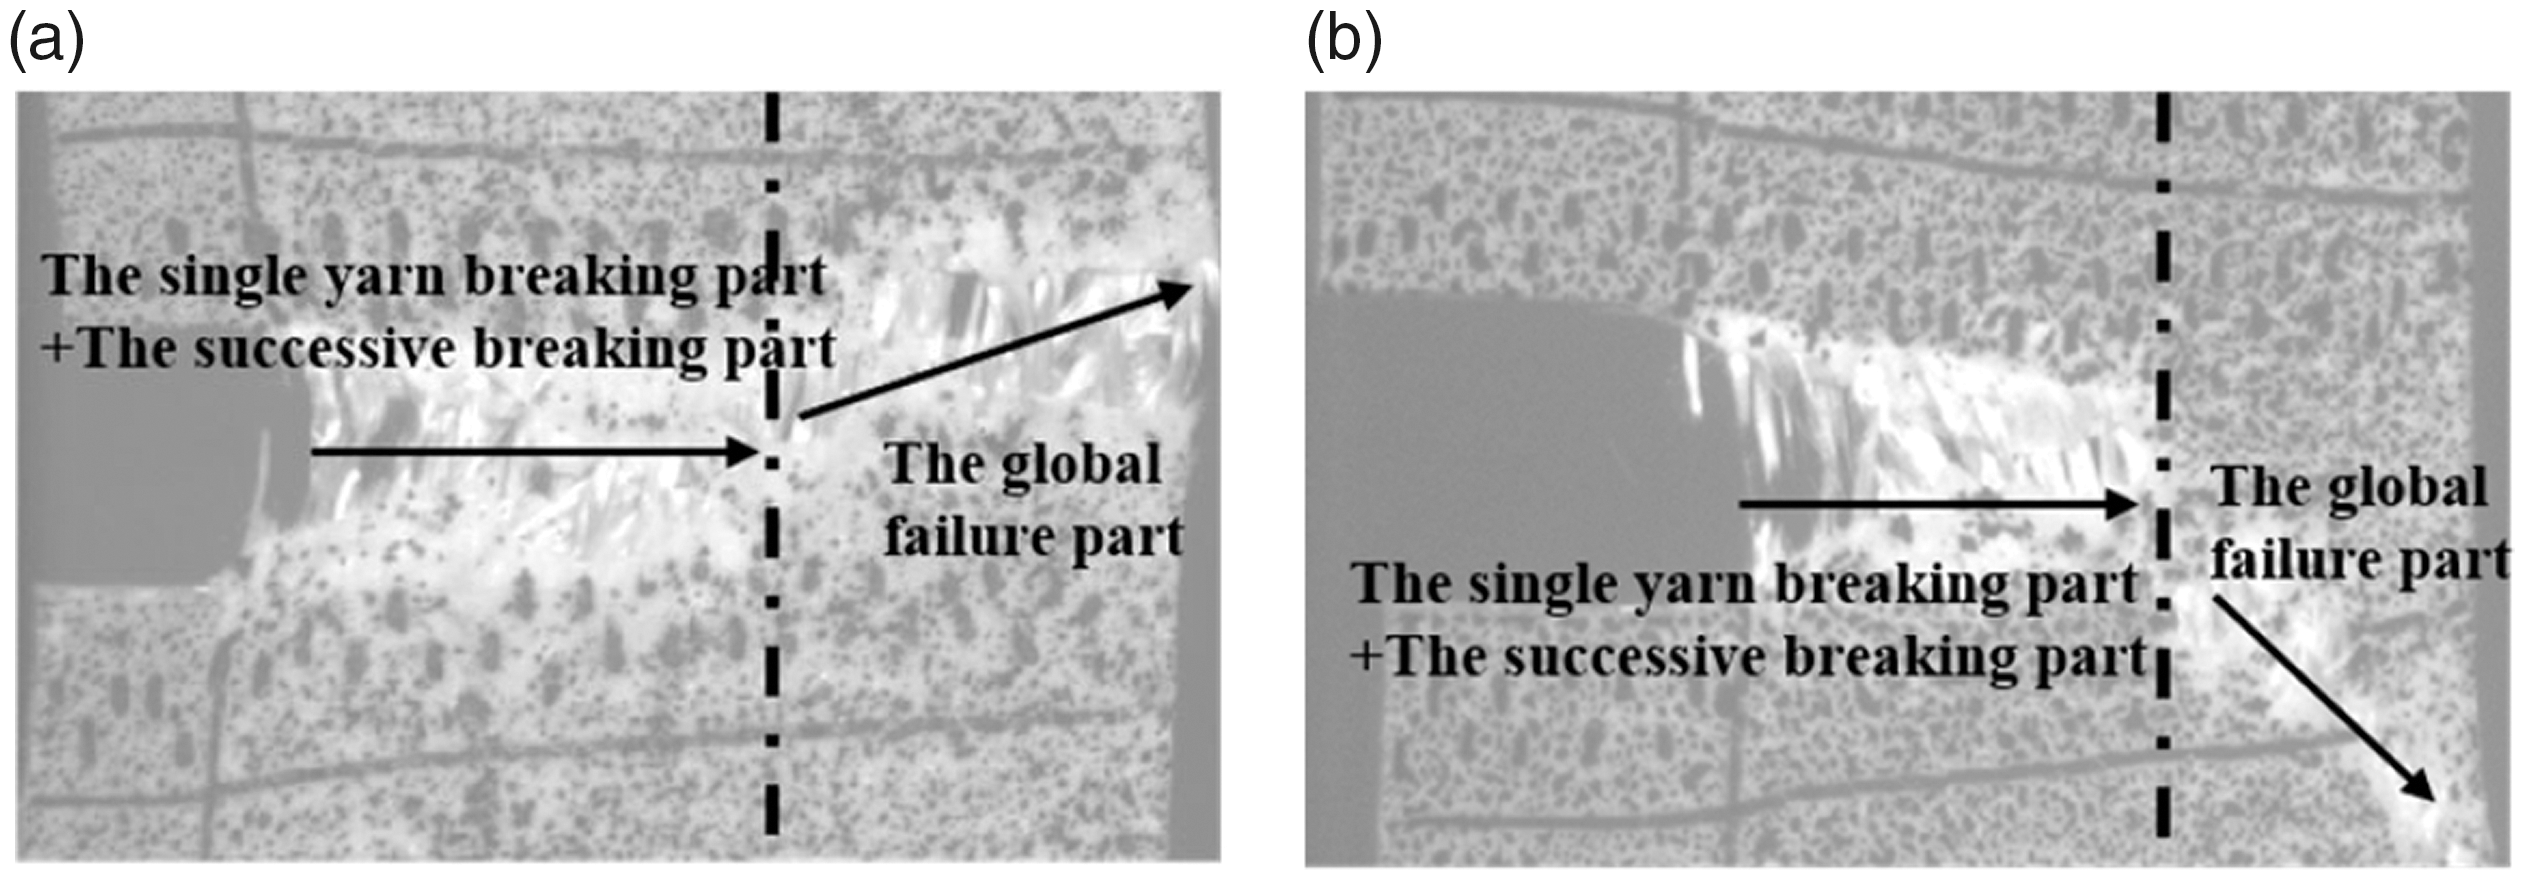
The failure mode of specimens of (a) warp-5-3 and (b) warp-10-1.
In the alternative-basic-angle trapezoidal tearing tests, the failure modes are diverse when θ varies. In the case of the trapezoidal specimens having θ of 85°, their failure mode is similar to that of the single-edge notch tearing specimens and can be divided into three parts, as shown in Figures 15(c) and (d). For the remaining trapezoidal tearing samples with different basic angles, only the single-yarn breaking part and successive breaking part are observed. Therefore, their tearing propagates only along the crack. Figures 15(a) and (b) present the failure modes of warp-75° and warp-80°, respectively.
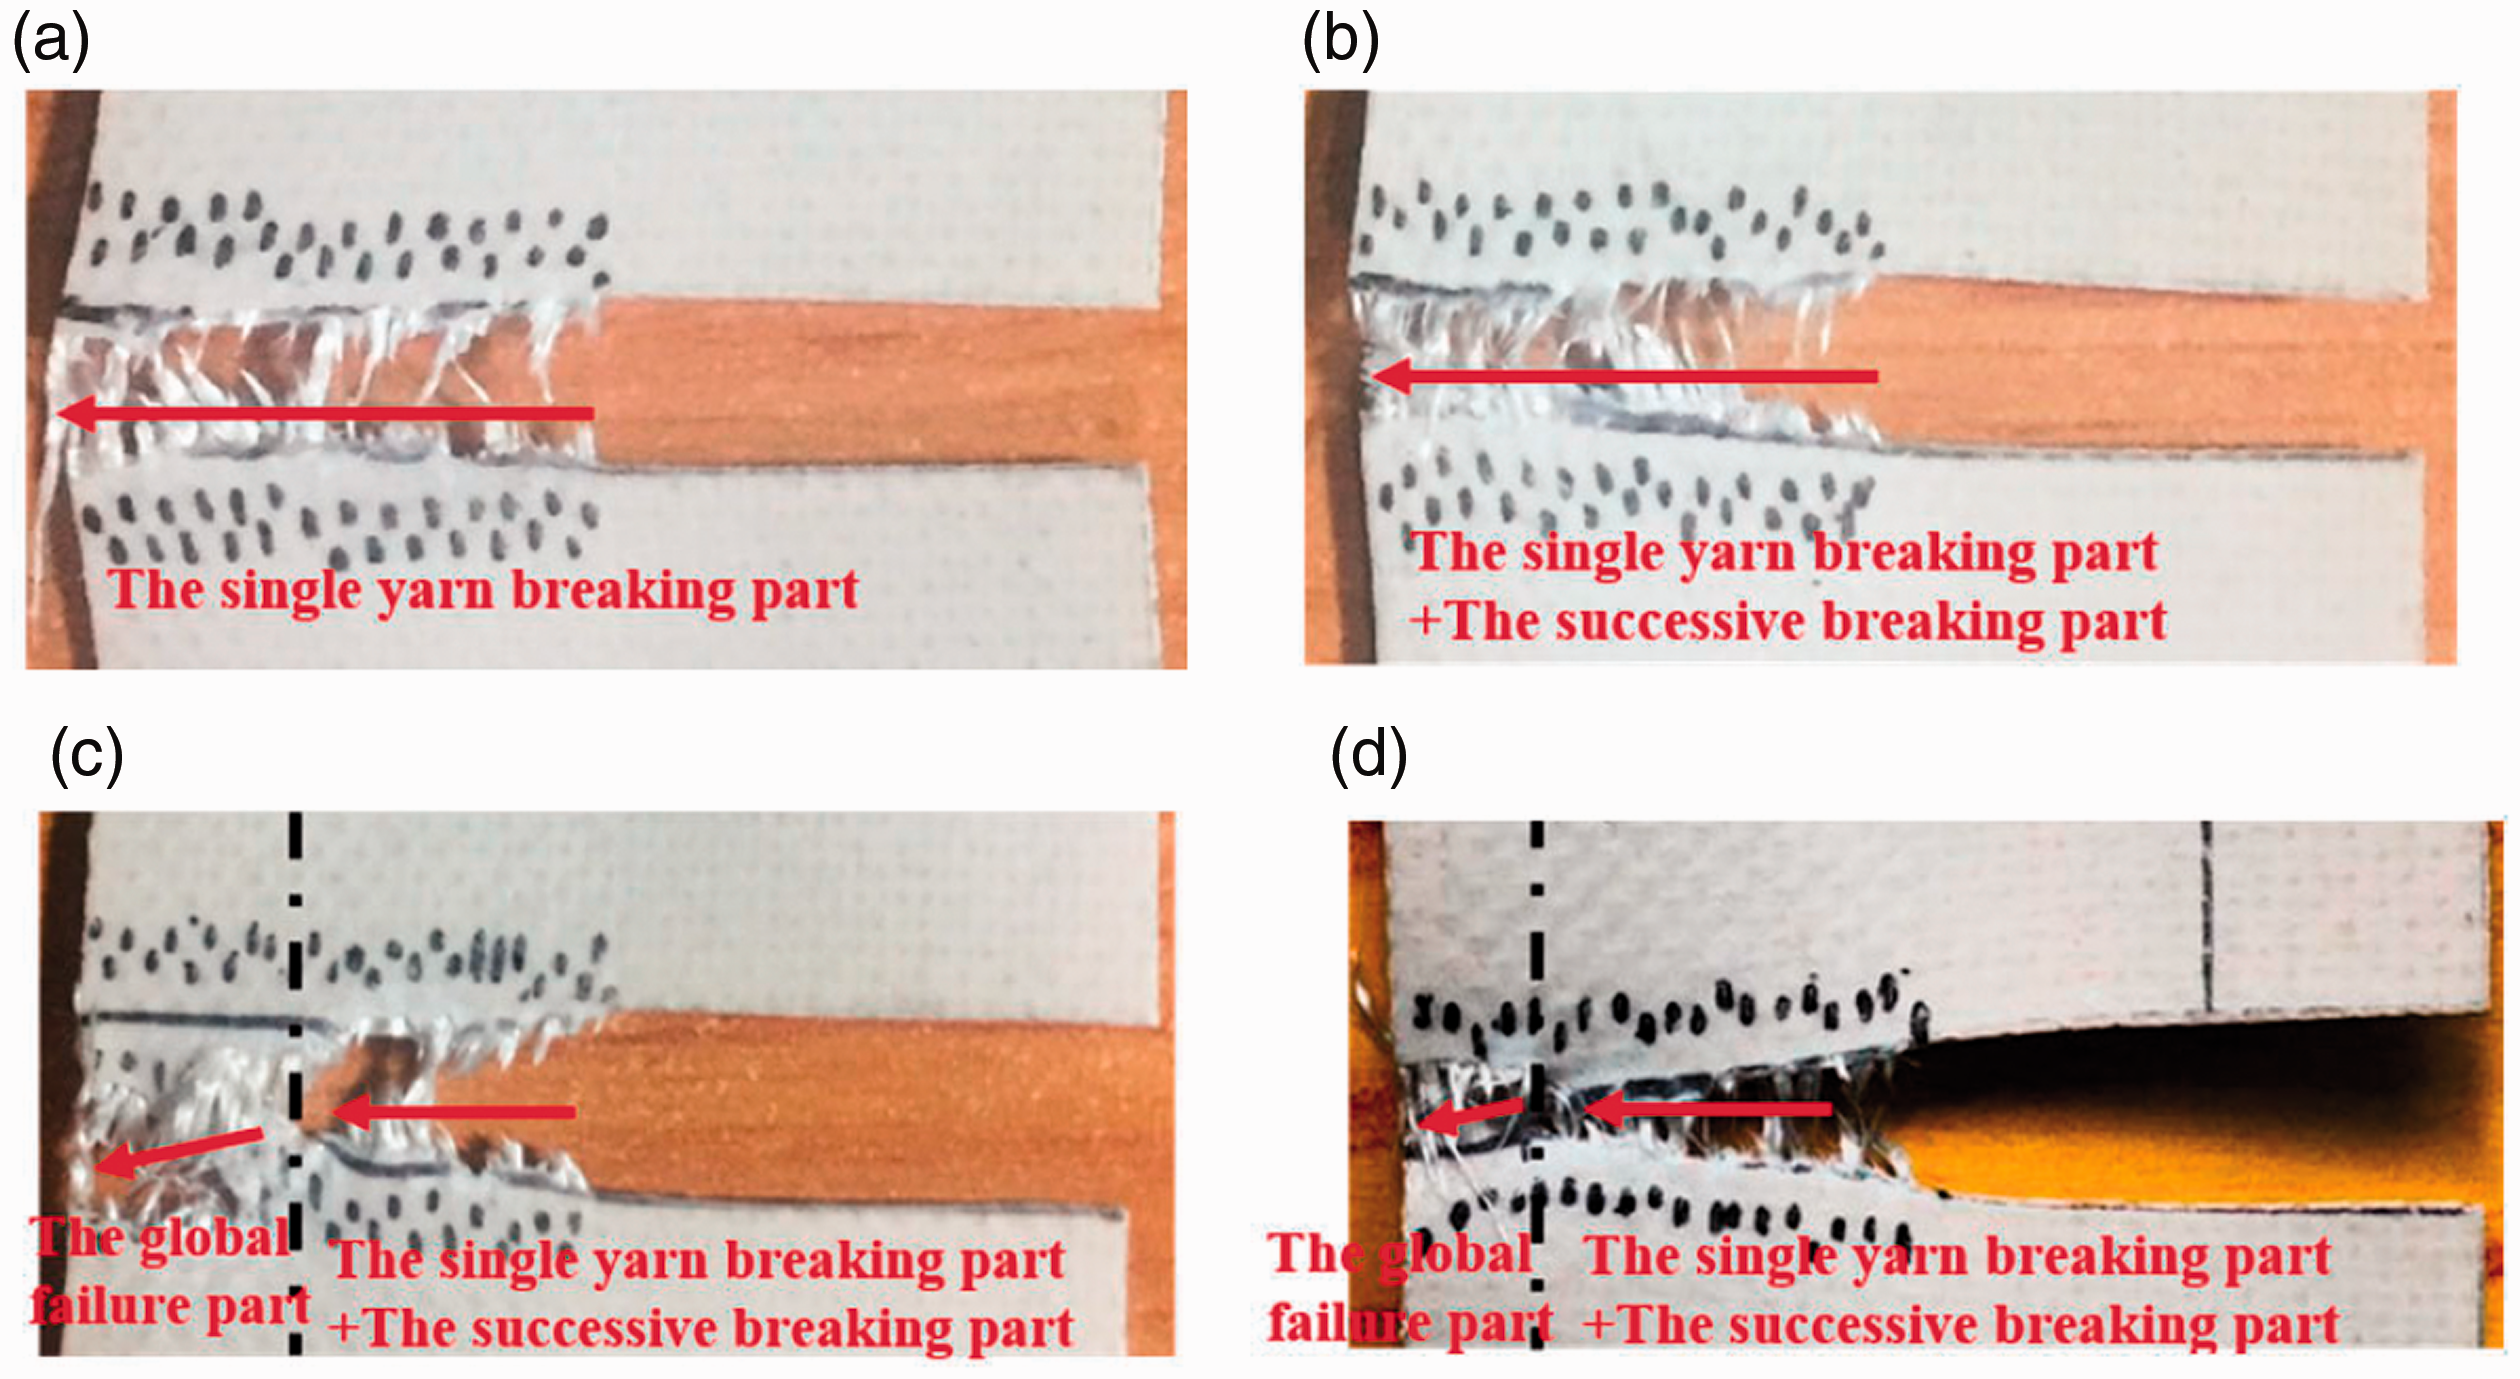
The failure mode of specimens in (a) warp-75°, (b) warp-80°, (c) warp-85°, and (d) weft-85°.
According to the above discussion, the failure modes of the warp and weft samples change when the shapes of the samples change. The single-yarn breaking part, successive breaking part, and global failure part appear in sequence as the basic angle θ increases. In addition, when the failure modes transform, the critical basic angles of the warp and weft samples differ. The two critical basic angles for the warp specimens are in the ranges of 75°–80° and 80°–85°, respectively, while those for the weft specimens are both in the range of 80°–85°, as shown in Figure 16, wherein the single-edge notch tearing specimens are indicated at 90°.
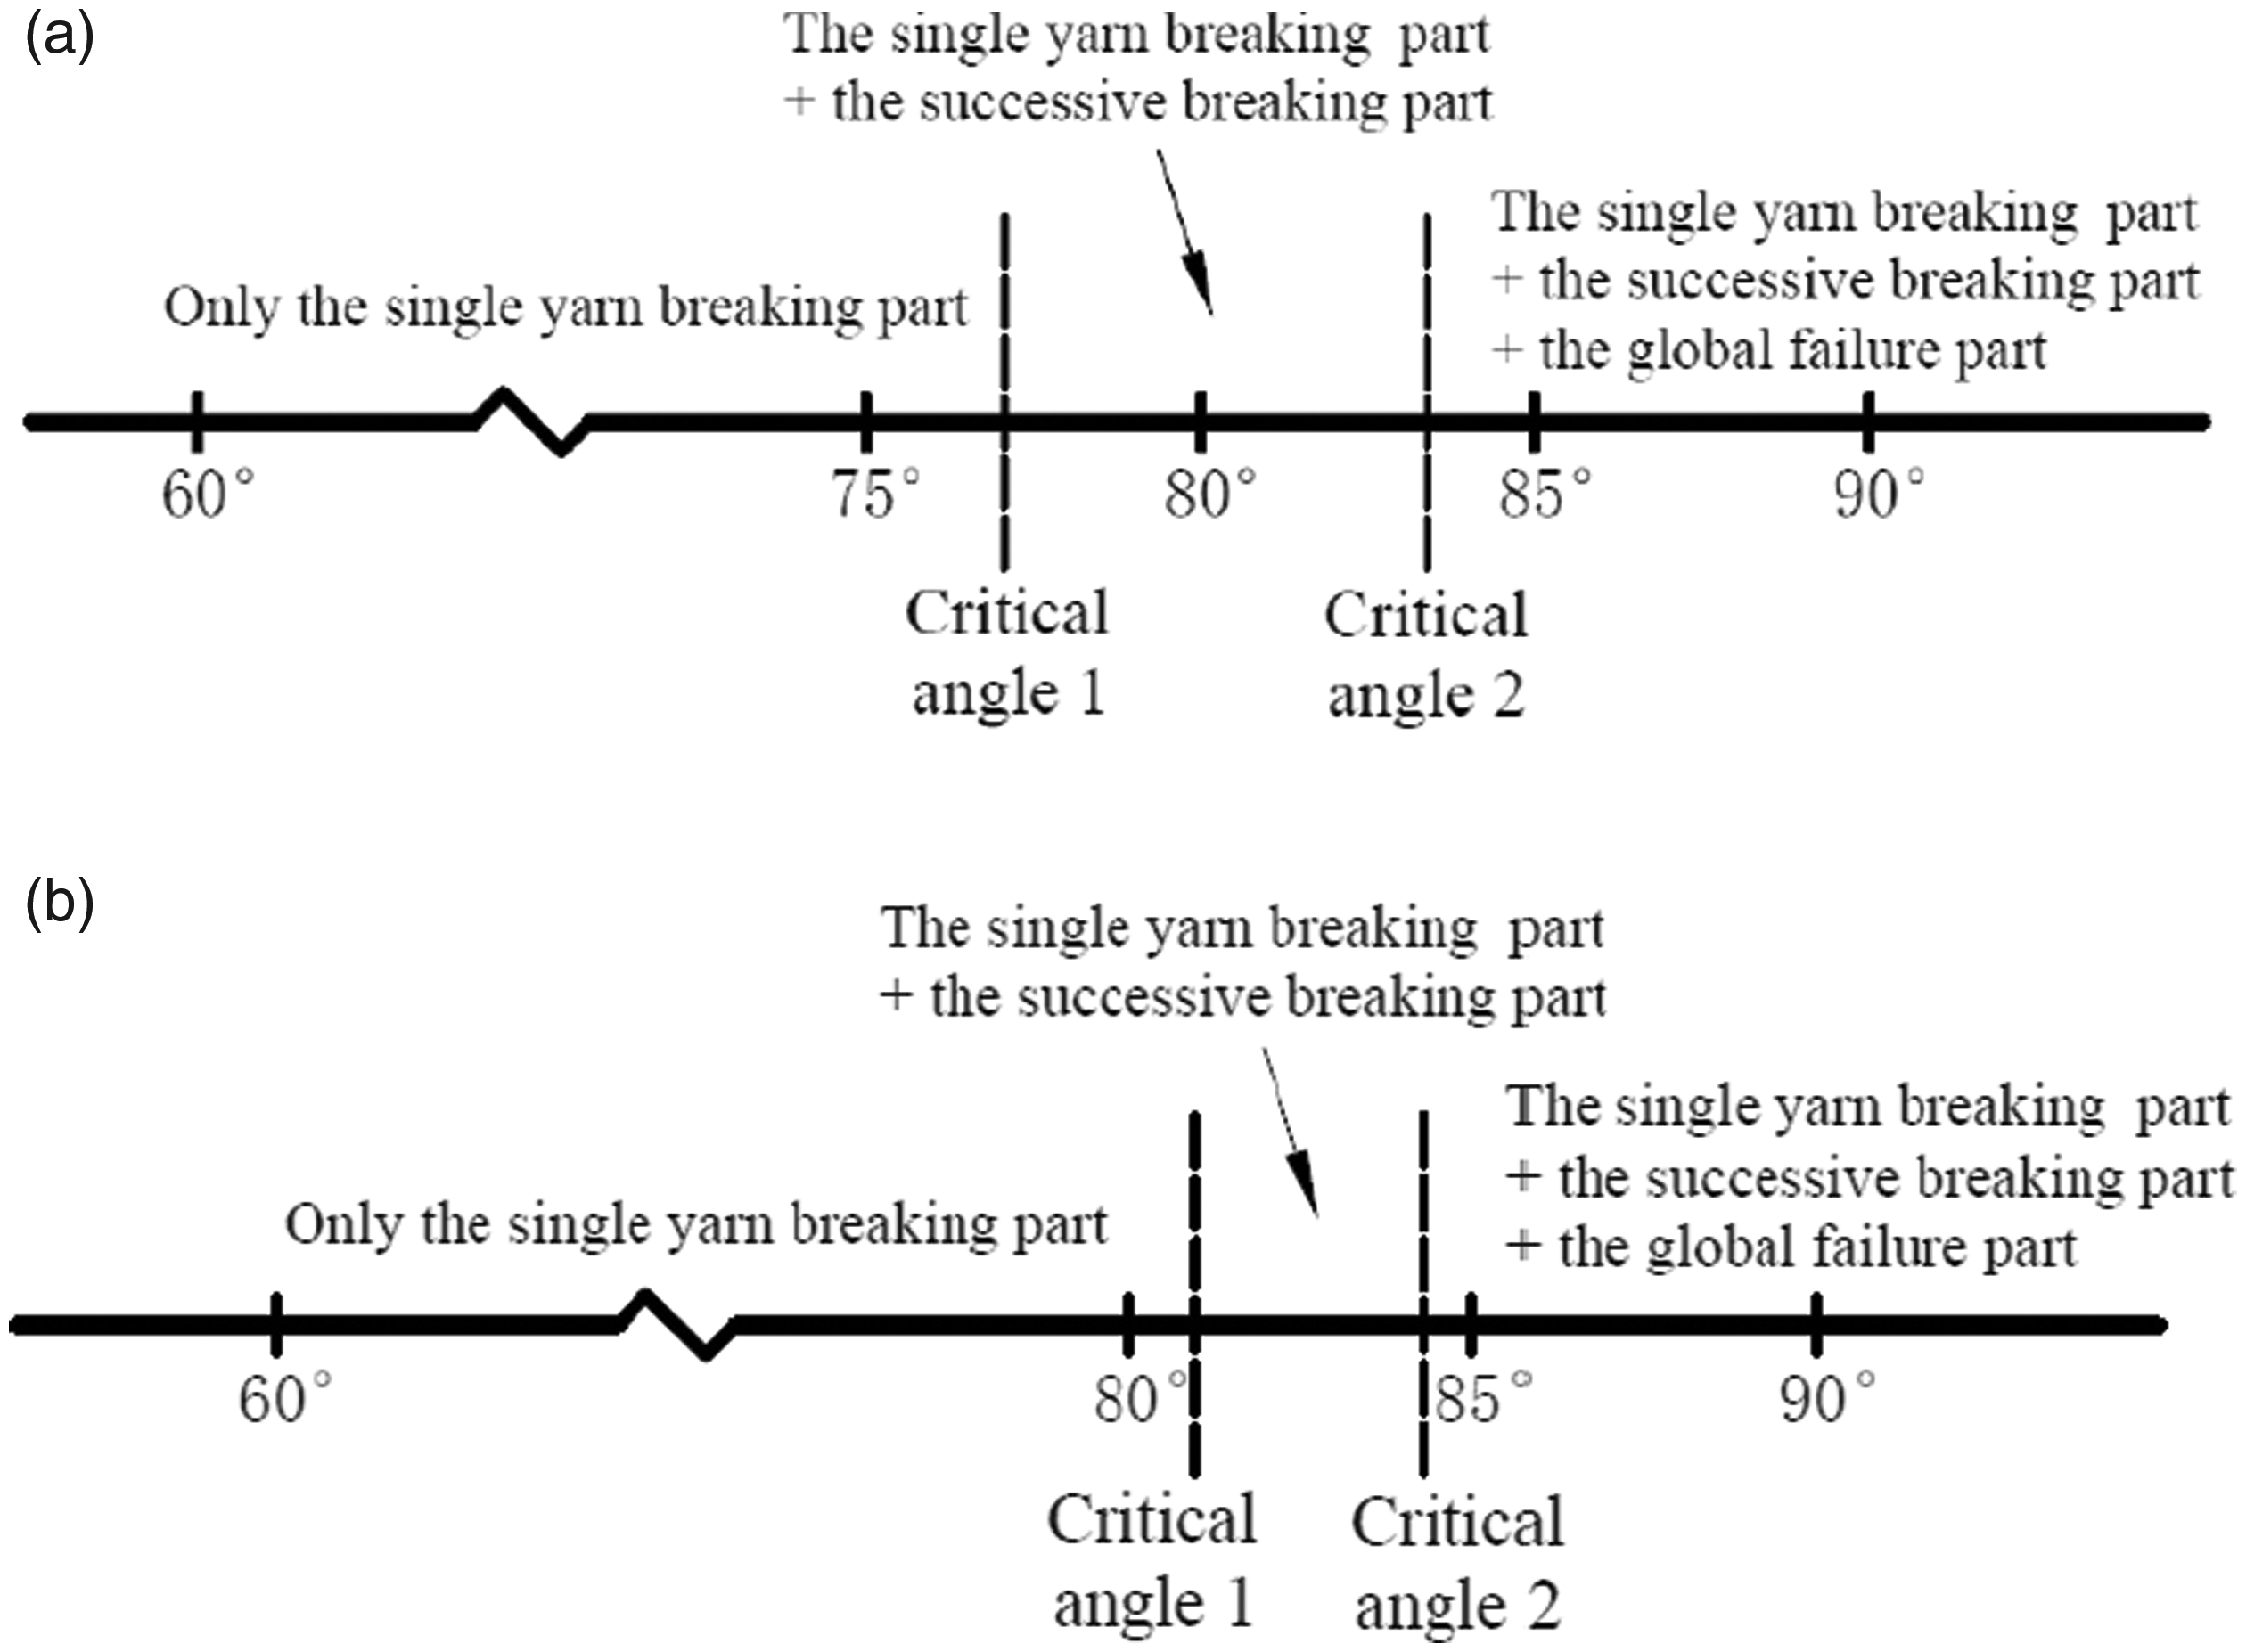
The critical basic angles in the (a) warp direction and (b) weft direction.
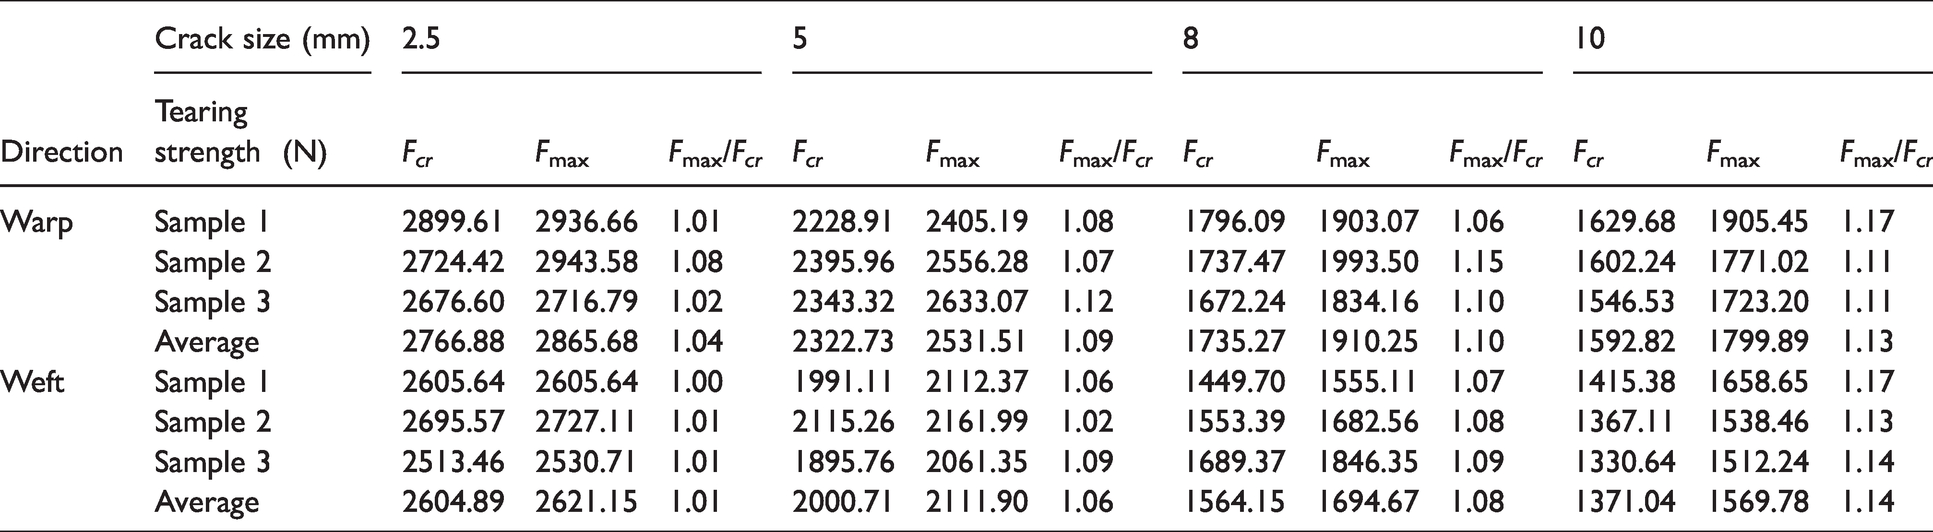
Tearing strength
In the single-edge notch tearing tests, the tensile load at the onset of tearing is the critical tearing strength, denoted as Fcr. The maximum tensile load after the initiation of tearing is the maximum tearing strength, denoted as Fmax. To investigate the relationship between Fcr and Fmax, the ratio Fmax/Fcr is calculated. The results obtained are listed in Table 3. The changes in Fcr and Fmax with the increase in the slit size are also presented in Figure 17.
The single-edge notch tearing strength
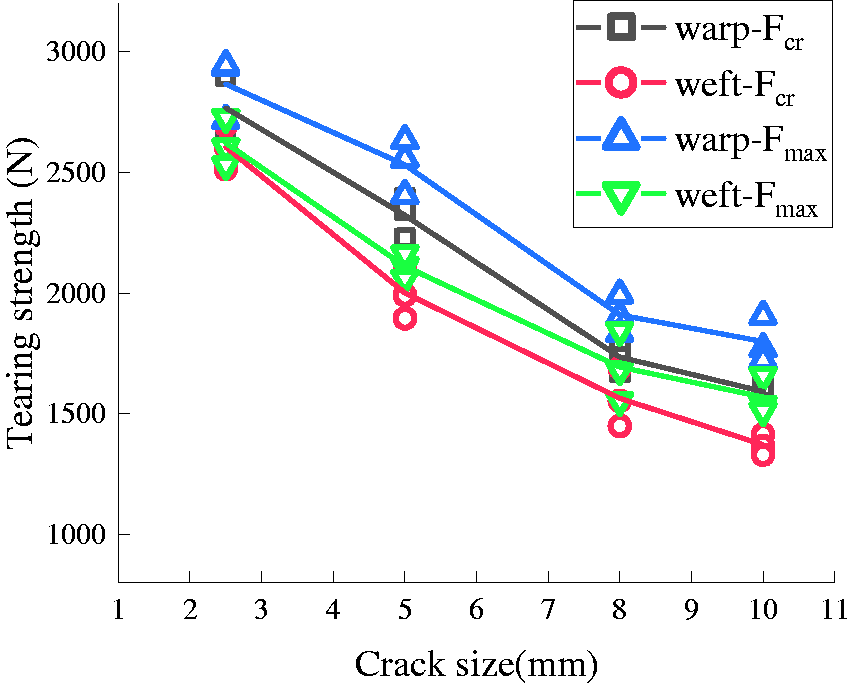
The relationship between the single-edge notch tearing strength and crack size.
With respect to the alternative-basic-angle trapezoidal tearing tests, according to the method indicated by DG/TJ08-2019-2007, 10 the average value of the five maximum peaks in the load–displacement curve of a sample is considered as the tearing strength of this sample. Therefore, the tearing strength of all warp and weft samples having different θ values is obtained (see Figure 18).
The alternative-basic-angle trapezoidal tearing strength.
From Table 3 and Figure 17, it is evident that the existence of cracks has a significant influence on Fmax and Fcr. With an increase in a, the tearing strength in both the warp and weft directions decreases gradually, but the decreasing trend gradually slows. Furthermore, as Fmax/Fcr increases, the deviation between Fmax and Fcr increases.
From Figure 18, it can be observed that the tearing strength is also evidently affected by θ. When θ changes from 60° to 85°, the tearing strength increases. Moreover, in Figures 17 and 18, the larger tearing strength also changes from weft to warp. The former observation can be attributed to the decrease in the size of the tearing del-zone, which determines the tearing strength as θ gradually decreases. The latter observation can be attributed to a change in the dominant factor influencing the tearing strength. For the single-edge notch tearing samples and trapezoidal tearing samples with θ of 85°, the stress state is closer to the uniaxial tensile status; the dominant factor is the tensile strength, which results in a greater warp tearing strength. As θ gradually decreases, the breaking elongation has a greater effect. When θ is the same, the tearing del-zone in the weft samples is larger, which results in a greater weft tearing strength.
Analysis and discussion
Based on the test results obtained in the previous five sections, it is evident that the crack size “a” and basic angle “θ” affect the load–displacement curves, tearing process, failure modes, and tearing strength. With an increase in a, the tearing strength Fcr and Fmax decrease gradually, but the ratio Fmax/Fcr increases. With an increase in θ, three stages in the tearing process and three parts in the failure modes appear in sequence, the tearing strength increases, and the warp tearing strength increases beyond the weft tearing strength.
Furthermore, the relationship between the tearing process and tearing strength because of the existence of a and θ can be clarified. Taking the warp test results as examples for this explanation, the load–displacement curves of samples with various values of θ and a are presented in Figures 19(a)–(d), wherein different sections have been distinguished. From Figures 19(a)–(d), it can be observed that the single-yarn breaking stage is a process in which the tearing strength continues to increase, and the occurrence of the successive breaking stage is accompanied by the occurrence of the maximum tearing strength, while the global failure stage corresponds to the rapid decline of the tearing strength and overall fracture of the samples. Furthermore, from Figures 19(a) and (b), it is apparent that, in the trapezoidal tearing tests, five maximum peaks are distributed in and around the successive breaking section.
The tearing strength distribution on load–displacement curves in (a) the trapezoidal tearing sample warp-80°, (b) the trapezoidal tearing sample warp-85°, (c) the single-edge notch tearing sample warp-2.5-1, and (d) the single-edge notch tearing sample warp-10-1.
The reason why the shape of the load–displacement curves varies (described in the Load–displacement curves section) and why Fmax/Fcr increases (described in the Tearing strength section) as the crack size “a” increases can be clarified. It can be observed from Figures 19(c) and (d) that, when a increases gradually, the sample experiences a longer single-yarn breaking stage, the start of the successive breaking stage is delayed, and even the samples with the smallest crack do not undergo the single-yarn breaking stage (see Figure 19(c)). Therefore, the curves of the samples with the smallest crack exhibit a downward trend almost immediately, and their Fmax is closer to Fcr. The curves of other samples exhibit several jagged increases, reach the maximum load, and then drop off. Corresponding to this, their Fmax appears later and may even be greater than Fcr, which results in an increase in Fmax/Fcr.
Strain distribution at the crack section
Based on the previous discussion on the failure modes, tearing process, and tearing strength in the two tests, it is evident that these aspects of the single-edge notch tearing samples are more complex. However, these samples have a plane tearing mode, and their stress is carried by the entire crack section, which is closer to the actual state of the membrane structures. Therefore, further research is conducted on this topic. DIC equipment is employed to record the deformation and strain. For this test, the in-plane data is the researched in the majority, which requires more careful treatment, while the out-of-plane data is neglected owing to its low priority. The distribution of the in-plane strain at the crack section along the loading direction, which is denoted along the y-direction (hereinafter referred to as strain) when tearing initiates and extends, is investigated. The reason why the tearing strength of PTFE coated fabrics still increases after the initiation of tearing can be clarified according to the strain distribution at the crack section.
Strain distribution at the crack section when tearing initiates
Taking the warp samples as examples, the strain distribution along the y-direction on the surface when tearing initiates is shown in Figure 20. It can be observed that the larger strain is mainly distributed in a small range (approximately 2–3 yarns) at the crack tip. Furthermore, the strain distribution at the crack section, which is the most representative, has been studied extensively. 31 , 32 In the case of the acquisition of the strain distribution at the crack section when tearing initiates, by marking the central position of all the yarns on the surface before testing, according to the marking position, the strain of each yarn at the slit section can be obtained based on the photos captured using the DIC equipment during the testing. In this treatment, the strain at the center of a yarn is used as the average strain in the yarn to approximate the uneven strain in this yarn. The photo whose shooting time is closest to the breaking time of the first yarn is selected as the research object. Thus, the strain of each yarn at the crack section is obtained, as shown in Figure 21, wherein the strain is the true strain along the y-direction, the center of the first yarn at the crack tip is taken as the origin, and the distance begins from the origin at the crack section. In accordance with the process displayed in Figure 22, the strain is converted into the load of each yarn by using the uniaxial tensile stress–strain relationship shown in Figure 23. In Figure 23, the tensile speed is 3 mm/min in order to match the test conditions of the single-edge notch tearing tests. Then, the loads of the yarns are added to calculate the total load Fcal. 32 A comparison of Fcal and the critical tearing load Fcr is presented in Figure 24. It is apparent from Figure 24 that, for the majority of cases, Fcal is slightly less than Fcr, but the deviations between them are all within 10%, and they are almost consistent in the weft direction. Based on this, it can be observed that the strain distribution at the crack section obtained using the DIC equipment is close to the actual situation. Therefore, this treatment is reasonable.
The true strain distribution along the y-direction on the surface at the onset of tearing in (a) warp-2.5, (b) warp-5, (c) warp-8, and (d) warp-10.
The true strain distribution along the y-direction at the crack section at the onset of tearing in (a)–(d) warp specimens and (e)–(h) weft specimens.

The calculation process of the load borne based on the strain of yarns.
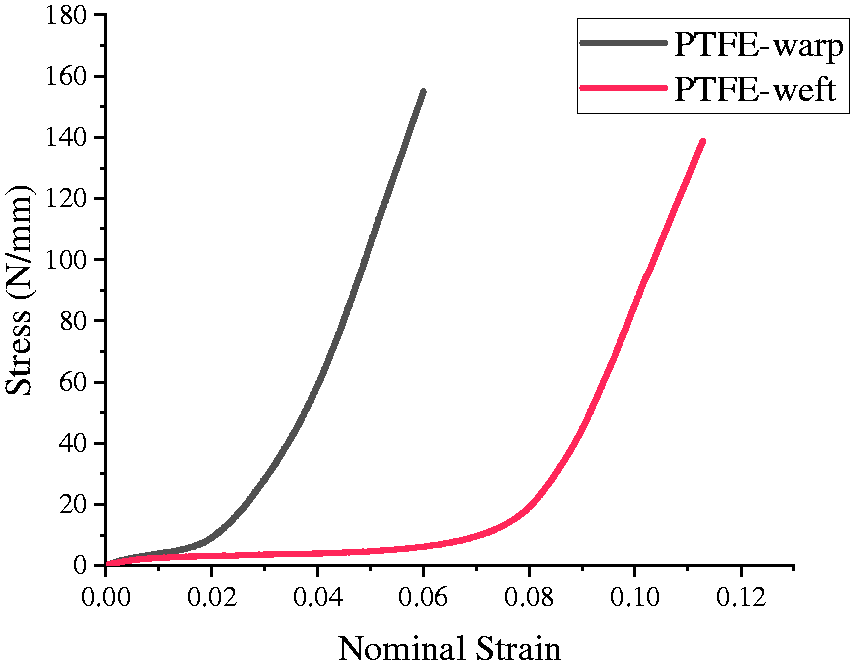
The uniaxial tensile stress–strain relationship of the polytetrafluoroethylene (PTFE) coated fabric (tensile speed of 3 mm/min).
Comparison of Fcal and Fcr at the onset of tearing in the (a) warp specimens and (b) weft specimens.
Strain distribution at the crack section after tearing initiates
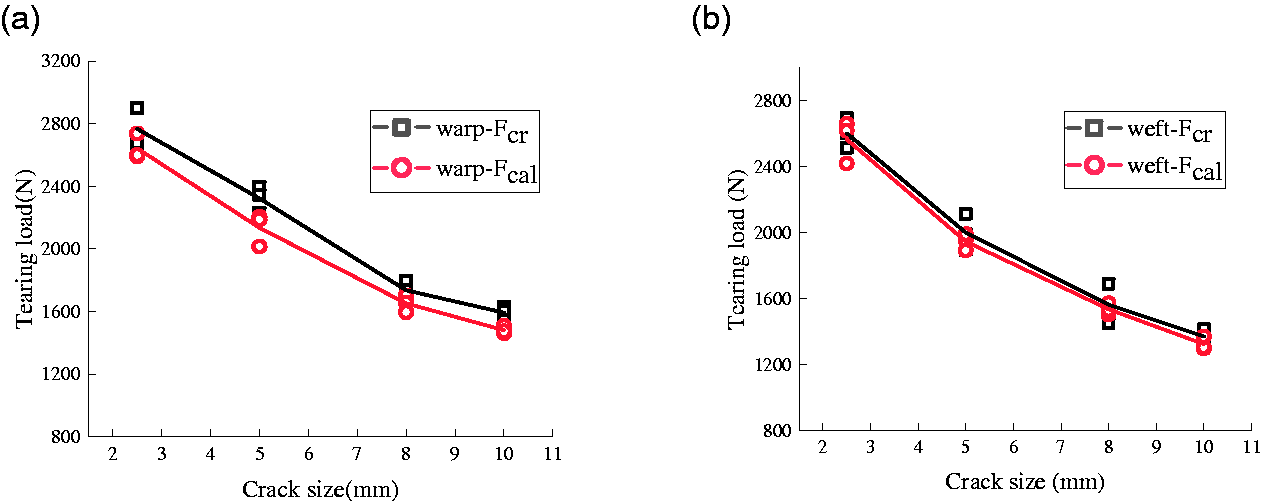
In the case of the acquisition of the strain along the y-direction at the crack section when tearing propagates, because there is no obvious separation between the coating and the yarns when the yarns break in PTFE coated fabrics, and therefore it is impossible to directly determine whether a yarn breaks from the photos. Therefore, the load–time relationships recorded by the universal testing machine can be adopted to confirm the times at which yarns break, and the photos that are captured at the timings that are closest to these timings are selected for the study. In order to explain why the tearing strength increases after tearing initiates, the single-yarn breaking stage, which develops slowly with an ascending portion and obvious zigzags on the curves, is the most suitable for investigation. As mentioned in the Analysis and discussion section, for specimens with the smallest crack, the single-yarn breaking stage sometimes does not occur. Therefore, only the remaining crack sizes are considered, and for each crack, a warp sample is taken as an example. The true strain along the y-direction at the crack section when the first, second, or third yarn at the crack tip is about to break is presented in Figure 25. In Figure 25, the center of the yarn that is about to break is taken as the origin. Similarly, according to the calculation process in Figure 22, the load along the y-direction of each yarn at the crack section is obtained, as shown in Figure 26. A comparison of the calculated load Fcal and tearing load Ftest when the first, second, or third yarn breaks is shown in Figure 27. The result is similar to that presented in the Strain distribution at the crack section when tearing initiates section, where Fcal is slightly low, but the differences are all within 10%.
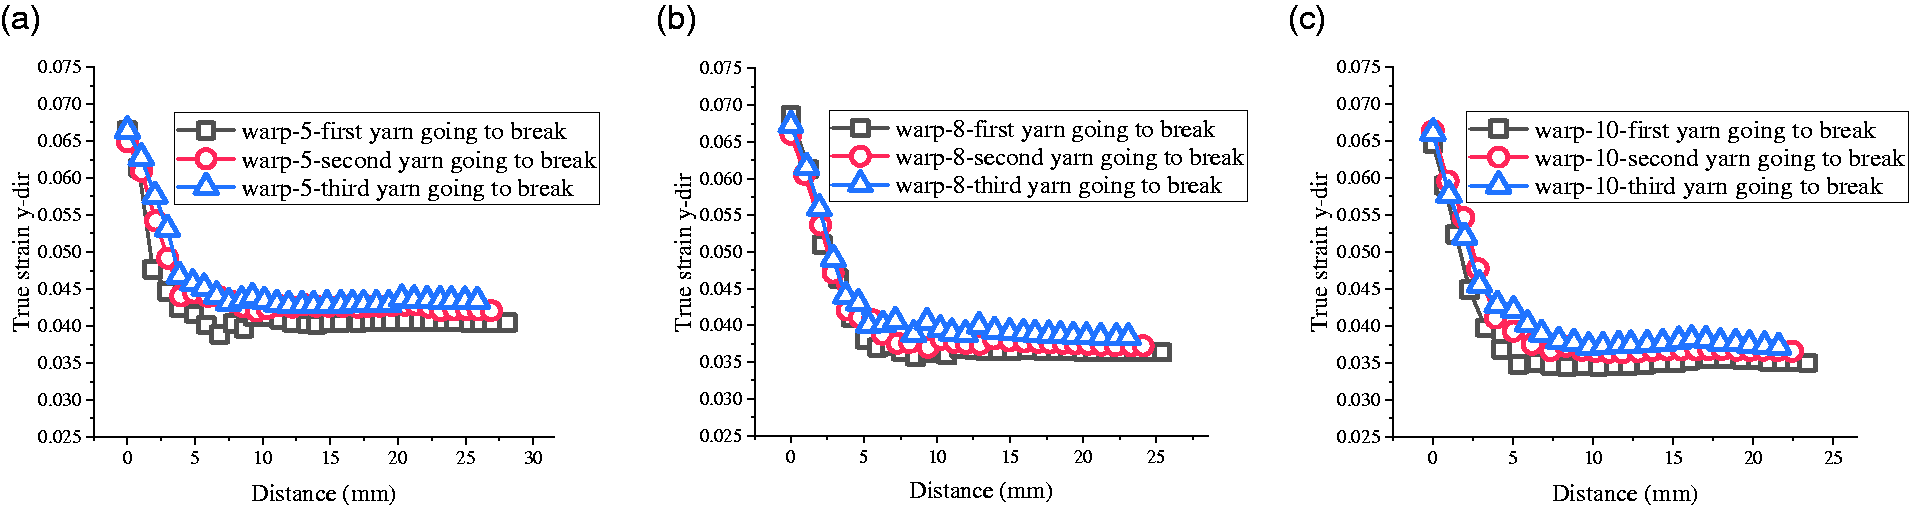
The true strain distribution along the y-direction after the onset of tearing in the warp specimens.
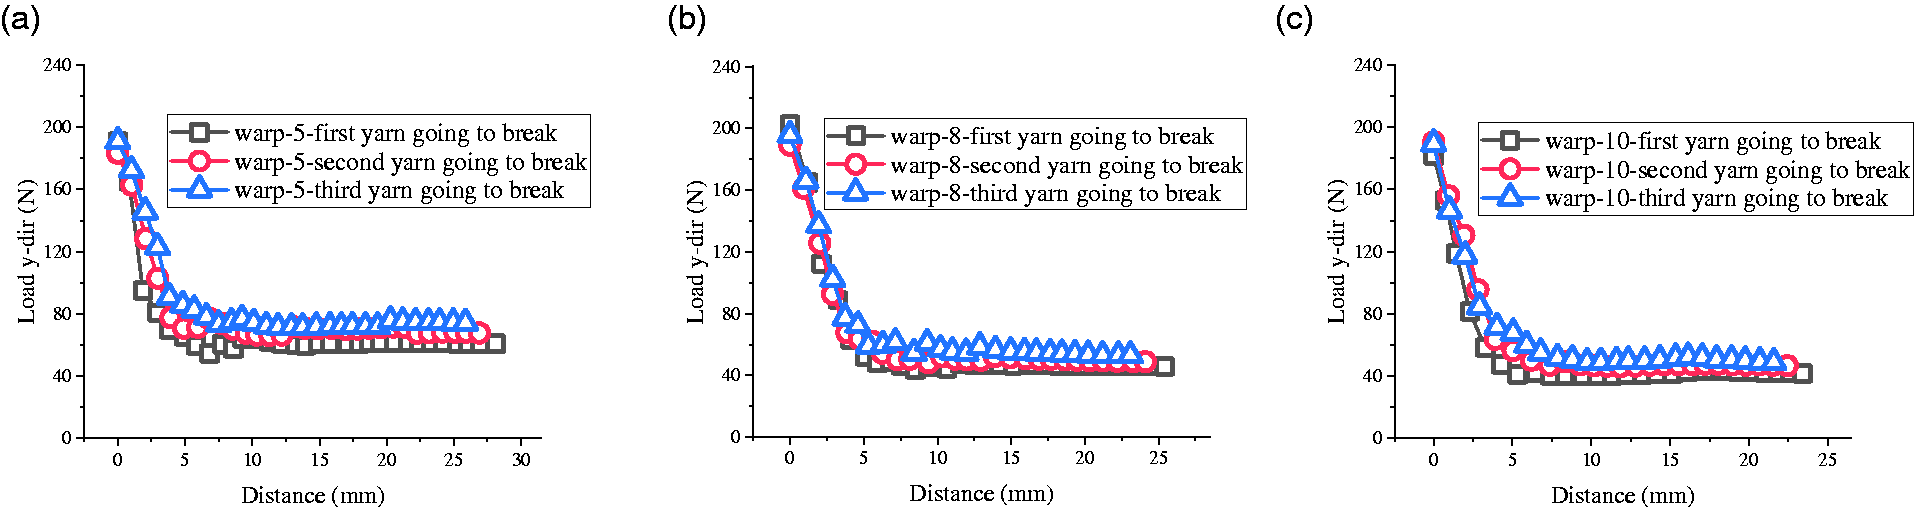
The load distribution along the y-direction after the onset of tearing in the warp specimens.
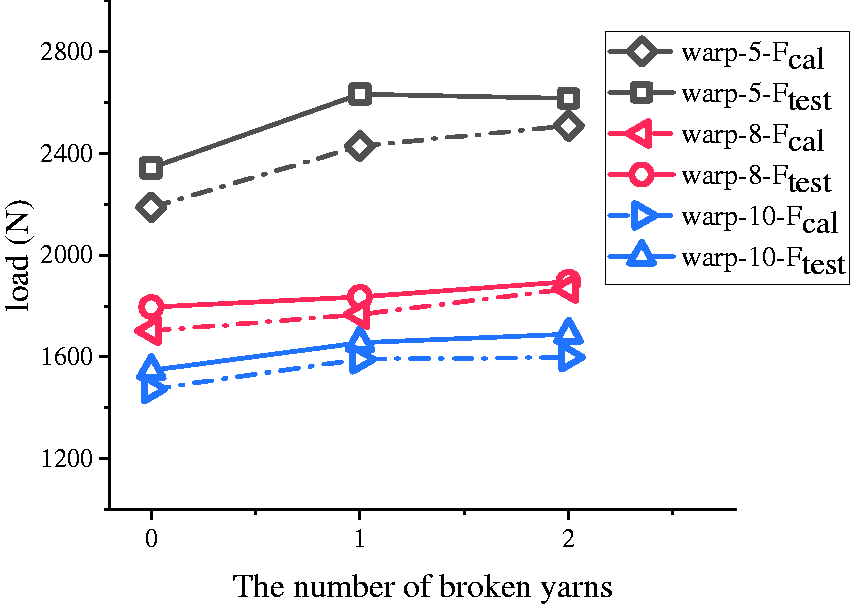
Comparison of Fcal and Ftest after the onset of tearing in the warp specimens.
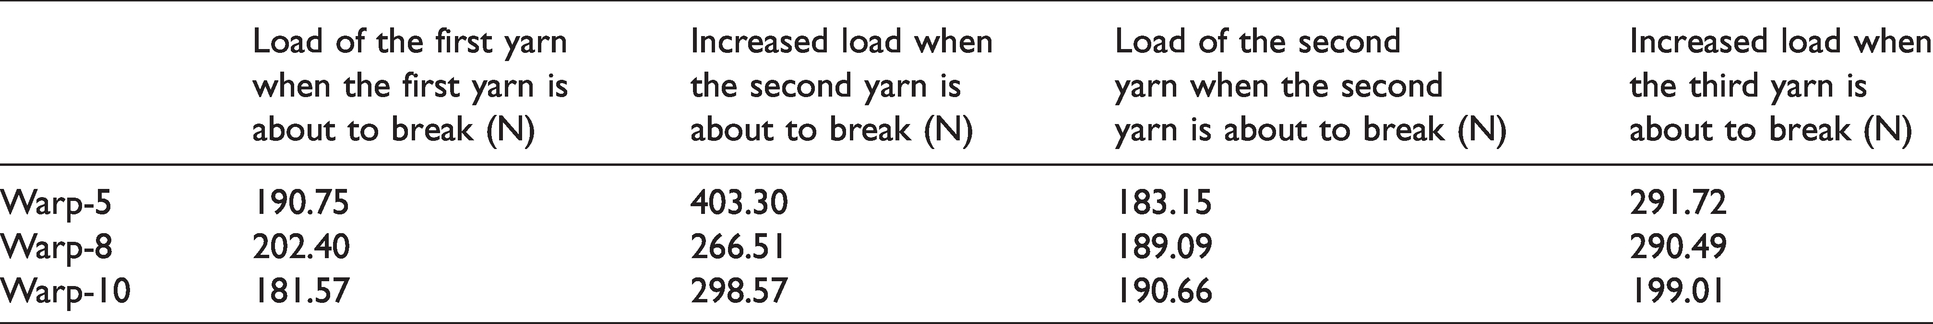
Based on the load distribution in Figure 26, the reduced load caused by the breaking of the first or second yarn can be confirmed, and the increased load offered by the residual yarns when the second or third yarn breaks can be calculated, as shown in Table 4. It can be observed that the latter increased load can compensate for the former reduced load because it is larger, which increases the tearing strength. Moreover, the large increase in load can be attributed to the material properties of glass fiber fabrics. Due to the large stiffness at the hardening stage of the glass fiber fabrics, a large force can be generated with a small strain increment, which is a unique property of glass fiber fabrics.
Comparison of the increased load and reduced load
Simulation of the single-edge notch tearing tests
Owing to the reason presented in the fourth section, the single-edge notch tearing test is more complex and important; therefore, more studies on this subject have been conducted. The theoretical and numerical simulation for it are included.
Theoretical simulation
Many scholars have attempted to propose reasonable theoretical models for predicting the tearing strength of fabrics to avoid conducting a large number of tests to simulate various stress states. Among these models, the exponential stress field theory, 23 Thiele’s empirical formula, 23 and Hedgepeth’s stress concentration factor model 33 are currently widely accepted. In addition, the study by Whitney and Nuismer34 employs a stress distribution model that is applicable to laminated composites. In the case of PTFE coated woven fabrics, the applicability of these models is worth investigating to deepen our understanding and accumulate data for future work. The inspection is conducted according to the single-edge notch tearing results.
Thiele’s empirical formula
Thiele’s empirical formula is proposed based on the results of inflatable cylinder tests. It provides good predictions of the tearing stress of airship envelope materials.
23
The original form of the formula is
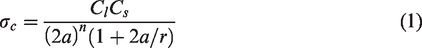
For the single-edge notch tearing tests, the curvature radius of the specimens is close to infinity. Therefore, the formula can be simplified as follows
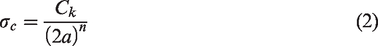
Exponential stress field theory
The exponential stress field theory assumes that the stress at the slit section distributes exponentially
23

When the length of the crack is much smaller than the width of the specimen, the relationship between the critical tearing stress and crack size can be proposed

Hedgepeth’s stress concentration factor model
Hedgepeth
33
presents a model from a microscopic perspective. He assumes that the matrix bears all shear loads and the yarns are discretized, and finally proposes a formula for calculating the stress concentration factor ϕ(m) at the crack tip
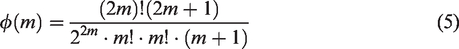
Therefore, the critical tearing stress can also be obtained

Orthotropic plate stress distribution model
In fracture mechanics, for the orthotropic plate, Whitney and Nuismer34 provide the stress distribution near the crack tip at the crack section, which is written as follows
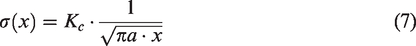
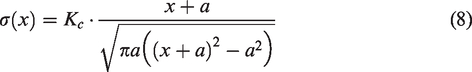
However, Equation (7) can only be applied to the range around the crack tip. In order to take the region far from the crack tip into consideration, Whitney and Nuismer34 adopt another stress distribution of the orthotropic plate at the crack section
Discussion
In the case of the theoretical models presented in the Thiele’s empirical formula, Exponential stress field theory, and Hedgepeth’s stress concentration factor model sections, the critical tearing stress and maximum tearing stress are both predicted and denoted by the subscripts “cr” and “max,” respectively. Based on the results of the single-edge notch tearing tests, Ck and n in Equation (2) and B in Equation (4) are obtained by fitting and are listed in Table 5.
The constants of Ck, n, and B
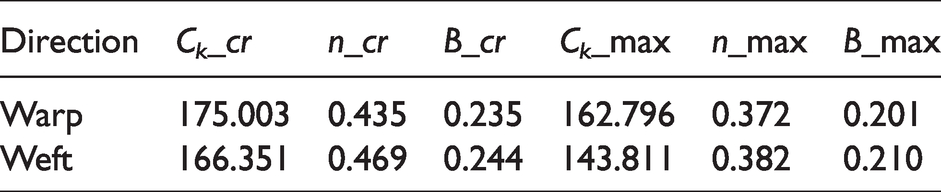
The tearing stress acquired from tests and models is presented in Figure 28, wherein the test tearing stress is acquired by dividing the tearing strength by the width of the samples in order to maintain consistency with the unit of the models. As can be observed from this figure, the results of Thiele’s empirical formula are close to the test results, while the results of the exponential stress field theory are in good agreement with the test results, except for the smallest crack. However, the results of Hedgepeth's stress concentration factor model deviate significantly.
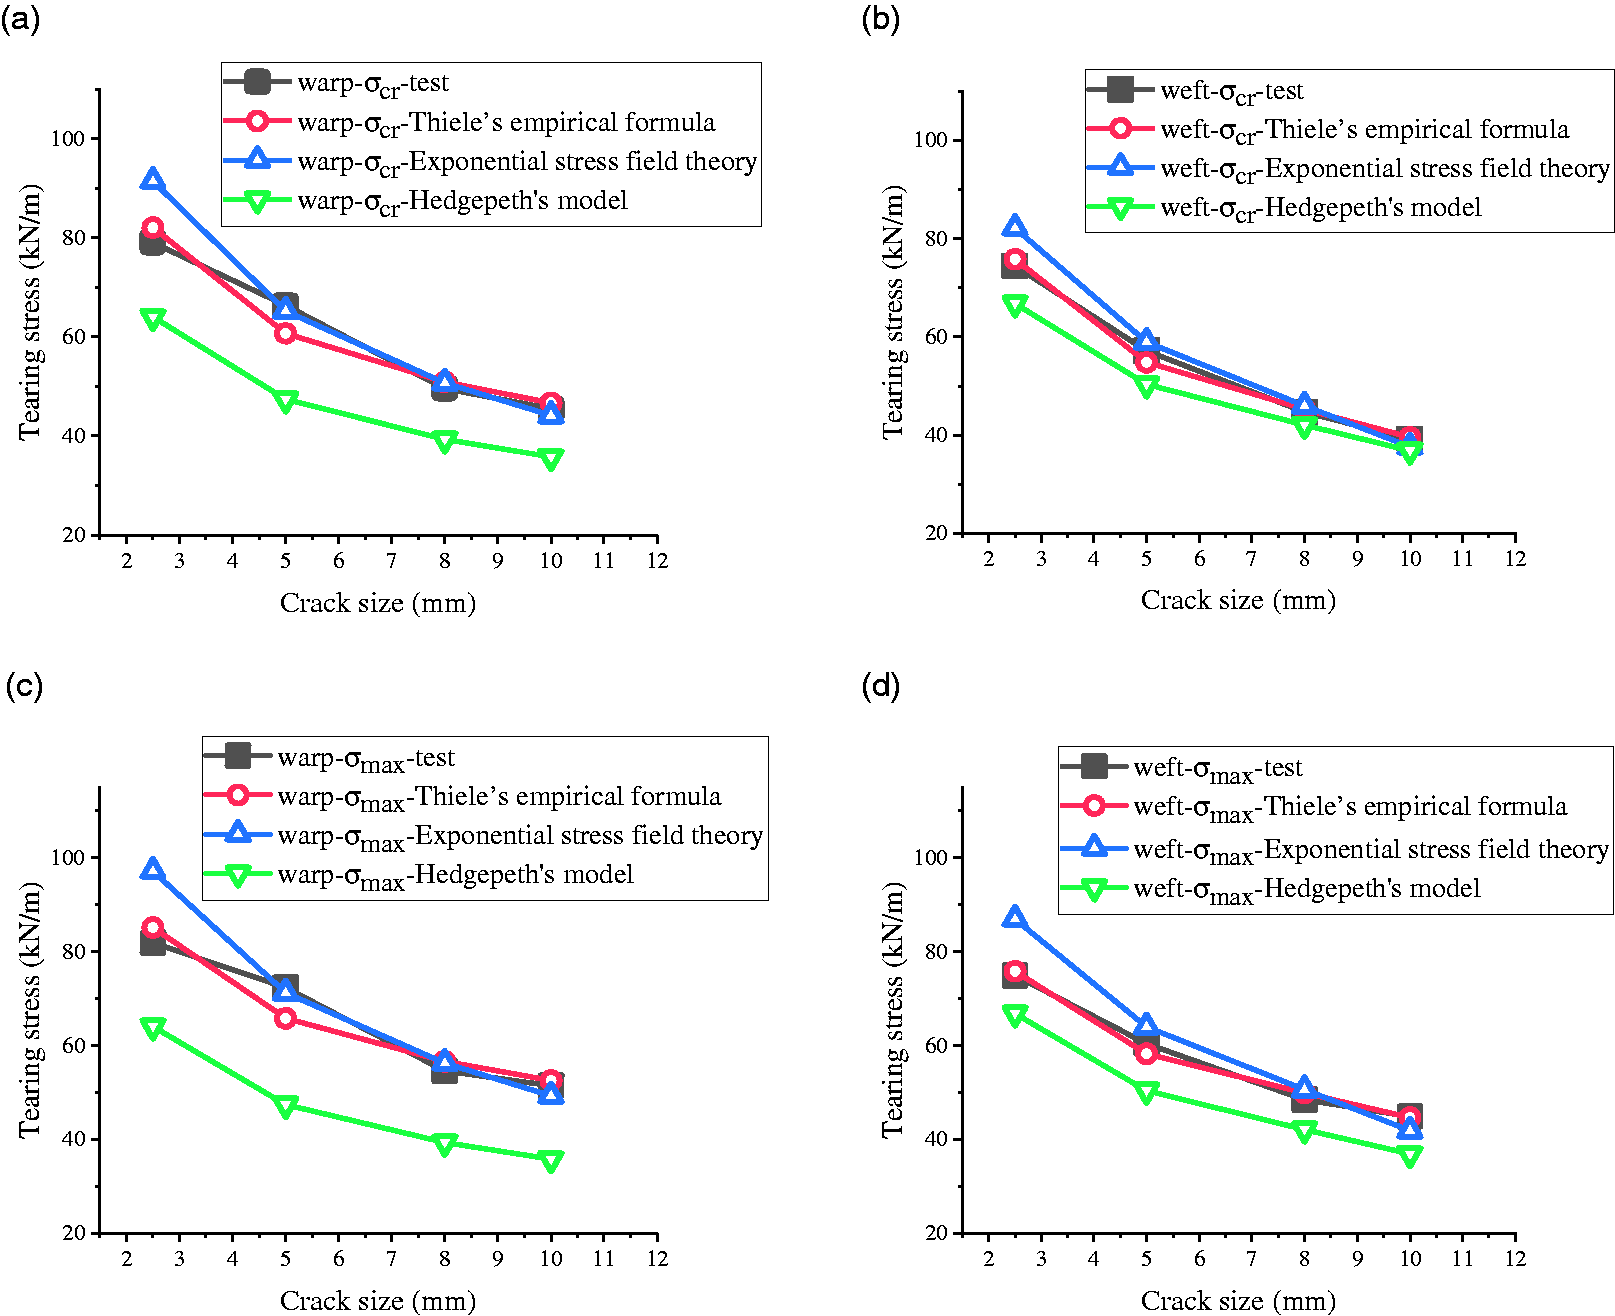
Comparison of the tearing strength acquired via tests and the models: (a) critical tearing strength in the warp direction; (b) critical tearing strength in the weft direction; (c) maximum tearing strength in the warp direction; (d) maximum tearing strength in the weft direction.
In the case of the model introduced in the Orthotropic plate stress distribution model section, for each crack, Kc is calculated based on the average value of the critical tearing strength of the three samples. Subsequently, the theoretical stress distribution at the crack section is calculated according to Equation (8). According to the strain distribution acquired using the DIC method and presented in Figure 21, the stress distribution at the crack section is obtained by converting the strain into stress using the uniaxial tensile stress–strain relationship shown in Figure 23. The differences between the theoretical and test results are presented in Figure 29. Overall, the theoretical stress distribution is in good agreement with the stress distribution acquired by the DIC method, except for the minimum crack in the warp direction. Therefore, the theoretical stress distribution model offers a good simulation in the majority of cases.
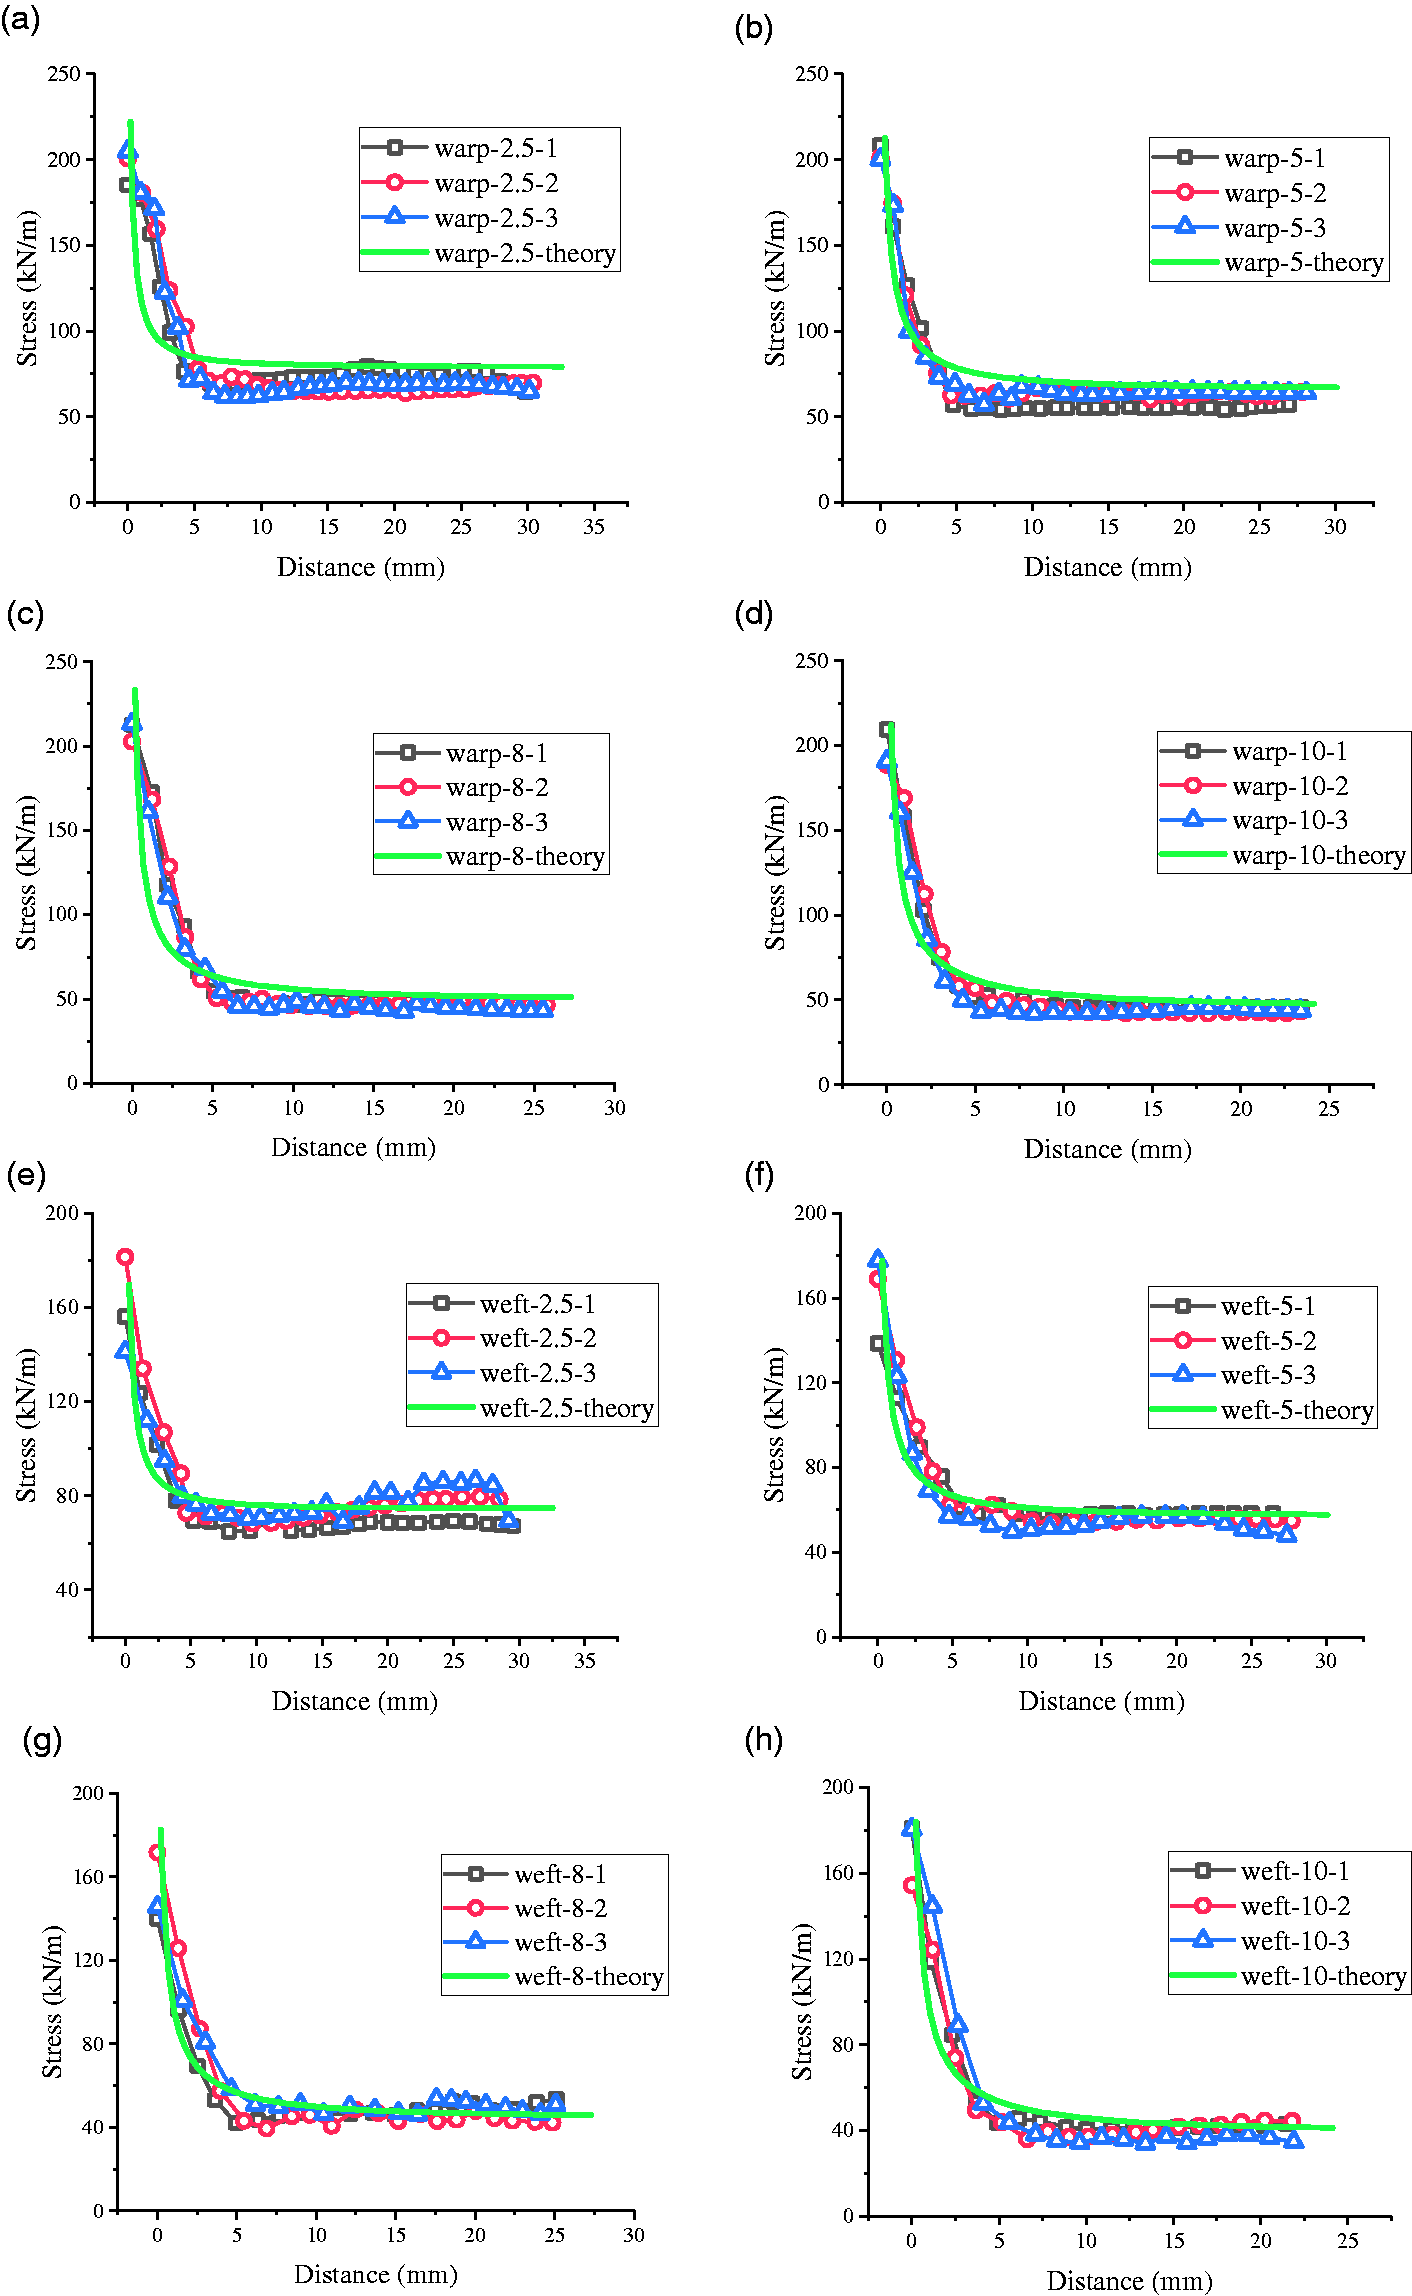
Comparison of the stress distribution acquired via tests and modeling in (a)–(d) warp specimens and (e)–(h) weft specimens.
Numerical simulation
For the numerical simulation of the fabric mechanical behaviors the mesoscopic model is often utilized in delicate studies, 18 , 36 which displays the individual and mutual properties of yarns and coatings. It is important and often offers elaborate results, but the acquisition of material and geometry parameters is complicated, and the calculations are often lengthy. In the currently used technical specifications of membrane structures, 10 , 11 , 37 the macroscopic orthotropic elastic continuum model is adopted to approximate the properties of membrane materials. Using this method, the calculation demand can be reduced, and accuracy can be guaranteed for engineering needs. Therefore, the macroscopic continuum model is adopted to simulate the single-edge notch tearing test. The feasibility of this modeling method can be verified, which can provide a reference for research on membrane materials and structures.
Calculations are performed using ABAQUS/Explicit software with the explicit algorithm. During the simulation, the convergence and stability of the results are guaranteed by adjusting the mesh density and time step. Although the macroscopic continuum model is adopted, the anisotropy and nonlinearity of the coated fabrics are still considered. The fabric material model offered by ABAQUS/Explicit is employed, and the nonlinear stress–strain relationships in the warp and weft directions are introduced as the material properties. In this study, the PTFE coated woven fabric is regarded as an anisotropic nonlinear elastic material, whose uniaxial tensile stress–strain curves in the warp and weft directions are regarded as simulation inputs, as shown in Figure 23. The shear modulus is obtained according to DG/TJ08-2019-2007, 8 for which the picture-frame test is adopted. This test method employs a hinge frame simulating a pure shear stress state of membrane materials. The shear modulus of the PTFE coated woven fabric adopted in this study is 82.68 MPa. This treatment integrates the individual and mutual effects of yarns and coatings, displaying the comprehensive properties of this material, and the inputs can be easily acquired according to the relevant technical specifications.10,37 In addition, compared to the mesoscopic model, the computational demand is smaller.
In the single-edge notch tearing test, owing to symmetry, half of the samples’ measuring size is established as the geometrical model. The mesh is constructed referring to He et al.,26 as shown in Figure 30. The mesh close to the crack tip is finer, and element size gradually increases to reduce the computational demand. To alleviate the singularity at the crack tip with the general finite element method employed, the mesh in the range of 4 × 2 quadrilateral elements at the crack tip is encrypted. For the encryption and transition parts, the triangle plane stress element (CPS3) is adopted, while the remaining parts are meshed using the quadrangle plane stress element (CPS4R). The bottom nodes are fixed according to different crack sizes, and displacements are applied to the top nodes.
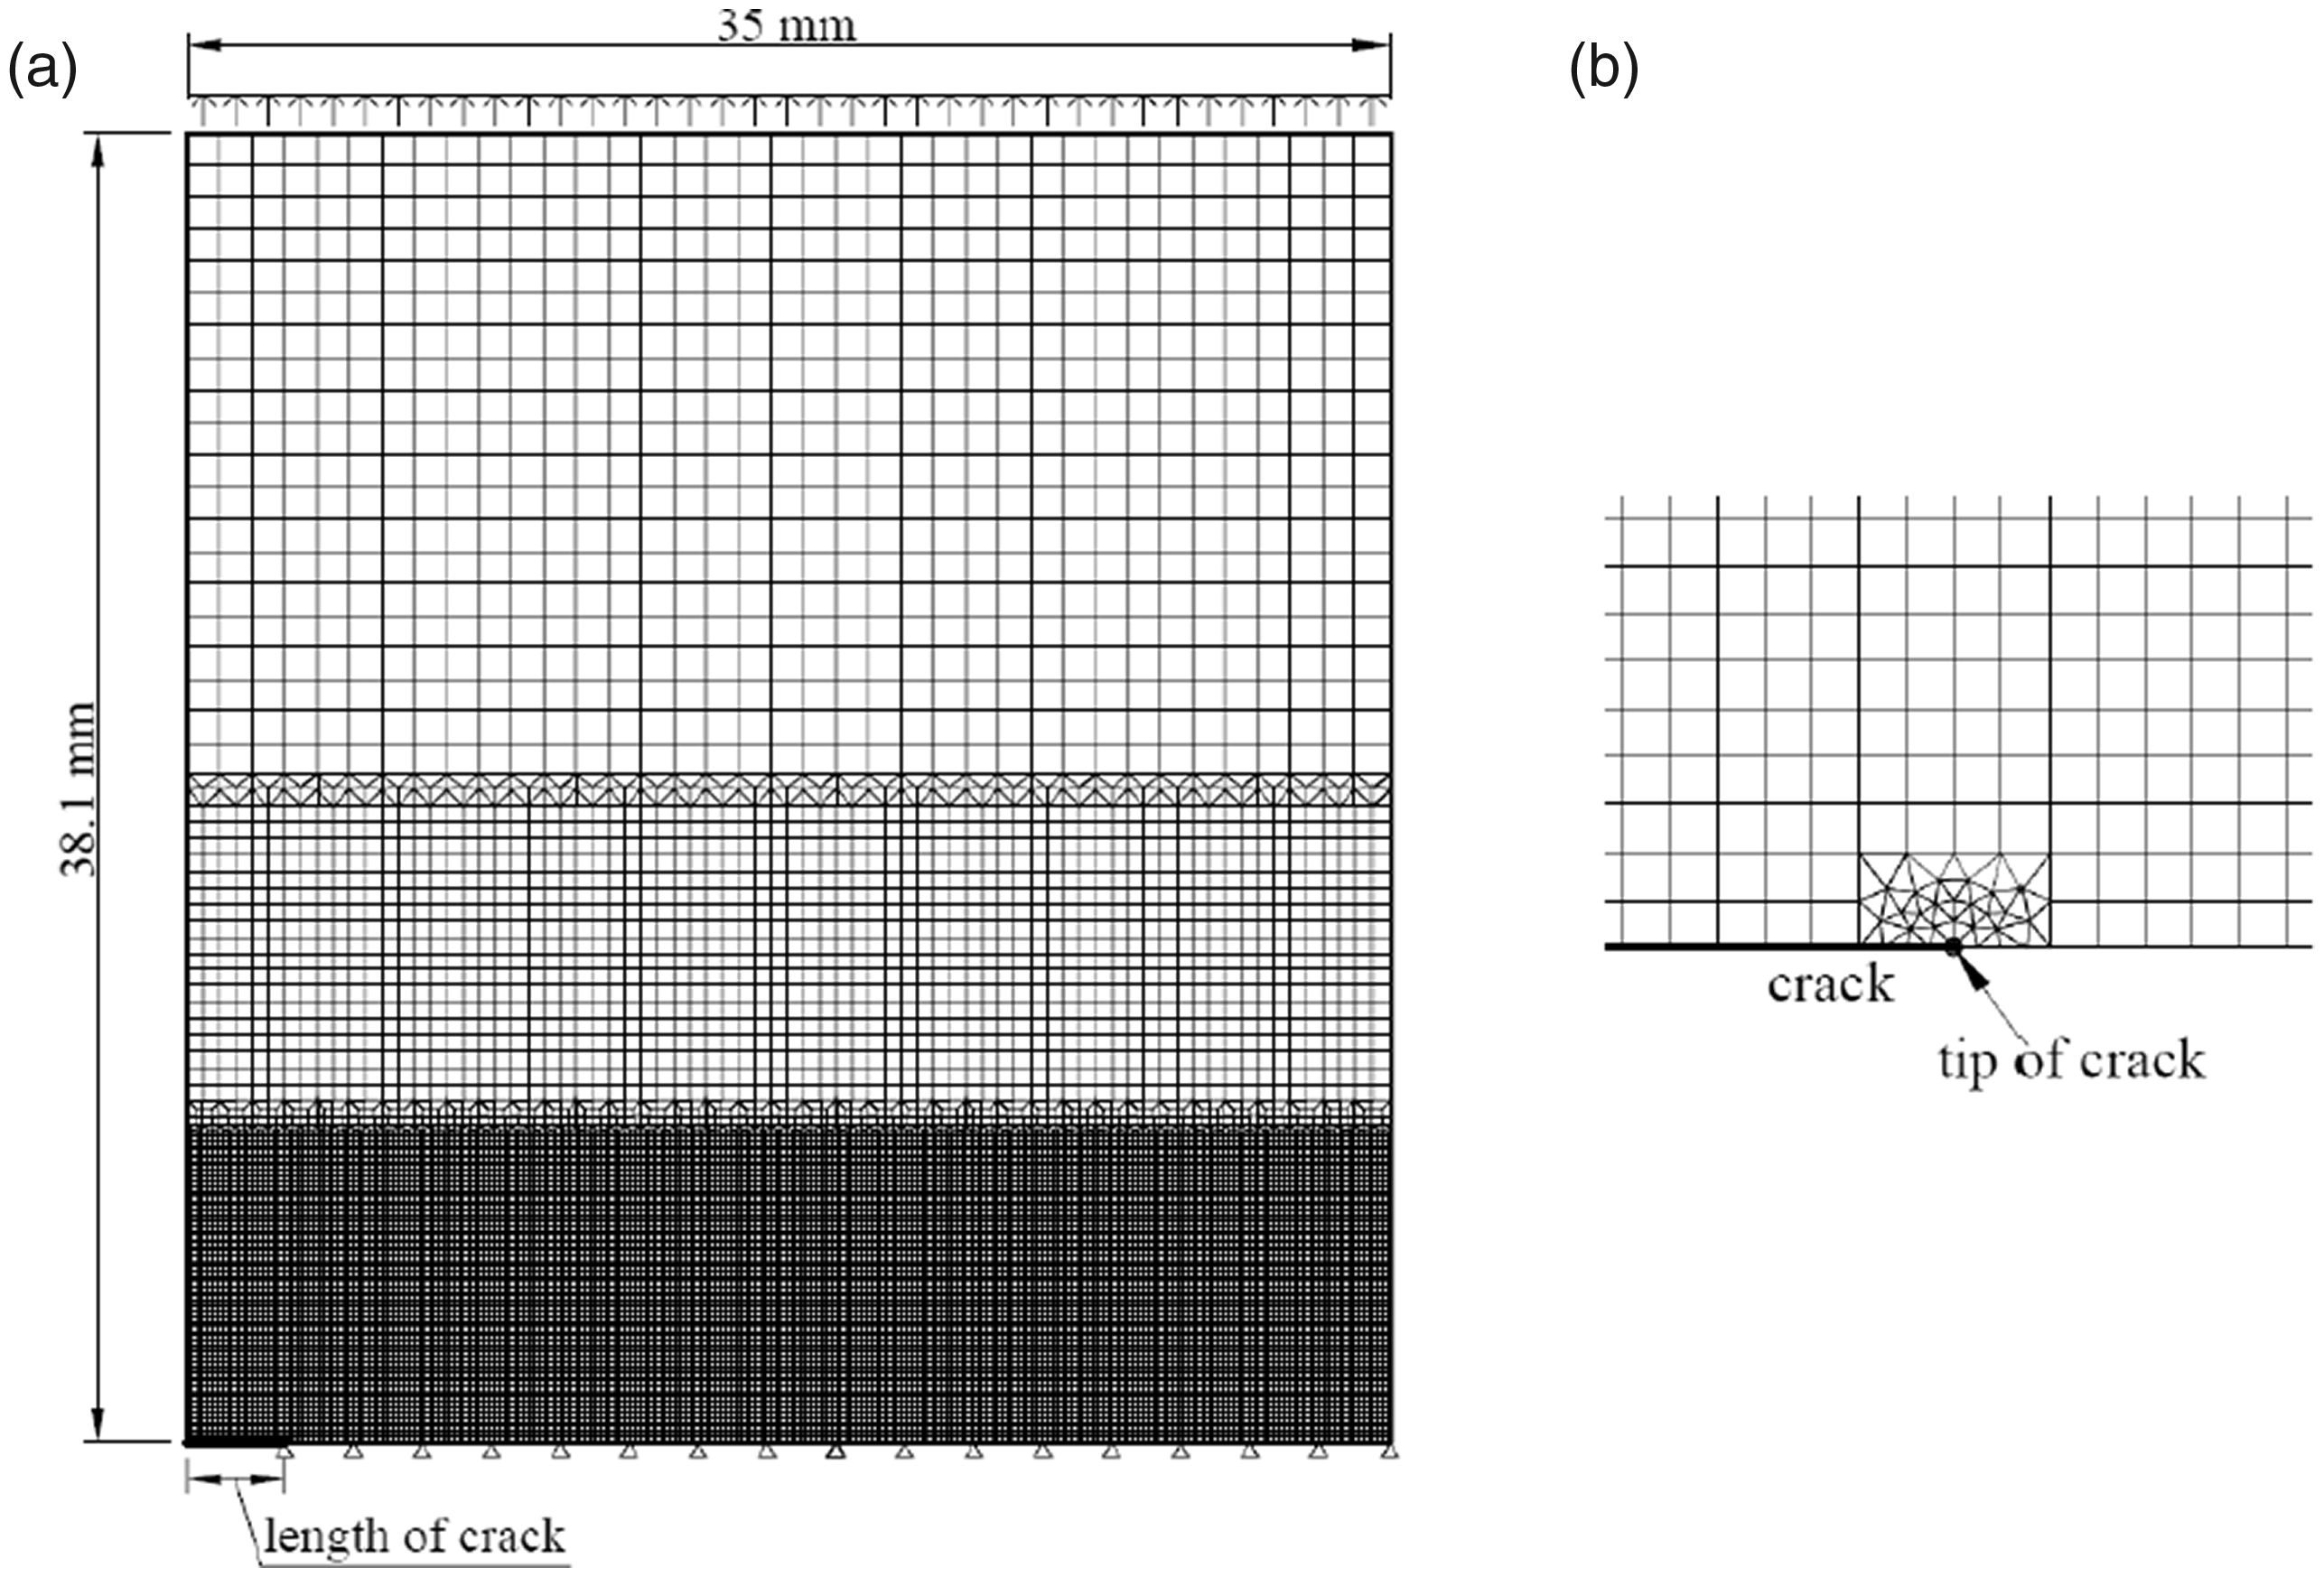
Finite element mesh of the single-edge notch tearing specimens in (a) the global mesh and (b) the encryption part at the crack tip.
When the general finite element method is adopted to calculate models with cracks, the singularity at the crack tip cannot be avoided, and the method can only calculate up to the critical tearing strength. However, regarding engineering needs, it is usually not desirable that tearing occurs in membrane structures. Current researches also commonly focus on the onset of tearing and critical tearing strength. 23 –25,30– 34 Therefore, although it is quite difficult to simulate the process after tearing initiates when adopting a macroscopic continuum model, attention is paid to the tearing initiation and the preceding stage, which are crucial and meaningful to real-life projects. For the onset of tearing, the stress criterion is adopted, and an assessment is introduced as the average stress inside different multiples of the yarn spacing from the crack tip reaches the uniaxial tensile strength. Under ideal conditions, based on the experimental observations, the onset of tearing is often accompanied with the breaking of the first yarn at the crack section. Therefore, the range within which the stress averages should be a yarn spacing. However, as the macroscopic continuum model is adopted and the material is regarded as a nonlinear elastic material, creep and plasticity of the material at high stress levels are not considered. So, the average stress range should be greater. Consequently, 0.5, 1, 1.5, and 2 times of the yarn spacing conditions are inspected. The corresponding critical tearing strength is shown in Figure 31, where the suffix “dis” refers to the yarn spacing, and the test results are listed for comparison. It is shown that the critical tearing strength corresponding to 1.5 times of the yarn spacing is closest to the test. Therefore, the onset of tearing is verified. Based on this, the load–displacement curves obtained by the test and simulation are shown in Figure 32, where only the stage before tearing initiates is presented, and “△” represents the critical tearing strength obtained by the two. From Figures 31 and 32, it is indicated that the results acquired by the simulation agree well with the test results in most cases.
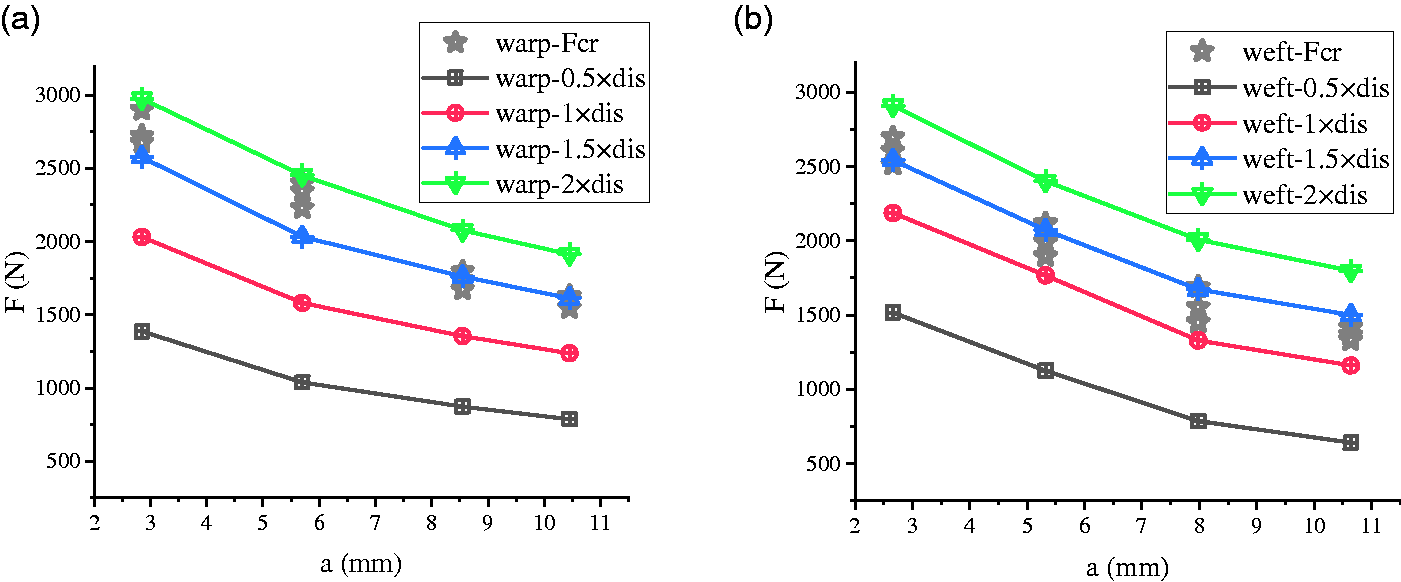
Comparison of Fcr acquired by the single-edge notch tearing test and simulation in (a) warp specimens and (b) weft specimens.
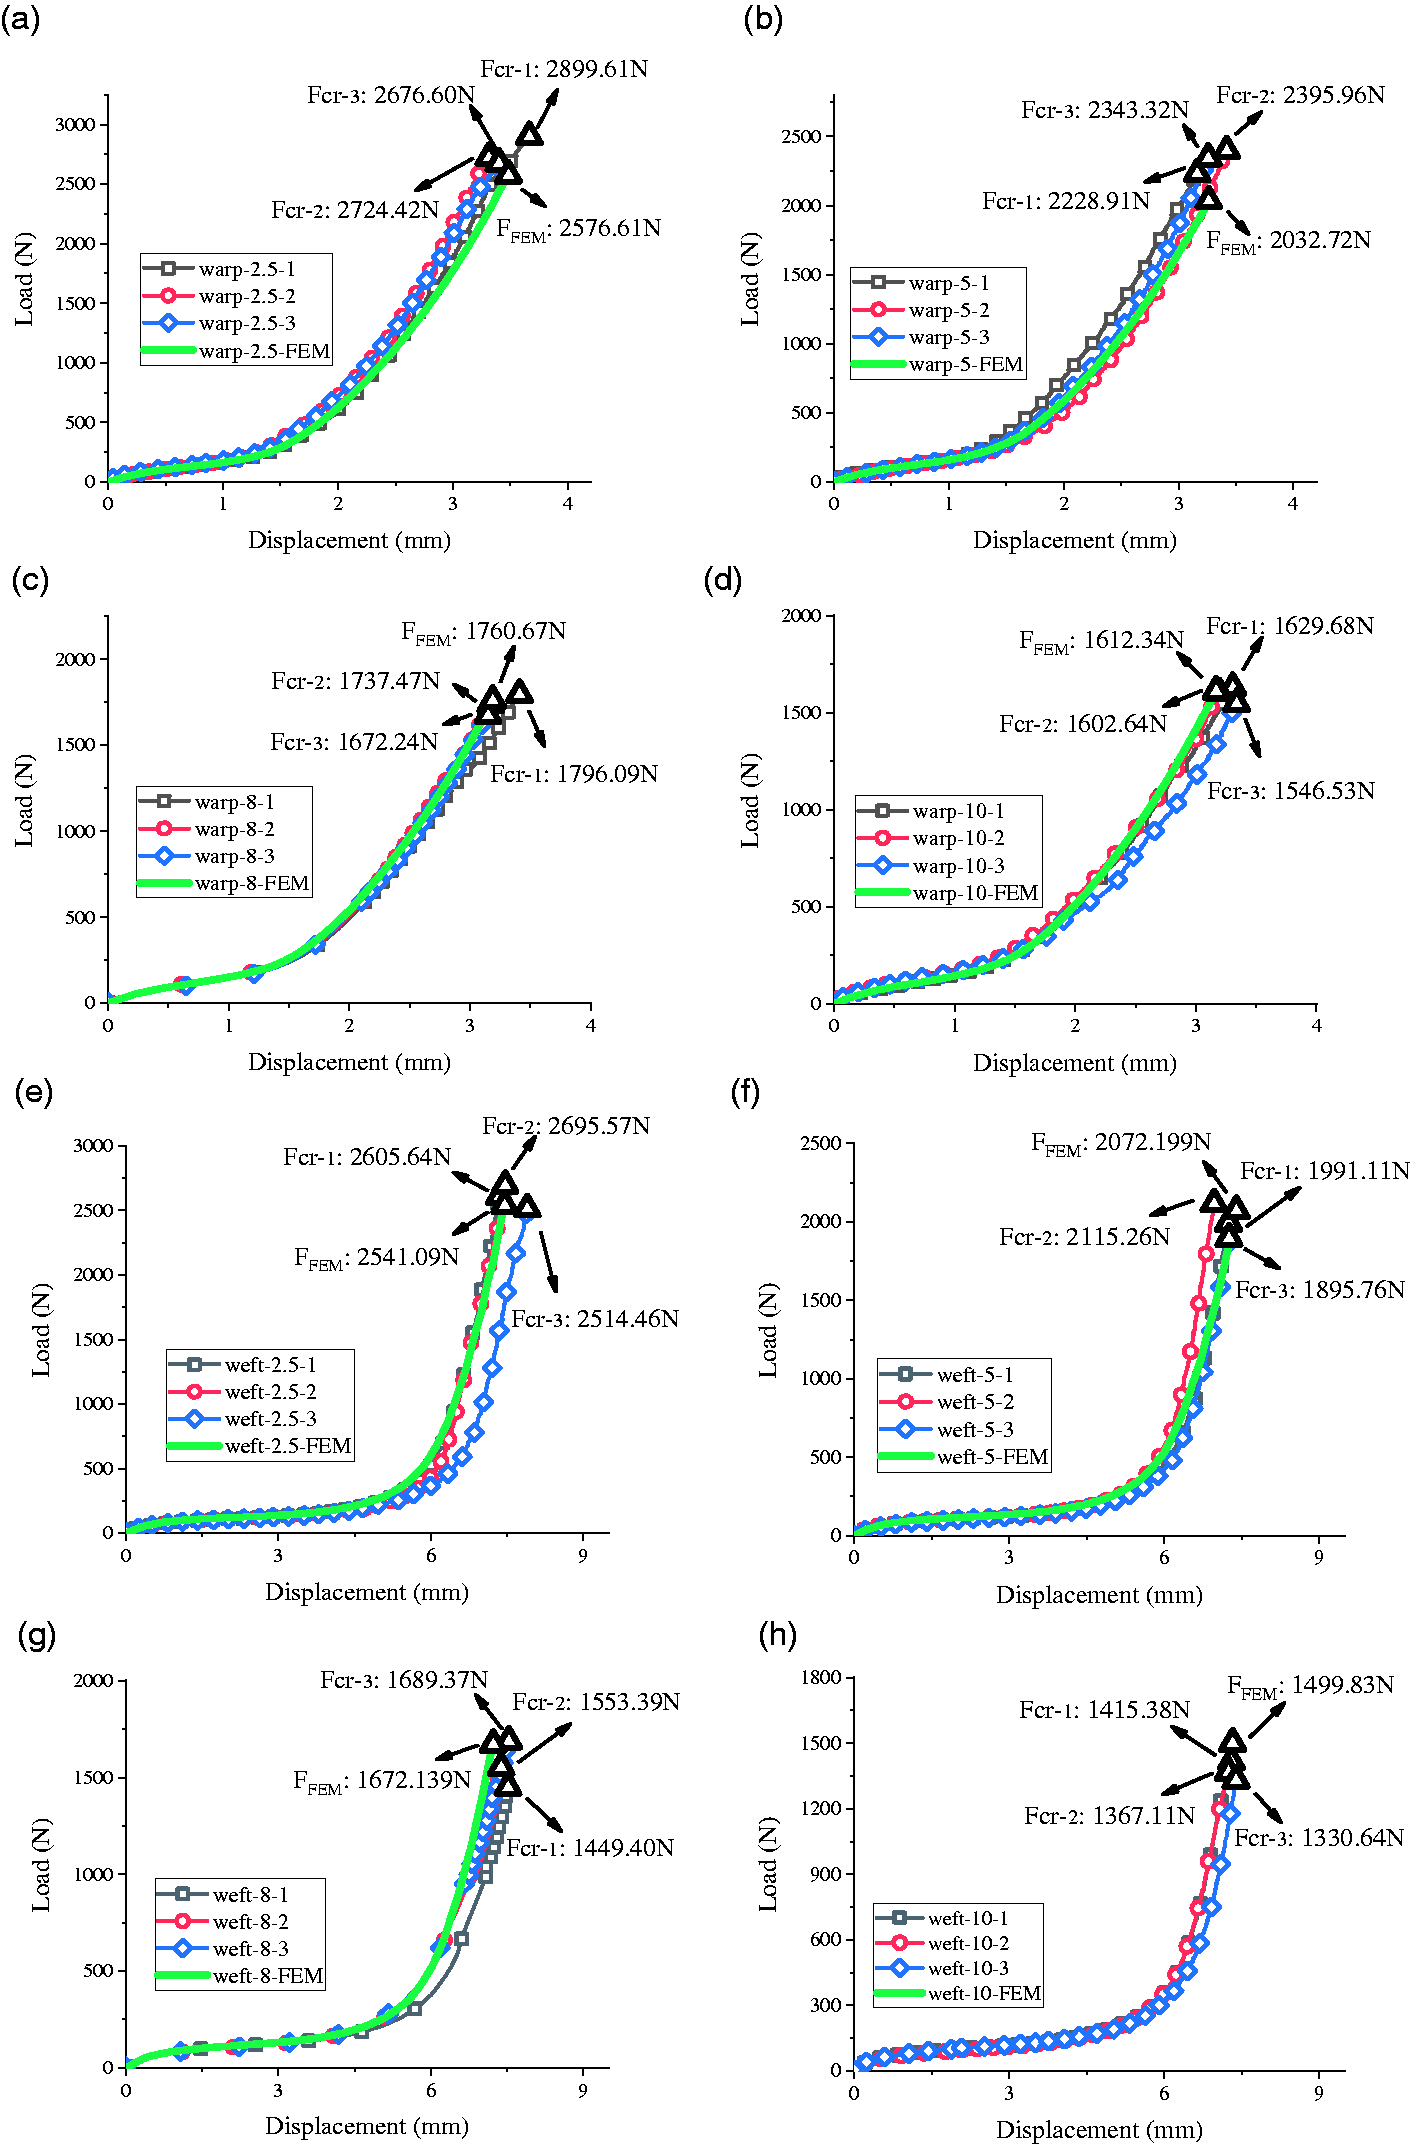
Load–displacement curves before the tearing initiates acquired by the single-edge notch tearing test and simulation in (a)–(d) warp specimens and (e)–(h) weft specimens. FEM: finite element method.
Conclusions
The following conclusions can be drawn.
The tearing process of the alternative-basic-angle trapezoidal tearing tests and single-edge notch tearing tests can be divided into three stages: the single-yarn breaking stage, successive breaking stage, and global failure stage. The three stages can be distinguished not only by photos, but also by different sections of the load–displacement curves. As the basic angle increases, three stages appear sequentially. The failure modes of the two tearing methods include three parts corresponding to the three stages of the tearing process: the single-yarn breaking part, successive breaking part, and global failure part. In the case of the former two parts, tearing propagates along the crack, and they can be distinguished by the shapes of the load–displacement curves. In the last part, the tearing propagates at an incline towards the crack. As the basic angle increases, three parts appear sequentially. The critical basic angles in the warp and weft directions when the failure mode transfers are different. The tearing strength is recorded and analyzed. It decreases with an increase in the crack size in the single-edge notch tearing tests. With an increase in the basic angle, the tearing strength increases and the warp tearing strength increases beyond the weft tearing strength because the dominant influencing factor changes from the breaking elongation to the tensile strength. The relationship between the tearing process and tearing strength is explained. The single-yarn breaking stage is a process in which the tearing strength increases, the appearance of the successive breaking stage is accompanied by the occurrence of the maximum tearing strength, and the global failure stage occurs with a rapid decline in the tearing strength. Therefore, with the increase in the crack size, the shape of the load–displacement curves varies and the ratio Fmax/Fcr increases. Further study on the single-edge notch tearing tests of the PTFE coated fabric is conducted. DIC equipment is used to observe the strain distribution at the crack section when tearing initiates and extends, and the reason why the tearing strength of PTFE coated fabrics still increases after the tearing initiates is clarified. Subsequently, the applications of four theoretical models are investigated. It is concluded that the results of Thiele’s empirical formula, exponential stress field theory, and theoretical stress distribution are in good agreement with the test results, especially Thiele’s empirical formula. Furthermore, a numerical simulation is conducted. The load–displacement curves obtained by the simulation agree well with those of the test before the tearing initiates; the critical tearing strength acquired by the two is close. These results provide the basic data and work for future studies.
Footnotes
Declaration of conflicting interests
The authors declared no potential conflicts of interest with respect to the research, authorship, and/or publication of this article.
Funding
The authors received no financial support for the research, authorship, and/or publication of this article.