






Abstract
Comfort is a key feature of any clothing that relates significantly to softness of the fiber, yarn and fabric from which is it constructed. A known softness assessment method for fibers is the resistance to compression test. This traditional test only provides a single force value for the resistance of a loose fiber sample using a fixed mass under compression. In this research, a modified resistance to compression test was introduced to show the effects of repeated compression, providing more information about the softness and resilience of selected fibers. Three different natural fiber types, including wool, cotton and alpaca were compared using this new approach. The results showed compression profiles were quite different for different fiber types as well as for the same fibers with different diameters. While the diameters of the wool and alpaca samples were similar (18.5 μm), the modified resistance to compression values were significantly higher for wool (with a peak value at 9.5 kPa compared to 2.1 kPa for alpaca). Cotton was different from wool and alpaca but showed a similar modified resistance to compression value (10.4 kPa) to wool. During cycles of compression, modified resistance to compression peak values decreased slightly and then tended to be constant. Even though the structures of wool, cotton and alpaca were quite different, there was no significant difference in the magnitude of decline in modified resistance to compression peak values. This means that the modified resistance to compression test is able to provide additional information on the resilience characteristics of different natural fibers, and can reveal the resistance behavior of fiber samples during cyclic compression.
Natural fibers are still consumed in large volumes by the textile industry. Many consumers prefer textile products made from natural fibers because they are perceived to be more sustainable and environmentally friendly than synthetic fibers. Also, natural fibers are preferred for their superior comfort performance over synthetic fibers,1–3 for example, softness, resilience and breathability. A large amount of research has explored the measurement and categorization of the comfort properties of natural fibers.
Long-term research reveals clothing comfort is determined by emotive feelings, which are the reflection of physiological, psychological and physical harmony in the environment. 4 In general, clothing comfort can be classified into aesthetic, thermophysiological and tactile comfort5,6 factors, the last one of which has attracted much attention from textile experts. Early research revealed the relationship between subjective tactile rankings and fabric mechanical deformation, which led to objective assessment systems for fabric softness.7–9 For example, research has shown that softness is closely associated with a number of fiber properties, including fiber diameter,10–12 fiber crimp (curvature),13–16 scale morphology17–19 and bending rigidity.20,21 Therefore, studying and characterizing fiber softness is important.
Traditionally, handle has been assessed by subjective comfort evaluation. 22 In evaluating fabric softness by human sensory ability, manufacturers, retailers and consumers assess fiber softness by touching, compressing, rubbing and squeezing the fabric and/or garment. 23 The softer the handle, the better the comfort of the textiles. This subjective evaluation combines the effect of fiber/fabric characteristics, such as surface roughness, bending rigidity, compressibility, resilience, extensibility and so on. 17 It is reasonable to presume that fiber/fabric is softer if it is easier to compress and has a smooth surface and lower bending rigidity. Based on this understanding, researchers have focused on measuring the resistance to compression of loose fiber bundles to determine a measure of a fiber’s ‘comfort’ or bulkiness ahead of it being converted into yarn and fabric. The general method of measuring a fiber’s resistance to compression (RtC) is to employ a cylinder and piston method utilizing a consistent cylinder volume and sample mass. Early measurements were done, using systems with different cylinders and pistons.24–26 However, when the Australian standard AS 3535-1988 was issued, a standard methodology was introduced and developed as the Commonwealth Scientific and Industrial Research Organization (CSIRO) compressibility tester (Figure 1(a)). After it had been demonstrated that wool with greater RtC value generally has a harsher handle,14,27 this instrument was used to grade the softness of Australian wool. The measurement reflects the effect of fiber crimp, bending rigidity and surface morphology on wool fiber softness. Even though the RtC measurement has been used in the wool industry, some research suggested that this type of evaluation was not applicable to low-crimp animal fibers, such as alpaca. 18 Moreover, as only one single compression value is typically obtained from each test by the traditional RtC test, understanding of the relationship between the softness of natural fibers and their properties is limited. In order to understand comprehensively how fiber samples behave during the compression process, and how the RtC values change in the case of repeated compression, it is necessary to improve the current RtC test method. Extending the test in this way provides an opportunity to understand fiber softness and other characteristics further. In this study, a new test rig (Figure 1(b)) was designed to compare the difference in RtC behavior between wool and alpaca fibers. Cotton, without crimp, was also measured. This work also explored the reliability of this measurement method.

Traditional resistance to compression (RtC) test instrument (a) and the modified resistance to compression (RtCN) test rig (b).
Experimental
Materials
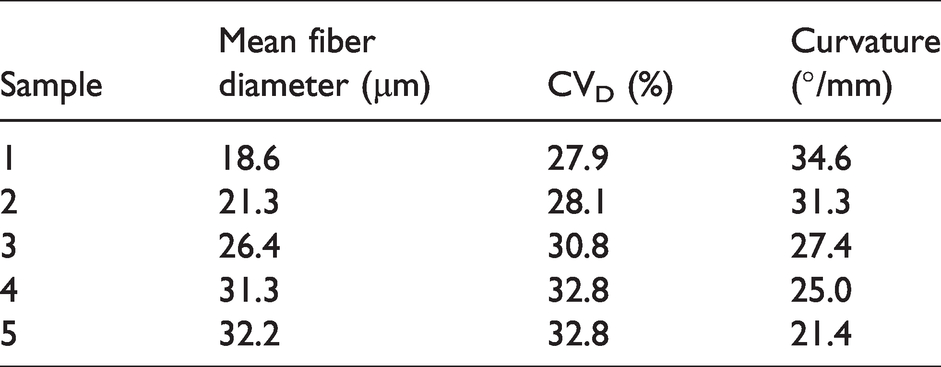
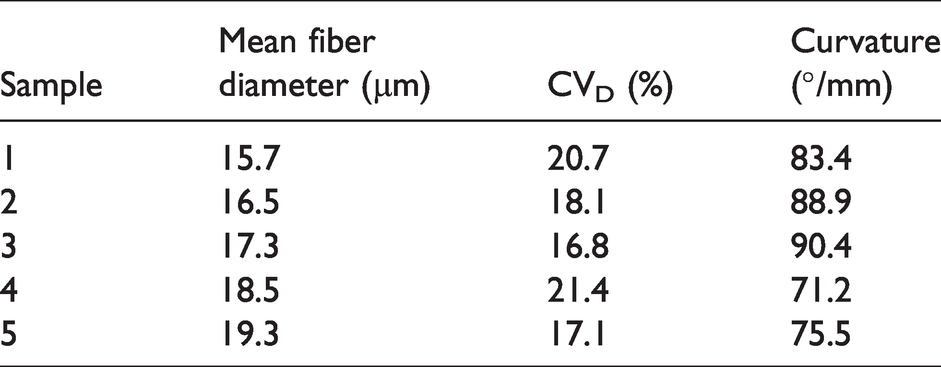
Different fiber samples were selected for examination including merino wool and huacaya alpaca sourced from Australia, and cotton samples from seven different countries including Australia. Five wool fiber groups (with mean diameters ranging between 15.7 μm and 19.3 μm), and the same number of alpaca fiber groups (with mean diameters ranging between 18.6 μm and 32.2 μm) belonging to different grades of fineness (fine, medium and strong) were collected. The alpaca fiber samples, with an average length of 80–120 mm were randomly collected from alpaca tops in mills. Raw cotton from seven different countries with similar US Department of Agriculture (USDA) color and trash grades, that is, USDA color grade 21 with a 2 leaf, and fiber ribbon widths as measured by a Cottonscope instrument (BSC Electronics, Australia), ranging between 14.6 μm and 15.4 μm, were selected. The specifications for fiber samples are summarized in Tables 1–3 below.
Fiber diameter and curvature of alpaca samples
Fiber diameter and curvature of wool samples
Fiber fineness and maturity of cotton samples
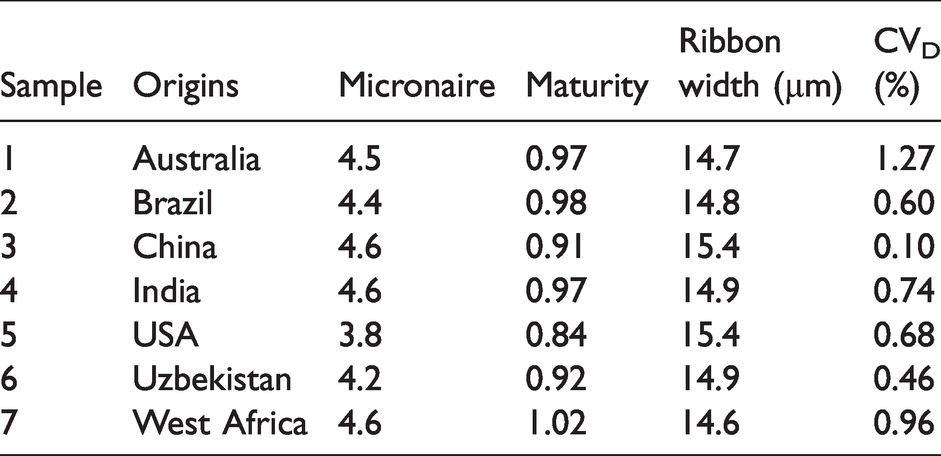
The merino wool had a lower mean fiber diameter (MFD) and coefficient of variation in diameter (CVD) than alpaca – see Table 1 and Table 2. The curvature of wool samples was also greater than the alpaca. Cross-sectional cotton values for each sample are listed in Table 3. Essentially, they are all very similar in terms of intrinsic fineness (ribbon width). However, the maturity or cell wall thickening values differ, particularly for the US cotton.
Methodology
The working principle of the existing RtC test instrument is shown in Figure 2(a). A fixed mass bundle of fiber (2.500 ± 0.001 g) was rolled and put into the cylinder. The piston (Φ49 mm) then, driven by air pressure, compressed the sample with a default force to the fixed volume (Φ50 mm and 12 mm) (as per AS 3535-1988) and was held for 2 s. The compression force was then measured by a load cell at the bottom of the cylinder and recorded as the RtC value. The new modified resistance to compression (RtCN) measurement method adopted a test rig (Figure 2(b)) that can be attached to the load cell mounted on the upper crosshead of a constant rate of extension instrument (Instron, USA). The main difference between the old RtC instrument and the adapted RtCN device was the positioning of the load cell. The new method had the load cell placed between the piston and the moving upper grip of the constant rate of extension machine. This difference led to the modified principle that applied load versus piston movement (resilience) can be recorded during compression, and the rate of compression can also be controlled. In this work, the compression testing speed was set as 100 mm/min. A cyclic compression test was also done on the same sample providing additional information. Meanwhile, the change of RtCN value along compression displacement (and time) was recorded in the experiment, in which the compression processes was repeated 12 times.

Simplified work principle of the resistance to compression (RtC) test (a); simplified work principle of the modified resistance to compression (RtCN) test (b).
In preparation for testing, wool and alpaca samples were scoured under the same conditions as shown in Figure 3 and dried in air. Cotton samples were randomly selected from the cotton bale and mixed up manually. All samples were then opened and randomly allocated manually in the standard conditioned laboratory (temperature 20 ± 2°C, humidity 65 ± 2%) for 24 h before preparation for testing. Three specimens were randomly selected from conditioned samples, as a fiber group. Each specimen was weighed to 2.500 ± 0.001 g using an analytical balance (Mettler Toledo, Switzerland).

Wool scouring recipe and process.
After RtCN measurement, each wool and alpaca test sample was measured for fiber diameter and curvature using an optical fiber diameter analyzer (OFDA) 2000 (BSC Electronics, Australia). A bundle of fibers was randomly selected from a bulk of scoured samples and cut into short snippets (approximately 2 mm in length) by using a guillotine, and then spread over a 70 mm glass slide using the OFDA snippet randomizer. The basic information on cotton fiber samples, including micronaire, maturity and ribbon width values, was directly obtained from the Cottonscope instrument (BSC Electronics, Australia). Referring to the ASTM draft standard (WK61219), 50.0 ± 0.1 mg of loose cotton fibers were cut into more than 20,000 snippets of no greater than 1 mm using a guillotine. These snippets were dropped into a water with surfactant-filled bowl and dispersed by a magnetic stirrer so that they spread randomly across the instrument’s camera viewing port.
Images of fiber surface morphology were obtained using a Supra 55VP scanning electron microscope (Carl Zeiss AG, Germany) after they were treated with Au coating by a sputter coater (Leica EM ACE600, Australia). In the coating, three types of fibers were fixed in a straight line on three specialized holders for coating separately, while the tilted mode was chosen, so that the surface of the fiber samples was fully coated. These operations could improve the visibility of small features.
In addition, to investigate the reliability of the RtCN measurement method, 20 wool samples of fixed mass at 2.50 ± 0.001 g were compressed 10 times separately by using the new test rig. For each sample, we collected 10 RtCN peak values from which one, five and 10 peak values were selected and gathered to analyze.
Results and discussion
Different performance of alpaca, cotton and wool under compression
The three distinct curves presented in Figure 4(a) illustrate the compression curves for cotton, wool and alpaca measured using the RtCN method. The curves displayed are for 18.5 µm wool, 18.6 µm alpaca and 14.6 µm cotton. The differences between the curves for the three fiber types indicate that the method can differentiate among different fiber types. Meanwhile, the RtCN curves of these three types of fibers all show that the compression stroke follows an exponential increase in pressure, and that there is a hysteresis between the compression and release strokes.

Modified resistance to compression (RtCN) curves for alpaca, cotton and wool in the first compression cycle (a) and resistance to compression (RtC) values for alpaca, cotton and wool (b).
The cotton has the characteristic rapid increase in load caused by the less fluffy property of the fiber when compared with wool fibers. Cotton has a higher density (1.52 g/cc) 28 than wool (1.314 g/cc). 29 For a fixed mass (2.5 g), there is therefore 15% less volume of cotton. Moreover, the cotton volume is not maximized because the cross-sectional shape of cotton is not circular. The poor resilience of the cotton is also evident in the rapid drop off in the load during the piston withdrawal stage of the test. The better resilient properties of the wool mean that although the curve is similar to cotton, the load comes on earlier but does not get as high during the compression stroke and is slower to drop off during the withdrawal stroke. Cotton has a shorter fiber length than wool and alpaca, but the stacking effect of shorter fibers may contribute to the fluffy volume for samples of fixed mass. The cross-sectional and longitudinal shape of cotton is also characterized by convolutions and folds (Figure 5), giving an uneven fiber surface that can increase the free compression space between fibers. In contrast, the alpaca fibers have less curvature than those of wool and are more aligned, forming a more compact structure. Therefore, the piston of the test rig can touch and compress cotton sooner than alpaca. The significant morphological and structural differences between wool and alpaca mean that there is a large difference between the two fiber samples measured. This is mainly related to the difference in the scale and curvature (shown in Figures 5 and 6) and is similar to that seen by Liu et al. 18

The morphology of alpaca (a), cotton (b) and wool (c) fiber.

Fiber profiles of wool (left one, curvature 58–125°/mm), cotton (in the middle) and alpaca (right one, curvature 15–50°/mm). 30
The extra information in the compression and relaxation parts of the RtCN test enabled differentiation between the cotton and wool samples. With the traditional RtC method these would have a similar value (10.4 kPa and 9.5 kPa, respectively, in Figure 4(b)) and not be discernible in difference. The compression and relaxation strokes enabled elastic properties of the fiber to be evaluated, which is additional to the peak force alone.
Wool and alpaca samples with different MFDs were compared using the novel test rig, as well as cotton fibers from different countries. Figure 7(a and c) shows fiber diameter is an important factor to RtCN for wool and alpaca, and the same type of fiber samples with different MFDs are different in performance in compression. For the wool fiber samples the RtCN peak force had a positive relationship with the fiber diameter (Figure 7(a)). There was one deviation from this with the 18.5 µm fiber sample, which showed the lowest peak force. This resulted from fiber curvature negatively affecting the RtCN value, as the 18.5 µm wool sample measured had the smallest curvature (Table 2). The explanation also applies to the different performance of alpaca samples under compression (Figure 7(c)). Comparing the range of RtCN values and MFDs for wool and alpaca, the huge difference in fiber curvature between them resulted in alpaca being easier to compress than wool and softer even when the alpaca fiber was much coarser in diameter.

Modified resistance to compression (RtCN) curves for wool (a), cotton (b) and alpaca (c) samples with different mean fiber diameter (MFD) in the first compression cycle. The number in the legend of the graphs means MFD (microns) for wool and alpaca. The colours denote the means of RtCN peak values for each fiber sample.
Cottons from USA and Uzbekistan have lower micronaire values than those of samples from other countries (Table 3). However, these two types of cotton samples are quite different in RtCN shown in Figure 7(b). The RtCN peak value of Uzbekistan cotton samples in the first compression was only around 9 kPa, compared with approximately 11 kPa for cotton samples from the USA. Australian, Brazilian and Chinese grown cottons had similar performance on the RtCN (approximately 10.5 kPa), while cotton samples from West Africa had the highest RtCN peak values. Indian cotton was the only group with a higher micronaire having a RtCN peak value below 10 kPa. In the textile industry, the micronaire value represents the quality grade of cotton, significantly affecting the performance of cotton fibers in cotton processing and yarn manufacture. Cotton fibers with higher micronaire values are coarser and more mature, which should give rise to higher RtCN values in theory. The RtCN peak value of cotton samples from West Africa had the highest micronaire value at 4.6. However, USA cotton samples achieved the second highest RtCN peak value even though the micronaire value was the smallest. This means other features such as ribbon width and maturity could affect the resistance behavior of cotton to compression. The quality grade in the cotton evaluation system is not related to RtCN values. The comparison in Figure 6(a) and Figure 7(b) shows that cotton samples from seven countries can be compressed as easily as wool samples, with fiber diameters ranging from 15 to 19 microns.
Comparative study of the changes of RtCN values in compression cycles
In the cyclic compression test, each sample has been compressed 12 times and the changes in RtCN values against time for wool, cotton and alpaca are shown in Figure 8(a). The different performance between alpaca with wool and cotton under compression was identical to the discussion above. The RtCN values for three types of fibers experienced similar cyclic changes after repeated compression, although the RtCN peak values became lower with each subsequent compression (time) but were approaching a constant value by the end of the 12 cycles (Figure 8(b)).

(a) Typical modified resistance to compression (RtCN) curves in stack for alpaca, cotton and wool during cyclic compression (y0: the starting point in the Y axis for cotton (y0 = 2) and wool (y0 = 12) samples separately). (b) Typical change in RtCN peak values of alpaca, cotton and wool during cyclic compression.
The reduction of peak load over time would come about from fiber movement and realignment during the repeated test conditions. In the first compression process, loose samples allowed fibers to move and realign to a large extent, until they formed a compact structure. Even if the volume of the sample became fluffy during the relaxation process, fiber samples were stable because of aligned fibers. This is the reason the reduction in peak load between the first profile of RtCN curves and the second profile is larger than that during the other 11 cycles. This information from the RtCN test method may be used to reveal the shape stability of natural fibers after compression.
From Figure 8(b), the decrease in the RtCN peak values for wool (from 10.4 to 8.7 kPa) and cotton (from 9.5 to 8.1 kPa) was significant along compression cycles, while there was no big change in the figures for alpaca (from 2.1 to 1.8 kPa). This difference was mainly caused by the different resilience properties of these fibers. According to the analysis above, fibers were dynamic in compression. Wool fibers were stiffer and more crimped than alpaca fibers, having more impact on the unit of RtCN peak values after they moved and became aligned during compression. Short and twisted fibers in the cotton sample contributed to fluffier volume and higher RtCN peak values than the figures for alpaca samples. These disordered cotton fibers were realigned during compression, significantly reducing the RtCN peak value. This is also the reason the RtCN peak values of cotton dropped off at the same rate as the wool even though fiber lengths and resilience properties were so different.
To analyze the decline in RtCN peak values, two concepts, first reduction (FR) ratio and complete reduction (CR) ratio, are introduced, and they are defined as below:


Based on the results in Figure 9(a,b and c), there may be a positive correlation between the FR ratio and the CR ratio for the same sample of fiber diameter. In this case, the FR ratio could be used to predict the different change trends of RtCN peak values for the same samples with different fiber diameters after the last compression completes. It is noticeable that the CR ratio for wool seemed to be positively related to the fiber diameter, while the values for cotton and alpaca samples remained stable at approximately 16%. As to comparing the decline of RtCN peak values for different samples, the FR ratio is not a proper indicator to the CR ratio of RtCN peak values. According to Figure 9(d), the mean of the CR ratio for wool was slightly lower than that of cotton and alpaca, compared with the mean of the FR ratio for wool equalling the ratio value for cotton and less than that for alpaca. However, there was no significant difference in the statistical analysis of mean FR ratios for these three samples, as well as mean CR ratios. The decline trends of RtCN peak values were similar for wool, cotton and alpaca. This means that the drop off of RtCN peak values over time was mainly related to the movement and realignment of fibers regardless of fiber resilience properties. When studying the resilience properties of these three samples, the RtCN peak values should be stable after many compression cycles. The RtCN test method can achieve repeated testing for resistance to compression, removing the bias of one cycle of one sample tested in the traditional RtC test method.

The decline in modified resistance to compression (RtCN) peak values for (a) wool, (b) cotton and (c) alpaca; (d) comparison of decline of the peak values in these three types of samples. The first reduction ratio refers to the magnitude of decline of the peak value after the second compression; the complete reduction ratio represents the magnitude of decline of the peak value after the last compression.
The reliability and stability of the RtCN measurement method
A good measurement method should be both accurate and reliable. The variation in the measurement decreased when the RtCN peak value was taken from the last peak in a 10 cycle test when compared with the first (Figure 10). The RtCN values varied for every test due to the test method and wool samples. The stability and accuracy of the load cell and test rig during piston compressing wool samples had an important influence on test results, while the different distribution of fiber diameter and length for different samples in a group can also contribute to this difference for RtCN values. The CV% values are quite small, below 3%, even though the influence of wool sample preparation was not excluded. This indicated that results from the modified measurement method for RtCN were repeatable. The variation in measurement decreased from 2.32 to 1.94 CV%, when the value used was taken from the last compression cycle instead of the first (Figure 10). This means increasing compression cycles can improve the reliability of the measurement method.

Test reliability affected by compression cycles.
The changes in CV% of RtCN peak values against sample numbers in the first compression cycle were compared. The higher volumes of test samples corresponded to lower CV% values, meaning more reliable results for the RtCN measurement experiment. At the same time, Figure 11 showed that even if the number of samples involved in measurement was low (only three samples), this measurement method can achieve highly reliable test results, with CV% much lower than 20 as the threshold for a reliable test method in mathematic analysis. All this analytical evidence proves that this modified measurement method is accurate and reliable in terms of RtCN measurement.

Test reliability influenced by sample numbers.
Conclusion
In summary, the RtCN is able to describe the behavior of natural fiber samples during the cyclic compression process and provide additional information on the characteristics of different types of fibers. The differences in profiles for wool and alpaca in the first compression and relaxation process clearly reflect different crimp properties that affect the resistance of animal fibers to compression behavior. Wool fibers have higher curvature and scale height, leading to earlier compression and higher RtCN values. For cotton samples, the new measurement method indicated its similar performance to wool, but different resistance behavior during the compression process. This is caused by a particular resilience property contributed to by higher density, shorter fibers and special convolution structures that are different to wool and alpaca.
After compression in the first two cycles, the RtCN peak values for wool, cotton and alpaca declined to different extents. For the same type of fiber samples, the different decline in RtCN peak values after the second compression can predict the final relationship in the decline of peak values when the last compression finishes. The magnitude of decline in RtCN peak values for wool seems to be positively related to the fiber diameter. However, when comparing different samples, there is no significant difference in the decline ratio of RtCN peak values, meaning that rather than resilience properties, the movement and realignment of fibers mainly affect the drop in RtCN peak values over time. All these could be helpful to the resilience study of natural fibers.
Footnotes
Acknowledgements
The author(s) wish to acknowledge Graham Walters, Jim Gordon and the late Jim Watts for their great assistance with wool sampling for this work. The author(s) are also grateful to Zhigang Xie for making the test rig and Deakin Advanced Characterisation Facility (Adam Taylor and Andrew Sullivan) for technical support. This work was also supported in part by the ARC Research Hub for Future Fibers.
Declaration of conflicting interests
The author(s) declared no potential conflicts of interest with respect to the research, authorship, and/or publication of this article.
Funding
The author(s) received no financial support for the research, authorship, and/or publication of this article.
