
Abstract
The structure of nonwoven fabric has a great influence on the fabric properties, and the filtration performance of the fabric is determined by its pore structures and key parameters such as pore size, distribution and porosity, which should be described accurately and appropriately. However, at present problems exist in the methods of describing the three-dimensional structure of nonwovens, such as the high cost, slow speed and inaccurate model. This paper proposes a new method of reconstruction algorithm, inspired by the criss-cross internal structure of nonwovens. This nonwoven structure with a certain depth presents some implication of the processing information, which is similar to the formation of an anthill. The reconstructing processes are as follows. First, the multi-focused images of fibers are captured by the microscope and the images are then fused into a two-dimensional image. Second, the three-dimensional coordinate of the source point is calculated by the fiber segmentation and One-to-Many projection. Finally, the fiber axis is generated by connecting the source point according to the prescribed conditions, and then the closed three-dimensional surface is the three-dimensional path of a dynamic-radius sphere rolling along the fiber axis. The experiment results demonstrate that the proposed method can reconstruct the accurate structure of the nonwoven fabric and retain its vertical connection information, which is of great significance to the interception of harmful substances, the production and preparation of filter medium and the follow-up study of the filtration mechanism.
Keywords
The filtration properties of nonwoven fabric mainly depend on their three-dimensional (3D) network structure and high porosity. This structure comprises rich multidirectional bending channels, which can capture particles effectively while passing through airflow. The ability to characterize and also to control the structure is important but very challenging due to the complex nature of the structure. Previous research suggests that nonwoven air filter materials are applicable for healthcare protection.1–5 However, there is no reliable theory so far to describe the internal structure of nonwoven fabric accurately because of its complexity.6,7 The traditional method to analyze the structure of nonwoven fabric can be approximately characterized only by measuring its equivalent pore size.8–10 In order to describe the accurate structure of nonwoven fabric, Jeon et al. 11 and Soltani and Norouzi 12 analyzed the nonwovens by X-ray tomography of micro-computed tomography (CT) and then restored the 3D model to predict the tensile strength and sound absorption behavior of nonwoven fabrics.11,12 Venu et al. 13 and Axel et al. 14 took the successful implementation of serial sectioning and imaging of the materials embedded in polymeric resin by the digital volumetric imaging (DVI) microimager and then stacked the sectioning into a 3D model to analyze the 3D fiber orientation and density/porosity variations of fibrous materials, but these devices are expensive and time consuming.13,14 In this case, a relatively inexpensive optical microscope has been considered as one of the most suitable ways to characterize the fabric morphological propertie.15–17 Wang et al. 18 proposed a new image fusion technique of nonwoven fabric. The authors obtained multi-focus images by moving the microscope stage along the z-axis direction and then fused the images by calculating each pixel's maximum focus measure position. 18 However, this method can only focus on the two-dimensional (2D) information of the nonwoven fabric. Although the speed is fast, the depth information of the fibers in the nonwoven fabric is ignored, which is not enough to visualize the complete structure of the nonwoven fabric. Hou et al. 19 presented a new method for extracting 3D point clouds from multi-focus images of a fibrous web acquired on an optical microscope to measure fiber orientations and other properties. The authors utilized a convolutional neural network (CNN) to extract fiber edges from multi-focus images, and the multi-layer edge images were stacked vertically into a 3D model. 19 This method is effective in extracting the edges of fibers, but cannot deal with the main body of fibers. Although the optical microscope has the capability to obtain the 3D information of the complete fiber, some scholars give up the depth information or only use the depth information of fiber edges. Therefore, as a compact nonwoven fabric is not only stacked by fiber edges but also has the features of interaction and connection between the fibers with different depths, it seems necessary to describe the structure of nonwoven fabric by making full use of the 3D information captured by the microscope, so that the accurate 3D structure can be reconstructed.
In order to find a method that can accurately restore the internal structure of nonwovens, we propose a new reconstruction process by imitating the anthills model. The fibers inside a nonwoven fabric extend in all directions, resulting in a similar structure to the anthills (see Figure 1(h)), where the soil that supports the anthills is like the pore space in the nonwoven fabric and the tunnel dug by ants is like the fiber. The internal structure of nonwovens is like ‘an ant starting from one point to constantly dig the anthill passages, and these passages make up the whole anthill model’. Therefore, with reference to the construction method of the anthills, the nonwoven fabric reconstruction algorithm only needs to be aimed at the fibers, and the remaining pore space does not need to be processed.
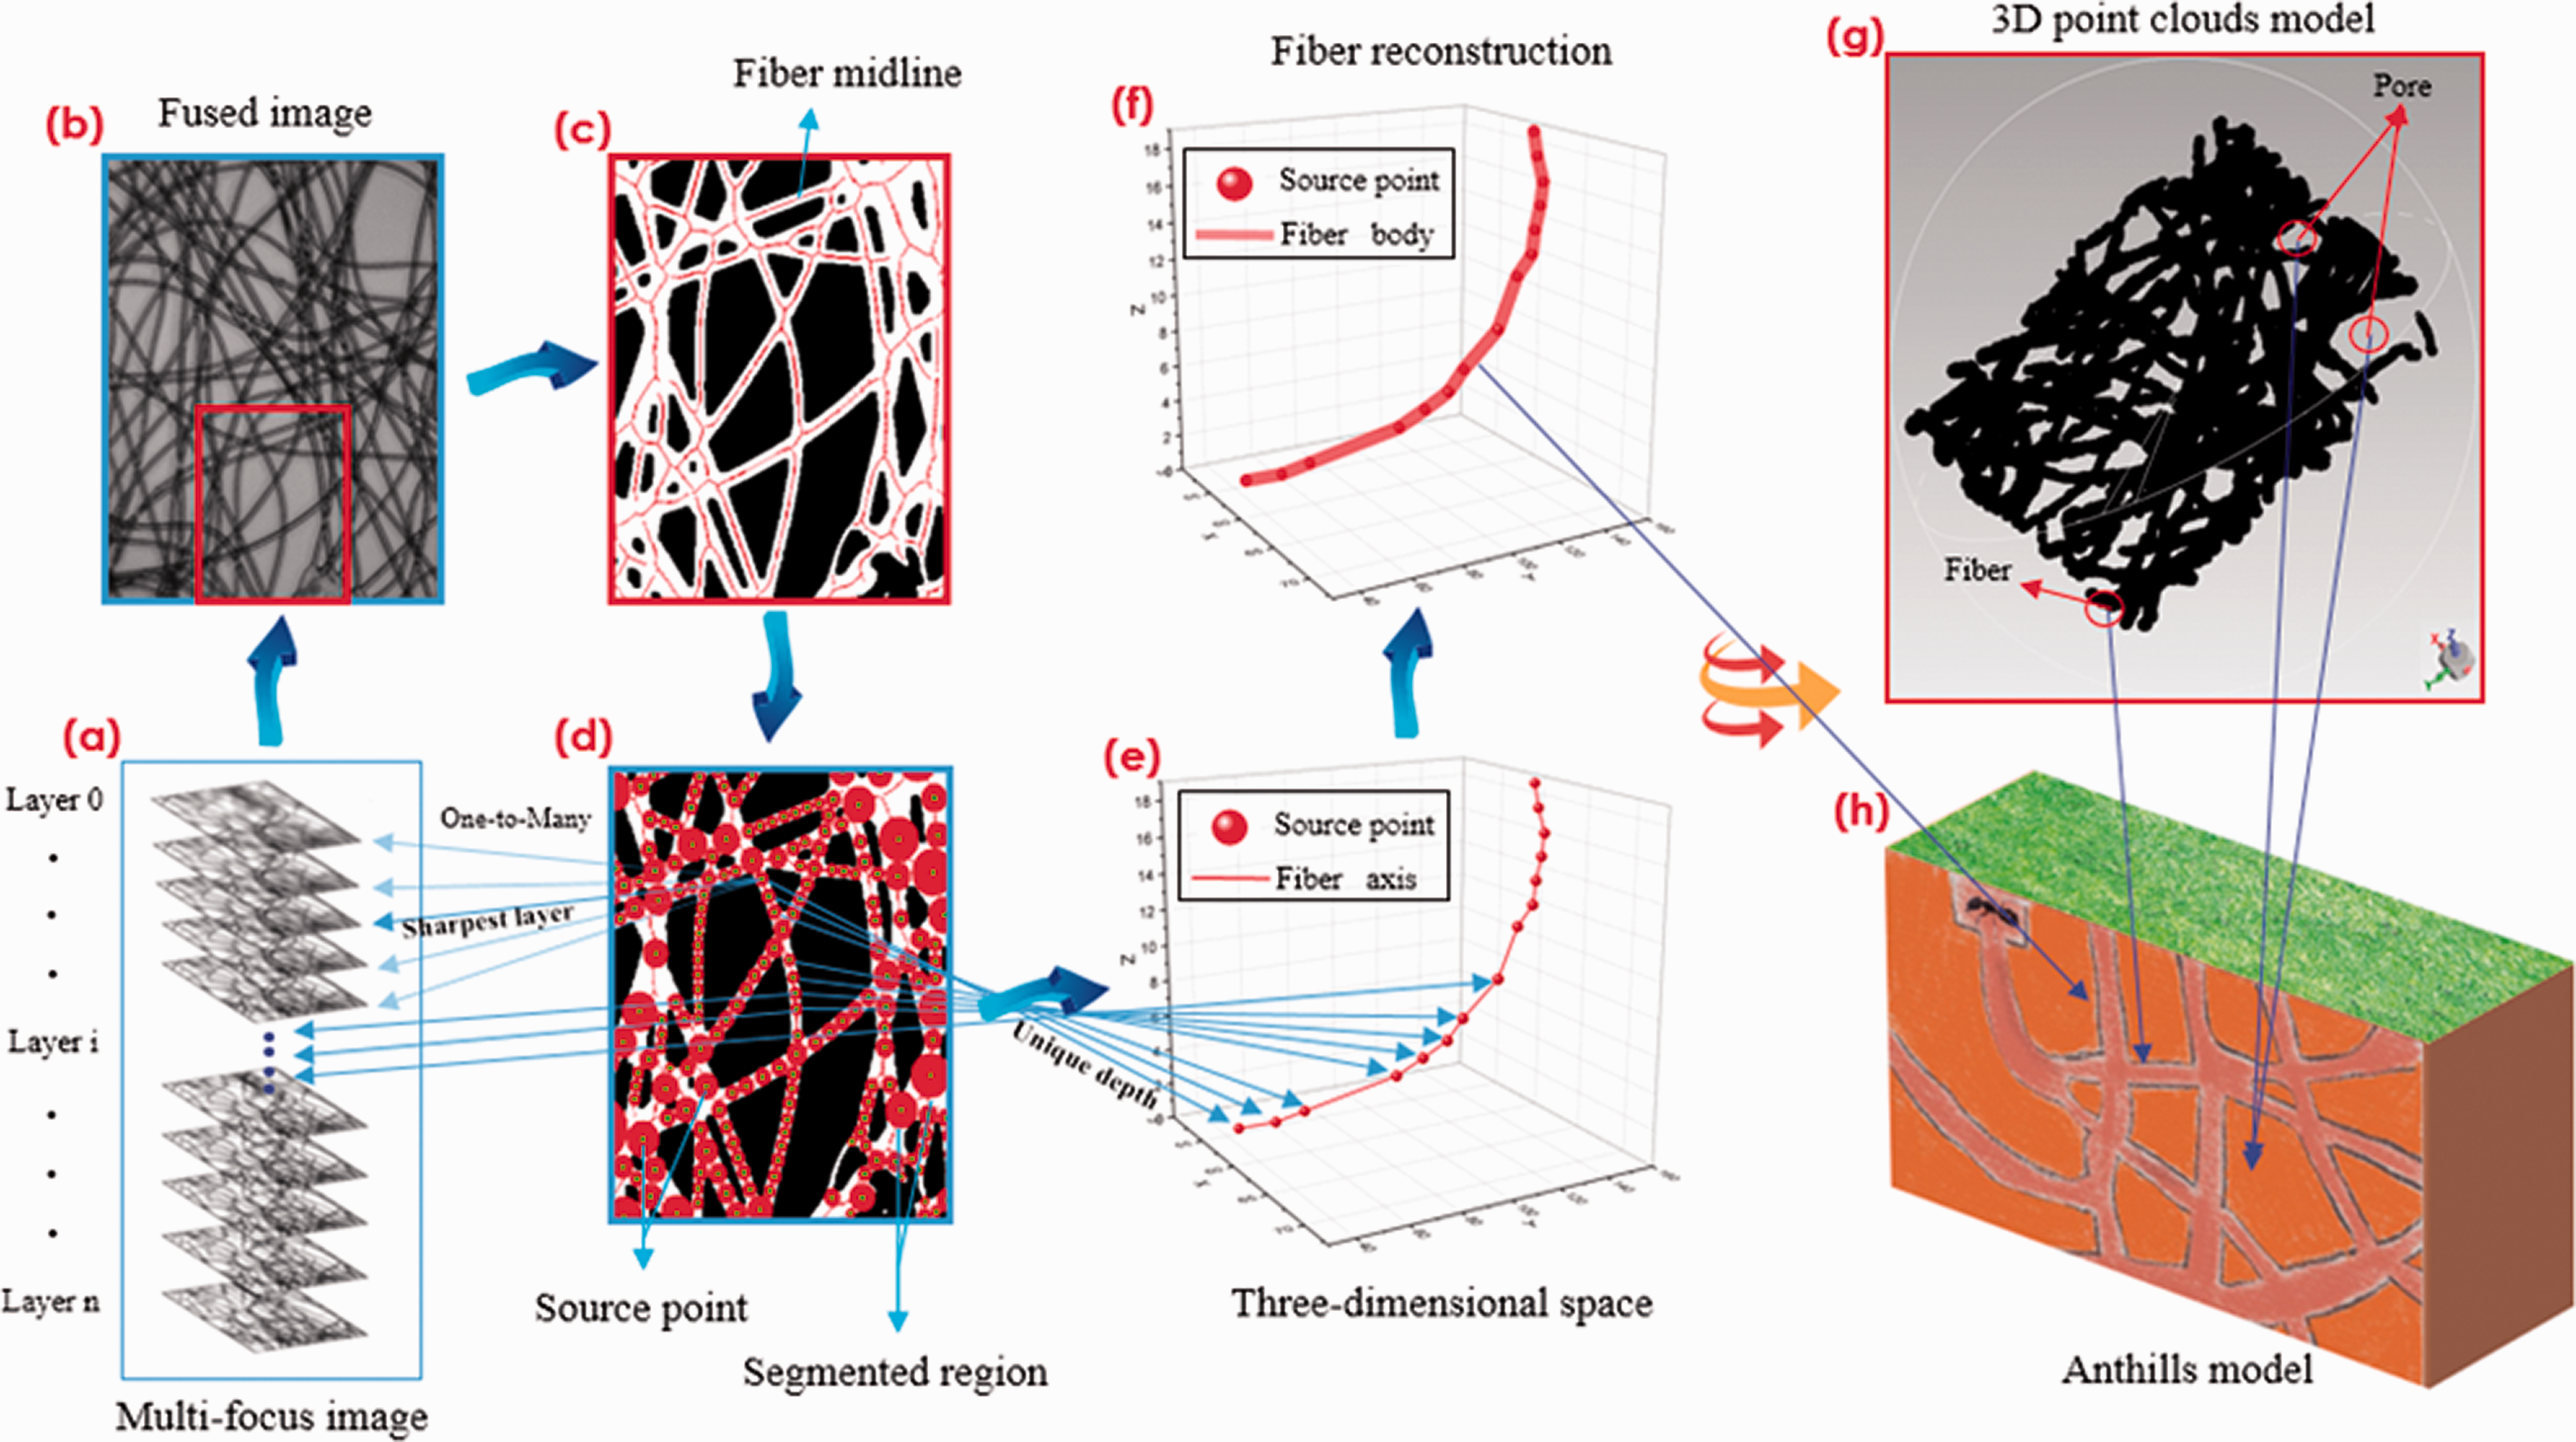
Flowchart of the three-dimensional (3D) reconstruction algorithm.
In this paper, a new fiber reconstruction algorithm based on the anthills model is presented to rebuild the fiber axis to achieve the accurate 3D reconstruction of nonwoven fabric. The goal of this study is to tackle the problem of losing the vertical connection structure information of internal fibers in a nonwoven fabric. This algorithm can not only reconstruct the structure of the nonwoven fabric accurately but also avoids the interference of the background. Fiber images of the same view are sequentially captured at different focal planes so that fibers in the view can be focused in different images and these multi-focus images can be fused into a 2D image. CircleString, defined by the fiber radius, is used to segment the fiber into circle sections. The sharpest layer of each circle section can be calculated by One-to-Many projection and the source point can be determined by the center point of each circle section. Finally, the fiber axis is generated by connecting the source points on the adjacent fiber section, and then the 3D reconstruction of the nonwoven fabric can be created by a dynamic-radius sphere rolling along each fiber axis, and the dynamic radius of the sphere is calculated as the shortest distance from the source point on each fiber axis to the corresponding fiber edge. Figure 1 displays a flowchart of this 3D reconstruction algorithm.
Image acquisition and preprocessing
The multi-focus images of fibers were captured on a microscope (M318, BEION, Shanghai, China) by a digital camera (C200, BEION) and a triaxial motorized stage (MC2000, BEION). Figure 2 shows nine examples of 120 multi-focus images of a thermal point-bonded nonwoven. The specifications of the nonwoven fabric used in the experiment are shown in Table 1. Then the multi-focus images are fused by an image-fusion technique of using the sharpest layer matrix (SLM) 18 (see Figure 3(a)). In order to achieve a better effect, image enhancing, morphology processing and binarization processing are implemented on the fused image according to the set sequence (see Figure 3(b)).
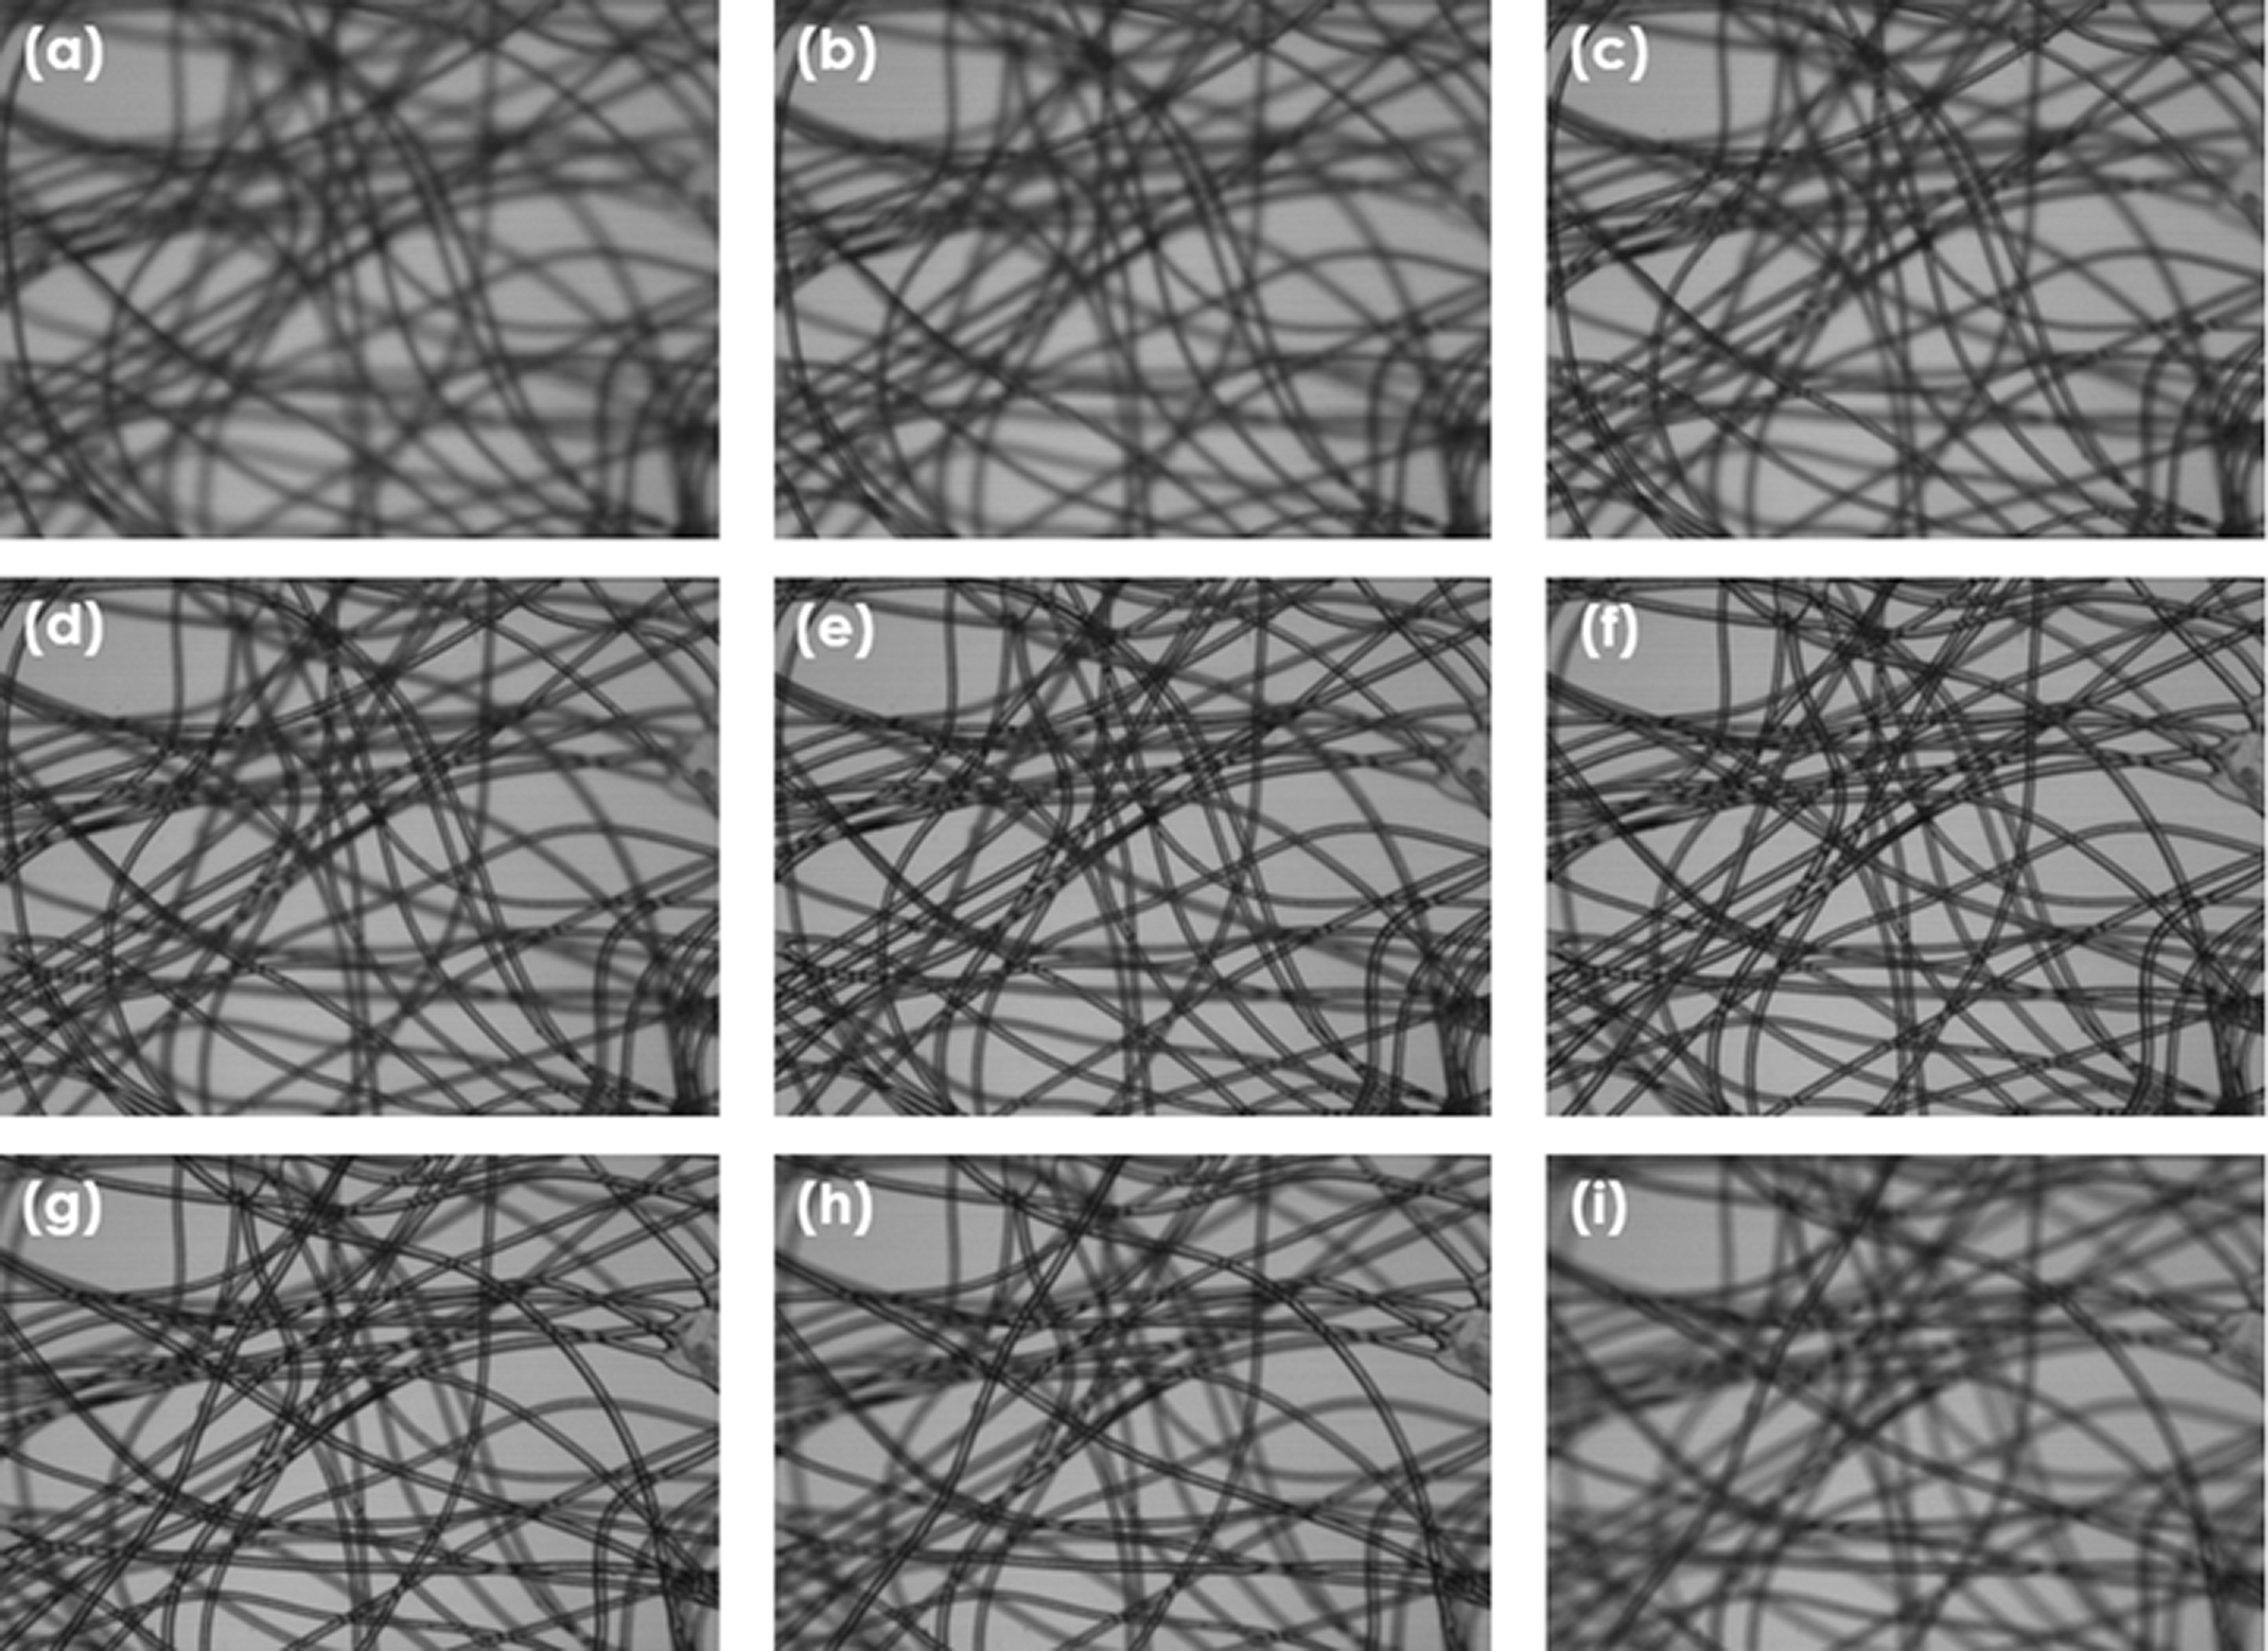
Multi-focus images of the same view on different layers.
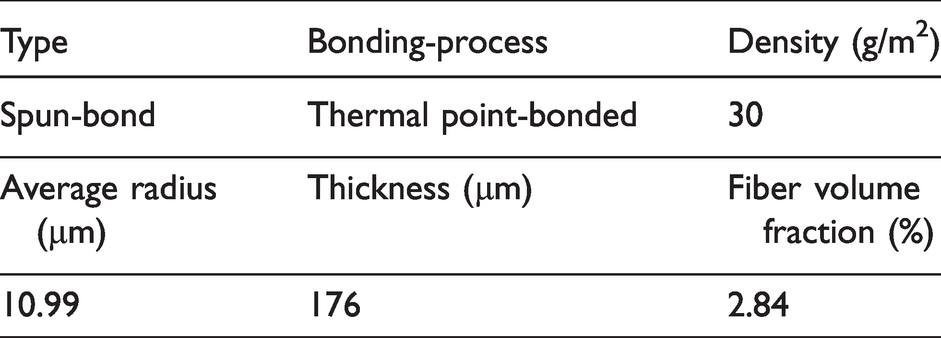
The specifications of nonwoven fabric.
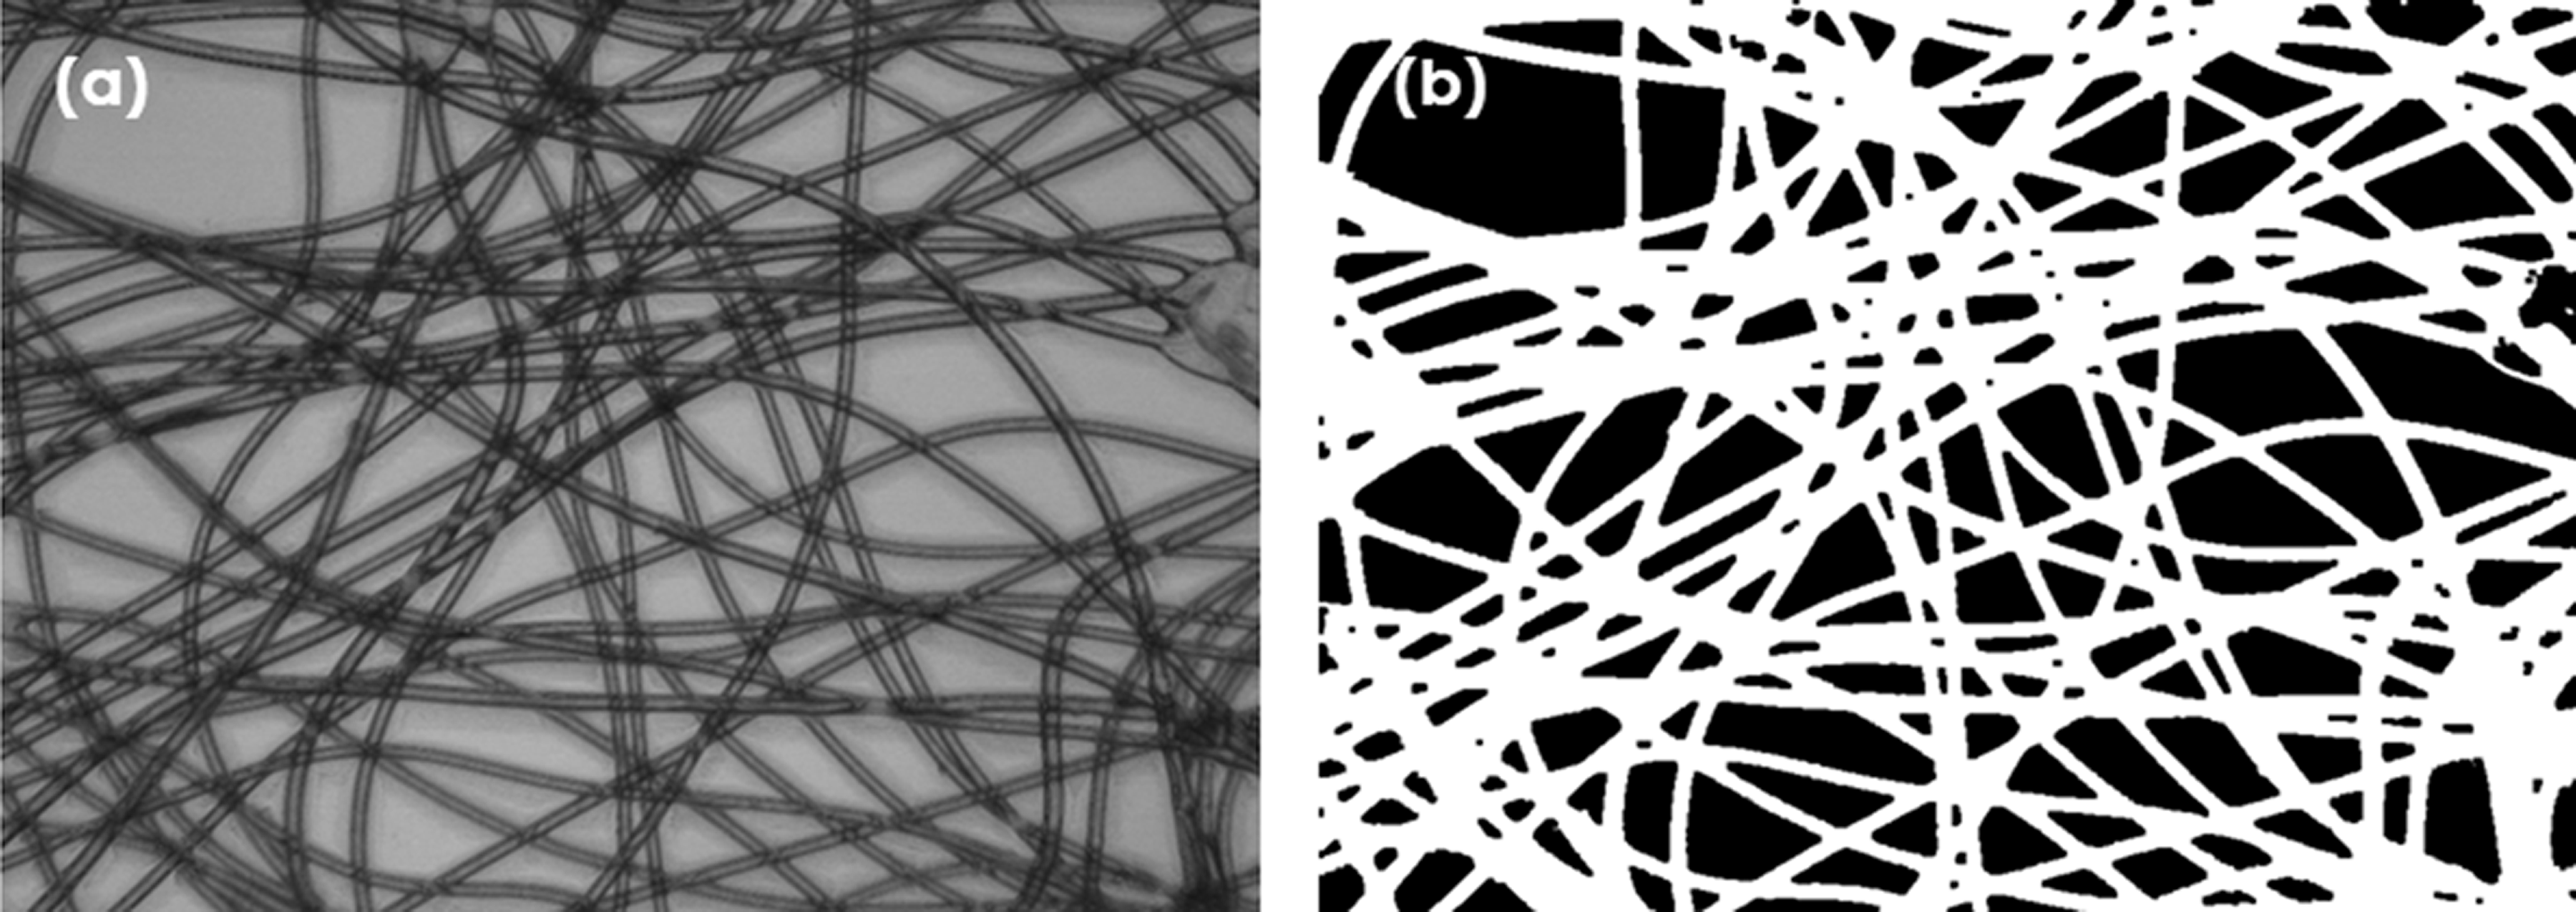
(a) Fused image by sharpest layer matrix (SLM); 18 (b) preprocessed image after image enhancing, morphology processing and binarization processing.
Fiber segmentation
The reconstruction algorithm used in this study is performed on a region by region basis. It is necessary to define an algorithm of fiber segmentation for selecting the source points and determining the 3D coordinate of each source point for rebuilding the fiber axis. Therefore, we can make the 3D reconstruction of nonwoven fabric based on the truthful depth.
The surface morphology of the same fiber is continuous and the pixels in each small part of the same fiber are at the same depth. According to this feature, the adjacent pixels in a small region will focus on the same layer in the multi-focus images, and the depth information of the source point pixel existing in the center of this region can be extracted in this small region. Combining the focusing degree of all pixels in this small region to extract the depth information of this region can smooth the errors caused by the microscope depth of field and reduce the influence of noise on a single pixel. Therefore, a novel algorithm to segment the fibers and pick the source points in the fused image is presented in this paper.
Radius extraction
In order to extract the 3D coordinates of the fiber axis and reconstruct the closed surface model of the fiber with the radius, the first thing is to find the shortest distance of each pixel on the fiber body to the corresponding fiber edge in the fused image. Each pixel’s shortest distance is the radius of the inscribed circle, which is tangent to the fiber edge.
To extract the radius of each inscribed circle, this paper uses the algorithm of 8-connectivity diffusion. With each pixel as the center of the circle, the diffusion is carried out at a constant rate until it stops beyond the fiber edge (see Figure 4), and the radius of each inscribed circle is the shortest distance between the center pixel of the circle and the corresponding edge pixel. In the output radius image, the gray value of each pixel on the fiber body is set to the radius of the corresponding inscribed circle, and all other pixels (background pixels) are set to 0 directly.
Workflow of radius extraction: (a) two sample points on the fiber body; (b) at the initial stage of diffusion, one point touches the fiber edge; (c) all the points touch the fiber edge, and the diffusion is over; (d) the inscribed circle radius is calculated.
For the radius image I (m, n, B), the radius extraction formula is shown in equation (1):
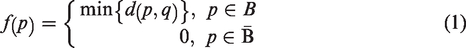
In the formula, m and n are the width and height of the image, B represents the pixels on the fiber body and
Source point determination
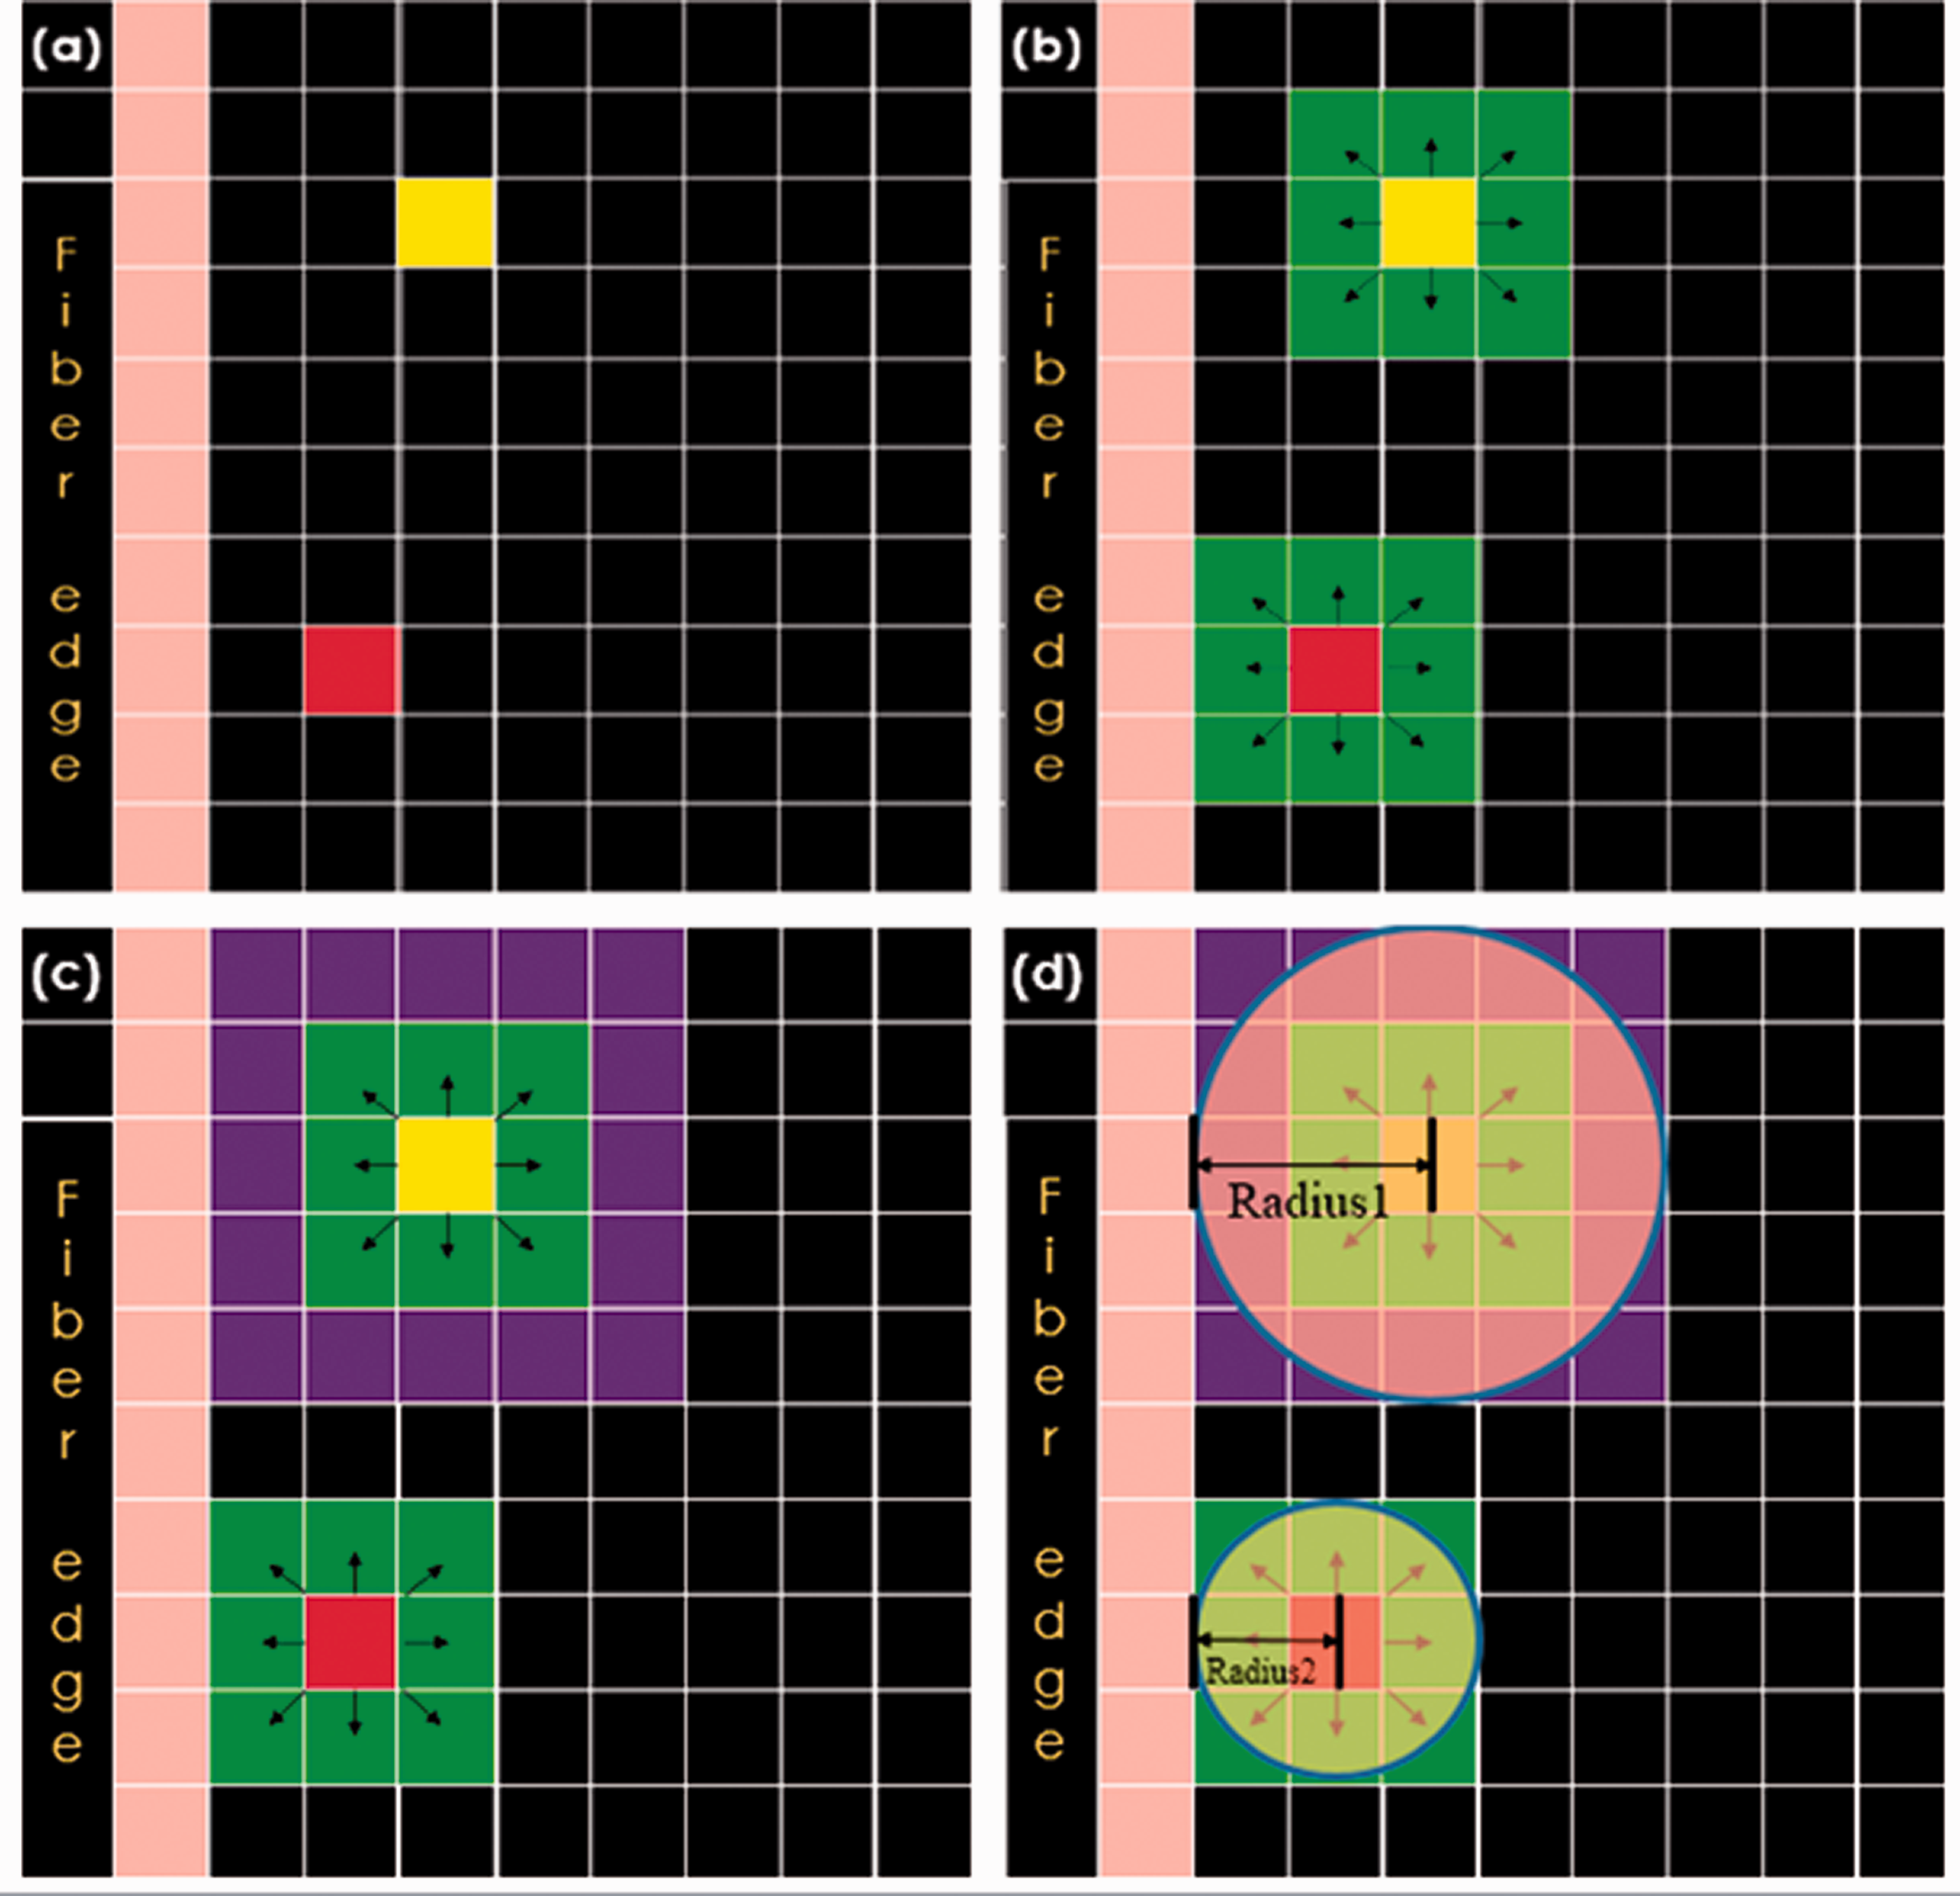
The pixels on the radius image are divided into two categories: the target points and the background points. The target point refers to the pixel on the fiber body, and its gray value is the shortest distance from the target point to the corresponding fiber edge, which is the nonzero pixel. On the contrary, the gray value of the background point is 0. The algorithm of source point determination includes double filtration processes. The first filtration process aims to extract the point-set on the fiber midline. As the gray value of the target point represents the shortest distance to the corresponding edge, the gray value of the target point on the fiber midline is significantly larger than that of a nearby target point and not on the midline, as shown in Figure 5. Therefore, the fiber midline can be extracted by the set of maximum points in the radial direction of the fiber (see Figure 6(b)). The second filtration process aims to determine the source point from the fiber midline extracted in the first process and then segment the fibers with the help of these source points and their domain region. In this paper, a region segmentation method based on CircleString is proposed, in which the fiber is separated by as many circles as possible, which are tangent to the fiber edge. At the same time, in order to avoid repeated segmentation of the same region, the circles do not intersect each other (see Figure 6(c)). The location of every source point is the center of each disjoint circle (see Figure 6(d)), and the segmented region is the maximum inscribed circle with the source point as the center.
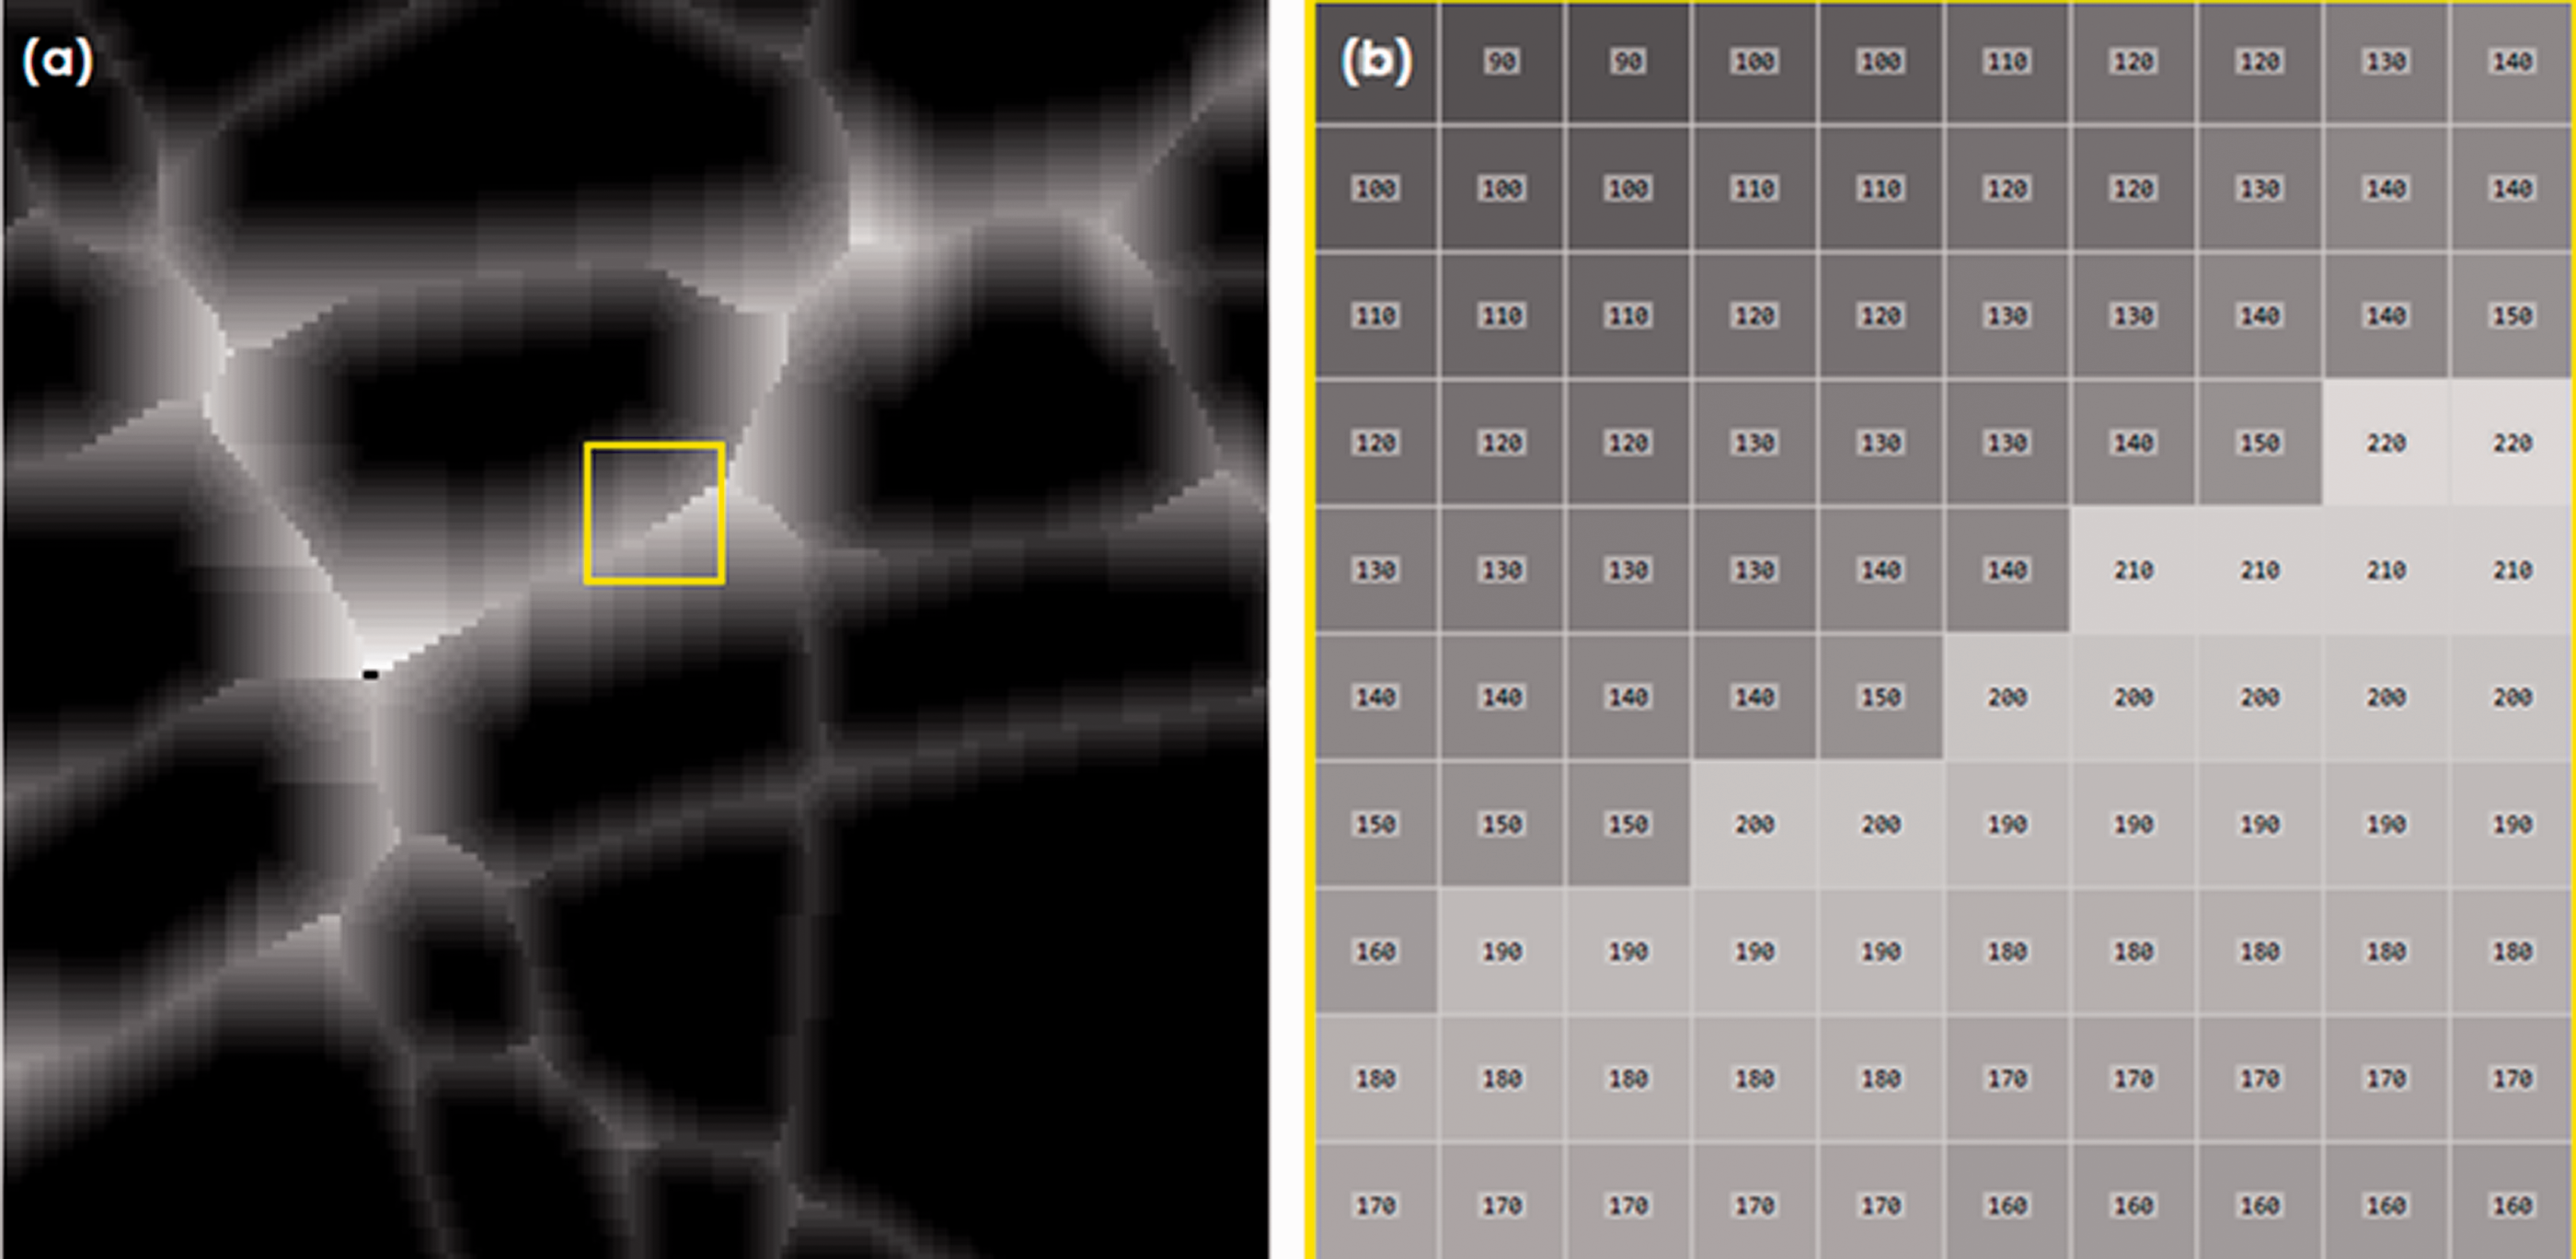
(a) Part of the radius image with the 10× gray value; (b) enlarged window of the radius image.
(a) Original fused image; (b) fiber midline image; (c) fiber segmentation based on CricleString; (d) source point image.
In the technology of digital image processing, the gradient algorithm is generally used to represent the gray change rate of the image. As the local change of the fiber microscopic images is very short, the first-order derivative and the second-order derivative are suitable for detecting the feature of gray change. Therefore, this paper introduces a method to calculate the gray change of the target point in all directions by using the second-order partial derivative of the image, and the derivation process is shown in equations (2)–(11). 20 A point whose gray value is greater than its nearby points in a certain direction is called a gray sharp point and this kind of point can be detected effectively by the value of the second-order partial derivative, because the response amplitude of the second-order derivative response of the isolated noise is much stronger than the first-order derivative, as shown in Figure 7. And the set of fiber midline target points whose gray value is greater than its nearby pixels are found.
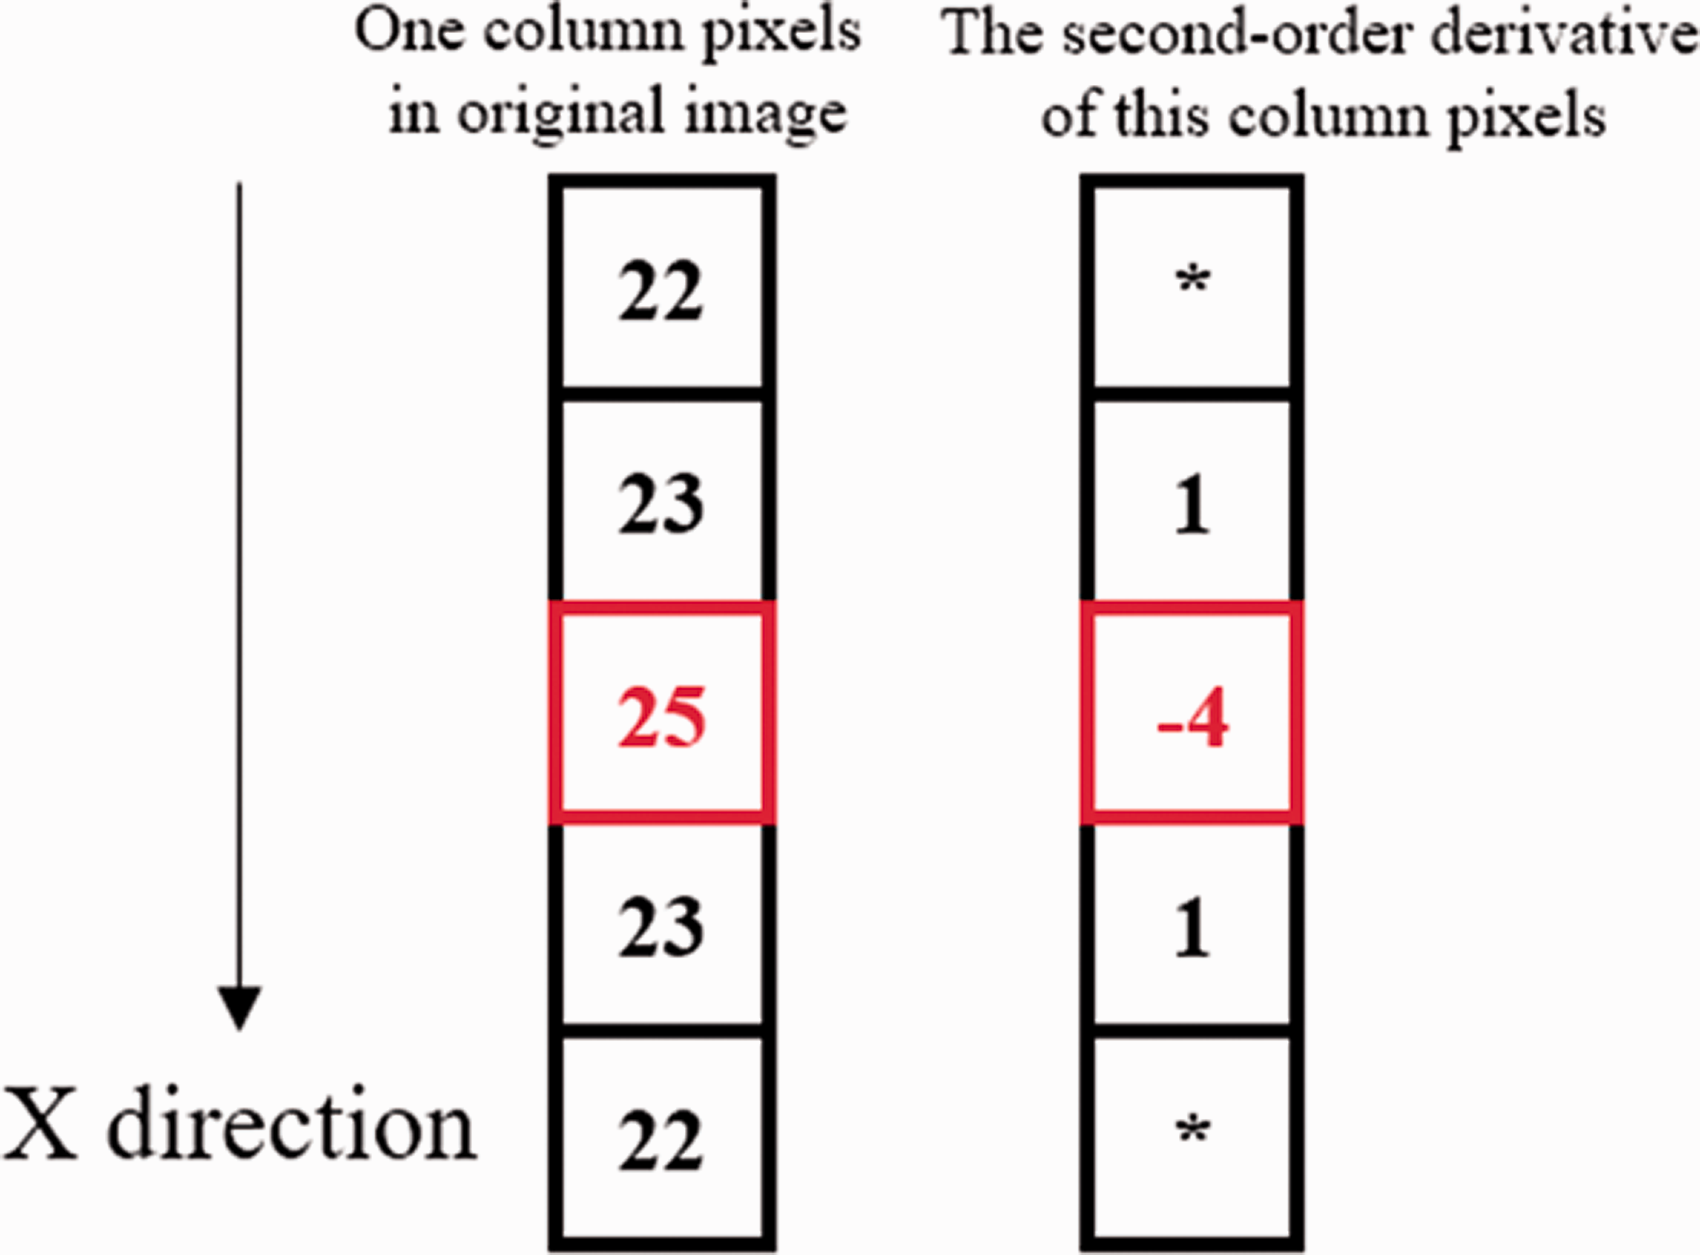
The second-order partial derivative of one column pixels.
In Calculus,
21
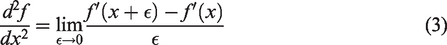
the definition of the first-order derivative is as follows:

The definition of the second-order derivative is as follows:
A digital image can be represented as a 2D function f(x, y), and the second-order partial derivative of this function contains two directions, the x-axis and the y-axis.
The first-order partial derivative corresponding to the x-axis direction is as follows:

The digital image is discretized by pixels, and the smallest unit is one pixel, so
That is:

The second-order partial derivative is as follows:
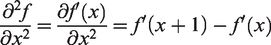


The second-order partial derivative of x is the concerned point, so let 
In the case of equation (6), the second-order partial derivative in direction x can be expressed in the following formula:

The second-order partial derivative in direction y can be expressed in the following form:

According to the above derivation of the second-order partial derivative for horizontal and vertical directions, the second-order partial derivative of other directions can be derived from the relationship between the positions of pixels on the digital image. For example, the directional derivative of 45° and 135° are used to approximate the partial differentials:


The algorithm of source point determination based on the CircleString consists of the following steps:
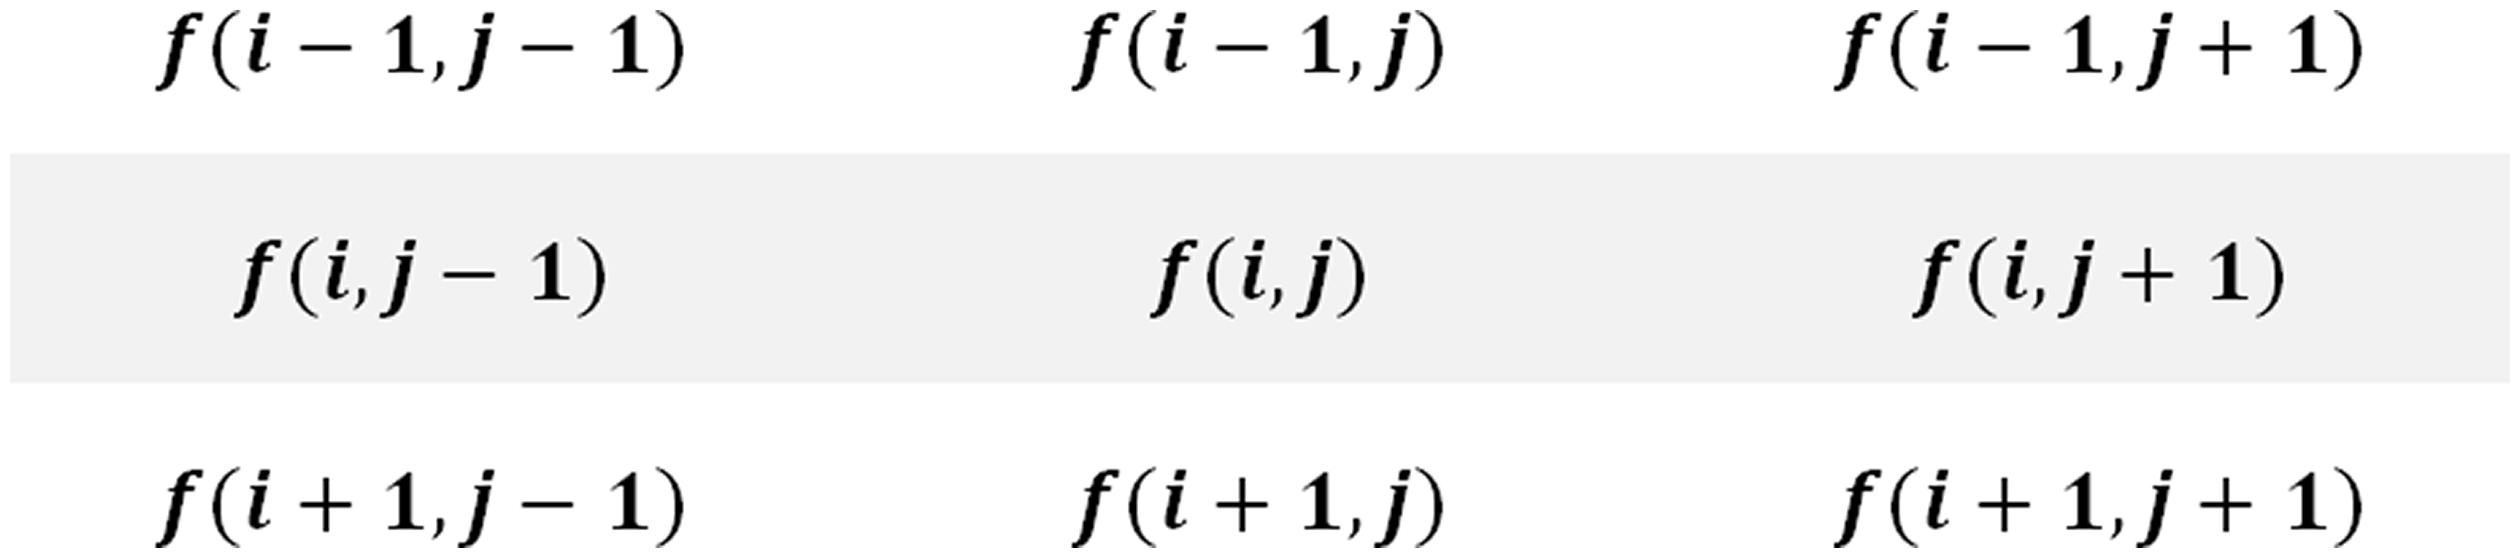
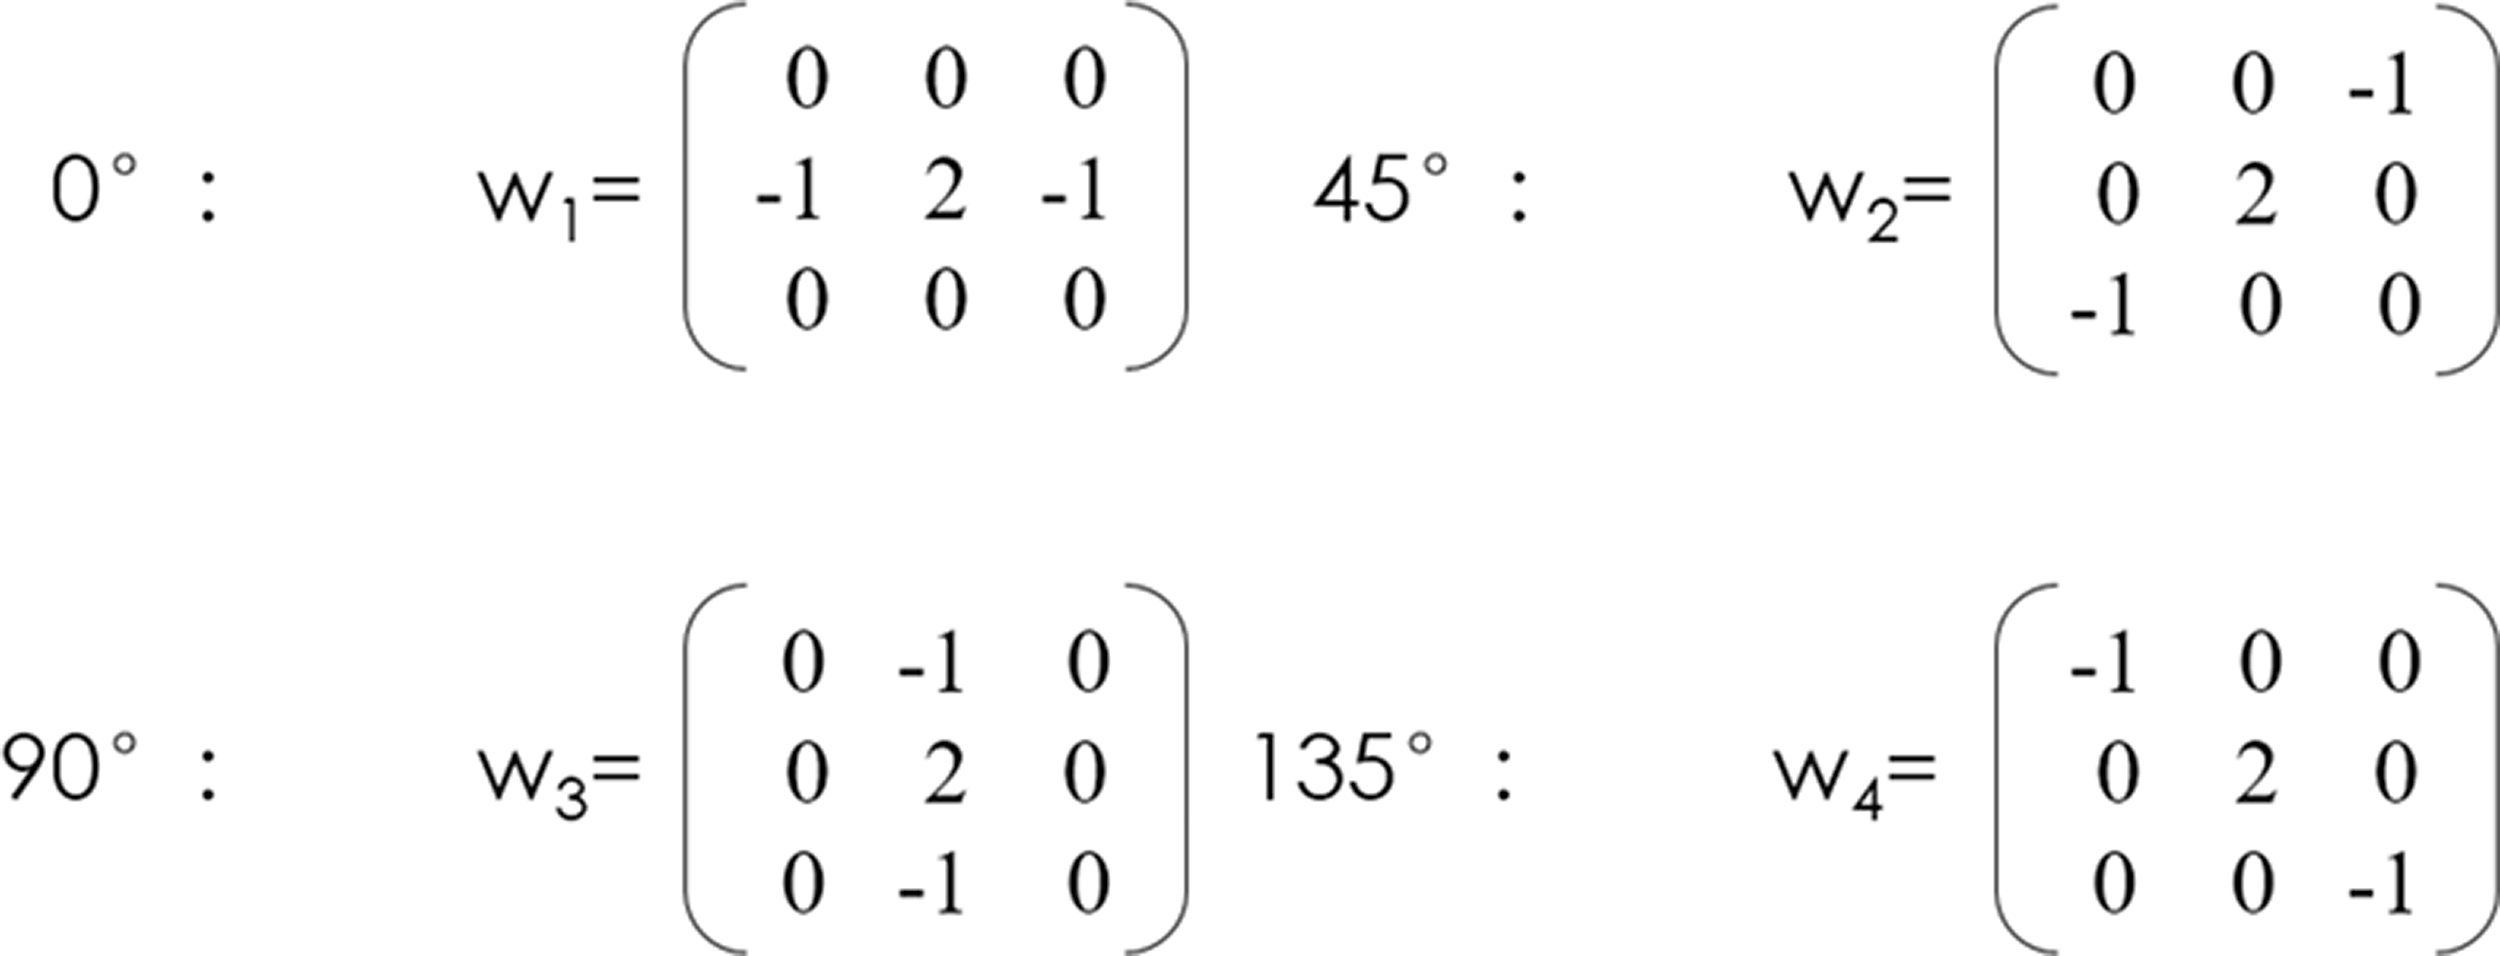
For the radius image The gray value of the 8-neighborhood of point (i, j). The value of the second-order partial derivative of each pixel can be computed by using the spatial filter convolved with the digital image. According to the above derivation of the second-order partial derivative for four directions, the filter of 0°, 45°, 90°, and 135° is shown in Figure 9:
The filter of four directions. The value of the second-order partial derivative g reflects the level of change of each pixel in each direction and the point on the fiber midline can be segmented by whether the value of g is greater than 0. Performing the following steps according to the set sequence:
The parameters w1, w2, w3 and w4 are the filters for four directions, g1, g2, g3 and g4 represent the weighted value of point (i, j) after convolution with four spatial filters, respectively. The point that satisfies
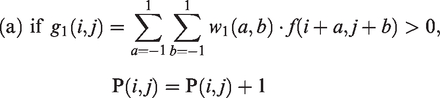
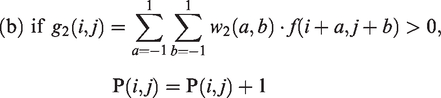
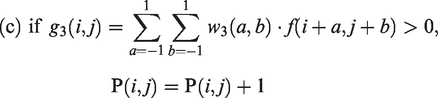
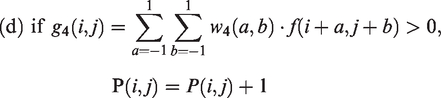
Where f (i, j) is the gray value of point (i, j) in the output fiber midline image L (m, n), and R (i, j) is the gray value of point (i, j) in the radius image L (m, n), P (i, j) is the number of directions in which the gray sharp point condition is satisfied.
5. The point (i, j) in the fiber midline image L (m, n) can be determined as the source point only if it satisfies the condition that the gray value of the pixel covered by the circle with this point as the center and R (i, j) as the radius cannot be equal to 1. Finally, this kind of point is determined as the source point, and the circular region whose radius is R (i, j) is the segmentation area centered on this source point. Perform this step in turn for each point in the fiber midline image L (m, n).
This algorithm of source point determination consists of two sub-iterations: the first sub-iteration is to achieve the image L (m, n) of the fiber midline, and the second sub-iteration is to extract the source point and segment the fibers from the fiber midline image L (m, n). Compared with the other algorithm of fiber segmentation, the method of this paper proposed based on the CircleString is more conducive to finding the geometric center point of the region, and the radius of the segmented region will dynamically change with the different fiber thickness. In this method, it will not produce a too large or too small partition area at the fiber twigs and bonding areas, which could result in erroneous depth extraction.
Depth extraction
Introduction of deep from focus
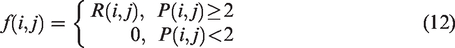
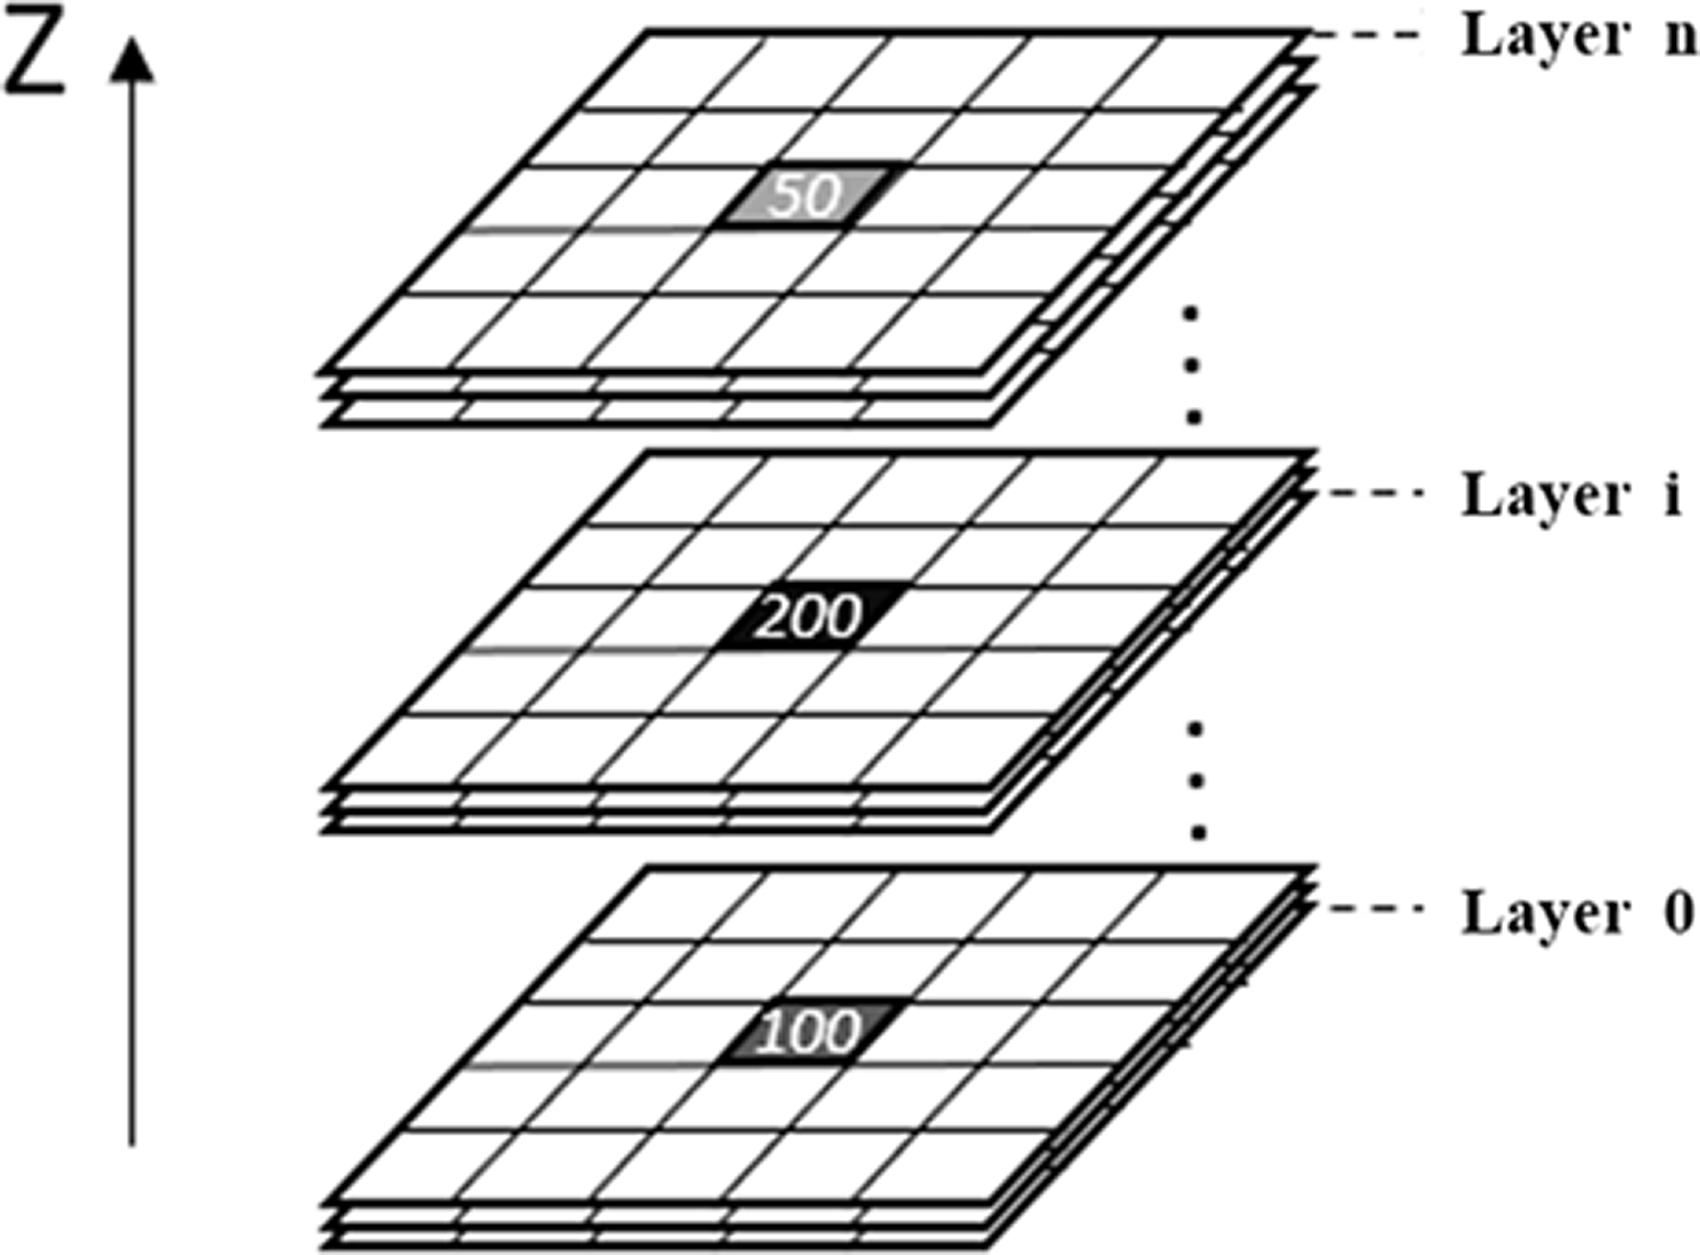
The traditional deep from focus (DFF) algorithm is a monocular passive visual depth extraction method, which restores the depth information of objects in a 3D scene through the features that at a different distance from the focus can lead to different sharpness. When the microscope is imaging, there is a certain length of space in front of and behind the focus, and when the subject is in this space, the image on the film is just in the same dispersion circle. The clarity of the negative film within the limited range of the permissible dispersion circle is clear in the human eye. The length of this space is called depth of field, and the imaging model is shown in Figure 10. The purpose of using the DFF algorithm in the microscopic multi-focus image is to obtain the layer where the maximum clarity of each pixel in the image is located as the depth information through the sharpest layer matrix and then reconstruct the 3D structure of the object.
The imaging model.
Improved DFF algorithm
It may not be possible to find the depth information through the maximum sharpness of a single pixel accurately because of the noise. The target of a single fiber is coherent, but the depth information of each pixel on the fiber extracted by DFF technology will have a huge change of adjacent pixels, and the noise in the background outside the fiber will also be extracted by DFF. Therefore, on this basis, this paper proposes a new deep from focus region (DFFR) algorithm, the way to extract depth information is from multiple focus pixels in a small circle region. This algorithm will evenly focus on the depth information of the source point determined by the above algorithm and extract the depth from the corresponding fiber circle section based on the One-to-Many projection, as shown in Figure 1(d) to (a) and (d) to (e).
To synthesize the value of sharpness of all the pixels in each segmented region to represent the sharpness of the corresponding source point, the layer with the maximum sharpness in the same segmented region on all multi-focus images is found as the depth information of the source point. As shown in the depth image (Figure 12(b)), the depth information of the source point extracted by using the DFFR algorithm can avoid the jump of the depth value of adjacent pixels and reduce the influence of noise on the background.
The algorithm of depth extraction based on the DFFR consists of the following steps:
Using the gradient modulus function as the sharpness calculation formula shown in equation (13) and calculating the sharpness values of all source points in each layer of multi-focus images, the z-axis is determined by the depth direction in the multi-focus image and then the 3D sharpness matrix A(x, y, z) is generated, as observed in Figure 11.
Three-dimensional sharpness matrix of the source point. (a) Original fused image; (b) depth image; (c) enlarged window of the depth image.

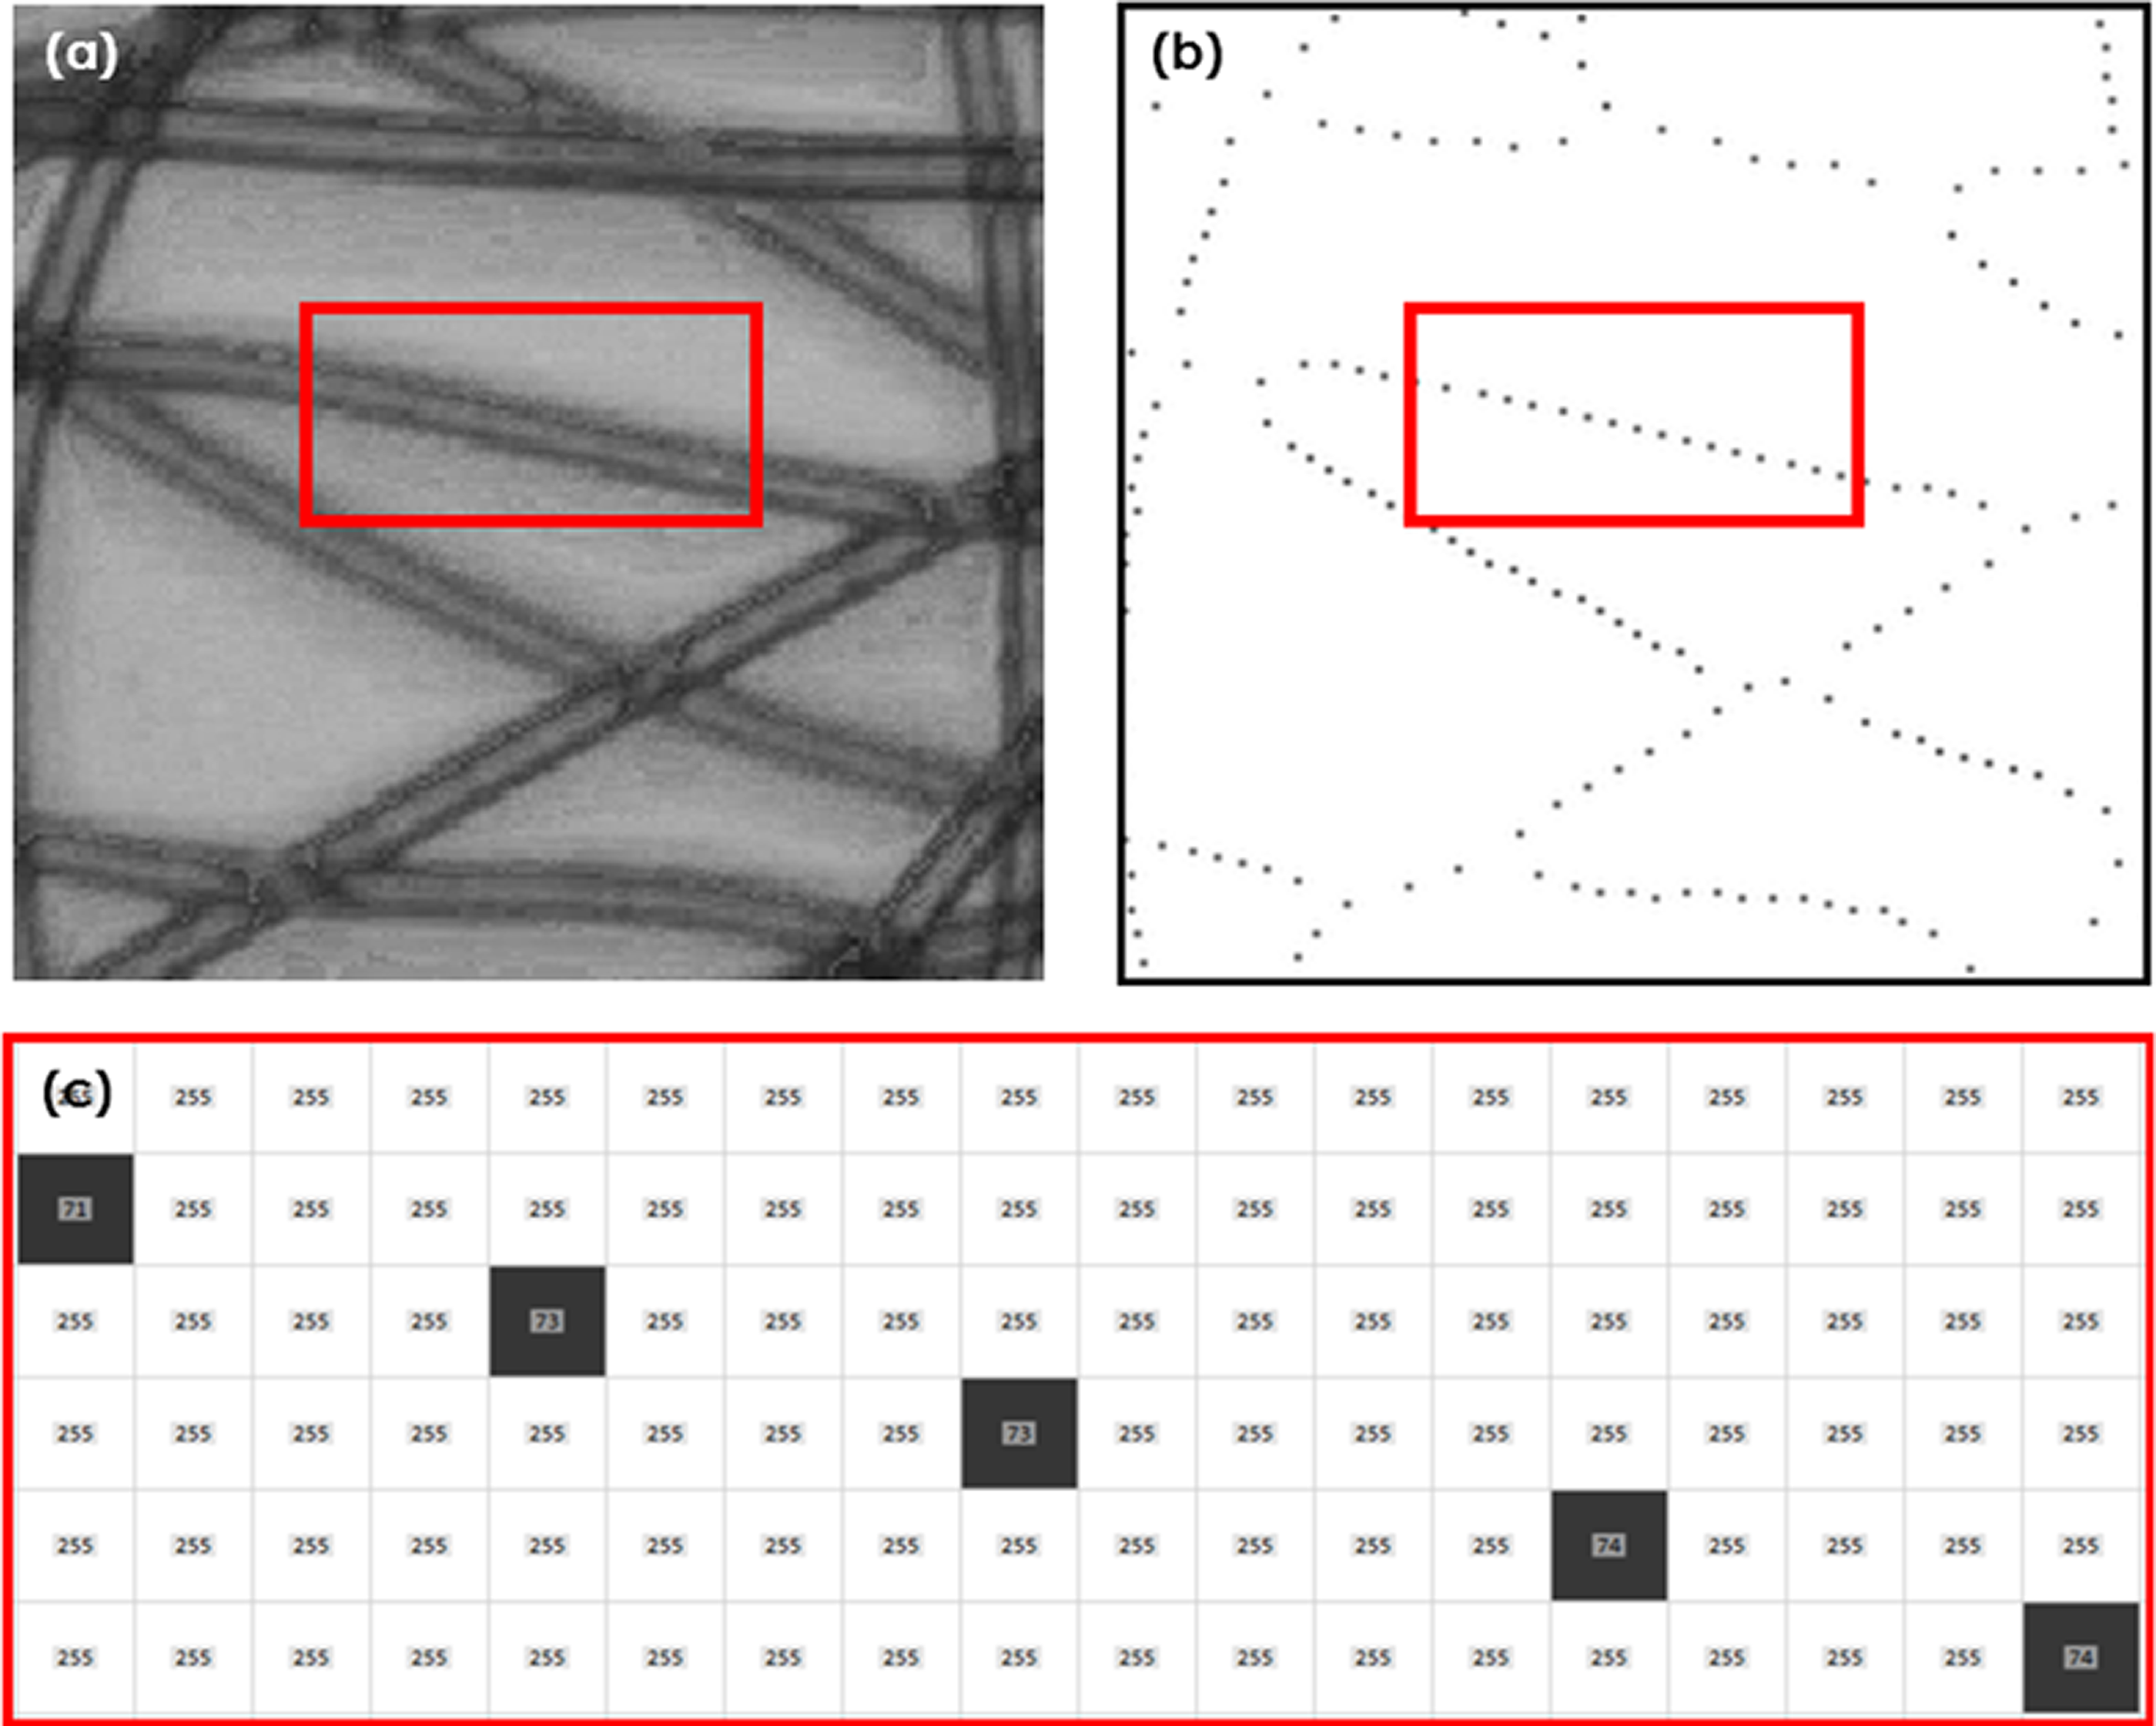
2.As shown in Figure 11, for the same (x, y), the sharpness matrix on different layers may have different A(x, y, z) values because focused regions vary from layer to layer. The depth information of source point (x, y) can be set with the layer number on which the A(x, y, z) at the same position has the maximum value among all the layers. 3.Perform step 2 in turn for each source point to calculate the depth information z, and then project the source point to a blank image, the gray value of each source point is the corresponding depth information z, then the depth image of the source point can be achieved accurately.
Fiber axis rebuilding
The fiber axis is different from the fiber midline extracted in this paper, the midline pixels are incontinuous and have only 2D coordinates, as shown in the fiber midline image (Figure 6(b)). Some scholars have done a lot of research on fiber axis rebuilding by using the image capturing device, but the results are less than satisfactory. In some conventional methods, scanning electron microscopy (SEM) images are used to simulate and reconstruct a structural model, 22 but only the surface information of the material can be captured by SEM, and there is almost no connection information between layers of material. There are also some other traditional methods, such as CT and DVI.11–13 Although the vertical connection information can be well preserved by these devices, the high cost and low efficiency are not suitable for the detection of nonwoven fabrics. In the multi-layer capture technology of the microscope, some scholars stacked the reconstruction layers into a 3D model. 23 The layers are independent and there is no vertical connection information between the layers. There are also some other scholars who have segmented the fibers and reconstructed them separately, 24 so that the vertical information can be well preserved. However, the size of the capture window is very small, and the range of capture is limited to the fabric surface only, so it is not suitable for nonwovens with large thickness and density. In this paper, a new method based on the break-and-reconnect technique is proposed: breaking the fiber midline into the independent source point and then reconnecting with the depth information of the source point to form a continuous fiber axis with 3D coordinates, as shown in Figure 1(c), (d) and (e).
Introduction of breadth-first search
The breadth-first search (BFS) algorithm is a traversal policy for connected graphs because its solution is to start with a vertex V0 and prefer to search the surrounding area. It is often used in maze problems or shortest path problems in algorithm competitions. In the searching process, the BFS algorithm uses the queue to pop up the previous elements continuously. The elements of the next layer will continue to be added behind until the queue is empty or the conditions are met. The search direction of the BFS algorithm is from inside to outside, so the order of the target solution is also from near to far. Therefore, the BFS algorithm is also suitable for image processing, and it can be used to search the target point in a specific order. The working schematic of the BFS algorithm is shown in Figure 13.
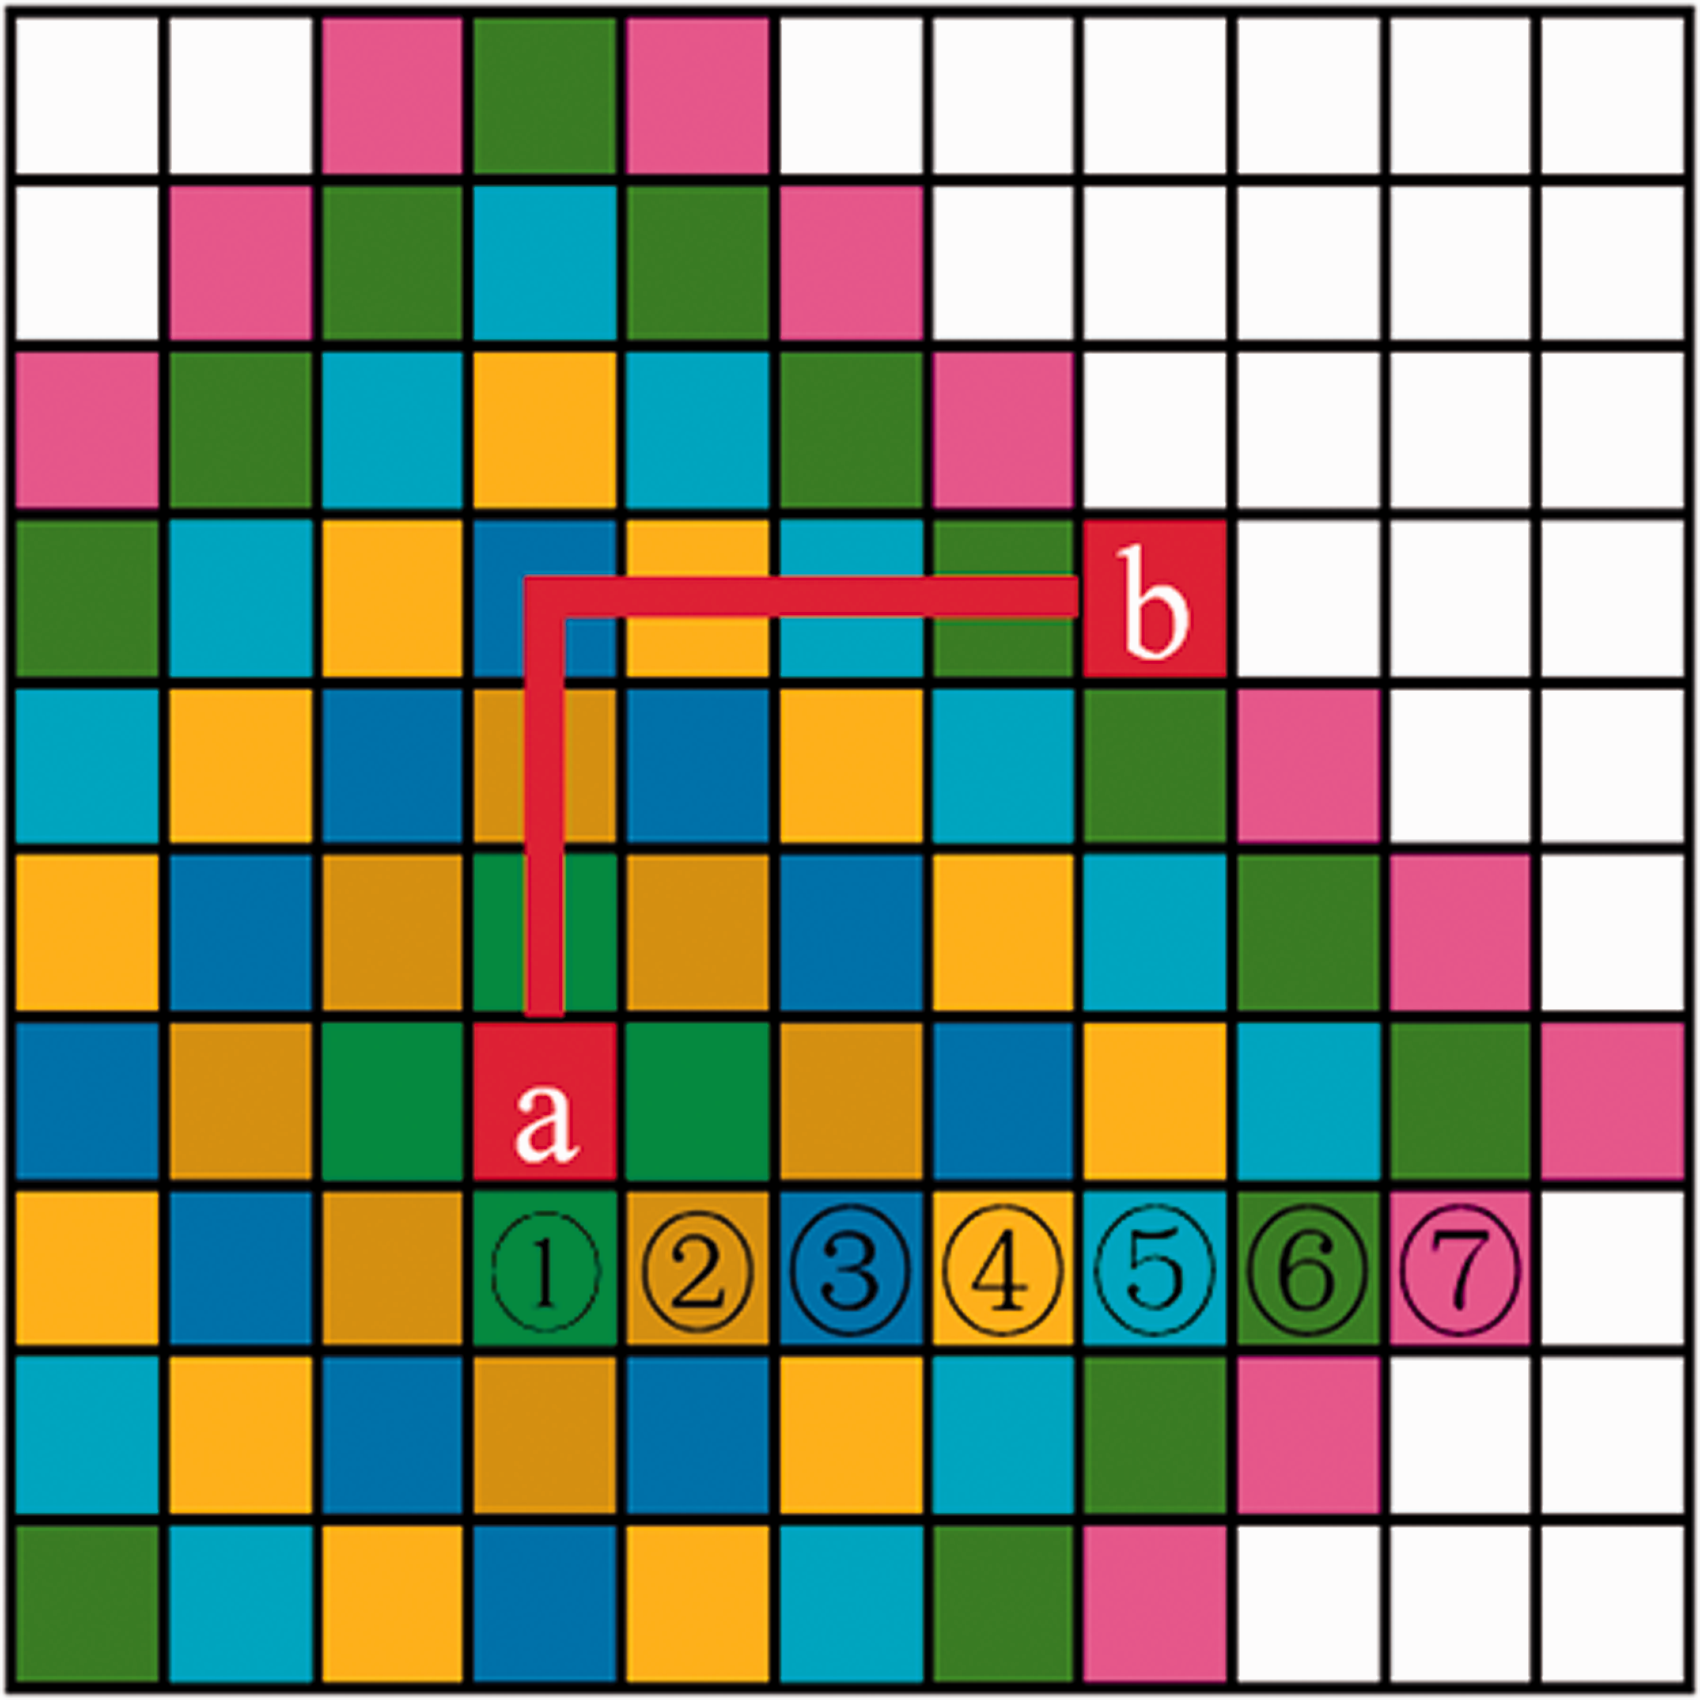
Working schematic diagram of the breadth-first search (BFS) algorithm. In this figure, (a) and (b) are the starting and ending points of the traversal, respectively; The squares with different colors represented by ①∼⑦ represent the search order of the BFS algorithm; the red solid line is the path planned by the BFS algorithm.
Connection algorithm
In the depth image achieved by the algorithm of DFFR, the depth information of each point can be represented by their gray value. The surface morphology of the same fiber is supposed to be continuous, and the pixels in each section of the same fiber should be at the same depth. Therefore, there is a great correlation between the depth information and direction of the adjacent source points in the same fiber. In this paper, a new algorithm for rebuilding the fiber axis is presented. This algorithm enables the source points on the same fiber to connect with each other one by one to rebuild the fiber axis. It mainly uses BFS to search the source points which satisfied the condition, and then connects these source points.
The connection algorithm based on the BFS consists of the following steps:
For the depth image with the size of
In the first sub-iteration, the pixel K(x, y) can be connected to the source point P(i, j) if the conditions G1 and G3 are all satisfied. In the second sub-iteration, the pixel K(x, y) can be connected to the source point P(i, j) if the conditions G2 and G3 are all satisfied. Continue to perform the follow-up steps when a satisfied source point is found.
Condition G1:

Condition G2:

Condition G3:
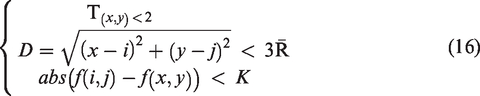
T(
i
,
j
) represents the number of pairs of the source point P(i, j), 2.Connect the source point P(i, j) to the point K(x, y) that satisfies the condition of the first step on the depth image. The gray value of the pixels covered by the line generated by the connection of the two source points is set to the average gray value of the two source points. 3.After each successful pairing, the pairing number of the two source points is increased, respectively:
With each sub-iteration, the above steps are performed in turn for each source point in the depth image.
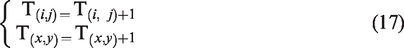
When all the source points are correctly connected by the above algorithm, the fiber axis image is achieved, and the extraction process is shown in Figure 14. In the 3D space, the depth information of the fiber axis is stored in the gray value of the fiber axis image.
Workflow of the fiber axis extraction: (a) original fused image; (b) after the first sub-iteration of the connection algorithm; (c) schematic diagram of direction and depth of the source point; (d) after the second sub-iteration of the connection algorithm.
Fiber reconstruction
In order to build a 3D model, the surface point cloud of the fiber must be obtained, that is a series of 3D coordinates (x, y, z), and the complete fiber body is similar to a curved cylindrical structure in 3D space. Actually, the radius of the fiber is not necessarily fixed and the radius of different parts of the same fiber may be various. Therefore, the 3D model of the fiber can be reconstructed by a sphere rolling along the fiber axis and the radius of the sphere is stored in the gray value of the corresponding pixel in the radius image. The generating formula of the surface point cloud of the fiber is shown in equation (18):

Results and discussion
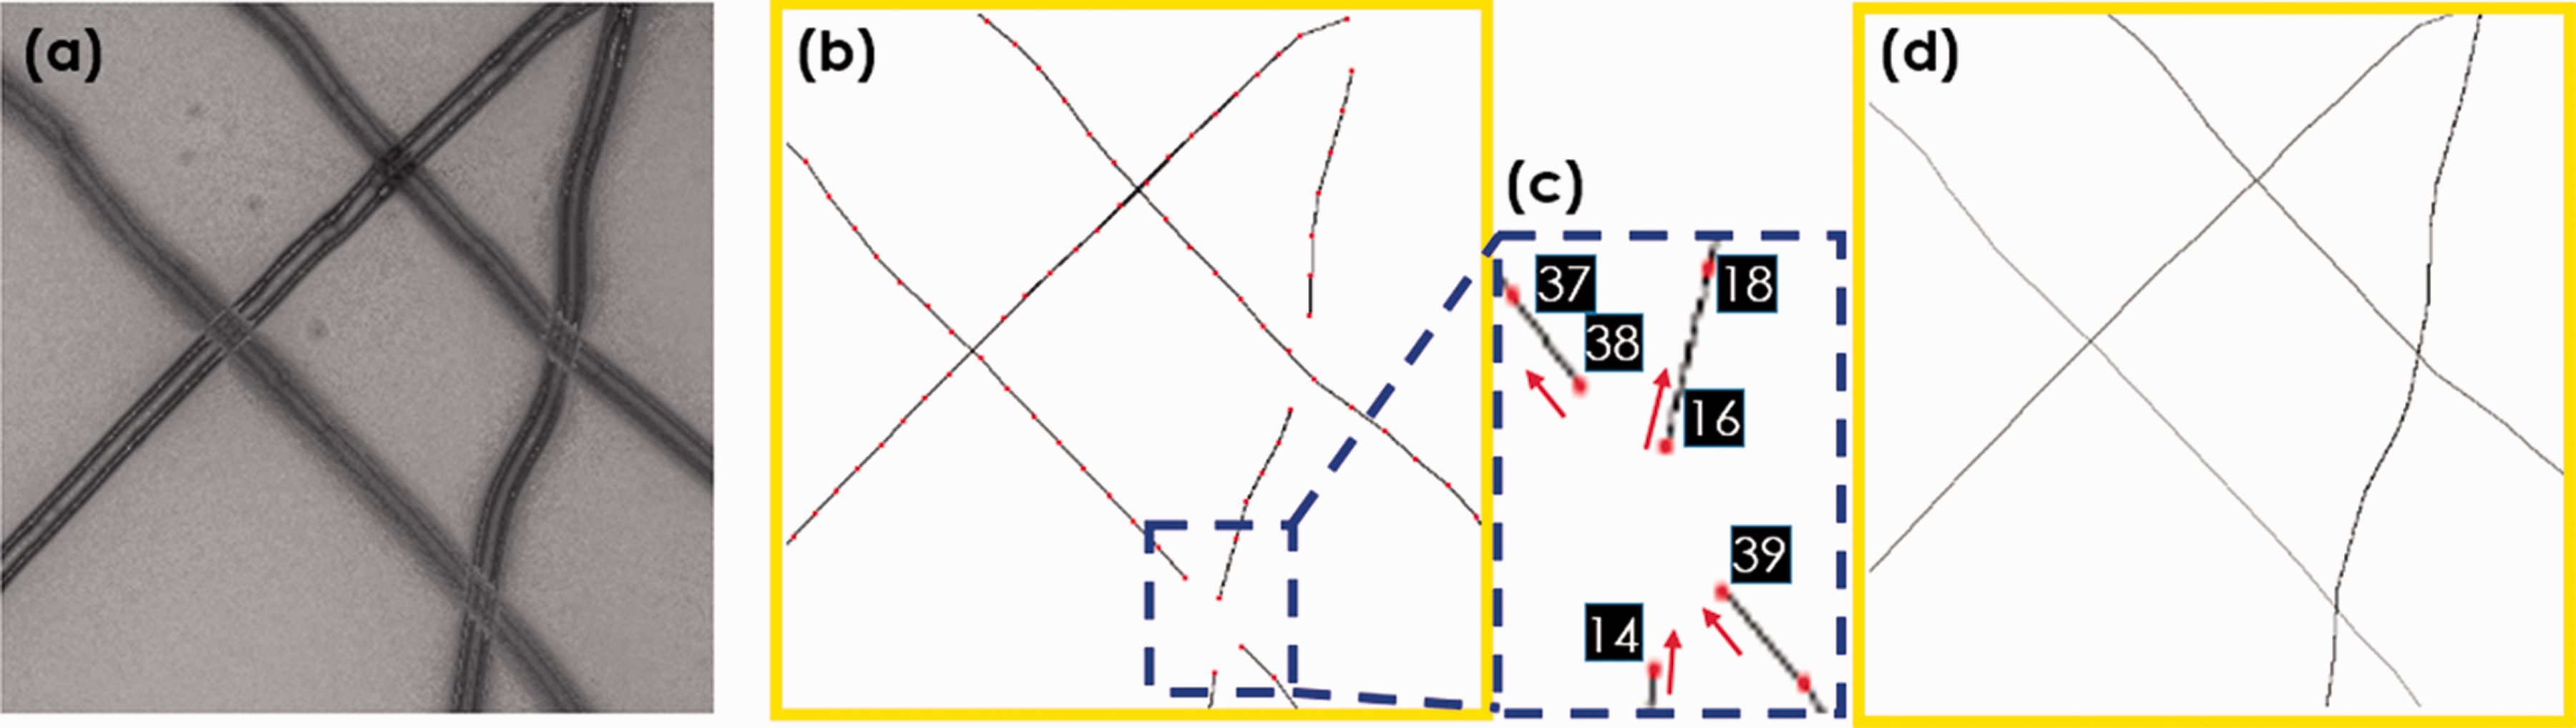
Based on the above work, the 3D reconstruction algorithm in this paper can truly restore the 3D structure of nonwovens. It is worth mentioning that this algorithm can not only restore the morphological characteristics of the fiber but also retain the vertical relationship between the layers in nonwovens. In this paper, a thermal point-bonded nonwoven (Table 1) is selected for reconstruction. After the reconstruction through the above algorithm, the 3D coordinates of the fiber surface are output to form a point cloud and rendered by the point cloud library (PCL) in C++. The reconstruction model marked with different colors at different depths is shown in Figure 15. The continuity of fiber surface morphology and the accuracy of position are well preserved and its 3D structure of ‘anthills’ in nonwovens can be seen clearly from this result.
The results of the nonwoven fabric three-dimensional (3D) reconstruction.
The findings of this study have to be seen in light of some limitations. For the microscope to work properly, light needs to penetrate the sample materials. However, the cross-region of some nonwovens is too dense and the light transmittance is quite low, especially for thicker and high-density (>90 g/m2) materials. In the future research, we plan to reconstruct the fibers in the surface part which can be captured by a microscope, and then according to the structural continuity of the material, the internal fiber structure of the nonwoven fabrics can be reconstructed by the fiber particle growth model.
Conclusions
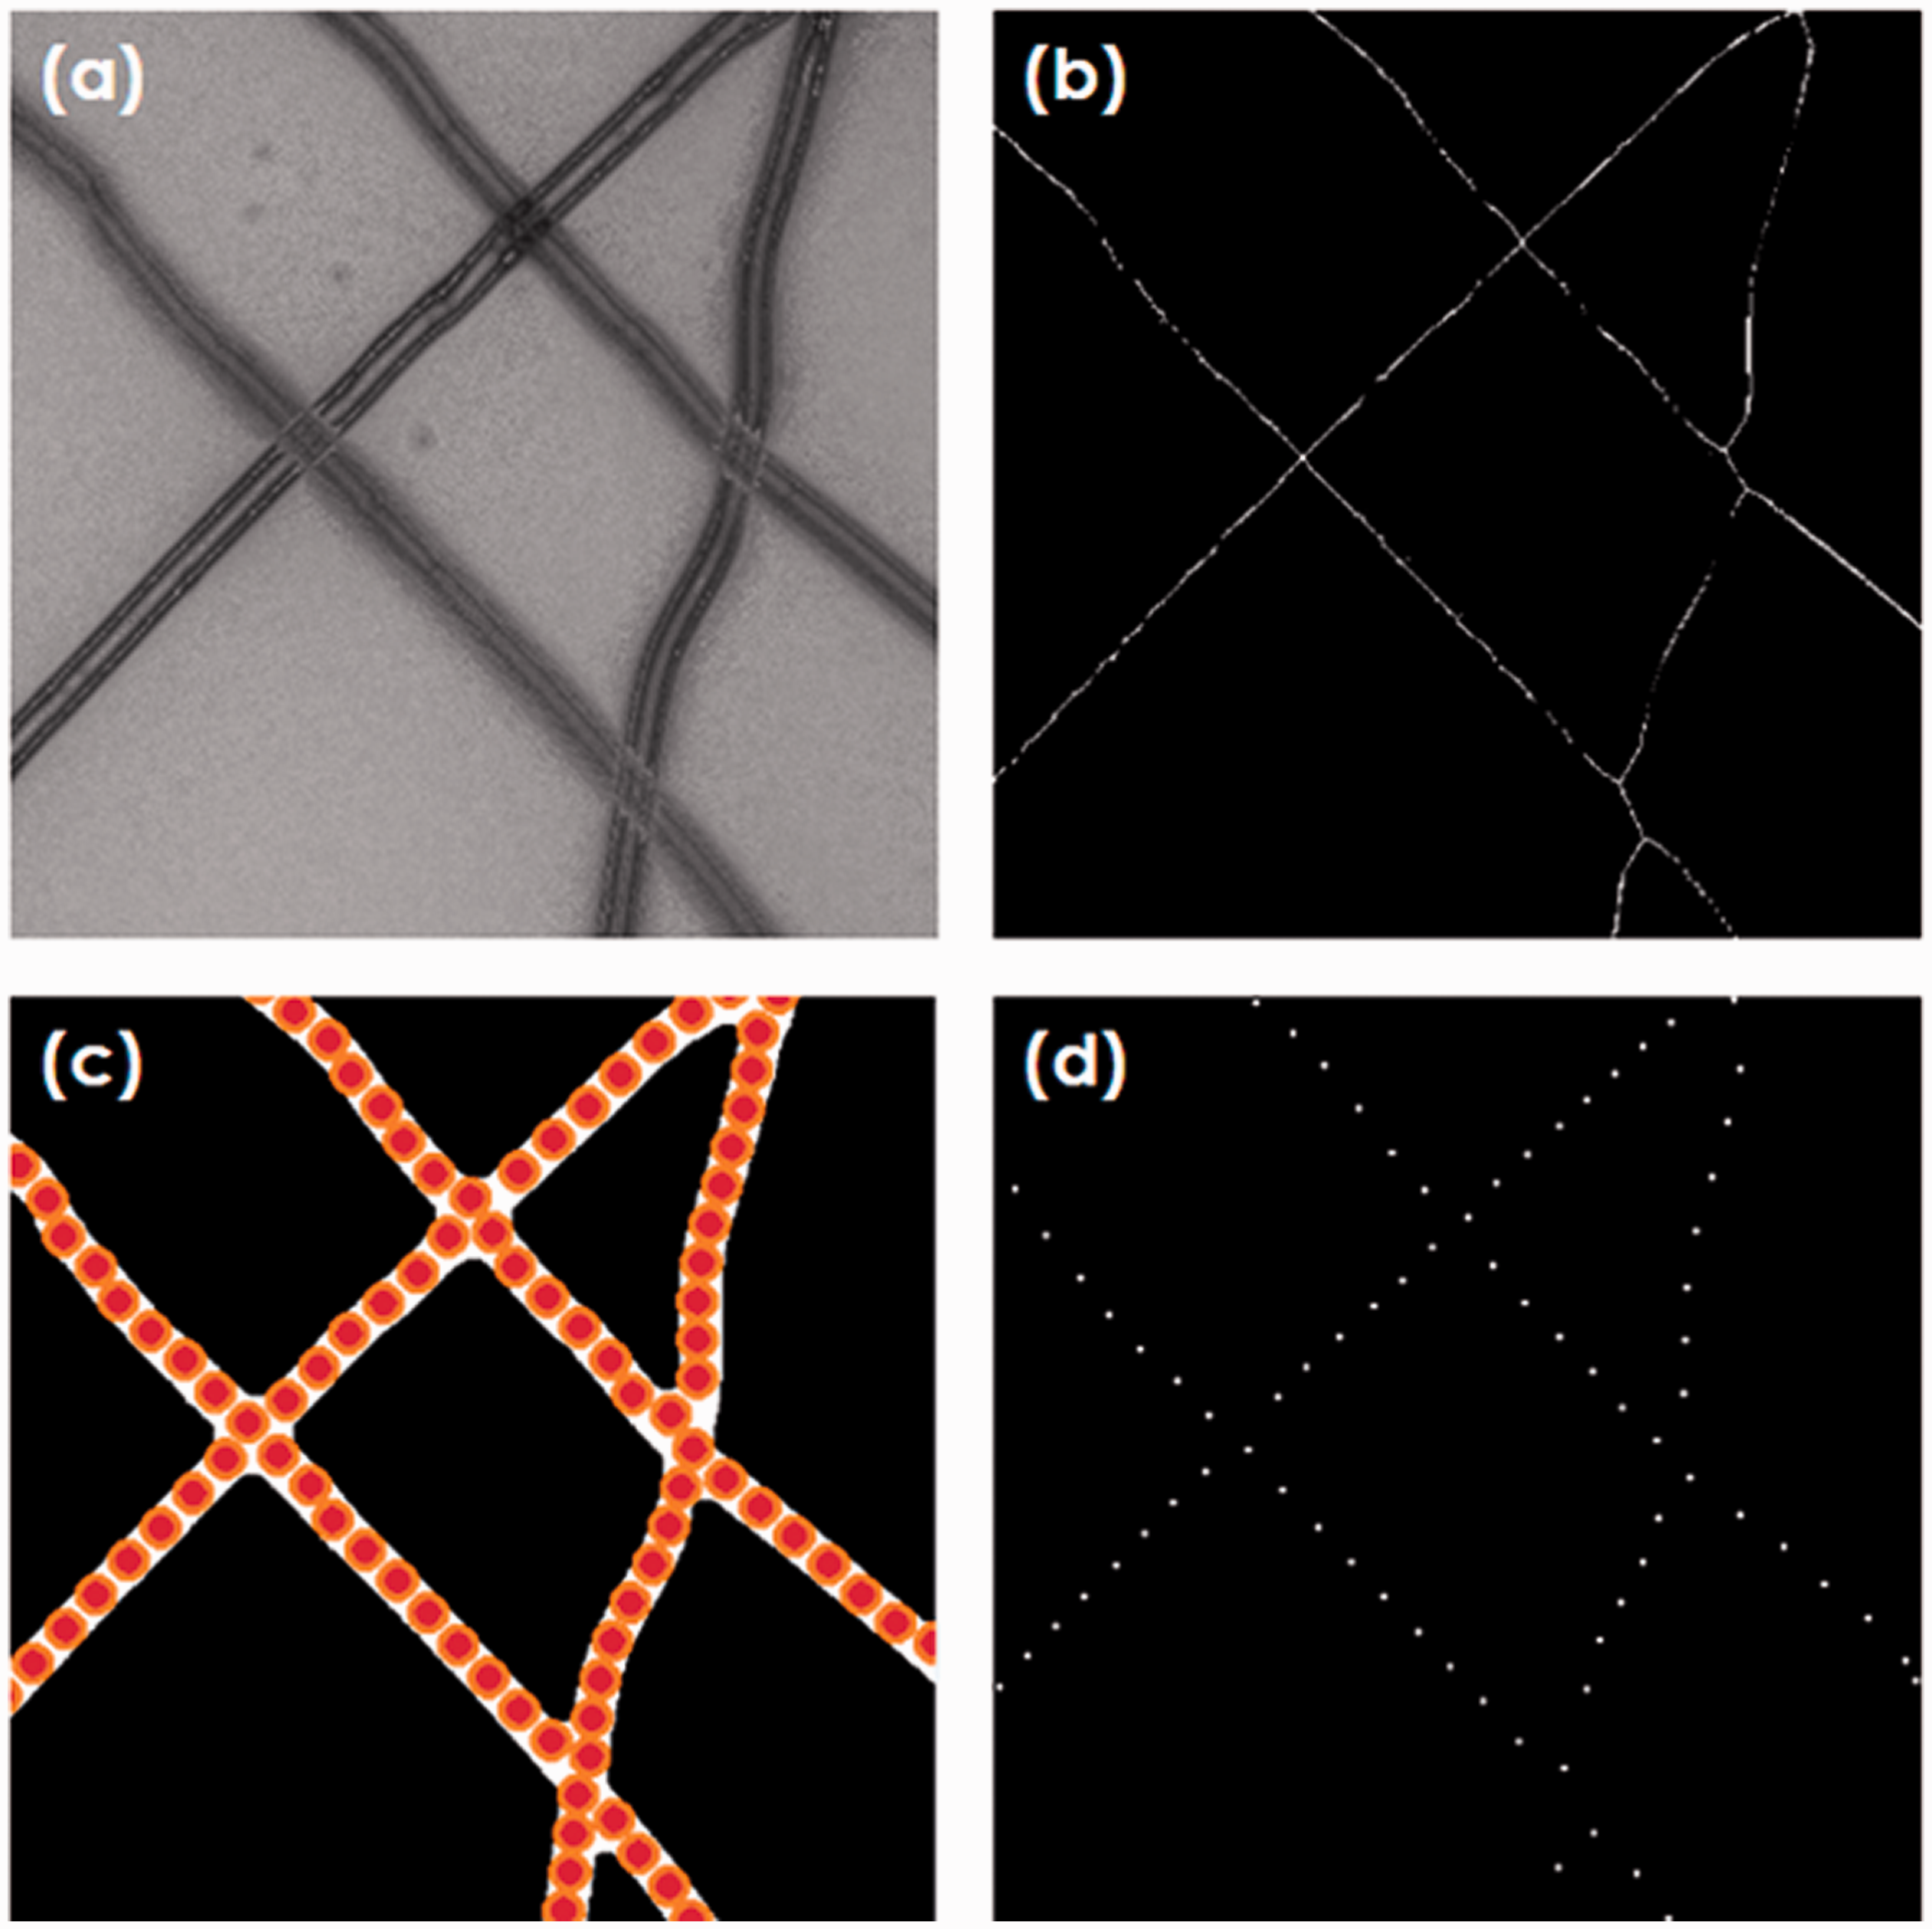
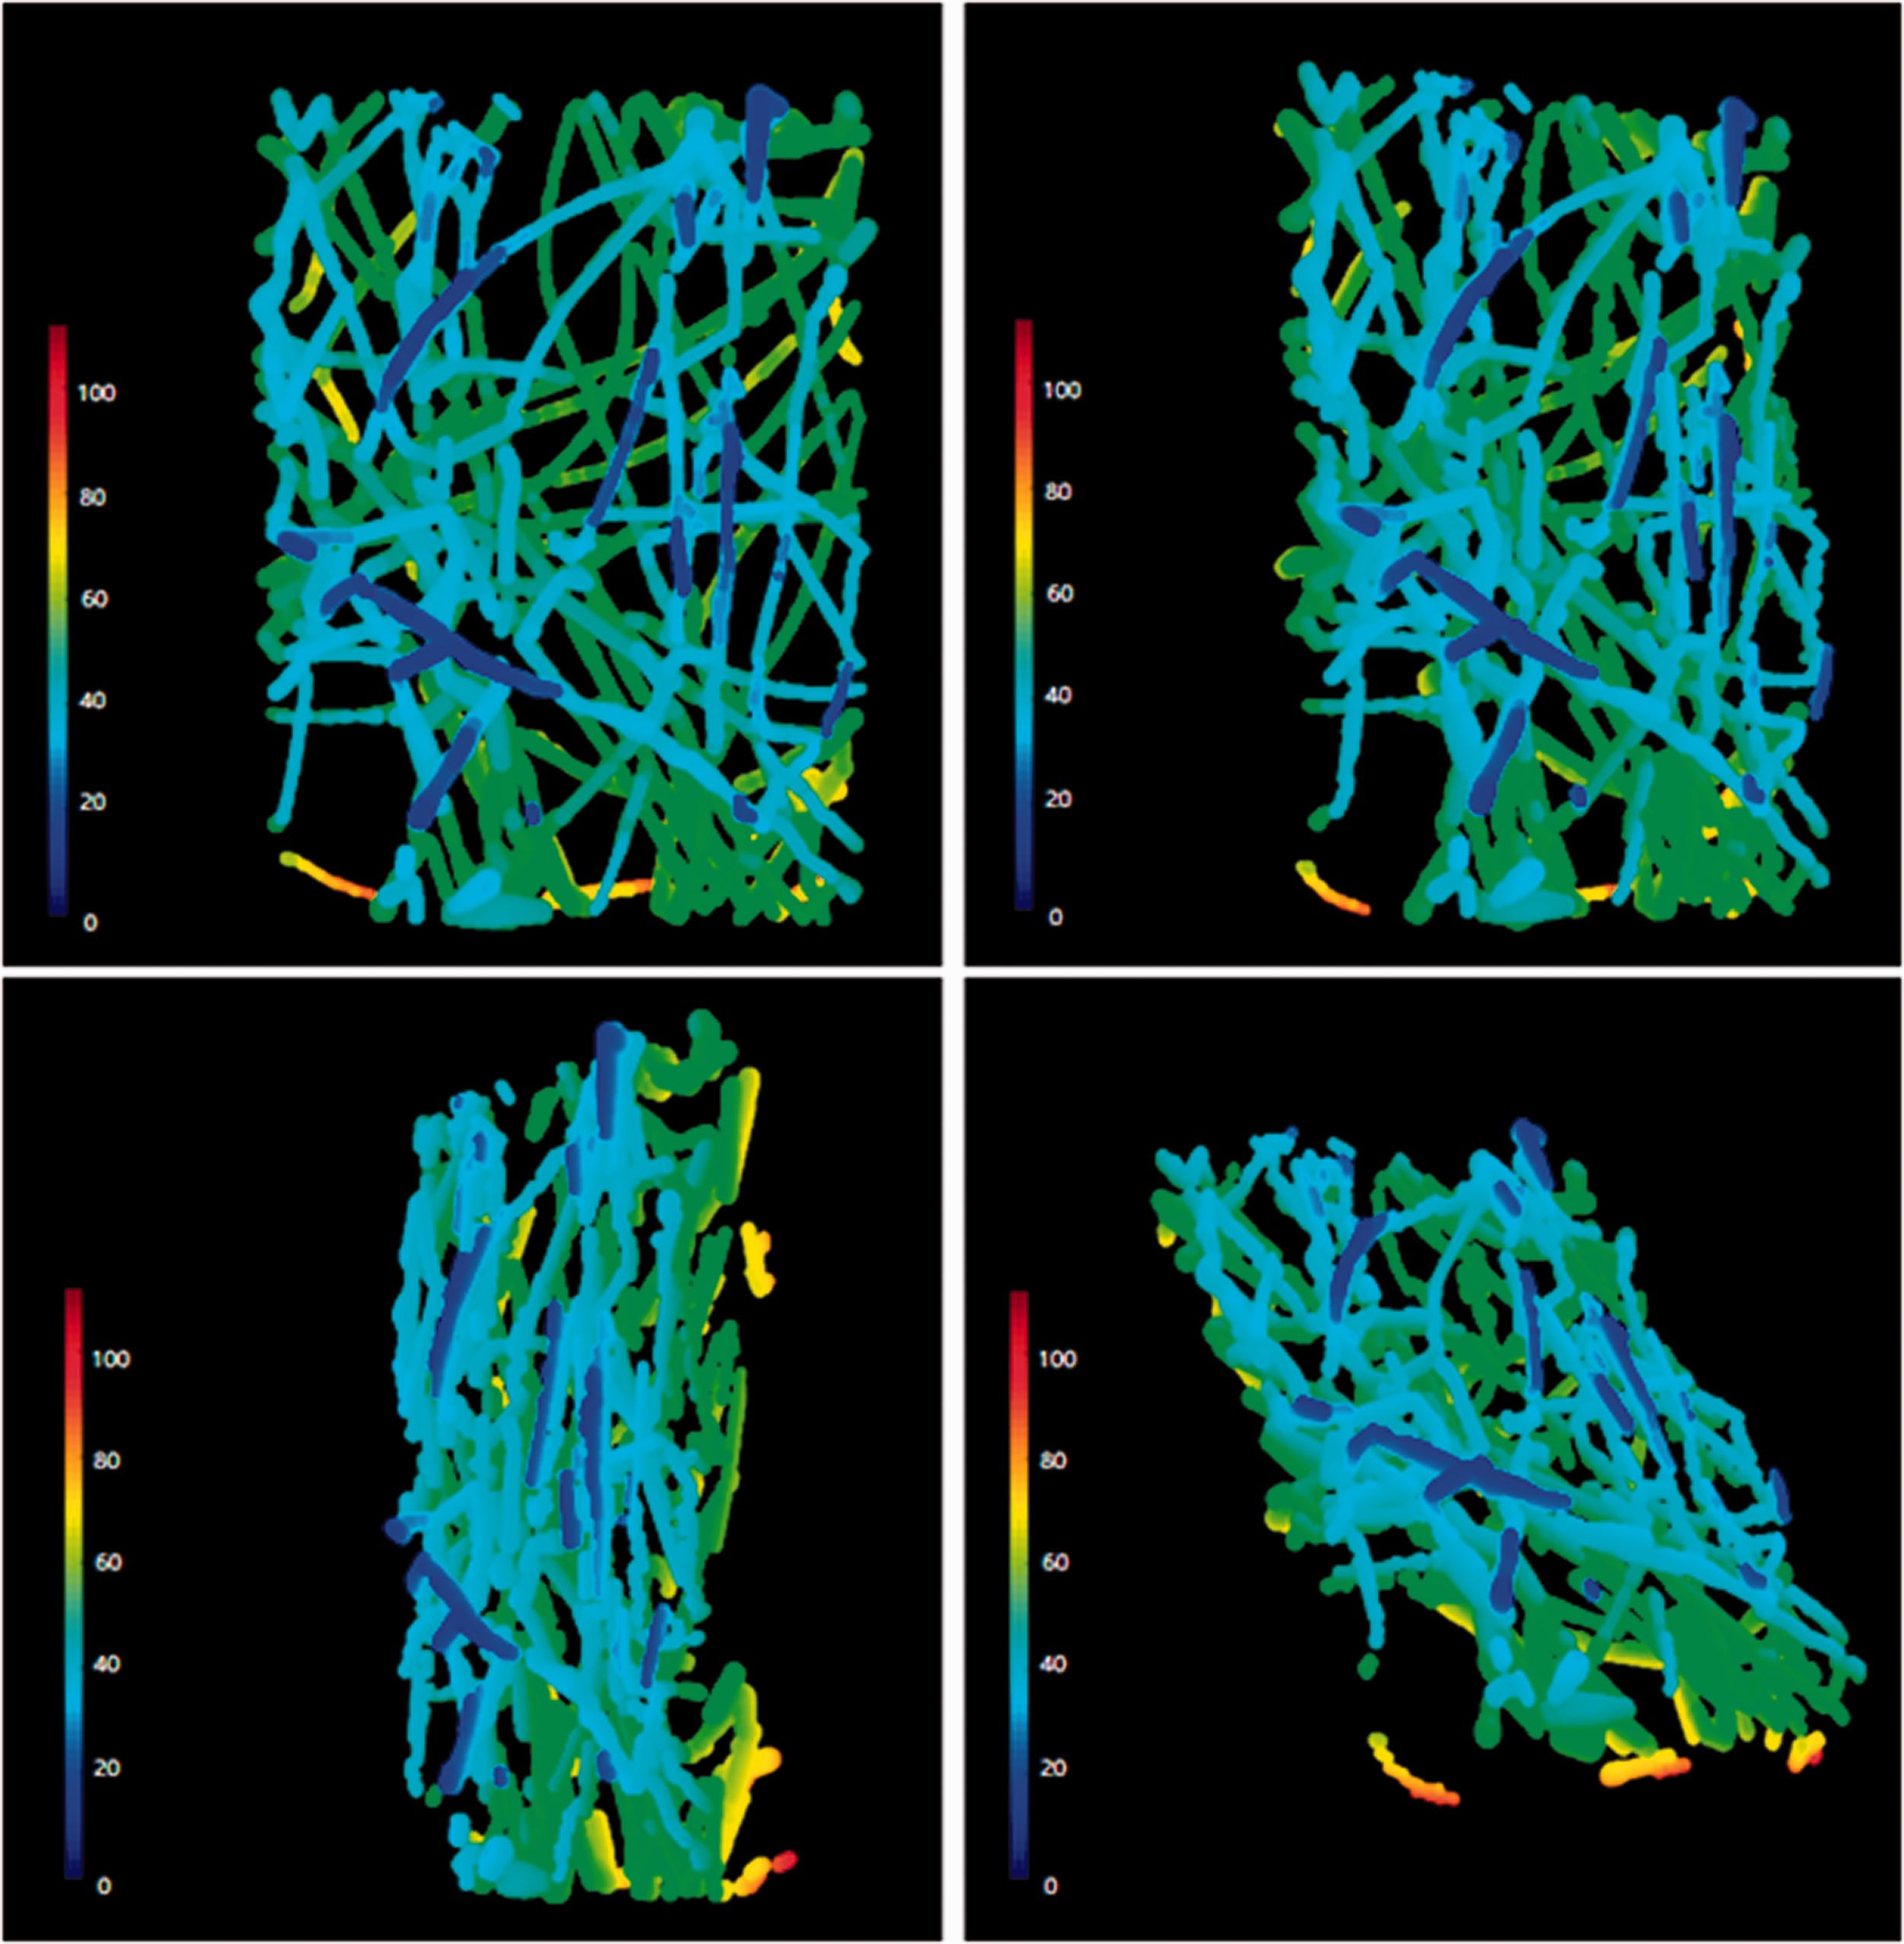
In this paper, a new method for the 3D structural reconstruction of nonwoven fabric is presented. The nonwoven fabric is placed on the glass slide under the microscope and digital camera to capture the multi-focus image, and nine examples of 120 multi-focus images are shown in Figure 2. The morphology processing and binarization processing are implemented on the multi-focus images achieved by the image-fusion technique (see Figure 3). To get the radius of the fiber, the algorithm of radius extraction is applied to the fused binary image. The radius image in which the gray value of each pixel on the fiber body represents the shortest distance from this pixel to the corresponding fiber edge is shown in Figure 5. After that, the method in this paper searches the pixel where the gray value is greater than the surrounding pixels in the radius image to extract the fiber midline and uses the circles to segment the fibers (see Figure 6). By determining the source point based on the segmented region and synthesizing the value of sharpness of all the pixels in each segmented region, the sharpness of the source point is represented. Therefore, the source point can be connected into the fiber axis with the information of the depth calculated by the projection of One-to-Many. Finally, the 3D structure of the nonwoven fabric is reconstructed by a sphere with the dynamic radius rolling along the fiber axis (see Figure 15). The results show that the algorithm proposed in this paper can better reconstruct the 3D structure of the nonwoven fabric. Compared with the reconstruction method of stacking edges by CNN (see figure 16(b)), the algorithm adds the structure of the fiber body and reconstructs the complete structure of each fiber (see figure 16(a)) rather than the hollowed-out edges. It provides a high-quality 3D model for the follow-up study of nonwoven key parameters, such as pore size and distribution, pore inner surface area, pore-volume, air–fluid resistance and differential pressure.
(a) The result of three-dimensional (3D) reconstruction in this paper and an enlarged window of a fiber section. (b) The result of 3D reconstruction in another method and an enlarged window of a fiber section.
The current nonwoven filter materials generally use electret nonwovens to achieve the high filtration and low resistance, and the electret can be added to the 3D structure model proposed in this paper to construct the 3D electrostatic model. In this electrostatic model, we can describe the changes of the motion trajectory of particles when they are affected by air flow, brown gravity, static electricity and other factors, and then explore whether they can hit the fiber surface. 25 The filtration resistance is studied by the continuous impact force of air molecules in the air flow impacting on this 3D electrostatic model. Therefore, this model can simulate the filtration mechanism of nonwovens and provide a new idea for the quantitative analysis of the performance of nonwoven air filtration materials. It provides a theoretical basis and data support for the structural design of filter media with high flux, high filtration efficiency and low resistance.
Footnotes
Declaration of conflicting interests
The author(s) declared no potential conflicts of interest with respect to the research, authorship, and/or publication of this article.
Funding
The author(s) disclosed receipt of the following financial support for the research, authorship, and/or publication of this article: This research was supported by the Natural Science Foundation of China (Grant Nos. 61771123 and 62171116), the Fundamental Research Funds for the Central Universities, China (Grant No. 2232020G-01).