
Abstract
Cotton fiber is mainly composed of cellulose, which is rarely separated into different kinds. However, the classification and identification of waste cotton from different countries are essential for the customs service of the country. In this study, the near-infrared classification method was introduced to classify and identify cotton fibers. Waste cotton samples from six different countries were collected, and one-fifth of them were used for validation. The near-infrared calibration and prediction models were constructed using both soft independent modeling of class analogy and partial least squares methods. It was found that the optimized model has a high recognition rate, and the prediction accuracy of the model was 99% for six countries. It was demonstrated that the near-infrared model established in this study can be used for fast and accurate identification of waste cotton from different countries.
Currently, the utilization of waste fibers in the textile area attracts worldwide attention, and many countries have built recycling systems to gather waste fibers from industry. The waste fibers, mostly waste cotton, can be used for producing regenerated fiber, composite and nanoparticles, or be used as padding materials.1–3 It is reported that more than 100,000 tons of waste cotton have been imported into China every year since 2009. 4 The imported waste cotton was generated from different countries; however, they were not well sorted by country after importation, which leads to potential difficulty in the following process. 5 Moreover, the identification of waste cotton from different countries is a mandatory requirement for the customs of many countries due to the potential toxic chemicals and microorganisms that could be in the waste cotton. Therefore, it is necessary to find a method to classify and identify waste cotton from different countries before utilization.
Waste cotton is mainly composed of cellulose, which contains different kinds and amounts of impurities due to its different sources. Some studies investigated a method to classify cotton qualities based on the foreign matter, fiber length, fiber fineness and maturity degree of the fiber.6–8 However, there is no standard or method to classify waste cotton origin in the world. Recently, the near-infrared (NIR) technique was found to have outstanding abilities for analyzing organic materials such as tobacco, grains and wood.9–12 Chemometric analysis can integrate NIR spectra and chemical/physical information (chemical composition content, category) of the samples to a model, then the successfully constructed model has the ability to predict the unknown samples by scanning the spectra.
The NIR technique has also been used to identify, classify and quantify textile fibers, cotton properties and even dyes, for which work was also investigated and reported.13–17 Therefore, it is hypothesized that the NIR technique has ability to classify waste cotton from different countries.
Traditionally, the separation of different samples using the NIR technique has mainly been based on the difference of chemical composition. However, it is difficult to build a high-quality prediction model when one chemical composition was higher than 95%. The high content of one chemical composition leads to difficulty in extracting useful information. In our previous studies, it was found that the NIR prediction model would be accurate and robust when combining a qualitative method, soft independent modeling of class analogy (SIMCA), and a quantitative method, partial least squares (PLS). Using the above methods, we have successfully predicted natural fibers, pulp and dyed cotton fabrics, in which the raw materials were all composed of cellulose.13–15,18
In this study, 350 waste cottons from six different countries were collected, the NIR spectra of the samples were scanned and analyzed then NIR models were constructed for classification. SIMCA and PLS methods were used to build the models, respectively. The correct recognition rate of the models for the calibration set and the prediction set samples was used for the evaluation of the models.
Experimental details
Sample preparation
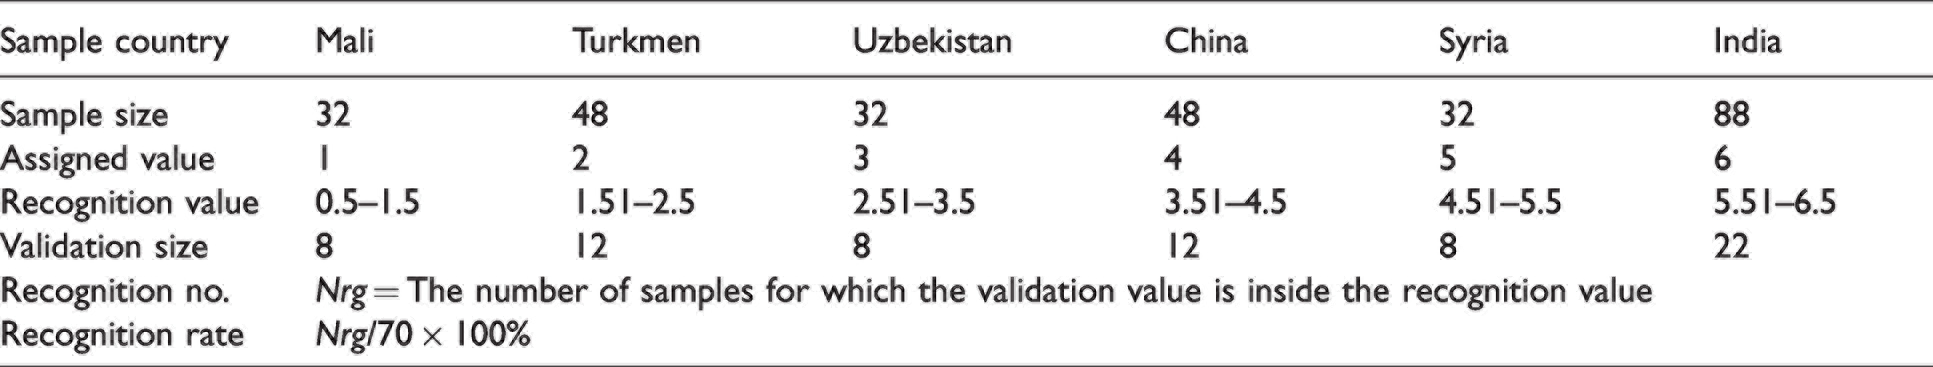
The samples were collected from six different countries, which yielded the most abundant waste cottons that were exported to China: 350 samples were randomly assigned to the ratio of 4:1, 280 samples were used as calibration and 70 samples were used for validation. The calibration set includes 32 Mali samples, 48 Turkmen samples, 32 Uzbekistan samples, 48 China samples, 32 Syria samples and 88 India samples; the prediction set includes 8 Mali samples, 12 Turkmen samples, 8 Uzbekistan samples, 12 China samples, 8 Syria samples and 22 India samples. All the samples were placed in ambient conditions for two weeks.
Cellulose content determination
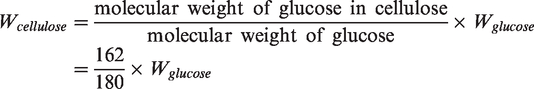
The cellulose content was characterized using the National Renewable Energy Laboratory (NREL) method with high-performance liquid chromatography (HPLC; Agilent 1260-II).19,20 Some 72% sulfuric acid was used at 30°C for 2 h to prehydrolyze the sample. The solution was then diluted to 4% sulfuric acid with distilled water, sealed in a bottle and placed in an autoclave for 1 h at 121°C. HPLC (Agilent 1260-II) was applied to determine the glucose content. Then the cellulose content can be calculated by the following equation, and the NIR model construction and validation procedure is as shown in Figure 1
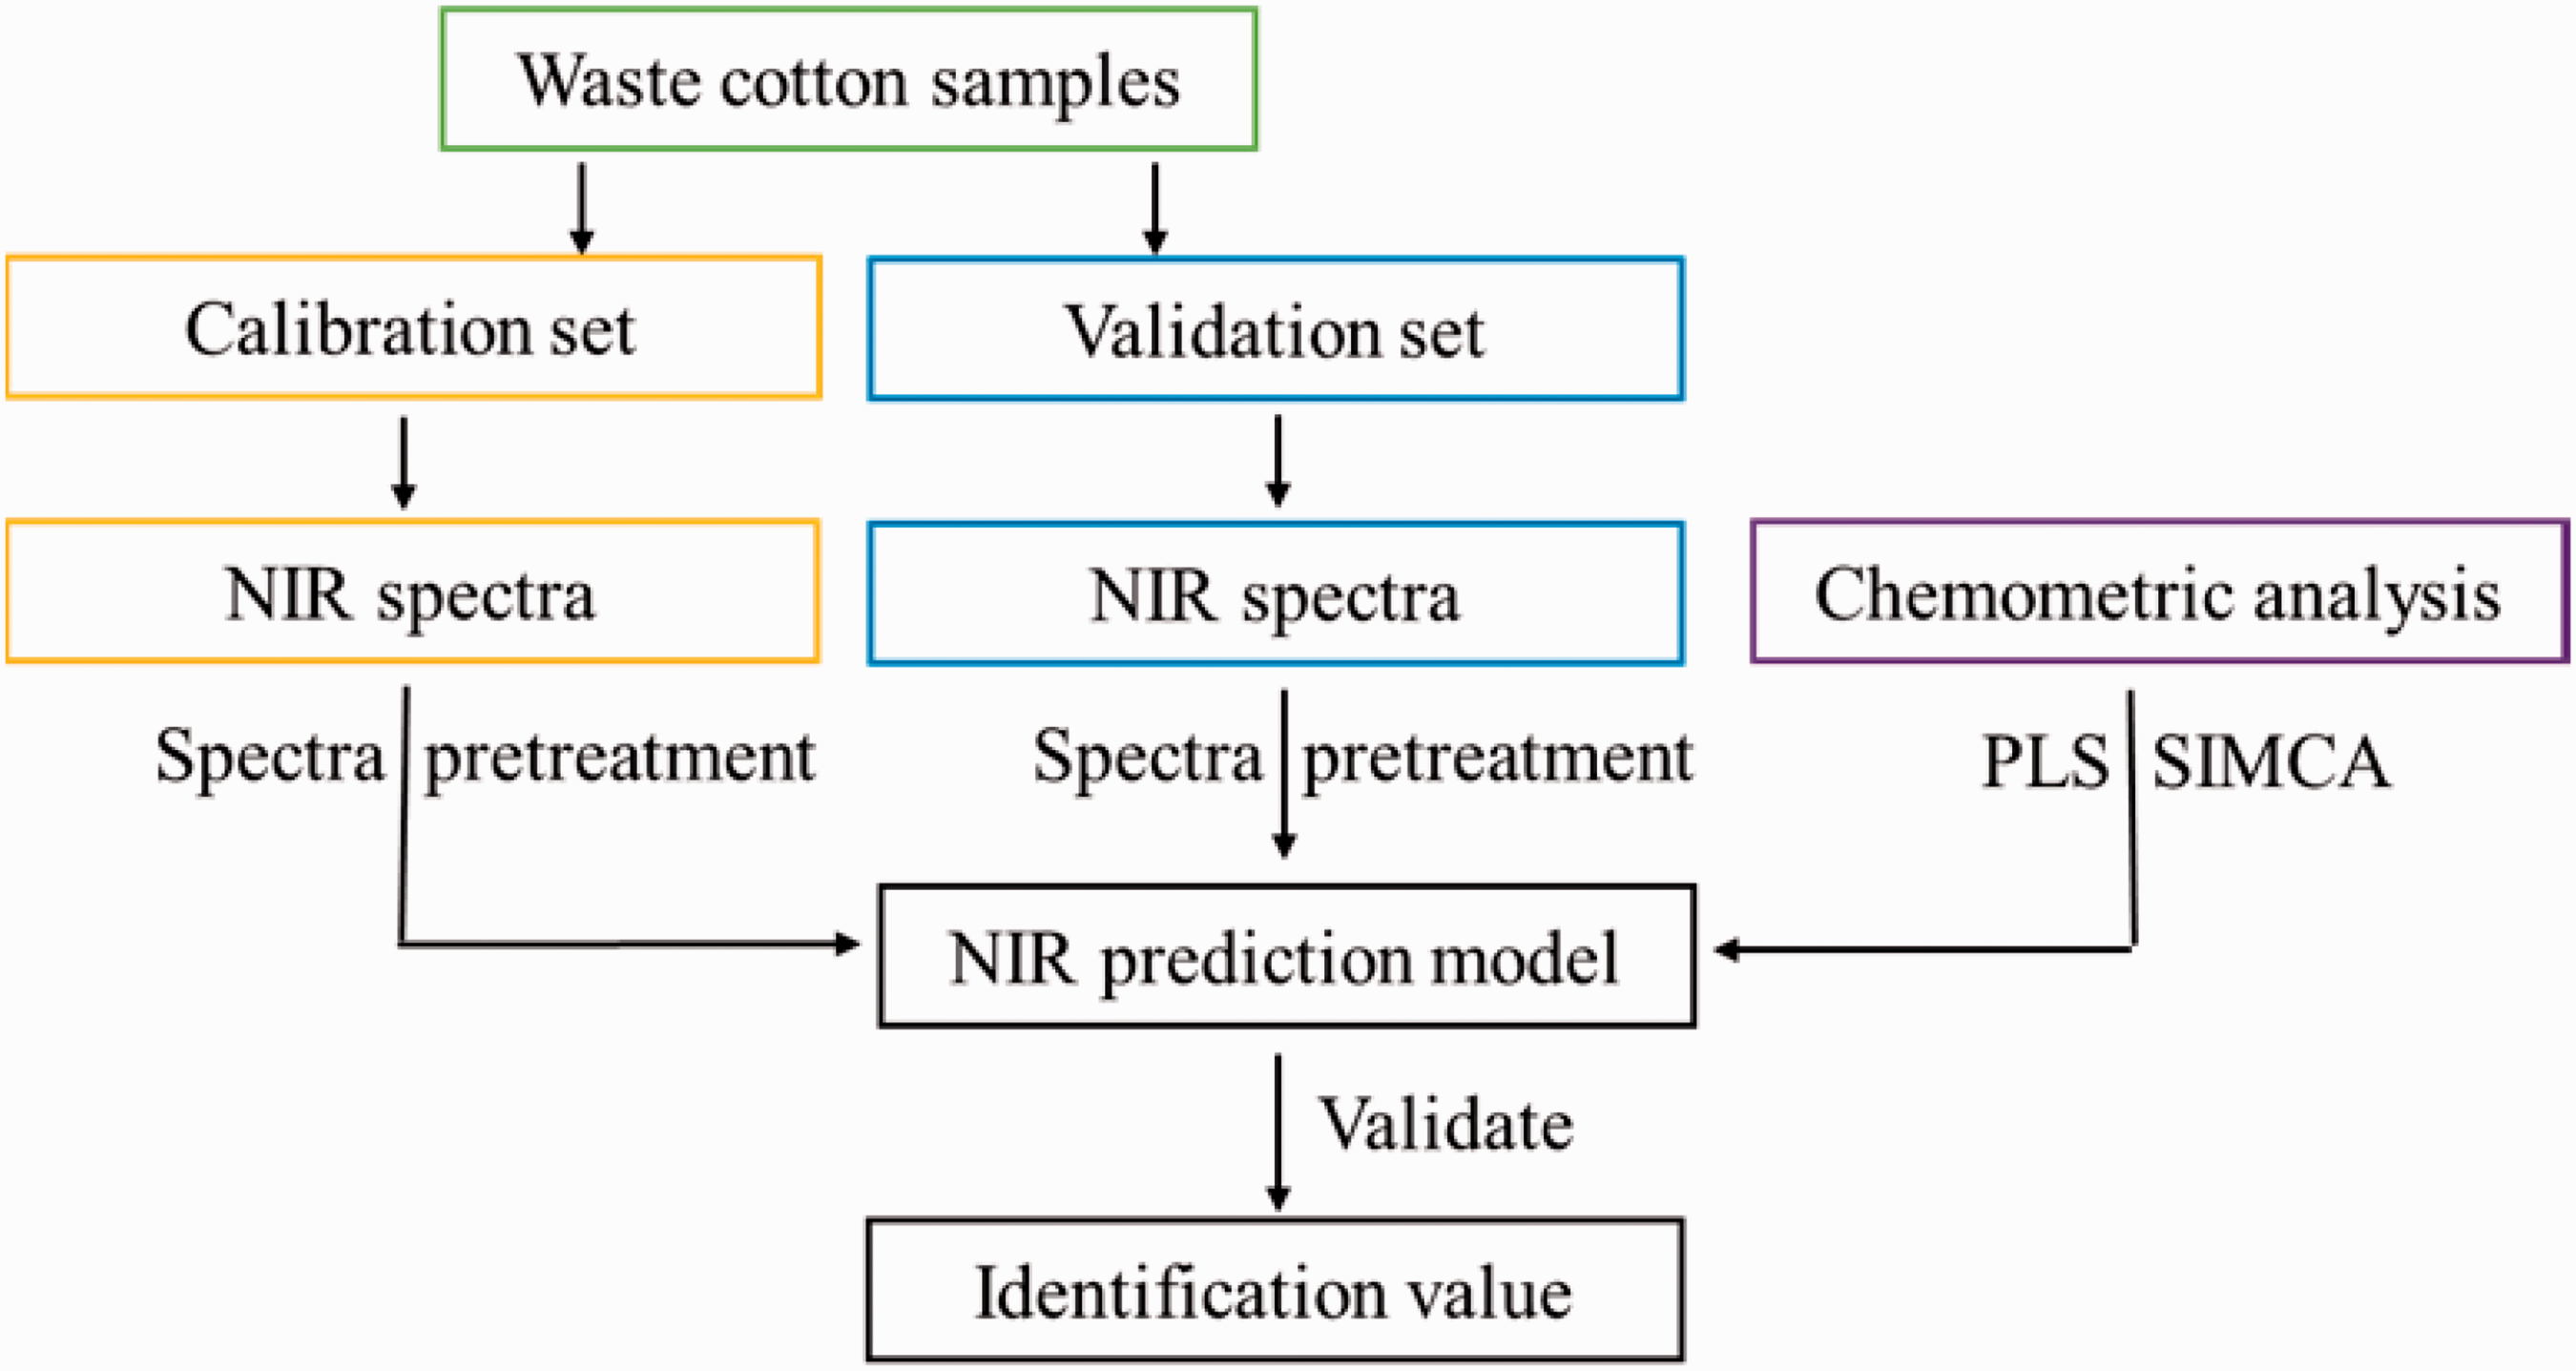
Near-infrared (NIR) model construction and validation procedure. PLS: partial least squares; SIMCA: soft independent modeling of class analogy.
NIR spectra collection and spectra pretreatment
Two grams of waste cotton fibers were combed by a comb and placed in the NIR detection window, which was pressed by tetrafluoroethylene tableting for NIR scanning. The NIR spectra were collected using a PerkinElmer Frontiers 400 NIR spectrometer, where the spectrum wavenumber range was from 10,000 to 4000 cm−1, the spectrum resolution was 2 cm−1, each sample was scanned 16 times and the average spectrum was used for model construction.
Prior to modeling, all of the spectra collected were pretreated using the Savitzky–Golay first derivative (SG 1st-Der). The pretreatment can effectively eliminate baseline drift, reduce the noise and reflect the difference between samples in detail.
NIR model construction
The NIR model for waste cotton was constructed as in our previous studies14,18; the spectrum quant + was used in this work and SIMCA and PLS were applied to construct the NIR model. SIMCA is a statistical method for the supervised classification of data. The samples in different species can be analyzed using principal components (PC) analysis. This method was used for the classification of thermally modified wood in a previous study.21,22
PLS is a traditional method that has been used in many studies.23–25 The assigned values of six countries using the PLS method are shown in Table 1.
Algorithm for classifying the samples of different countries partial least squares
Results and discussion
NIR spectra of waste cotton samples
The NIR spectra of the total 280 samples from six countries were collected. In order to facilitate the analysis of NIR spectra of different countries, 12 samples (two for each country) were randomly selected to conduct comparative analysis of NIR spectra of waste cotton in different countries (Figure 2). The NIR spectra showed a similar pattern, indicating that the waste cotton samples have the same chemical composition. This was agreed with the chemical analysis on waste cotton, in which it was found that the cellulose content was over 90%.
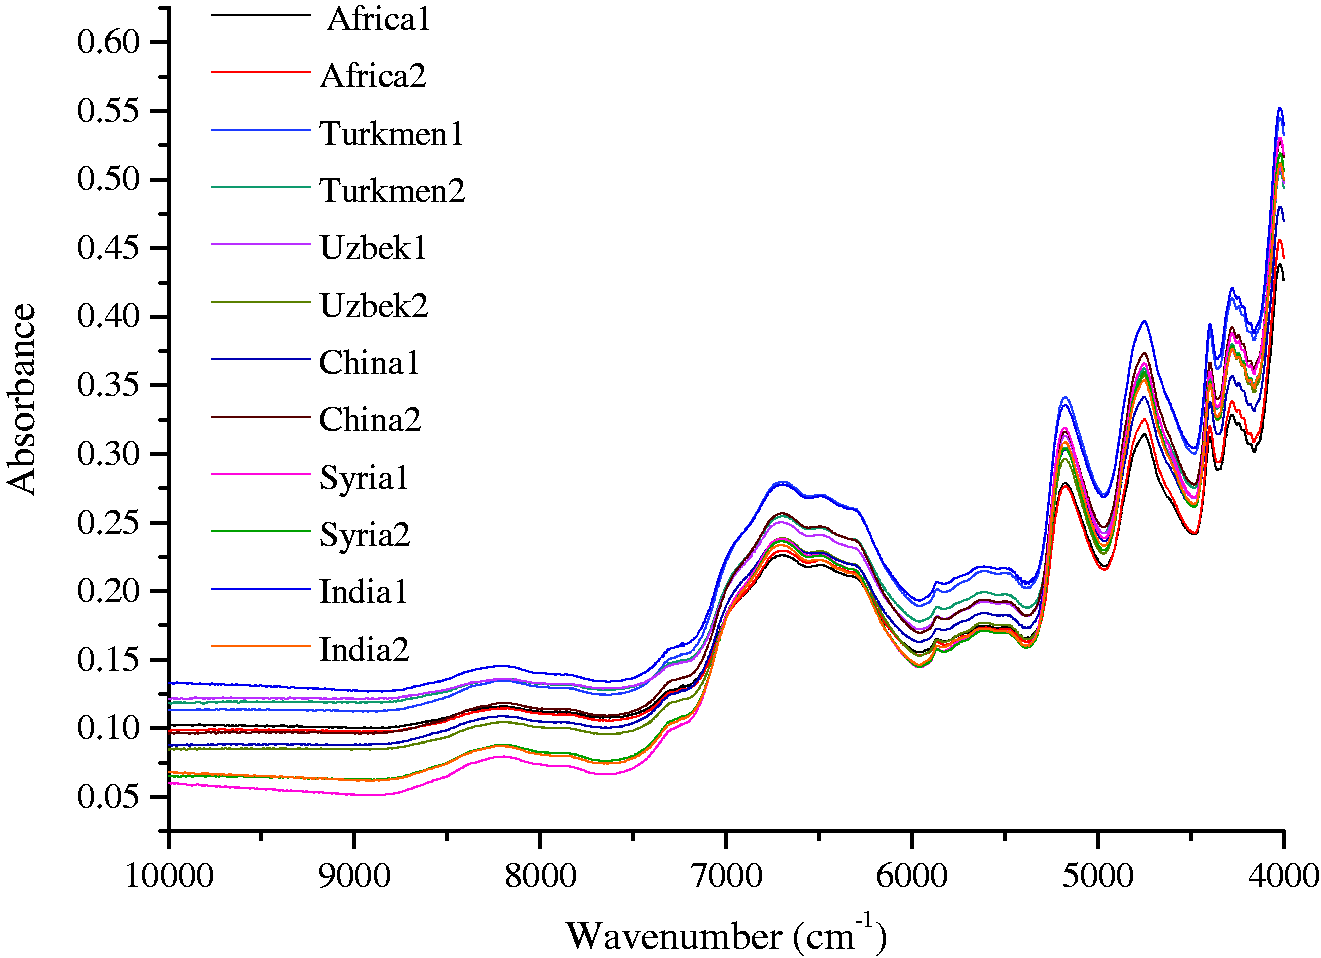
The near-infrared spectra of 12 waste cotton samples from different countries.
Waste cotton classification using the SIMCA method
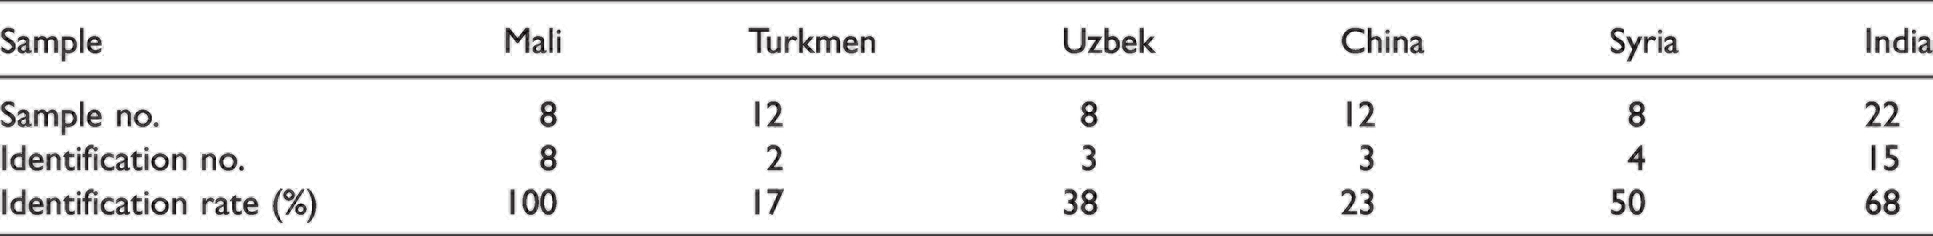
The NIR classification models were constructed using the SIMCA and PLS methods, separately. The SIMCA method was a traditional classification method for NIR model construction. The initial recognition rate and rejection rate of the calibration model are shown in Table 2 and the initial prediction ability is shown in Table 3. It was found that the rejection rates of the calibration model were lower than 80% for Mali samples and Turkmen samples, while the identification rates of the prediction model were lower than 70%, except for the Mali samples. The results in Tables 2 and 3 indicated that it is difficult to classify and identify waste cotton from different countries using the NIR technique without optimization.
Classification performance report using the soft independent modeling of class analogy method

Identification result of the soft independent modeling of class analogy method
To improve the ability of the NIR model, NIR spectra pretreatments were conducted and optimized. After optimization, the best classification model was generated by applying SG 1st-Der pretreatment on raw spectra, using the wavenumber ranges of 5050–4000 and 8400–6900 cm−1, which were found to be high correlated with cellulose in previous studies.12,26 It was found that the optimized models had a higher than 95% recognition rate and rejection rate for calibration (Table 4), and as high as a 94% correct identification rate for prediction (Table 5).
Classification performance report using the soft independent modeling of class analogy method

Identification result of the soft independent modeling of class analogy method
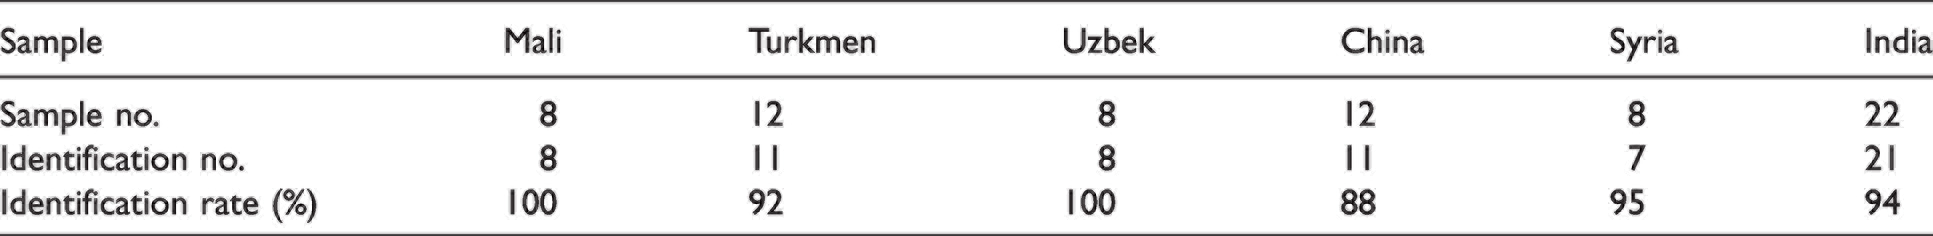
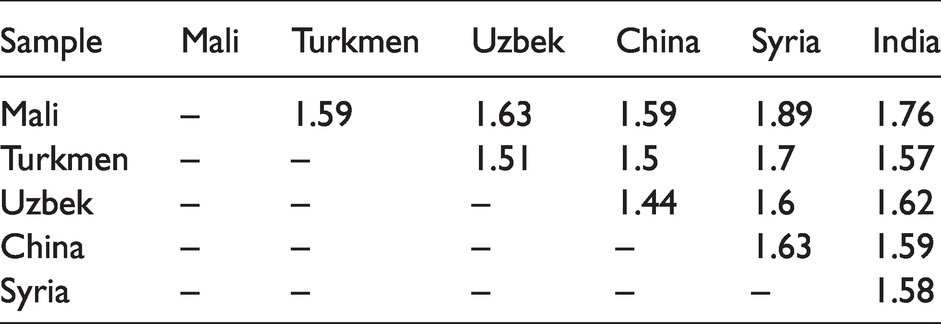
Table 6 shows the inter material distance (IMD) of the SIMCA model. IMD values represent the differences between the six types of waste cotton in the modeling analysis. There is an inverse relationship between the IMD value and the sample similarity. If the IMD value is higher, there will be more difference between the two species and they will be easier to classify and identify. In contrast, if the two species have similar ingredients, the IMD value will be lower and it will be difficult to distinguish them. As we can see from Table 6, all of the IMD values were low and, consistent with this fact, this was because the waste cotton contained more than 90% of cellulose.27,28 The above data show that the establishment of an accurate recognition model is critical. Only using the SIMCA method was not enough to build a high-quality model to separate the cotton fibers from different countries, so the PLS method should be investigated.
Inter material distance of the soft independent modeling of class analogy model
Waste cotton classification using the PLS method
The PLS method is a quantitative analysis method for the NIR model, which has abilities in analysis and model construction. As mentioned in the Experimental details section, the six different countries samples were assigned different values between 1 and 6, then they were applied for quantitative analysis; the results are shown in Table 7.
Results of partial least squares models before and after pretreatment
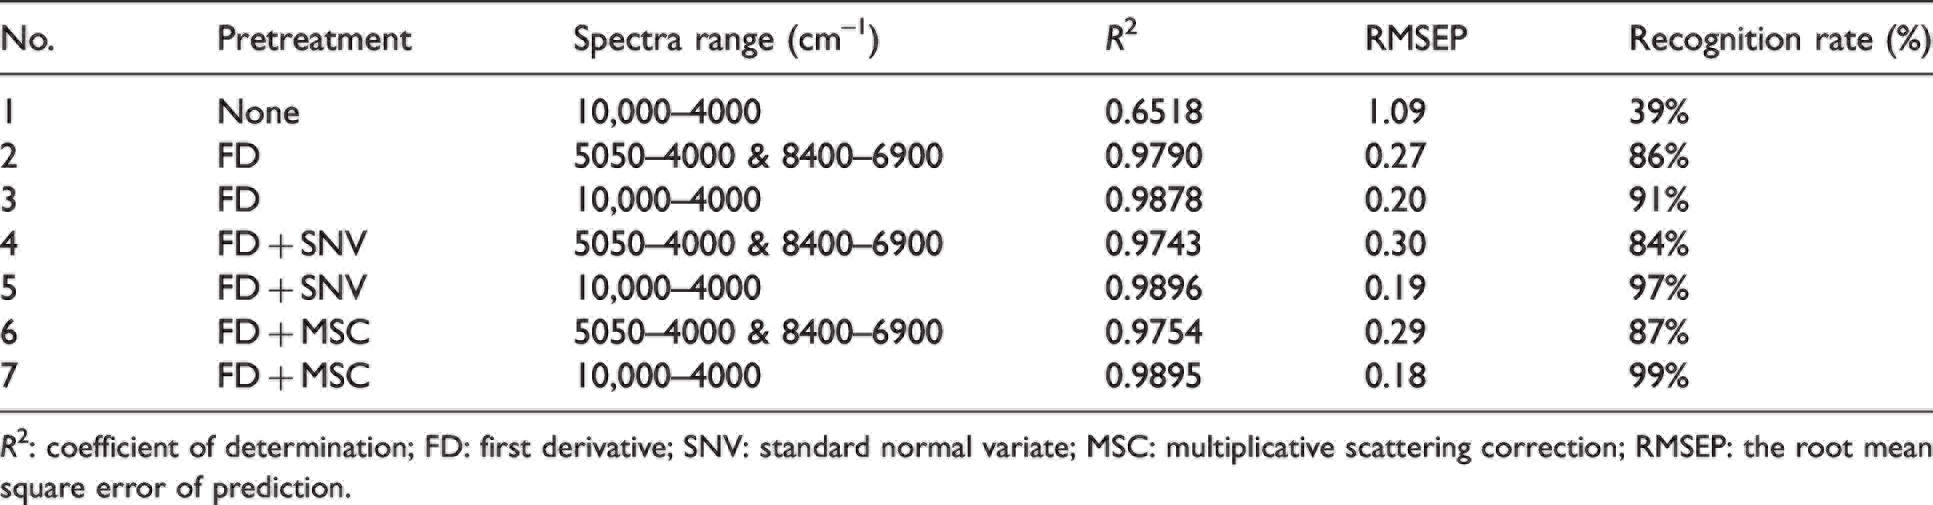
R2: coefficient of determination; FD: first derivative; SNV: standard normal variate; MSC: multiplicative scattering correction; RMSEP: the root mean square error of prediction.
It was found in Table 7 that without any pretreatment and wavenumber selection, the PLS model for cotton separation was poor; the R2 value was only 0.6518, while the recognition rate was only 39%. Therefore, the necessary pretreatment on spectra and wavenumber selection must be investigated. As optimized by the SIMCA method, the first derivative (FD) pretreatment coupled with the wavenumbers of cellulose, 5050–4000 and 8400–6900 cm−1, would be helpful for improving the model quality. Then, several pretreatments combinations were conducted to optimize the PLS model. Multiplication scattering correction (MSC) can effectively eliminate the scattering effect and enhance the spectral absorption information related to component content, while the standard normal variate (SNV) is mainly used to eliminate the influence of solid particle size, surface scattering and optical path variation on the NIR diffuse reflectance spectrum. After comparison, the optimized model was found using FD + MSC coupled with the full wavenumber range. The R2 was 0.9895 and the recognition rate was 99%.
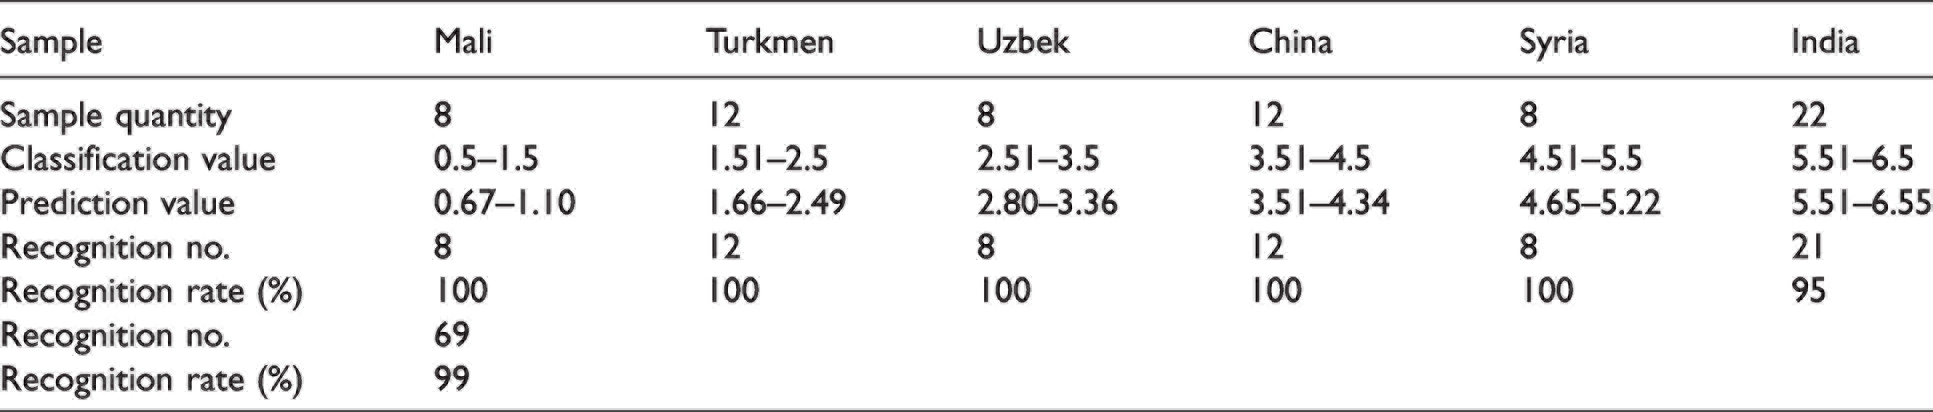
The calibration and validation results of the optimized model are shown in Figure 3 and Table 8. The correctly identified rate for the prediction model was higher than 99% for 70 validation sets. This result was good enough for waste cotton separation and identification.
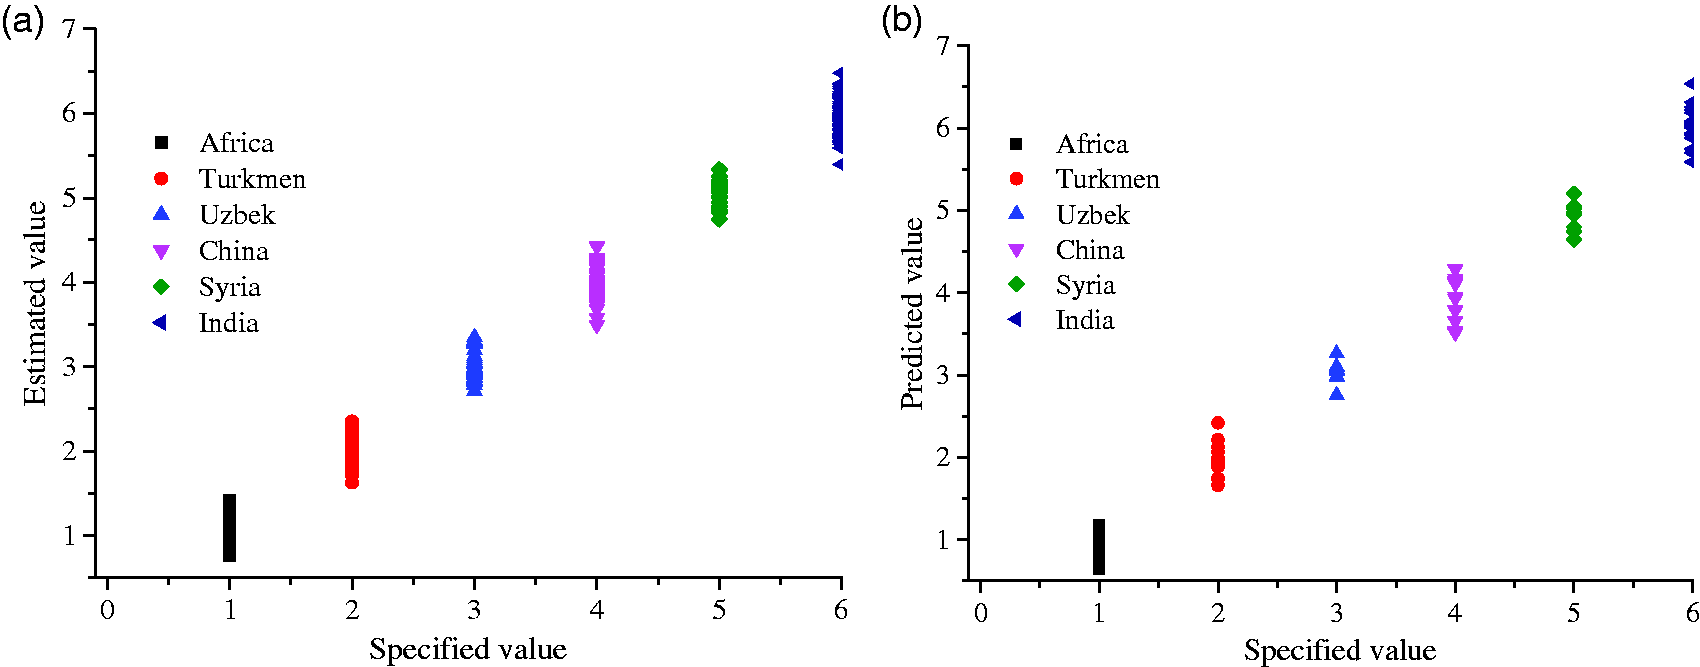
Calibration results (a) and external validation results and (b) of the partial least squares model.
The predicted results of the validation set sample using the partial least squares model
Conclusion
In order to realize the identification of waste cotton from different countries and improve the risk monitoring system of textile raw materials at customs, 350 waste cotton samples from six countries were collected by NIR spectroscopy, and the country screening model of waste cotton was constructed and tested by the cluster independent soft mode method (SIMCA) of cluster analysis and spectrum quant + medium PLS for quantitative analysis. The results show that the detection accuracies of waste cotton from six countries using the SIMCA modeling method and the PLS modeling method are 94% and 99%, respectively, which meet the requirements of rapid identification. This study found a fast and accurate method to separate waste cotton samples, which is a great help for the customs services of many countries. Future work should be focused on improving the accuracy of the model and increasing the modeled countries in order to give the method more applicability.
Footnotes
Declaration of conflicting interests
The author(s) declared no potential conflicts of interest with respect to the research, authorship, and/or publication of this article.
Funding
The author(s) disclosed receipt of the following financial support for the research, authorship and/or publication of this article: This work was supported by the National Key R & D Plan of China (2017YFF0108900), the Key R & D Plan of Shanxi Province (2018GY-140), the Scientific Research Plan Project of the General Administration of Customs in China (2019HK008), the Major Science and Technology Projects of the Xinjiang Autonomous Region (2020A03002-2, 2020A03002-3), the State Key Laboratory of Bio-Fibers and Eco-Textiles (2020ZKT21) and the Research Project of the Innovative Teaching Laboratory of Qingdao University (CXSYYB202011).