
Abstract
In this article, a sensing element for detection of date rape drugs in drinks is presented. The element consists of a three-dimensional printed holder, in which two embroidered electrodes have been fixed, forming a capacitive structure. As the dielectric properties of the liquid between these electrodes’ changes, the capacitance and consequently the impedance are changed. For experimental purposes, diazepam, a model rape drug, sucrose, and sodium chloride, which are used as control ingredients, were dissolved in a 40% V/V alcoholic beverage, serving as solutions for testing and comparison. The selectivity, repeatability, and sensitivity of the proposed sensor were tested. The sensitivity of detection of 1 mg/ml of diazepam in drinks was 0.92628 Ωl/mg, sucrose was 0.94774 Ωl/mg and sodium chloride was 2.46867 Ωl/mg, at 1 MHz. Moreover, with the use of the Cole impedance model, the selectivity of the sensor in the detection of diazepam, through the Nyquist plot and parameter estimation, has been achieved. Sensor repeatability was calculated through the relative standard deviation with the result for 1 mg/ml of diazepam dissolved in alcohol on 1 MHz being 2.48, in terms of impedance modulus. The presented sensor platform can successfully detect drugs in drinks and can protect from many cases of such assaults in a real world.
In the past few years, thousands of incidents of drug facilitated sexual assault (DFSA) have been reported by people of both sexes (commonly women) who were victims under the influence of sedation drugs. DFSA entails providing a person with a drug of the anesthetic variety in order to render a casualty physically debilitated or powerless and hence unfit to give or withhold consent. 1 The victims of sexual violence are usually adolescents and young adults, predominantly women, and the crimes are common in places frequented by the youth such as bars, nightclubs, social parties, and dormitories. 2 Alcohol is primarily utilized to facilitate this crime, since it is widely accessible and is mostly taken voluntarily by the victims. The perpetrator, who might not be in a relationship with the victim, secretly alters the drink of the victim with a sedative or rape drug, making it stronger without them knowing, with the goal of having absolute control over the victim. 3 Those drinks, also called spiked drinks, have intoxicating or inhibiting substances added, for the purpose of drugging a potential victim. 4 Studies indicate that at least 1 in 6 American women and also 1 in 33 men are survivors of completed or attempted sexual assault during their lifetime. 5 The victim's use of drugs or alcohol may be voluntary or involuntary, which can lead to a decreased ability to refuse sex and defend against rape or other forms of sexual assault. In a significant national study conducted in 2007, it was found that 2.3% of women (2.6 m) reported experiencing alcohol or drug-facilitated rape after involuntary use, while 2.8% (3.1 m) reported such incidents after voluntary substance use at some point in their life. 6 The administered psychoactive substances, used in DFSA, that cause physiological effects which in turn restrict or relax muscle movement and provide loss of consciousness, 6 are known as date rape drugs (DRDs). Since most of the DRDs have a short half-life (i.e. they are rapidly absorbed and metabolized by the body) which consequently makes them hard to track, the lack of adequate instrumentation for detection is also a major factor.7,8 Therefore, there is a need to develop an easy-to-use, portable and low-cost, wearable electronic device for rapid and on-site detection of drugs in drinks.
Knowing the types of DRDs and their side effects can be useful to prevent sexual violence. The most common DRDs, in liquid and capsule forms, widely used in drug-facilitated crimes are flunitrazepam (FLU), chloral hydrate (CH), and ketamine (KET).9,10 Usually, alcoholic drinks alone, or in combination with other drugs to amplify or boost the medicine’s effects, are used. FLU is a strong benzodiazepine commonly used for the treatment of anxiety or sleep disorders.11,12 Another typical substance used to facilitate date rape is chloral hydrate, which is also occasionally used to alleviate sleeplessness before or after surgery. Ketamine is an anesthetic drug that acts almost immediately to cause feelings of relaxation and derealization.12,13 DRDs are also called club drugs, and they are colorless, odorless, tasteless pills, which easily dissolve in drinks and are quickly metabolized by the victim’s body without leaving a trace, which makes them very difficult to detect.7,14
Different techniques with portable and/or disposable systems have been explored for the analysis and determination of DRDs in drinks. These include gas chromatography, 15 spectrophotometry, 16 and liquid chromatography 17 coupled with mass spectrometry, which has been applied for the determination of KET and its metabolites in biological samples such as urine. 18 However, these methods require a large number of samples and reagents, access to centralized laboratories, a longer time of training for the analyst, and are costly because of their sophisticated instrumentation.19,20 As opposed to these requirement, the modern trend for miniaturized, low power, and low-cost portable devices has led to the development of electrochemical sensors for screening of drugs of abuse. In recent years, paper-based electrochemical analytical devices (ePADs) have received significant attention from the scientific community,21,22 mainly because they can be made from low-cost and biocompatible materials, and present good analytical performance. 23 Various techniques including inkjet printing, pencil drawing, stencil-printing, and screen printing have been proposed in the literature24,25 for manufacturing of ePADs. Additive manufacturing (also called three-dimensional (3D) printing) is another emerging technology used for the development of analytical devices such as electrochemical sensors, microfluidic devices with integrated sensing electrodes, and wearable sensors,26,27 among others. A pencil-drawn and paper-based electrochemical analytical device was applied for the detection of KET in diluted whiskey samples for forensic interest. 28 Research works have also reported that voltametric determination of FLU in drinks using graphite screen-printed electrodes modified with Fe nanoparticles (to enhance sensitivity) has been developed 12 as well as methods with glucose oxidase or with glucose (to alleviate oxygen interference). 29 However, due to the relatively complex fabrication of sensors and the use of expensive enzymes, these methods are limited to routine forensic drug analysis. In addition, many of the existing DRD sensors are designed to be applicable for a single-drug detection, utilizing tests that call for reagent addition and sample preparation, making them inadequate for quick, on-the-spot determinations of whether a drink is clear of drugs.
Here, we developed two capacitive electrodes using a digital embroidery technique and silver conductive threads on woven cotton textile substrate. The fabricated textile capacitive electrodes were then coupled for the first time onto a reusable 3D printed holder for multiple purposes, such as electrical contact isolation and geometric area delimitation aiming to decrease and/or slow the sample evaporation rate. In order to demonstrate its functionality for the forensic drug detection applications, the fabricated textile-based wearable device assembled on a 3D-printed holder was explored for the analysis and determination of diazepam in different solutions and various concentrations. The impedance modulus and phase angle were measured with the hypothesis of detecting an increase in phase angle, and decrease in impedance with increase of the substance of interest in the solution.
Materials and methods
In this section, the fabrication process is described in detail, after which the complete experimental setup is presented.
Design and fabrication
The 3D printed cylinders were designed in AutoCAD Mechanical and printed on a DLP/SLA 3D Printer, model Photon Mono SE. This holder was cylindrical in shape and had two walls – one internal and one external. We designed capacitive interdigitated electrodes (IDEs) using fabric as a substrate and the embroidery machine JCZA 0109 (ZSK, Germany) was used to embroider silver conductive fingers and silver thread-based terminals. One IDE structure was longer, and it was positioned on the inner side of the external wall of the 3D printed holder. Another IDE structure was shorter, and it was positioned on the outer side of internal wall of the 3D printed holder. The structures are presented in Figure 1. In this way, we created a capacitive sensor in the cylindrical shape and the tested fluid was dielectric between these two textile-based electrodes. By measuring the variation of capacitance, through the phase angle and impedance modulus, due to changes in dielectric constant of the fluid inside, we can detect the type of the fluid. The total production time depends on the cylindrical 3D printed holder, as the automatic process of embroidery of the electrodes only takes a few minutes.
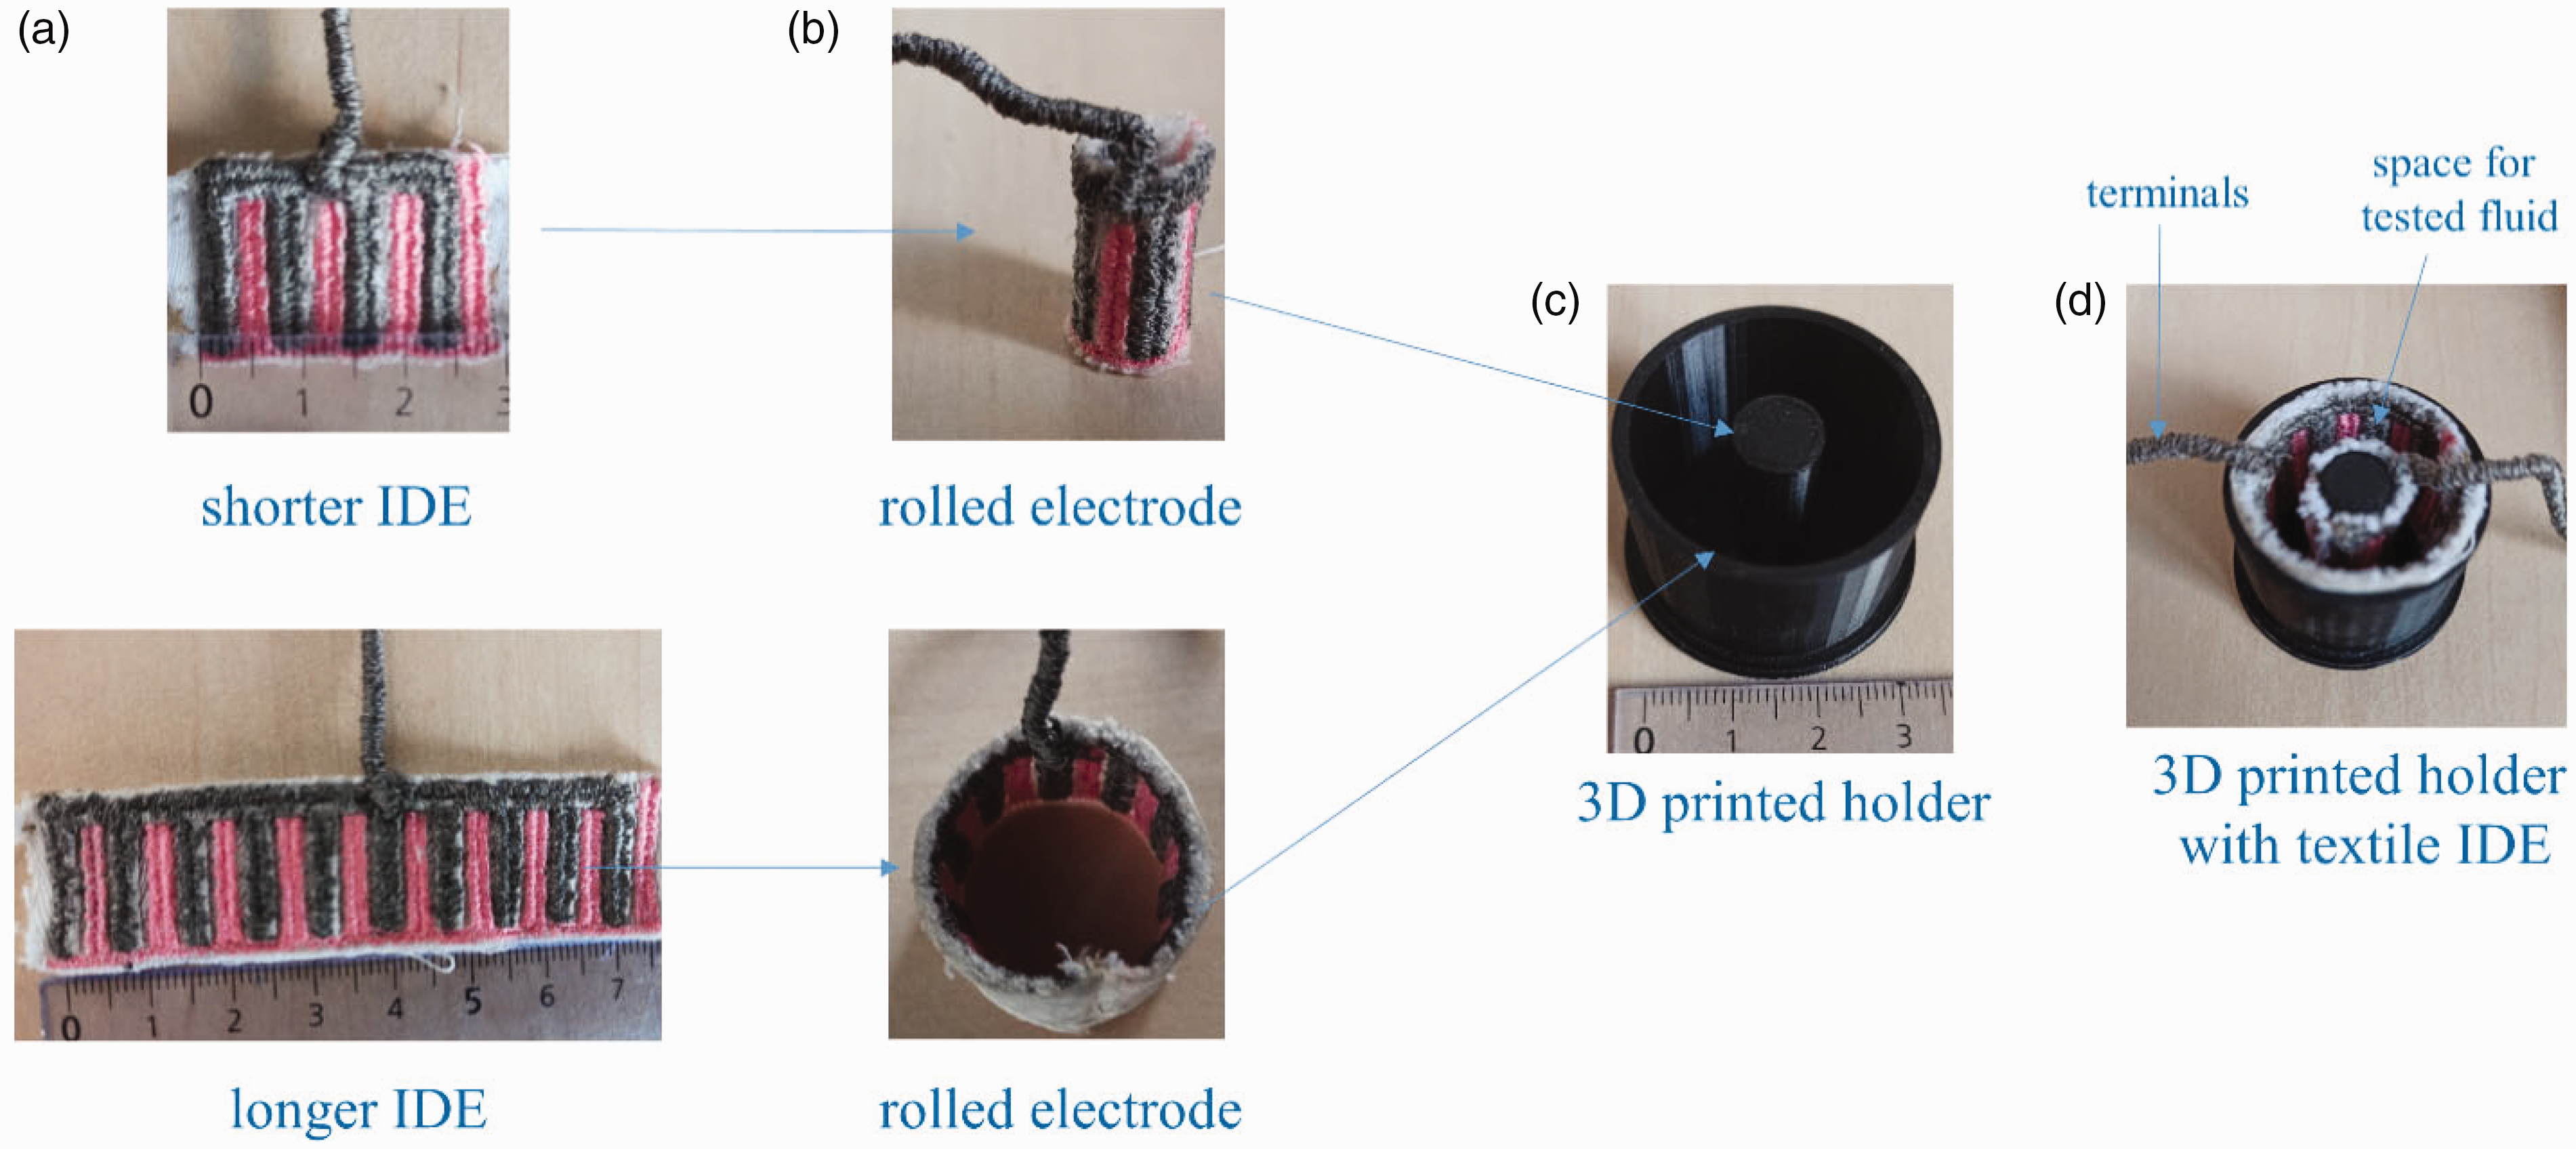
(a) Textile-based interdigitated electrodes (IDEs); (b) rolled IDEs; (c) 3D printed holder and (d) the position of textile IDEs into the holder, forming final design of the capacitive sensor in cylindrical shape.
Analysis of the embroidered structure under scanning electron microscope and optical profilometer
For evaluation purposes, especially for the contact area of the non-conductive and conductive parts of the aforementioned embroidered electrodes, an optical profilometer HRM300 (Huvitz, Republic of Korea), was utilized. After that, the scanning electron microscope JSM 6460 (Jeol, Japan), was used for element analysis.
Preparation of samples for testing
In order to mimic the real situation, a strong alcoholic beverage containing 40% V/V of alcohol was selected as a model beverage, which could be drunk in an average portion of 20 ml (a “shot”). Accordingly, the test samples were prepared by dissolving 10, 15, or 20 mg of diazepam in 20 ml of the alcoholic beverage, rendering solutions containing 0.50, 0.75, and 1.00 mg/ml of diazepam, respectively. In this manner, the sensitivity of the designed sensors could be evaluated. In addition, as negative controls, solutions of sucrose and NaCl were prepared in the same manner. These compounds were selected as they are common ingredients of cocktails consumed in night clubs and could serve as the discriminatory potential/selectivity of the sensors to detect only the compounds of interest. Pure alcoholic beverage (without dissolved ingredients) was used as a blank.
Experimental setup and measurement
The measurement process was carried out using HIOKI IM7585, a high-range impedance analyzer, with the measurement capability of up to 600 MHz. Given that, the targeted range for this experiment will be from 1–20 MHz. Figure 2 depicts the experimental setup, which consists of the aforementioned high-range impedance analyzer, sample holder, as well as a pipette, used for liquid transportation between the containers, and tested samples.
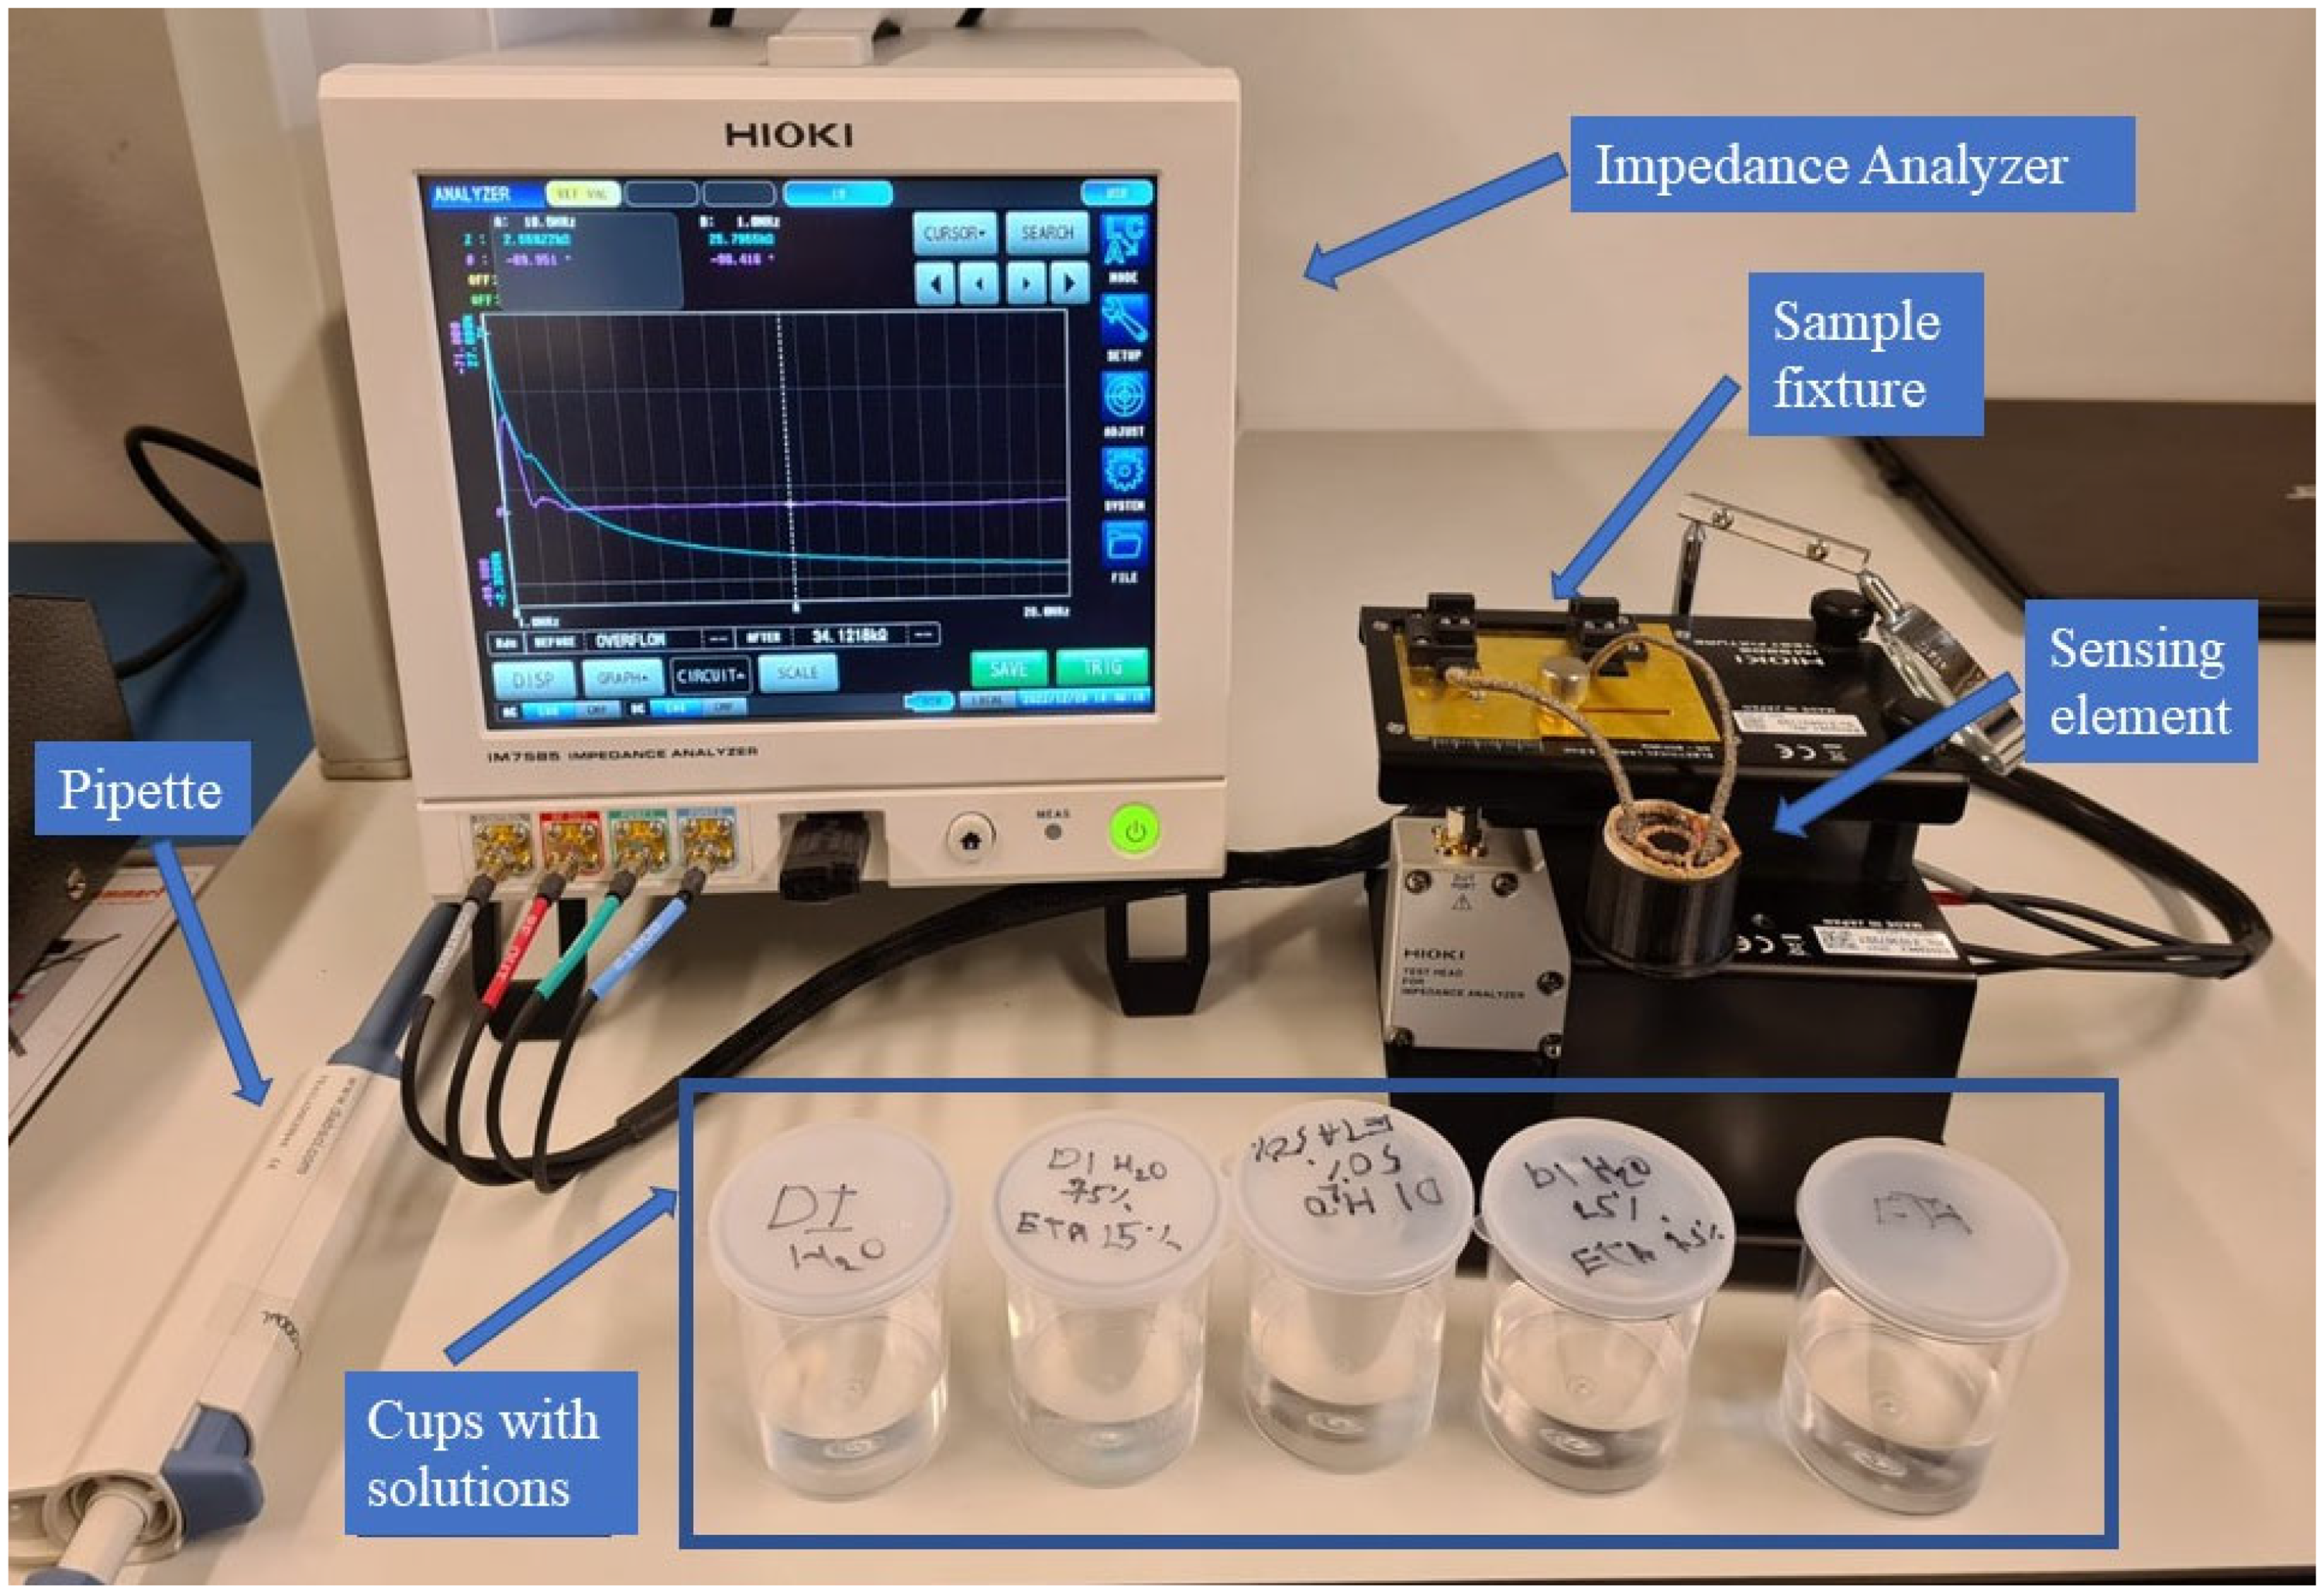
Experimental setup.
Each sample was tested three times, with each of the following substances: a strong alcoholic beverage containing 40% V/V, had been used as a “blank” substance, as a baseline; 0.50 mg/ml mg solution of diazepam in the previously mentioned “blank” alcoholic beverage, 0.75 mg/ml mg solution of diazepam in the aforementioned baseline substance, 1 mg/ml solution of diazepam in the “blank” alcoholic beverage, as well as 0.50 mg/ml, 0.75 mg/ml, and 1.00 mg/ml solutions of sucrose in the “blank” alcoholic beverage each, and 0.50 mg/ml, 0.75 mg/ml, and 1.00 mg/ml solutions of NaCl in the “blank” alcoholic beverage. Therefore 27 measurements were made, and for each of these the impedance modulus and phase were measured. The change in impedance modulus and phase, with the change of solution addition was analyzed.
Having acquired the impedance modulus and phase, a Nyquist plot was determined with the goal of assessing the stability of the designed structure, as well as visualizing the relationship between the real and imaginary part of the impedance. These parameters were then compared and evaluated.
Results and discussion
Structural and optical analysis
Optical profilometry was performed for verification purposes. Due to the strain on the base fabric, during the embroidering process, tears and rips can happen as a consequence. Figure 3(a) shows the 2D image, magnified to 25 times the samples size, and focused on the critical transition area. Figure 3(b) shows the 3D profile of the area of interest. It can be seen that the embroidered areas are thicker in comparison to the base material area which is in the middle of the 3D profile. Aside from that, there is a sharper transition between the base material area and the non-conductive embroidered area, as is not as evident with the transition area between the conductive and base material regions.
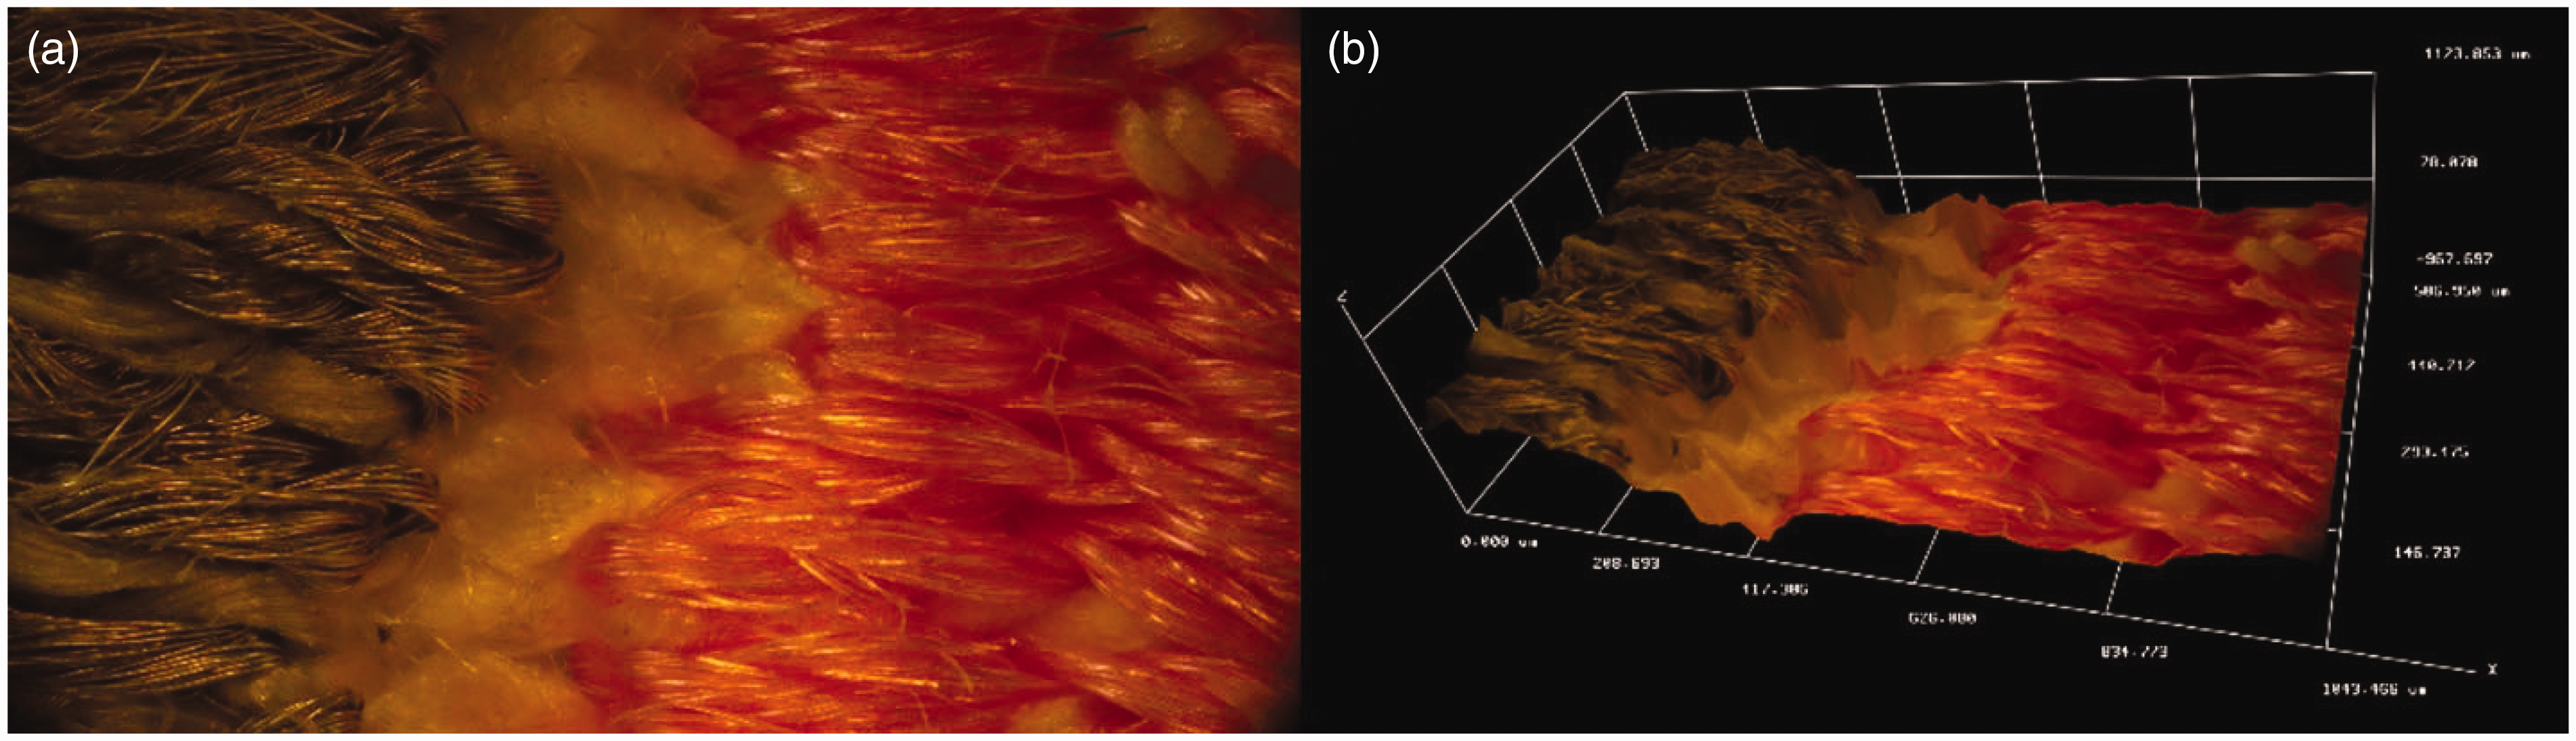
Optical profiler images of the contact region of the non-conductive fabric and the silver thread used for conductive path creation: (a) 2D image and (b) 3D profile.
Due to these differences in transition areas, as well as the process of embroidery itself being coarse towards the threads utilized, scanning electron microscopy and energy dispersive spectroscopy (EDS) were conducted. In Figure 4(a), the transitional area between these two threads is shown, with decreased presence of silver on conductive silver threads the closer the two types of threads are. This can be seen again, on EDS results, Figure 4(b) shows the elements that constitute top left Spectrum 1 point in Figure 4(a). There is a substantial amount of silver, more precisely 43.81% of the analyzed Spectrum 1. This decreases rapidly in Spectrum 2, seen in Figure 4(c), having only 4.25% of silver atoms. Finally, in Figure 4(d), only traces of silver in the observed Spectrum 3 can be seen (2.25%). On the other hand, the carbon value increases rapidly, as the measuring area is further from the conductive threads. This analysis shows that there is a transitional area between the non-conductive and conductive embroidered zones on the sensing elements.
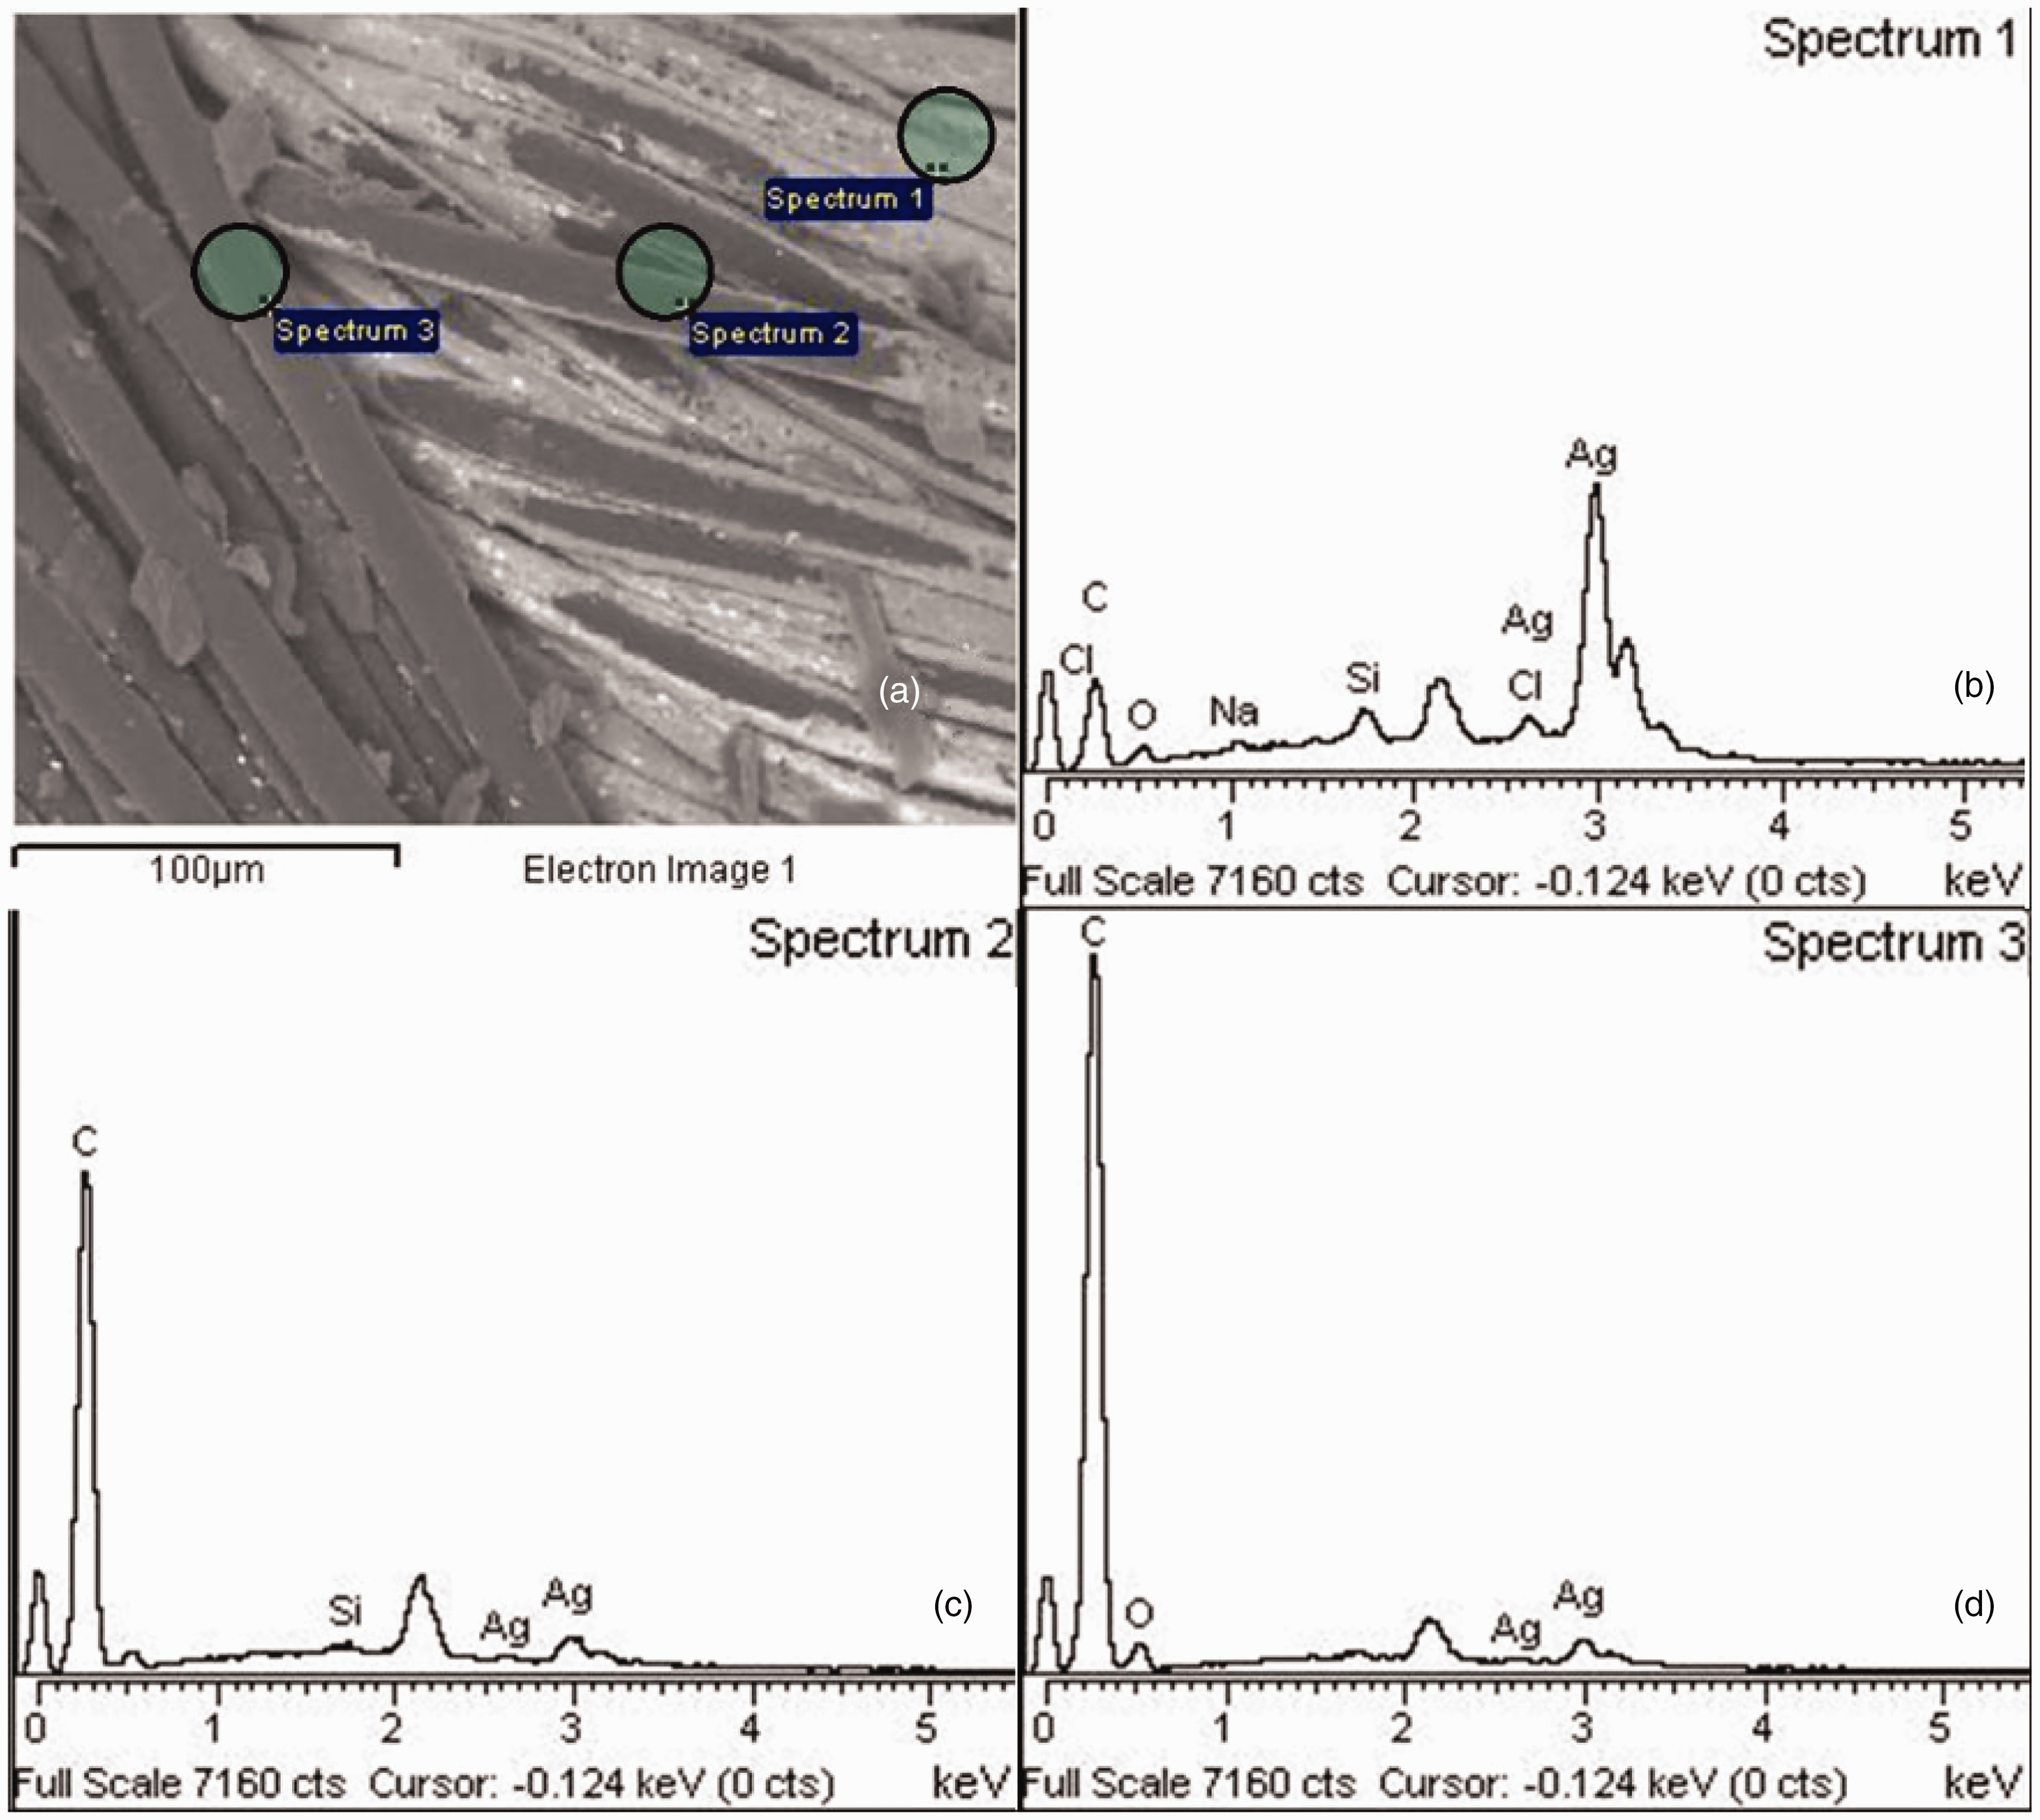
(a) Scanning electron microscope image of the transition area between the conductive and non-conductive parts of the embroidered structure; (b) Spectrum 1 of EDX marked on image 3(a); (c) Spectrum 2 of EDX marked on image 3(a) and (d) Spectrum 3 of EDX marked on image 3(a).
Electrochemical impedance spectroscopy (EIS) measurement and analysis
We used electrochemical impedance spectroscopy (EIS) as a non-destructive method that is frequently employed to investigate the electrical characteristics of materials and systems. With the addition of different substances, the relative permittivity of the capacitor sensing element changes, which in term affects the impedance modulus, as well as the phase angle. Through the differences in solution absorption by the textile sensing elements, as well as the ionic activity of NaCl, as the ionic activity as well as the dielectric constants depend on the concentration of ions in the solution, it is expected that the phase angle will increase with the increase of concentration, especially NaCl. As the solution of NaCl is ionic, with charged particles in it, it will exhibit the highest change in comparison to the diazepam and sucrose solutions, which have non-polar molecules in them, and are quite similar to one another. Moreover, as sucrose and diazepam solutions are not ionic solutions their capacitive effects are high, and close to one another. This in turn leads to a potential need for selectivity through computational modelling. In this section the acquired data pertaining to the behavior of the fabricated structure, are presented in detail. Moreover, the behavior of the aforementioned structure when exposed to different solutions is explored. First, the impedance modulus and phase for each different solution are shown, afterwards their relationships with each other are displayed. The impedance modulus and the phase angle as a function of frequency are shown in Figure 5.
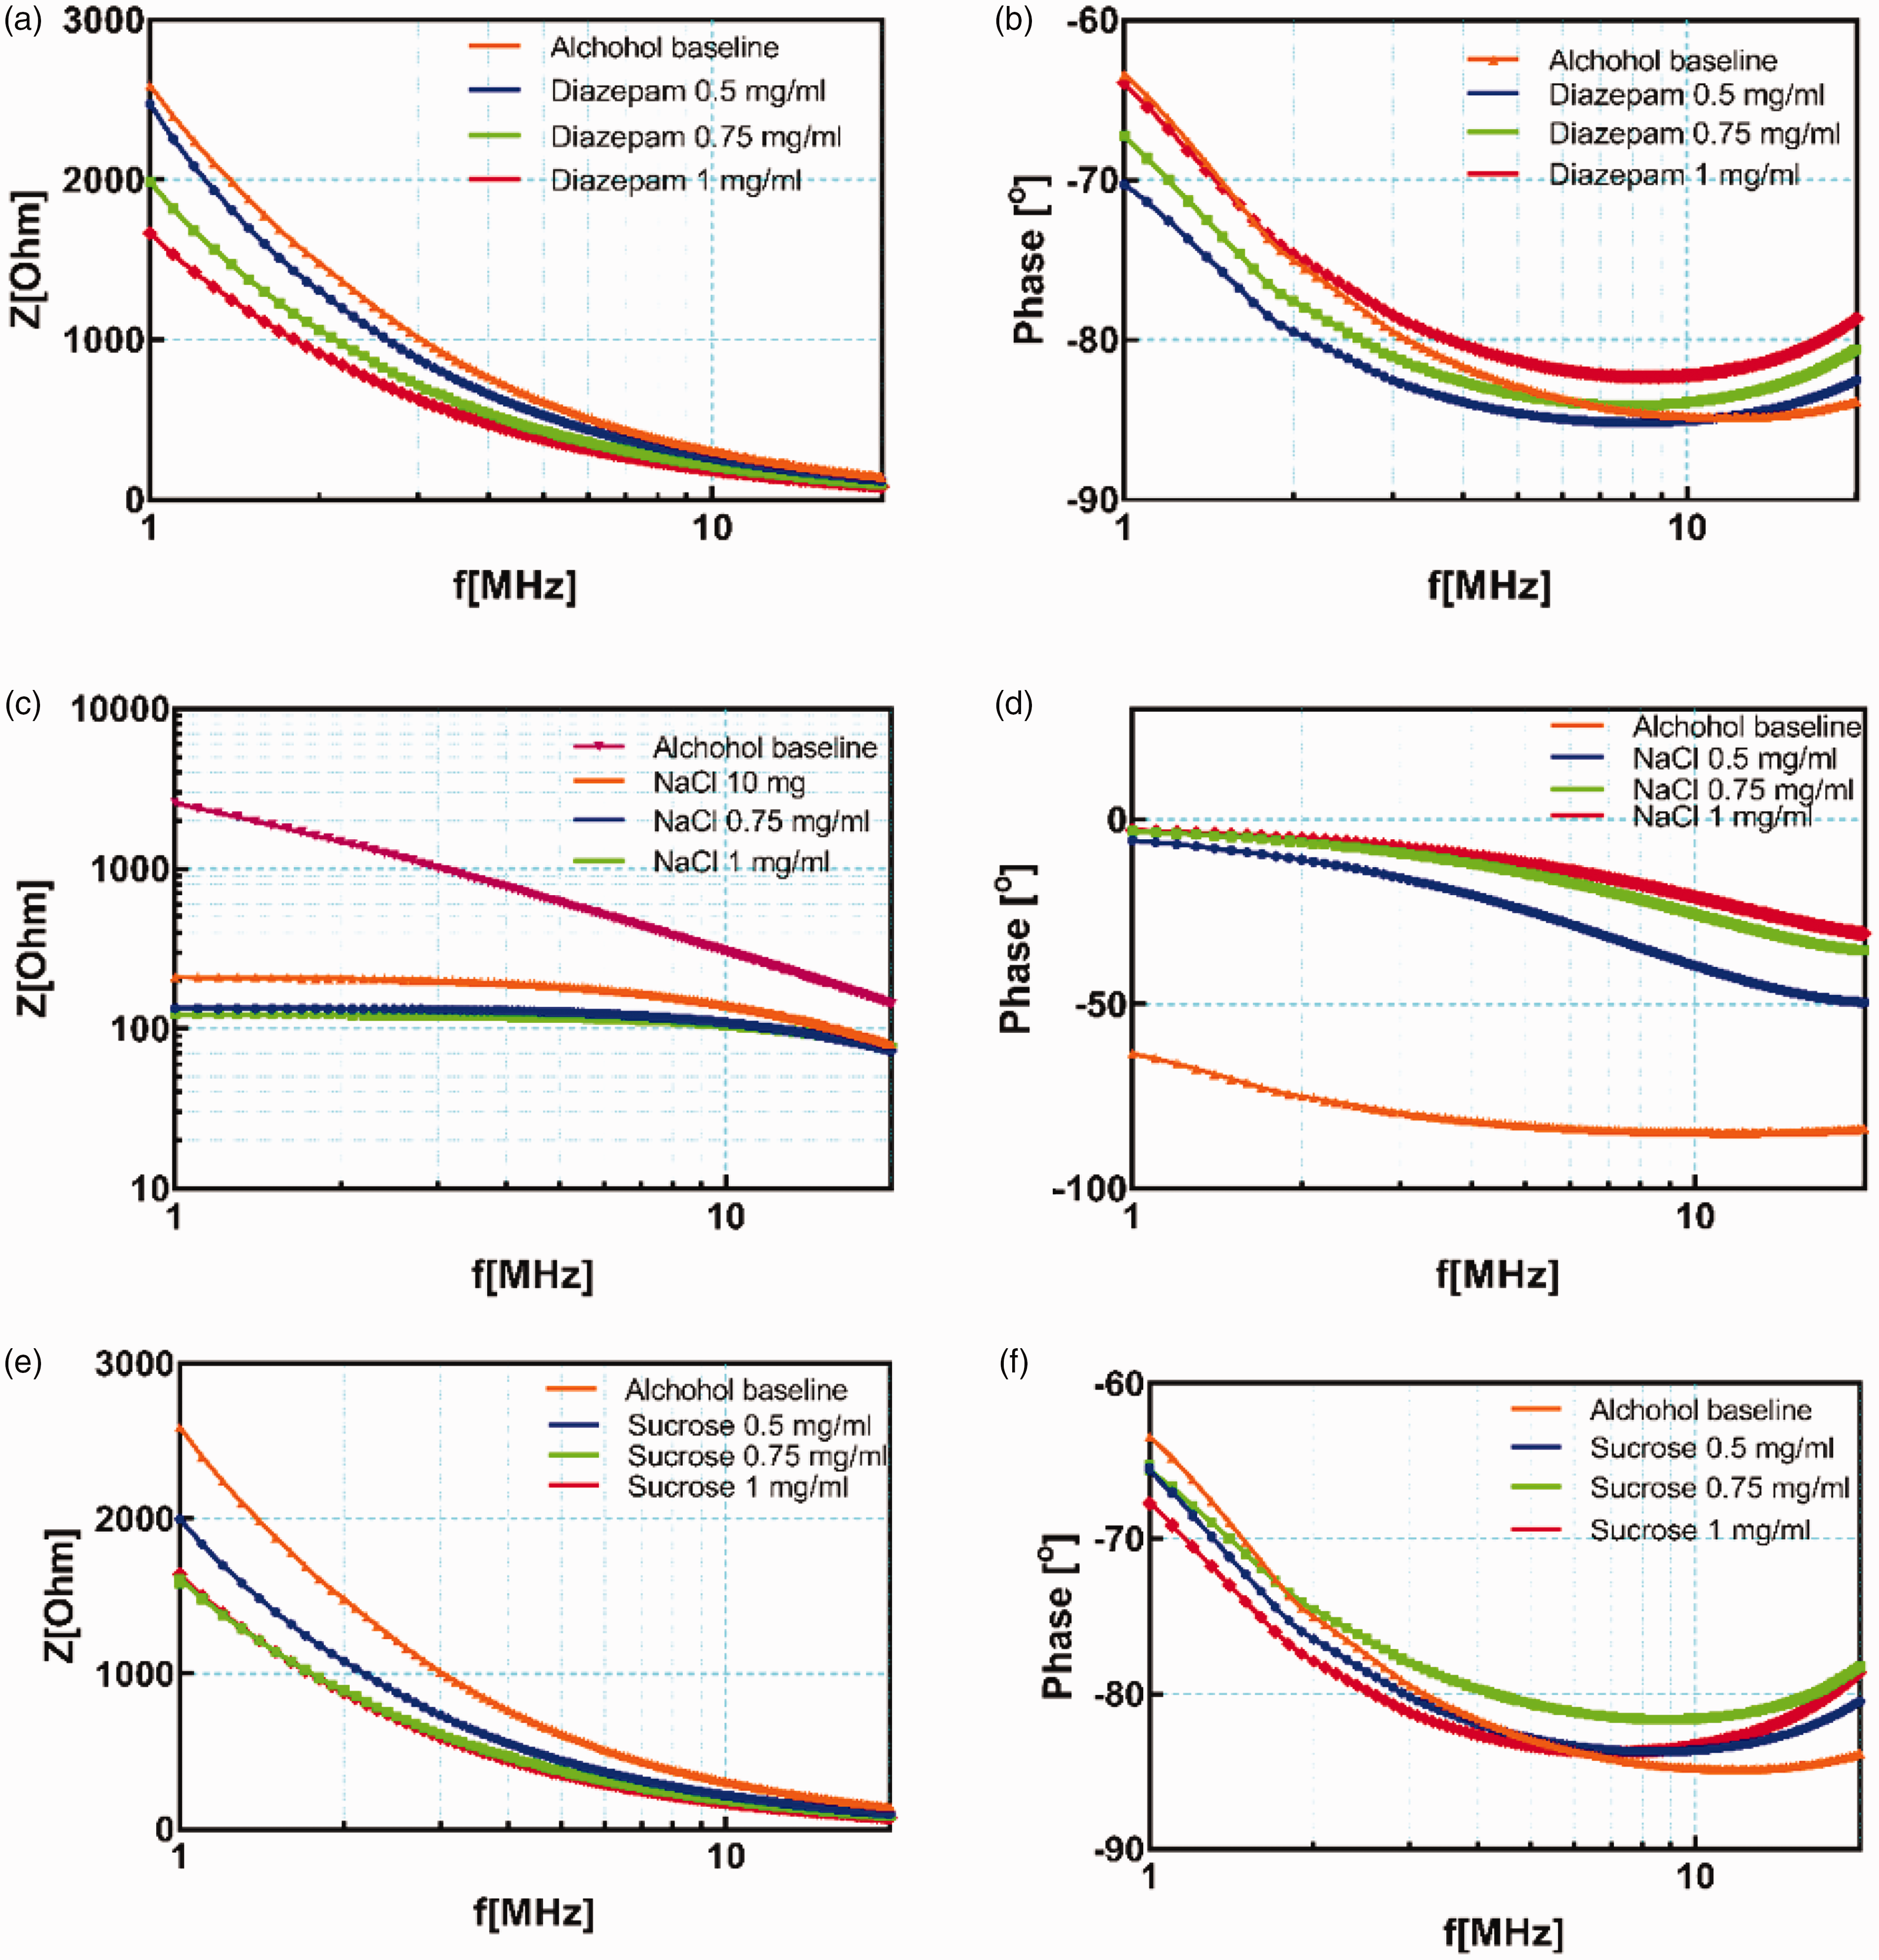
(a) Impedance modulus and (b) phase with diazepam solution used; (c) impedance modulus (used logarithmic scale for the vertical axis) and (d) phase with NaCl solution used; (e) impedance modulus and (f) phase with sucrose solution used.
The change in concentration of diazepam from 0.50 mg/ml to 1.00 mg/ml decreases the impedance modulus, as can be seen in Figure 5(a), and the phase as well (Figure 5(b)). This change can be attributed to the solubility of diazepam. 30 On frequencies greater than 10 MHz, the characteristics of each concentration overlap, which indicates that the dominant capacitive reactance decreases with the increase of frequency. Moreover, the impedance modulus dependence with frequency of the baseline substance overlaps with the impedance modulus of the sample when a solution with 0.50 mg/ml of diazepam is applied. In comparison to the impedance modulus change with concentration, the phase angle variation is less pronounced, indicating that the modulus is more sensitive to the consistency of the applied solution. 31 In Figure 5(c) and (d), a different change can be seen as the addition of NaCl, a strong electrolyte, drastically increases the phase of the system, to a value close to zero. The lowest change in impedance modulus with respect to concentration can be seen in Figure 5(e) and (f), where a solution of sucrose in the baseline substance was applied to the sample.
Figure 6 shows the relations between solutions with the same concentration of a foreign substance in the “blank.” The most drastic difference is between NaCl and the other two substances, at the same concentration. Our findings are similar to those reported in Townsend et al. 32 as mixtures of sucrose and alcohol, as well as diazepam and alcohol, do not differ significantly when non-specific techniques are used. To see the relationship between the imaginary and real part of the impedance, as an indicator of a linear time-invariant system, Nyquist plots have been calculated.
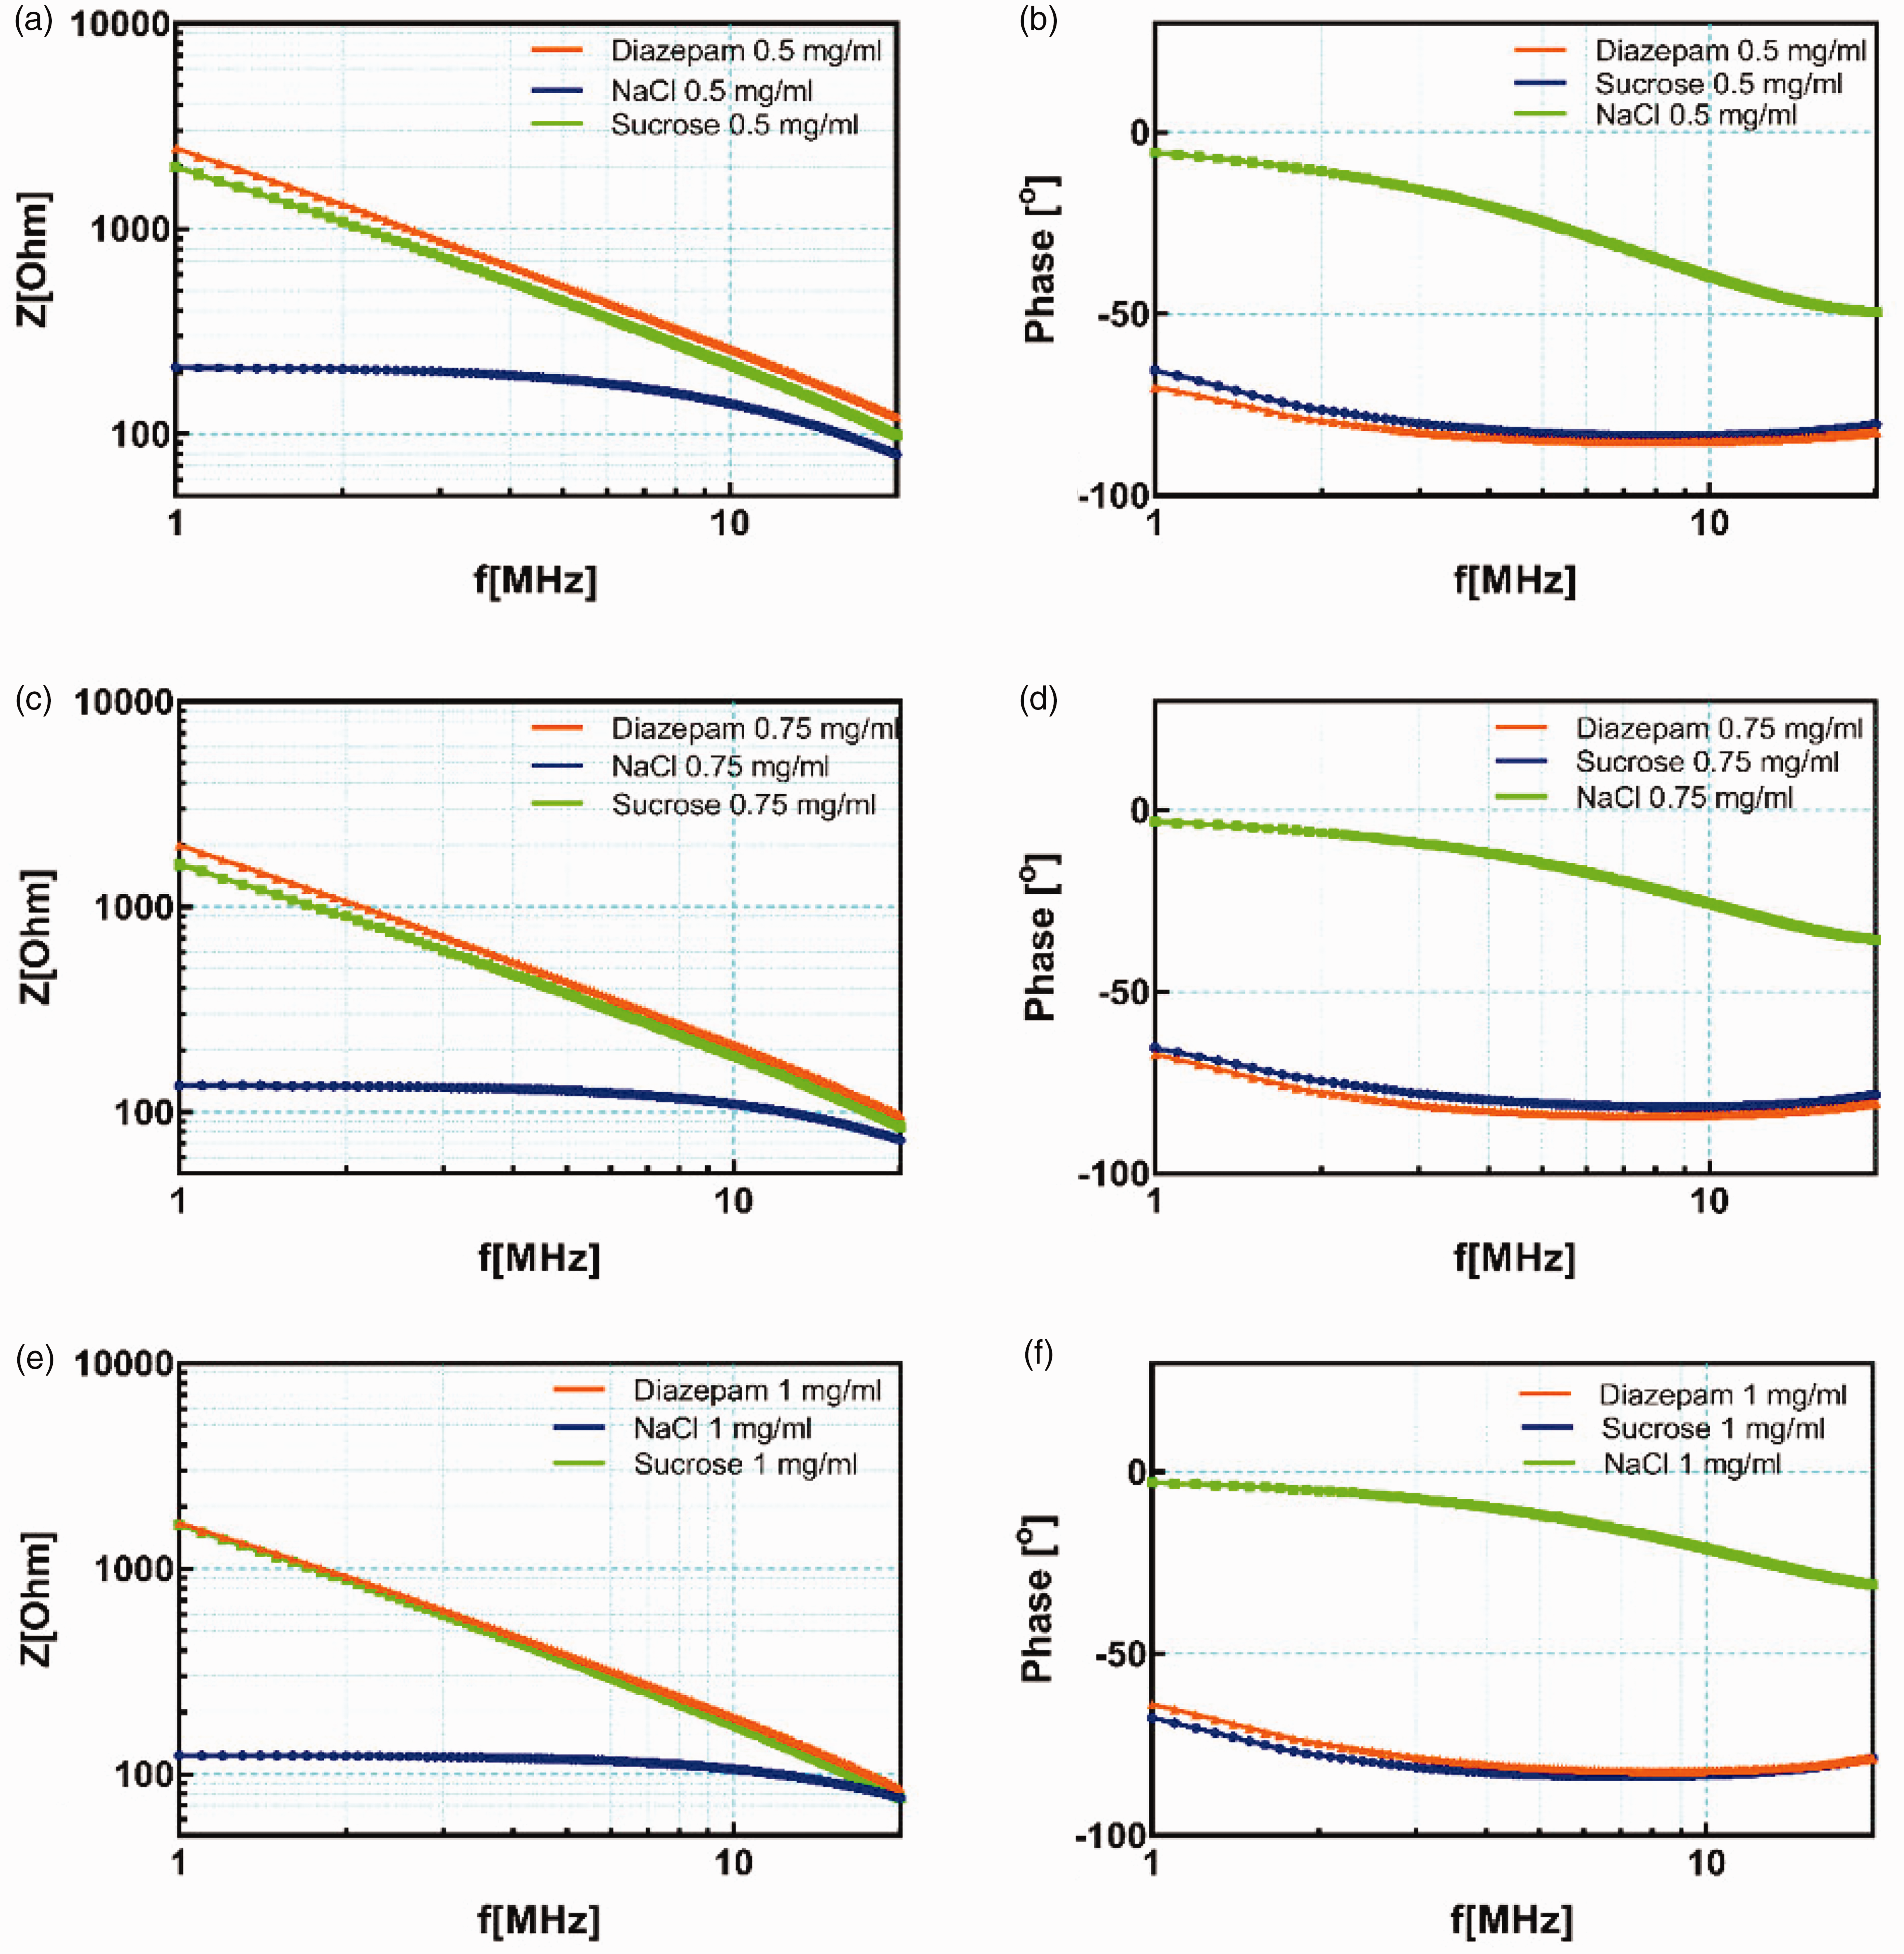
(a) Impedance modulus and (b) phase with 0.5 mg/ml solution used; (c) Impedance modulus and (d) phase with 0.75 mg/ml solution used; (e) impedance modulus and (f) phase with 1 mg/ml solution used. For (a), (c), and (e), the vertical axis is logarithmic, while on (b), (d), and (f) it is linear.
Repeatability, sensitivity and the response time of the sensor
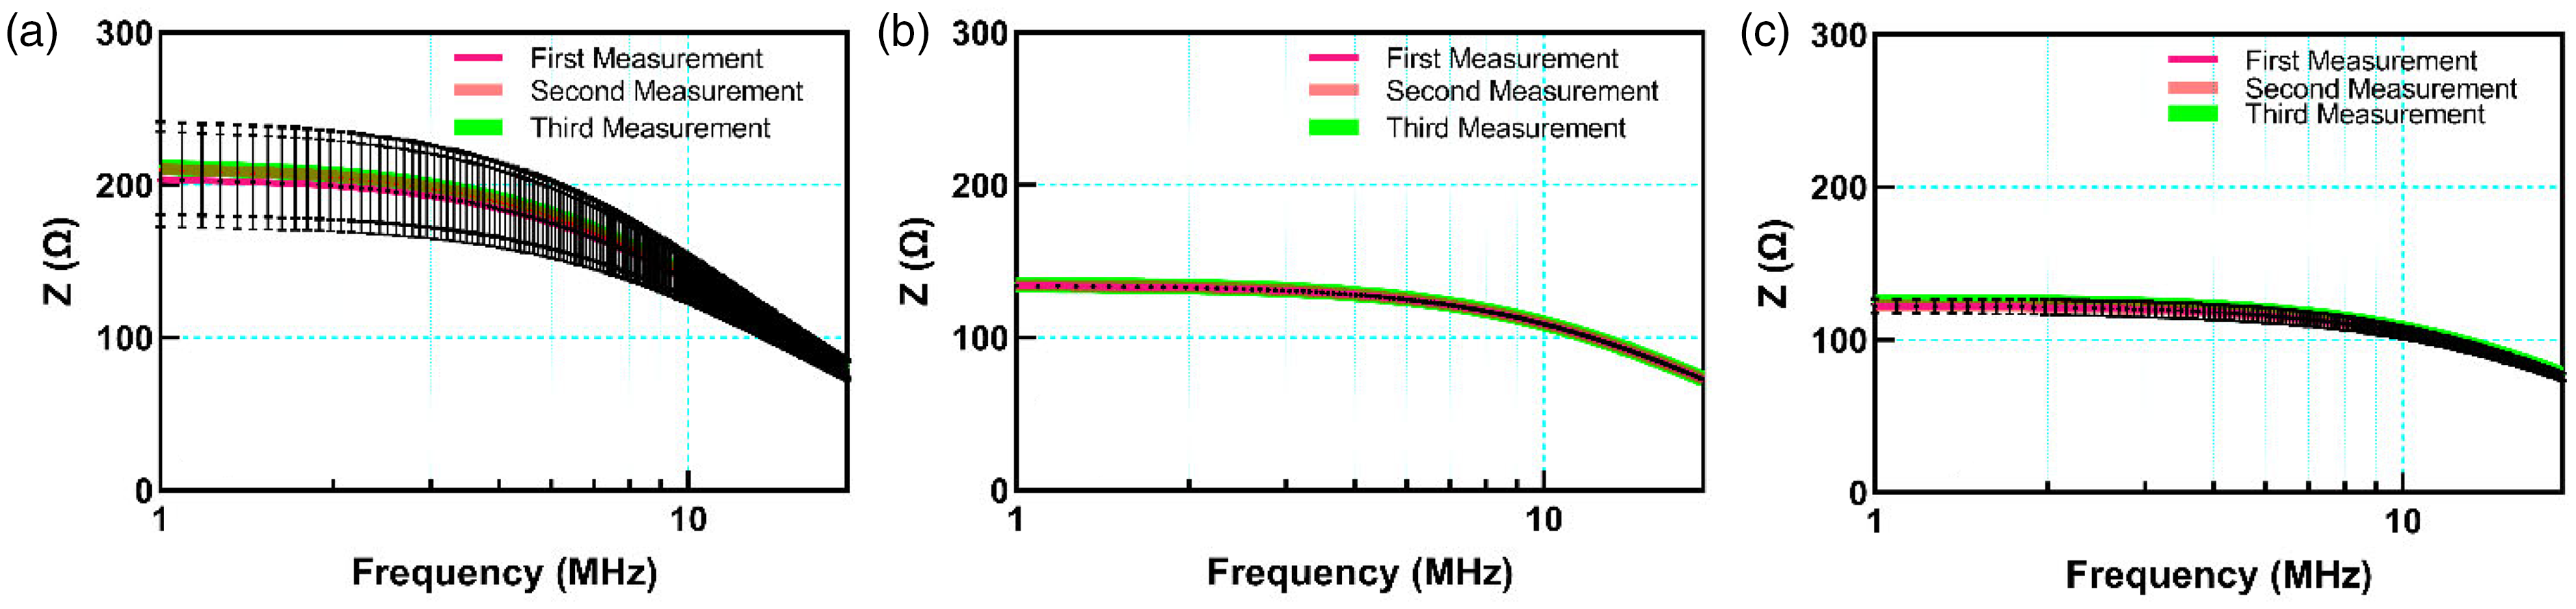
Utilizing measurements collected in the previous section, sensitivity was calculated at the frequency of 1 MHz, as well as standard deviation (STD) and relative standard deviation (RSD) as measures of repeatability. The following graphs (Figures 7 –9) show the impedance modulus for all three measurements, averaged over all three samples, with the number of measurements in the legend (the first measurement denotes the first time the liquid was poured and the measurement was performed, analogously, this is repeated two more times).
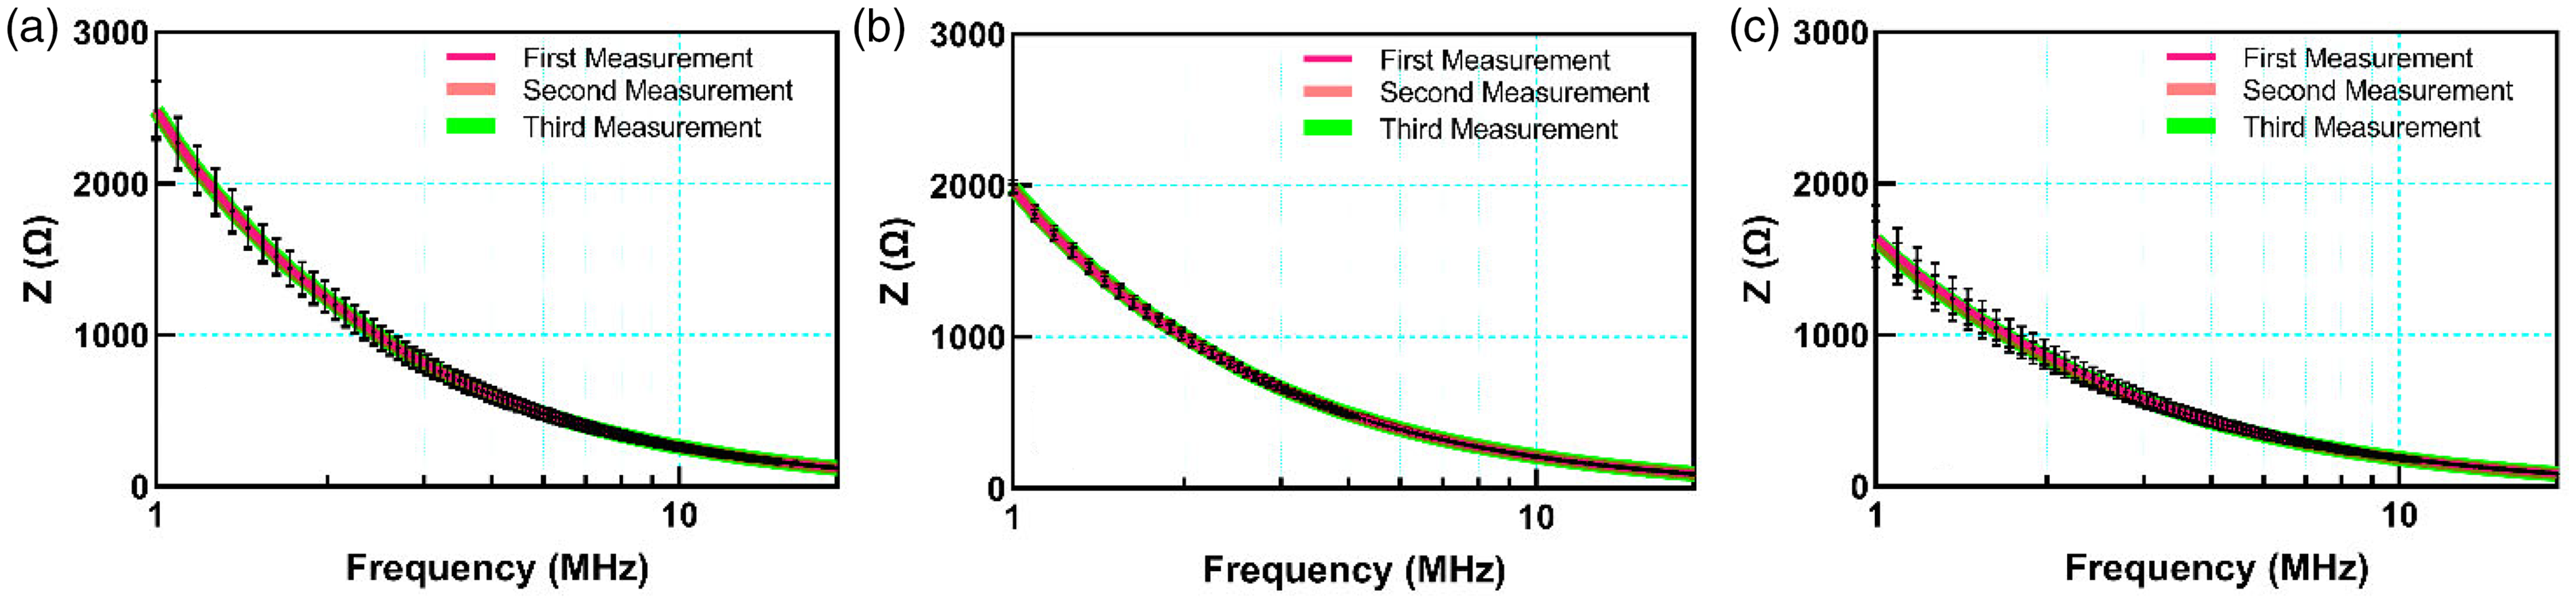
Measurement for the solution containing: (a) 0.5 mg/ml of diazepam; (b) 0.75 mg/ml of diazepam and (c) 1 mg/ml of diazepam.
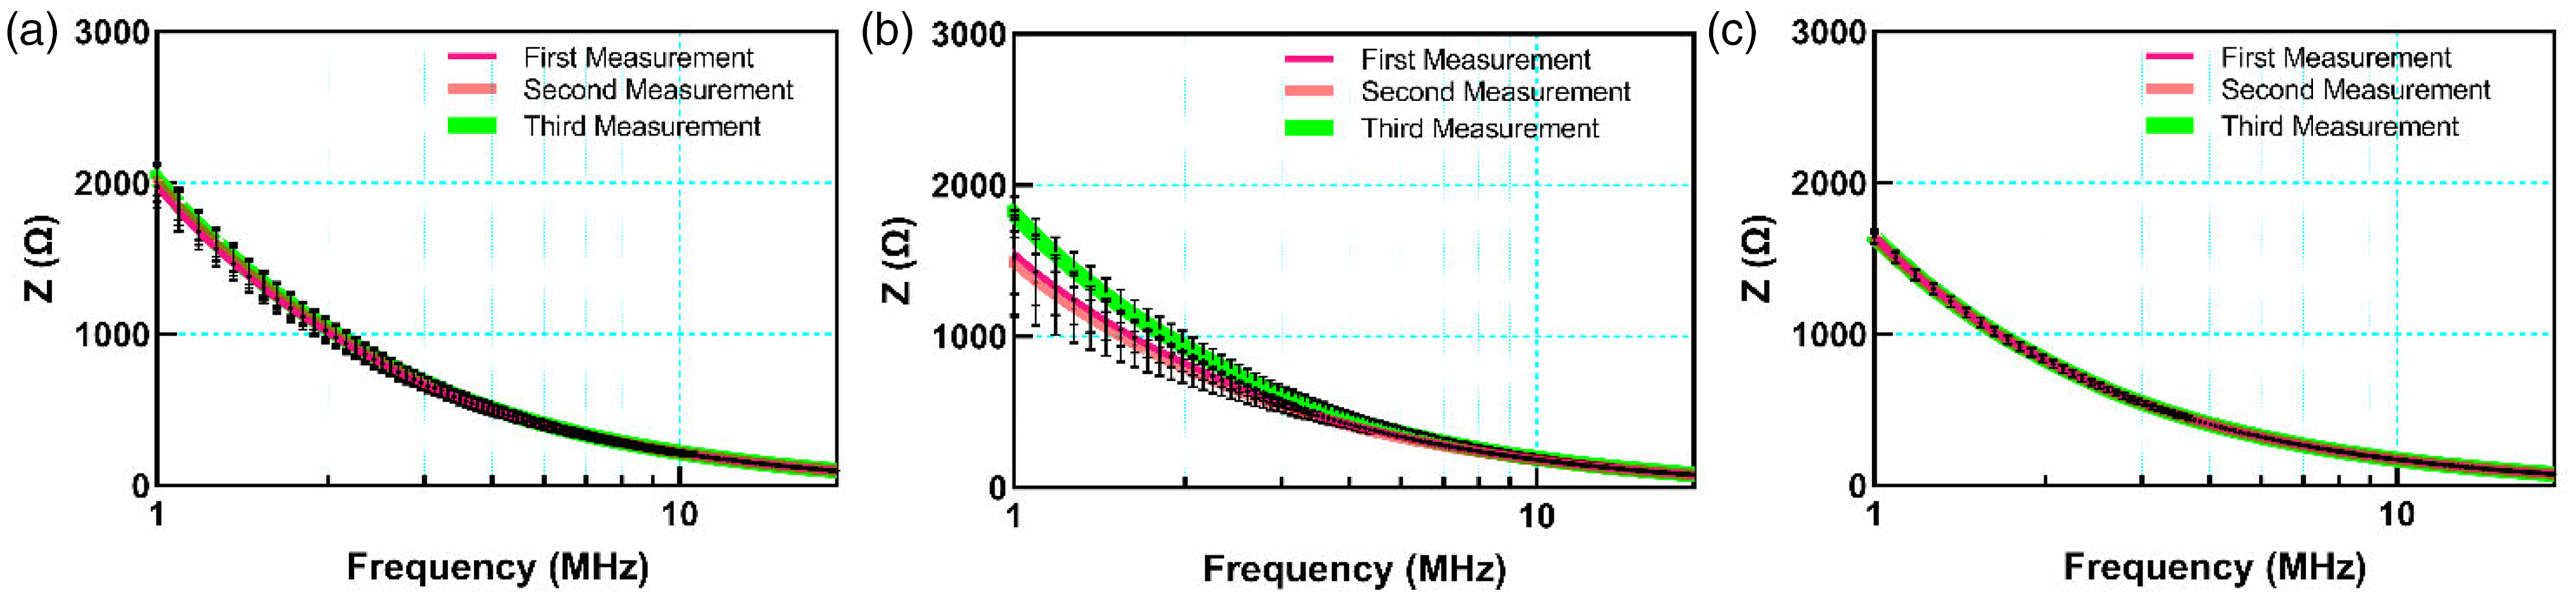
Measurement for the solution containing: (a) 0.5 mg/ml of sucrose; (b) 0.75 mg/ml of sucrose and (c) 1 mg/ml of sucrose.
Measurement for the solution containing: (a) 0.5 mg/ml of NaCl; (b) 0.75 mg/ml of NaCl and (c) 1 mg/ml of NaCl.
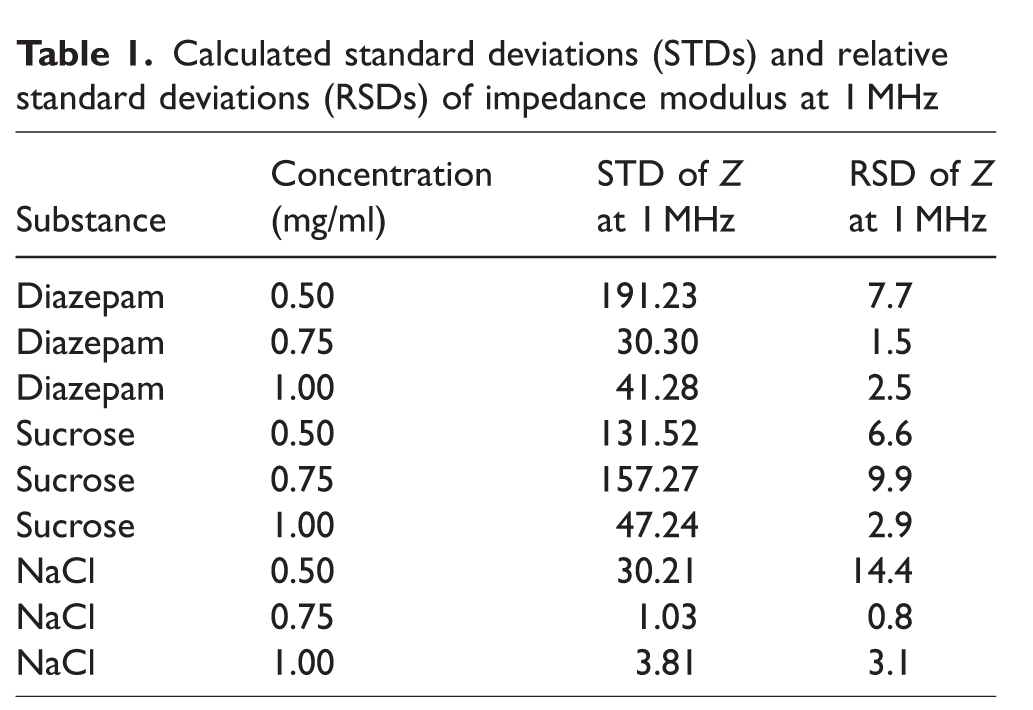
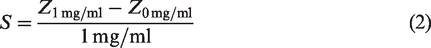
Moreover, we have added details of RSDs and STDs at the frequency of 1 MHz as a lower RSD shows a high level of repeatability. The results are presented in Table 1, where for RSD we used
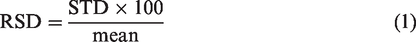
Calculated standard deviations (STDs) and relative standard deviations (RSDs) of impedance modulus at 1 MHz
Measured impedance modulus at 1 MHz for alcohol baseline and 0.5 mg/ml, 0.75 mg/ml and 1 mg/ml of diazepam, sucrose, and NaCl
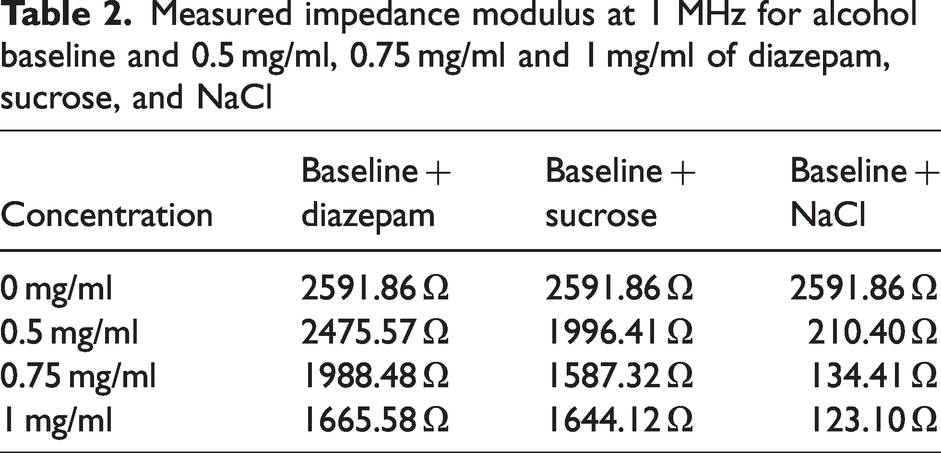
The value of the impedance modulus at 1 MHz when there was no diazepam present and when a 1 mg/ml diazepam solution was administered, was taken and divided by their respected concentrations:
Analogously, sensitivities for sucrose and NaCl were calculated.
The sensitivity results were as follows:
sensitivity for diazepam 0.93 Ωl/mg;
sensitivity for sucrose 0.95 Ωl/mg;
sensitivity for NaCl 2.47 Ωl/mg.
As can be seen from the data presented in Figures 7 –9 and Table 1, the fabricated sensor showed relatively small STDs within three uses and stable performances. However, in our future work we would like to explore sensor stability over a prolonged period of time with a high number of repeated measurements. Our main goal with this study was the sensor characterization in conditions that are very close to the real-life applications (fast response and short exposure to the sample with an aim to ensure unnoticed use).
Impedance measurements were initiated after the liquid was poured. The first two measurements were discarded enabling the achievement of steady state. Therefore, the third measurement was saved. With such a procedure we wanted to ensure that the same measurement conditions were repeated for all tests. the sensor’s characterization was performed in a manner that can be expected to be used in real-life applications. A fast response is needed to ensure unnoticed use. Because of that, frequencies in MHz range (time period of such signals is lower than 1 µs) were applied. Moreover, a settling time of 2100 µs for each frequency was set (slow measurement speed of HIOKI IM7585), enabling the end of the transient state (typically 3–5 time periods of the signal). All measurements were performed with an enabled averaging of four samples. Therefore, 801 measurement points with measurement time of 2.1 msec and averaging four measurements, resulted in one full measurement cycle taking approximately 7 sec. Therefore, our actual measurement was performed over 15 sec (the first two measurements are discarded) after the liquid was poured. In our further realizations of the portable measurement device, we will follow this sequence. Important confirmation that a steady state is reached can be seen in the Nyquist plots, because there are no outliers and all impedance values follow the same trend, enabling the modelling with the widely used Cole-impedance model.
Fitting the sensor response with the second-order polynomial
Using the measured values of impedance modulus and phase angle at some frequency point, transfer functions for each type of contaminant can be obtained. Using the impedance modulus is preferable over the phase angle because it requires simpler electronics for detection (there is no need for phase detector). Because of that, we used the measured values of impedance modulus (Zm) at 1 MHz for alcohol baseline and 0.5 mg/ml, 0.75 mg/ml, and 20 mg of diazepam, sucrose, and NaCl. The second-order polynomial (quadratic curve) was used to calculate fitted values (Zf):

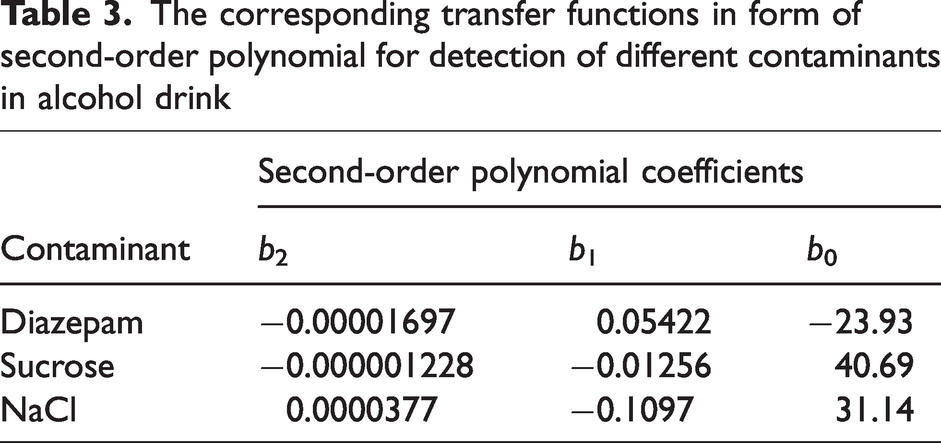
Measured data and corresponding transfer functions are listed in Tables 2 and 3, respectively.
The corresponding transfer functions in form of second-order polynomial for detection of different contaminants in alcohol drink
Calculated concentrations of contaminants
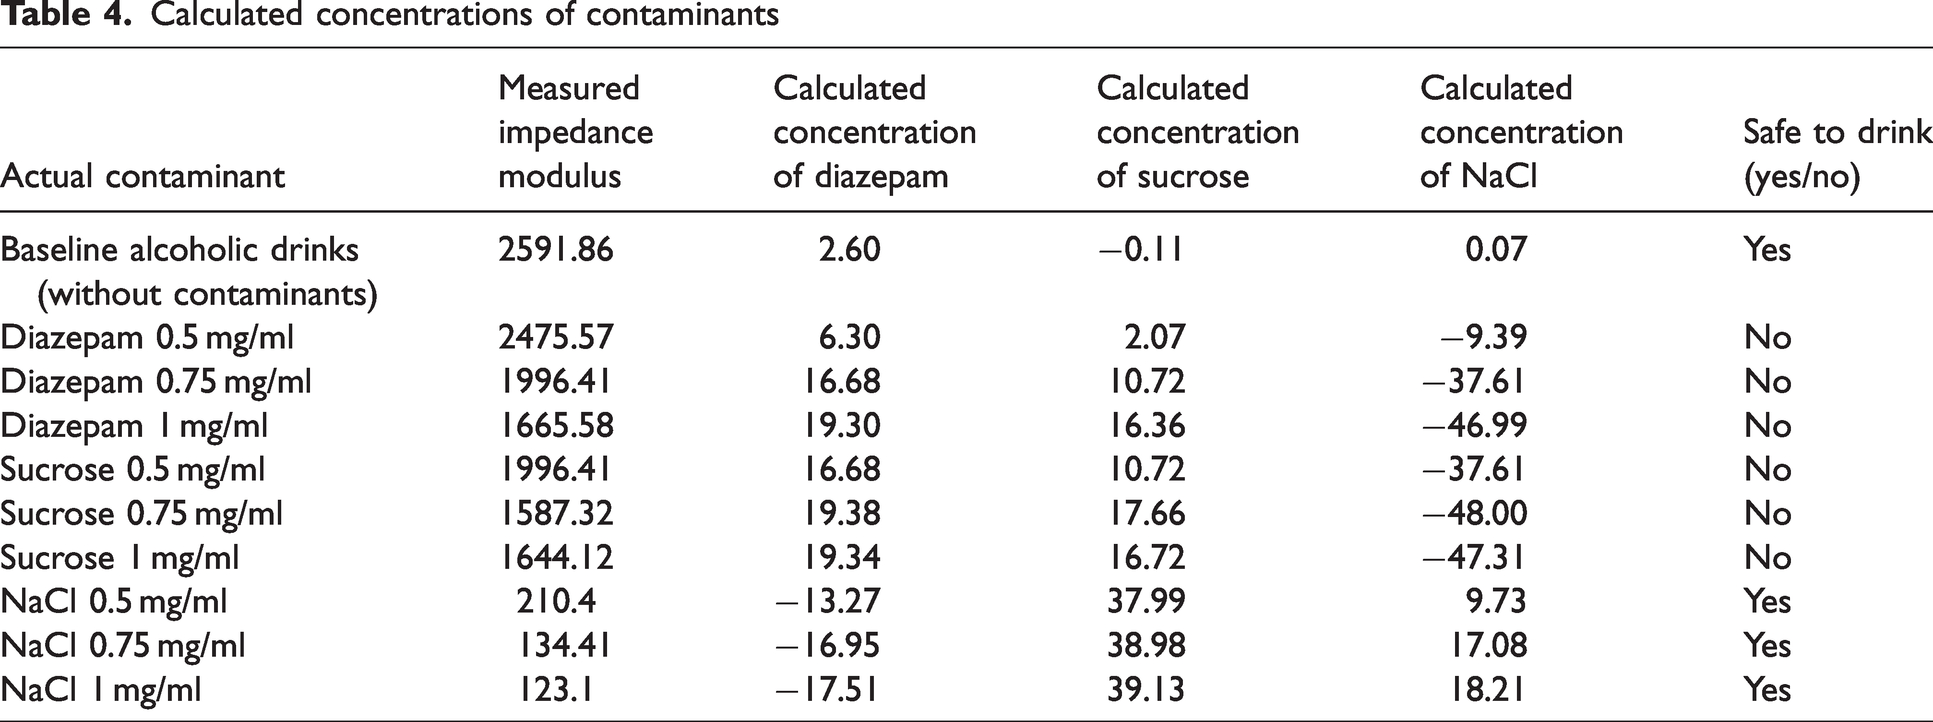
The accuracy analysis of the obtained transfer function was also performed. With different measured values of impedance modulus from Table 2, and transfer functions from Table 3, the concentrations of each contaminant were calculated. The results are presented in Table 4.
Therefore, with the given approach, based on the processing of the impedance modulus measured on the frequency of 1 MHz and second-order polynomial fit, it is possible to detect the dangerous diazepam concentrations (0.50 mg/ml, 0.75 mg/ml, and 1.00 mg/ml). With simple one-frequency impedance modulus measurement, the system will be able to indicate that a drink is contaminated and that it is not safe. The advantage of this method is the very fast execution and data processing, because only one data point is needed for binary (yes/no) classification. However, false positive results in terms of diazepam detection can occur, also in the case when sucrose is present in the drink, without diazepam. Because of this, the more selective method is also formulated and presented in subsection 3.2.2.
Modeling with the Cole-impedance model
Obtained EIS data was also used to fit the Cole-impedance model, which is widely used in the representation and studying of liquids. The Cole-impedance model consists of four parameters (R∞, R1, C, and α) arranged in such way that complex impedance
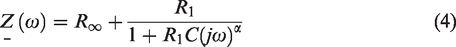
Parameters of the Cole-impedance model have a physical interpretation which helps in understanding the physical and chemical properties of materials, including their conductivity, resistivity, heterogeneity, etc. R∞ is the resistance of the material or system at very high frequencies (theoretically it should be infinite frequency), and it is primarily related to the resistivity of the material. R1 is also related to the conductivity of the solution, as well as the charge transfer process. As R1 is equal to the difference between the resistance at very high frequency and DC resistance, it is also called as the “static resistance” which describes the difference between behaviors at two boundary conditions. Capacitance C presents the capacitance of the cell membranes, and it is dependent on the double layer formation and permittivity of the solution. The dimensionless parameter α is the second parameter of the constant phase element (CPE), with capacitance C, and it is used to describe the nonideal dielectric properties of the medium. Deviation can be identified by lower values of α when compared to the ideal capacitor (α = 1). Estimated values of model parameters, obtained using the method presented in Simić et al., 33 are given in Table 5. Because of different ranges of numerical values, we compared the estimated values of model parameters for two concentrations (0.5 mg/ml and 1 mg/ml) of diazepam, sucrose, and NaCl against the estimated values in case of “blank,” previously referred as a baseline in the previous section on experimental setup and measurement.
Estimated values of model parameters for different solutions normalized over the baseline solution (a strong alcoholic beverage containing 40% V/V without additions)
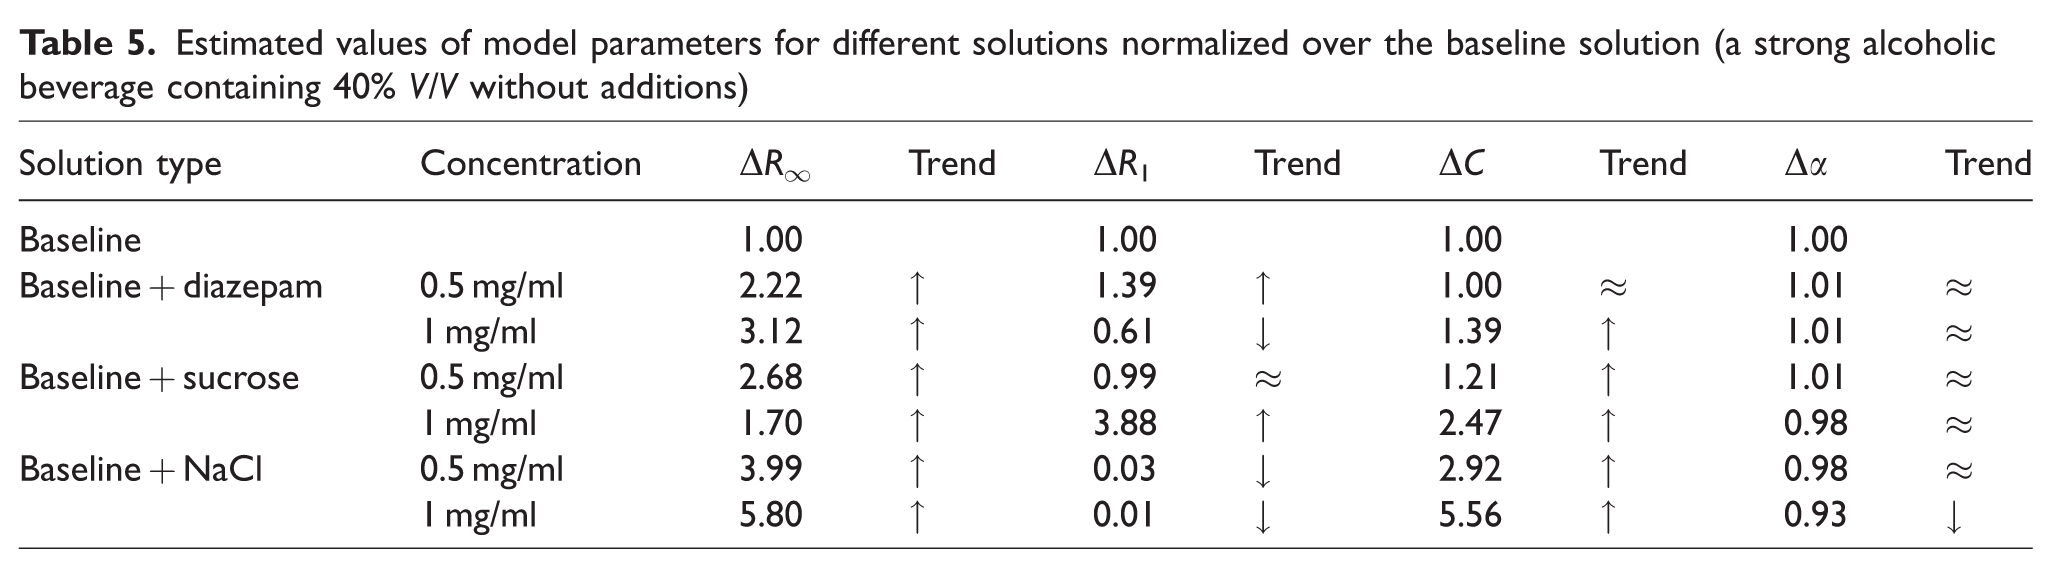
As indicated by Table 5, the proposed Cole-impedance model reacts to the changes of the solution type, from clean alcohol beverage to beverages that contain some additions such as diazepam, sucrose, and NaCl in concentrations of 0.50 mg/ml and 1.00 mg/ml.
The presence of diazepam in lower concentration leads to increase (↑) of resistive parameters (R∞ and R1), while parameters of CPE (C, α) remained unchanged when compared to the baseline solution. However, with increased concentration of diazepam to 1 mg/ml, R∞ will increase as well as capacitance C, while the value of R1 will drop (↓). Parameter α changes about 1% in both cases, and it can be treated as it remained the same (≈) as the baseline value. In the case that 0.5 mg/ml of sucrose was added to the baseline solution, an increase of R∞ and C was obtained, while R1 and α remained almost unchanged. Sucrose concentration of 1 mg/ml can be recognized with an increase of R∞, R1, and C, while parameter α does not change. Finally, the presence of NaCl can be recognized with very specific patterns: an increase of R∞ and C, decrease of R1, no change of α in case of 0.5 mg/ml, while in the case of 1 mg/ml concentration there is an increase of R∞ and C, and decrease of R1 and α.
Therefore, because of the very specific patterns of changes in model parameters, the proposed model enables very efficient differentiation of contaminants and their concentrations. The only similar trend was obtained in case of additions of 1.00 mg/ml of diazepam and 0.50 mg/ml of NaCl. However, in the case of NaCl there is much smaller value of R1 (almost 100 times smaller when compared to baseline), which enables reliable recognition and distinction.
With the Nyquist plots of all different solutions used in this study (Figure 10) it is possible to confirm the suitability of the proposed model for fitting as there is very good agreement between the measured and estimated data.
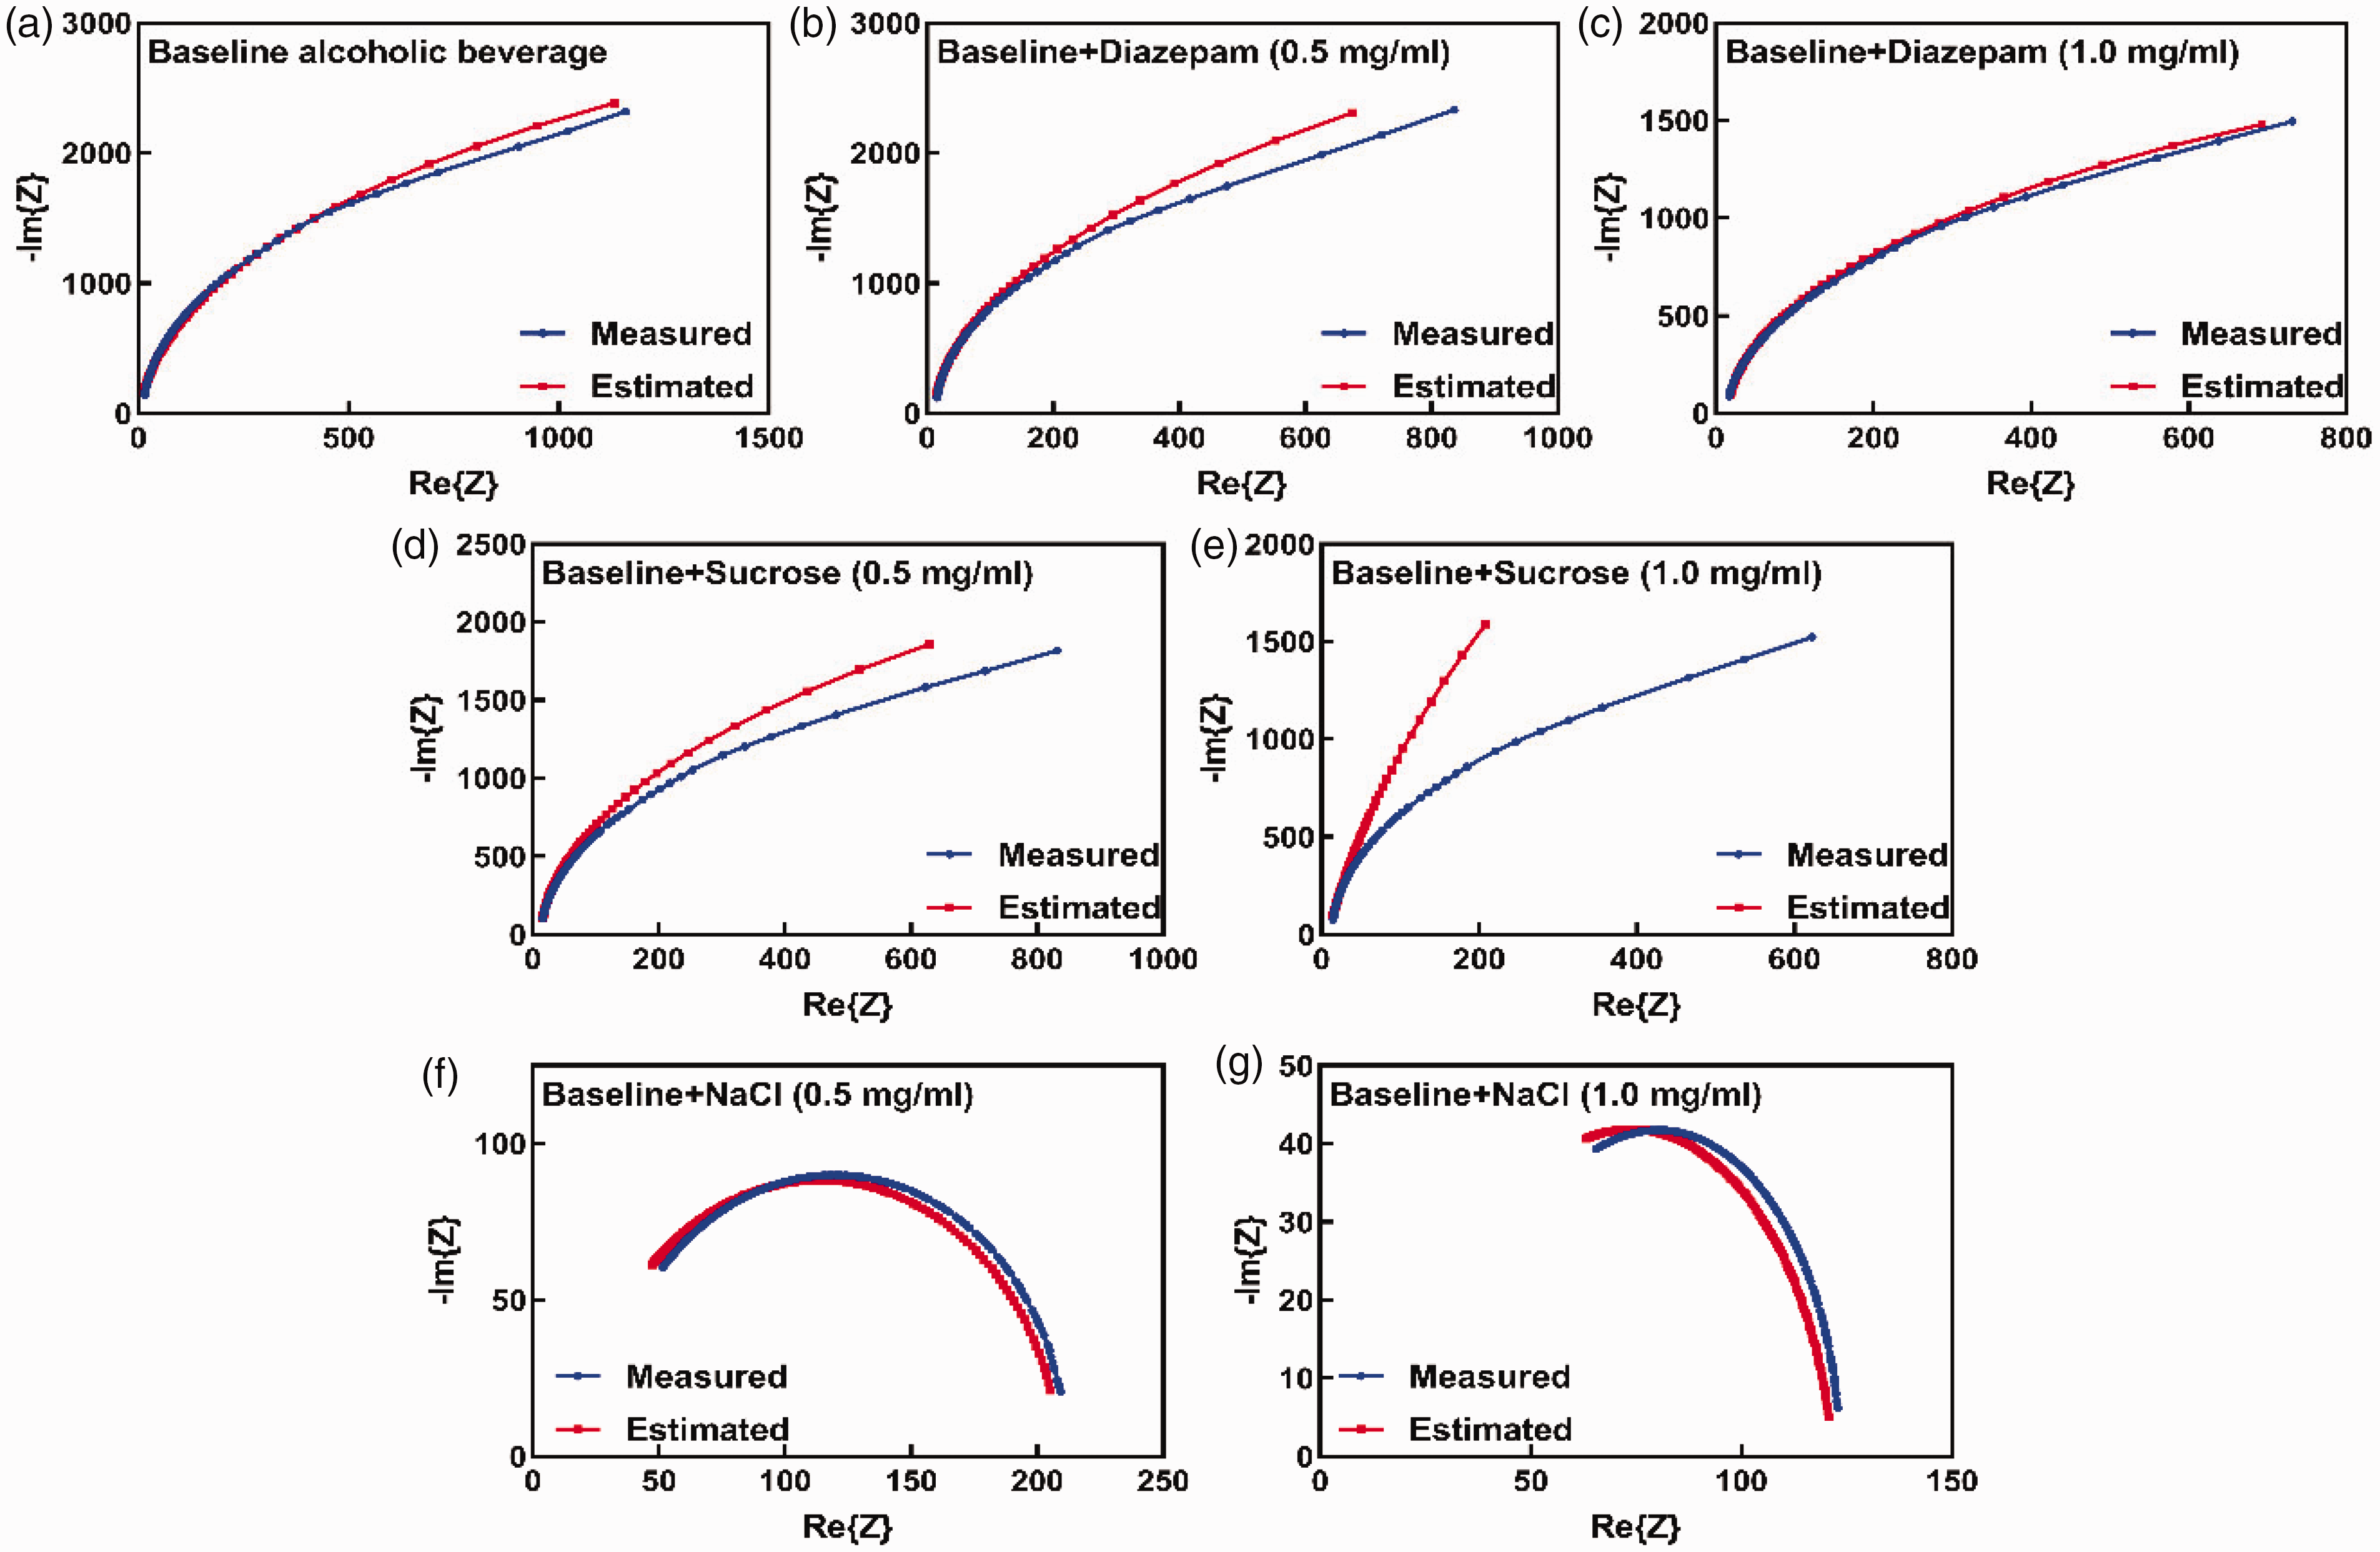
Nyquist plots of measured and estimated impedance in case of: (a) baseline solution (clean alcoholic beverage), (b) and (c) diazepam solutions; (d) and (e) sucrose solutions; and (f) and (g) Nyquist plots of NaCl solutions.
In conjunction with the previous analysis with diazepam, sucrose, and NaCl; 50 mg of KET has been dissolved in 5 ml of rakia. The same measurement process was carried out which gave the results shown in Figure 11. Due to the polarity of KET, the impedance modulus was slightly decreased from around 600 Ω to 400 Ω, whilst the phase angle increased by a small margin. Even though these results are promising, more investigation ought to be done in the future. The changes in impedance modulus decreased with the increase in frequency, overlapping at around 10 MHz.
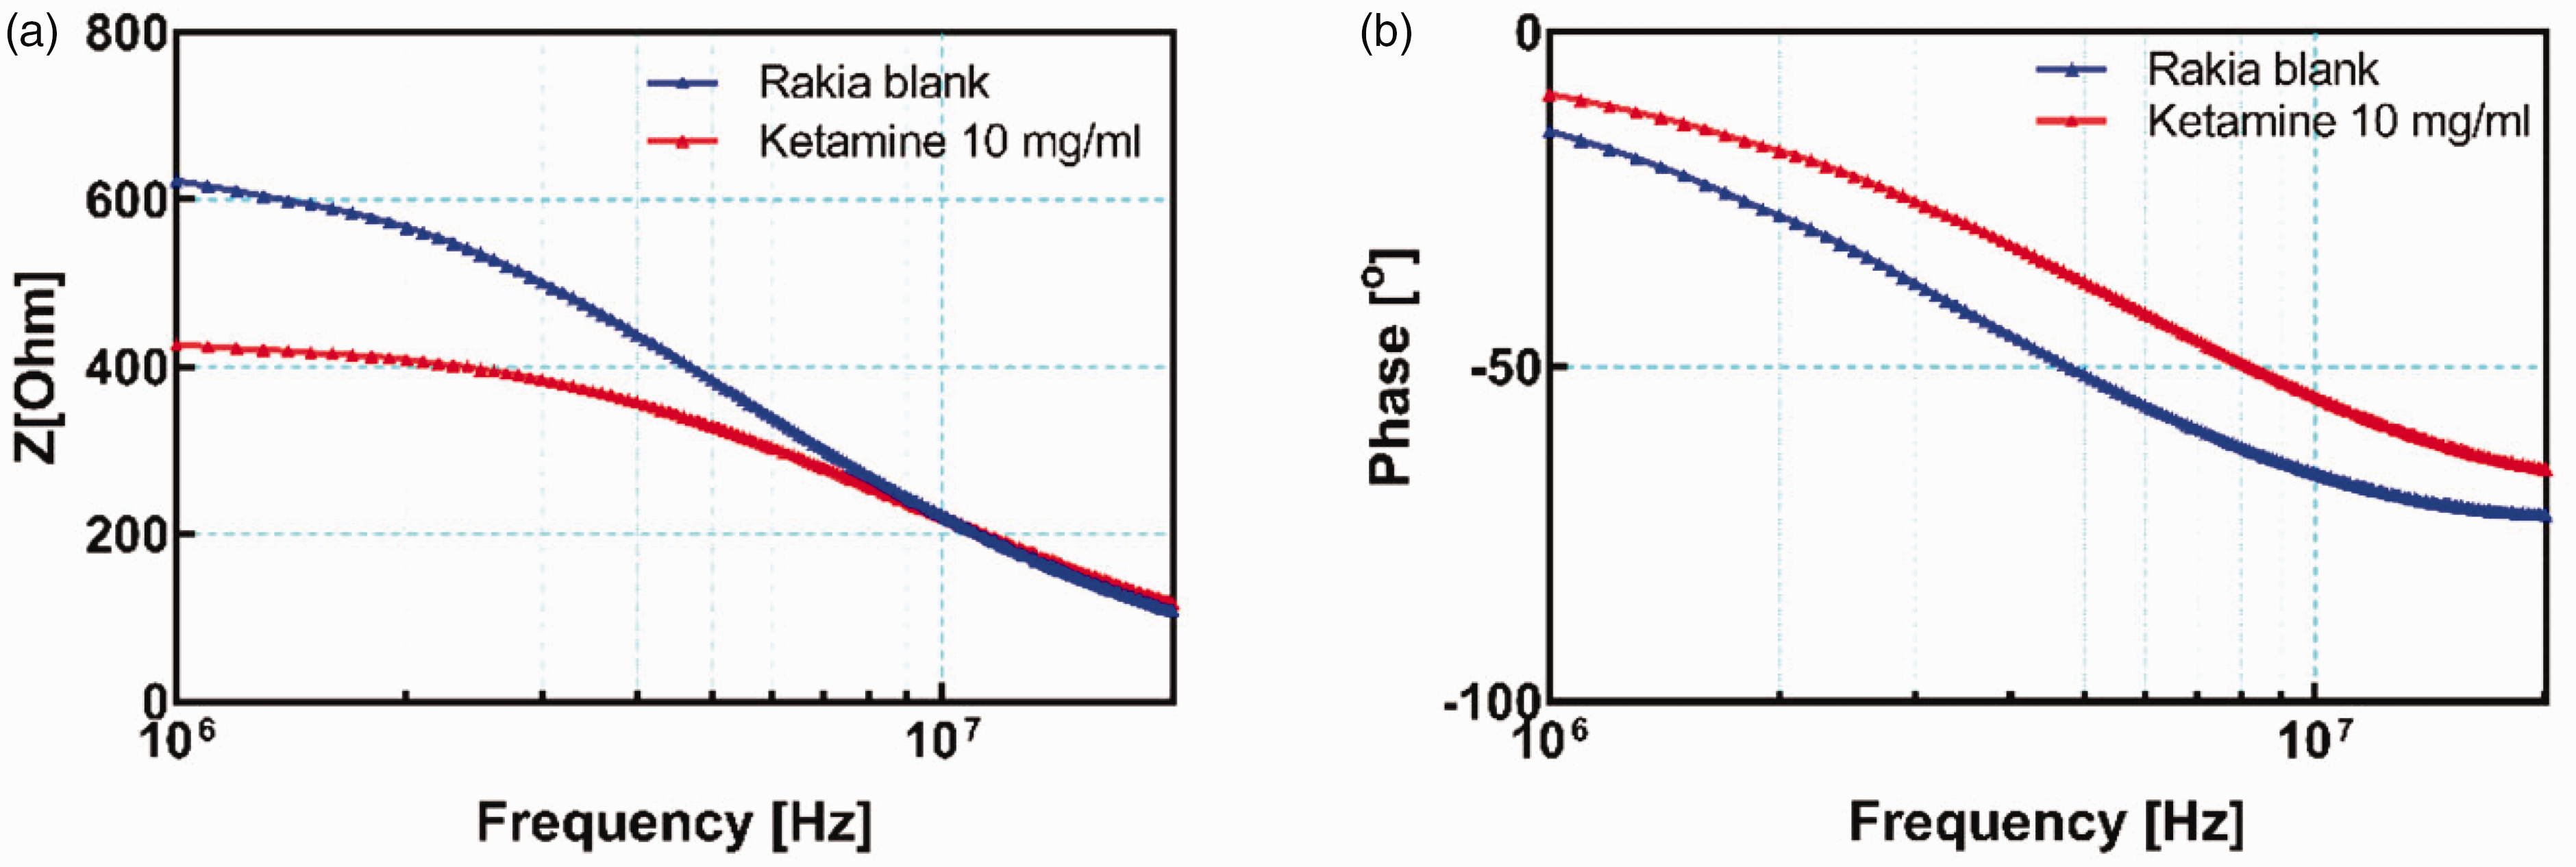
(a) Impedance modulus and (b) phase with 10 mg/ml solution of ketamine in rakia.
Conclusion
In conclusion, the results demonstrate that the fabricated sensing element is sensitive to different concentrations of diazepam, sucrose, and NaCl. The sensing element shows promising selectivity for NaCl in alcohol compared to diazepam, as demonstrated by the distinct differences in the impedance values. The compact size and fast fabrication process of the sensing element make it a promising candidate for further research and development in the field of drug sensing. Future studies could focus on optimizing the selectivity of the sensing element for certain drug types, with the end goal of creating a sensing element selective enough to detect different types of drugs in an alcoholic beverage. Moreover, the proposed system can be realized with the readout electronics in much more compact form, in which an in-house developed impedance measurement device will replace the commercial impedance analyzer. Such an approach will reduce the dimensions and the overall price of the system. It will also be portable and easy to carry on. We will keep that in mind for future work. Moreover, the database with the look-up table in which specific patterns for various drinks, contaminants, and their concentration can be formed and stored in the memory of the readout device. The suitability of the proposed estimation method of the Cole-impedance model parameters for the deployment on the very small microcontroller-based platforms, such as XIAO SAMD21 with dimensions lower than 2 cm × 2 cm, will enable the realization of the integrated device that will ensure reliable and almost non-noticeable use in real life.
Footnotes
Acknowledgment
The authors would like to thank Momir Mikov from the Faculty of Medicine, University of Novi Sad, for preparing samples of ketamine in rakia.
Declaration of conflicting interests
The author(s) declared no potential conflicts of interest with respect to the research, authorship, and/or publication of this article.
Funding
The author(s) disclosed receipt of the following financial support for the research, authorship, and/or publication of this article: This project has received funding from the European Union’s Horizon 2020 research and innovation program under the grant agreement No. 854194.