
Abstract
The present study delves into the cognitive aspects of fabric hand evaluation, particularly under varying scenarios of real touch and visual representations (image, video). Conducted within a cognitive psychology framework, the study used a two-step rating-based double-faced applicability (DFA) test across a panel of 30 experts who evaluated 101 textile samples using 20 semantic differential descriptors. The findings indicate scenario-based discrepancies, especially pronounced within the thermal-wet sensation properties, underscoring the difference between real touch and visual representations on sensory ratings. By implementing the DFA test, the research reveals biases inherent in fabric hand evaluations and suggests modifications to enhance validity. This work not only contributes to textile quality assessment methods by recognizing scenario effects but also advances the understanding of the cognitive processing behind textile sensory perception.
Fabric hand, i.e., fabric tactile properties, plays a critical role in assessing textile quality, as it is correlates with the comfort, design, and visual appeal of garments. To meet increasing market demands, the textile industry continuously introduces innovative materials that offer a variety of tactile sensations.
The assessment of fabric hand generally encompasses both objective evaluations, using instruments such as the Kawabata Evaluation System 1 and the Fabric Assurance by Simple Testing, 2 which provide repeatable data, and sensory evaluations that quantify human touch through standardized tests by expert panels. 3 While objective evaluations measure physical properties, sensory evaluations, which have gained prominence in research,4 –6 capture the subjective feel of fabric, providing a more direct insight into tactile experience.
However, with the growing trend of remote working, conventional approaches to assess fabric hand properties through real fabric measurements have become limited. 7 They lack the capacity to convey the tactile experience directly. Grounded in the principles of cognitive psychology, particularly the memory association mechanism, certain research8 –11 has suggested that the integration of tactile experiences with visual input can evoke corresponding tactile memories upon encountering similar visual cues in touch-deprived environments. This lays a theoretical groundwork for evaluating fabric hand through visual assessment. Xue et al.12,13 pioneered this methodology using images and videos to visually represent fabrics for remote hand evaluation. Their study ventured into scoring fabric's semantic descriptors across three distinct scenarios, real touch, image, and video, pushing the boundaries of research in this domain.
However, in addition to the ambiguity of the scoring criteria, 14 the visual representation of fabrics in different scenarios also contributes to discrepancies between expert panels. 15 This means that the perception of a physically same fabric can vary depending on the panelist, and even the same panelist can perceive the same fabric differently depending on the scenario. Therefore, the present study aimed to develop a test methodology that accounts for the scenario effects in the sensory evaluation of fabric hand, seeking to understand how the cognitive interpretation of fabric visual representations influences subsequent hand evaluations.
For fabric hand sensory evaluation, a two-step rating-based double-faced applicability (DFA) test 16 was extended and applied. The DFA test, as a sensory test method, was introduced recently for attribute characterization. The differentiation of this test method is that “double-faced” descriptors were used in the attribute list. Namely, pairs of descriptors (upper-scale (+) and lower-scale (–)) for each attribute were responded. The upper-scale (+) and lower-scale (–) descriptors used in the attribute list represent the two sides of “double-faced” hand-relevant attributes for the target sample indicating the two other directions or counterparts (e.g., descriptors of met and unmet needs for the target sample). Typically, this does not imply a positive or negative impact from a hand evaluation perspective. This is because both aspects can be recognized as a positive or negative effect different usage scenarios, regardless of whether they are categorized as upper-scale (+) or lower-scale (–) descriptors. 17 However, in certain cases where the descriptors were selected and categorized as upper-scale (+) and lower-scale (–) through preliminary studies, 18 the upper-scale (+) can be interpreted as positive and the lower-scale (–) as negative hand attributes. Evaluating such “double-faced” descriptors aimed to bridge the gap between tactile attribute evaluation and the comprehension level of rating criteria, thereby reducing the central tendency bias, which is the propensity of evaluators to choose a neutral or middle option without fully considering the depth and implications of the rating scales provided. 19 Previous research confirmed that both amateur and trained panel evaluated sample in a stable way being less susceptible to response bias by using the DFA tests than one-sided attribute evaluations such as an applicability or intensity scaling. 20
In addition, the questionnaire for the DFA test consisted of two-step ratings (forced-choice yes/no questions, followed by a three-point sureness rating) for each descriptor. Predominantly, fabric hand attributes are assessed via scoring methods. However, these methods are often susceptible to response biases, particularly anchoring and central tendency biases.
21
Such biases can influence evaluator consistency, potentially overshadowing genuine variations among fabrics and skewing interpretative outcomes. Furthermore, the evaluative criteria underlying scoring can differ significantly between evaluators, leading to discrepancies in the interpretation and weightage assigned to each descriptor. To overcome such response biases, the DFA test uses indirect scaling, which uses forced choice yes/no questions based on signal detection theory (SDT)22,23 and Thurstonian approaches.
24
The advantage of such approaches is that they allow for the estimation of quantitative indices of attribute applicability independent of response bias. With the DFA test, quantitative indices could be obtained for each attribute in terms of d ′ affect/applicability magnitude (
After delving into the intricate relationships between different scenarios, descriptors, and evaluation results, the present study further explored the relationships between the sensory evaluation results and the intrinsic properties of the samples, such as fabric content and usage. The aim is to understand how essential properties of materials affect subjective human perception. The test method used to analyze the correlations between intrinsic properties and the sensory evaluation result was the two-step rating-based single-faced applicability (SFA) test, which only evaluates the upper-scale (+) descriptors for each attribute. In addition, the Mantel test 25 was utilized for its exceptional ability to detect correlations between matrices. This differentiation of the test method was to investigate the effectiveness and efficiency of different test methods and data analyses. Nevertheless, a detailed comparison of these data analyses is out of the scope of this paper.
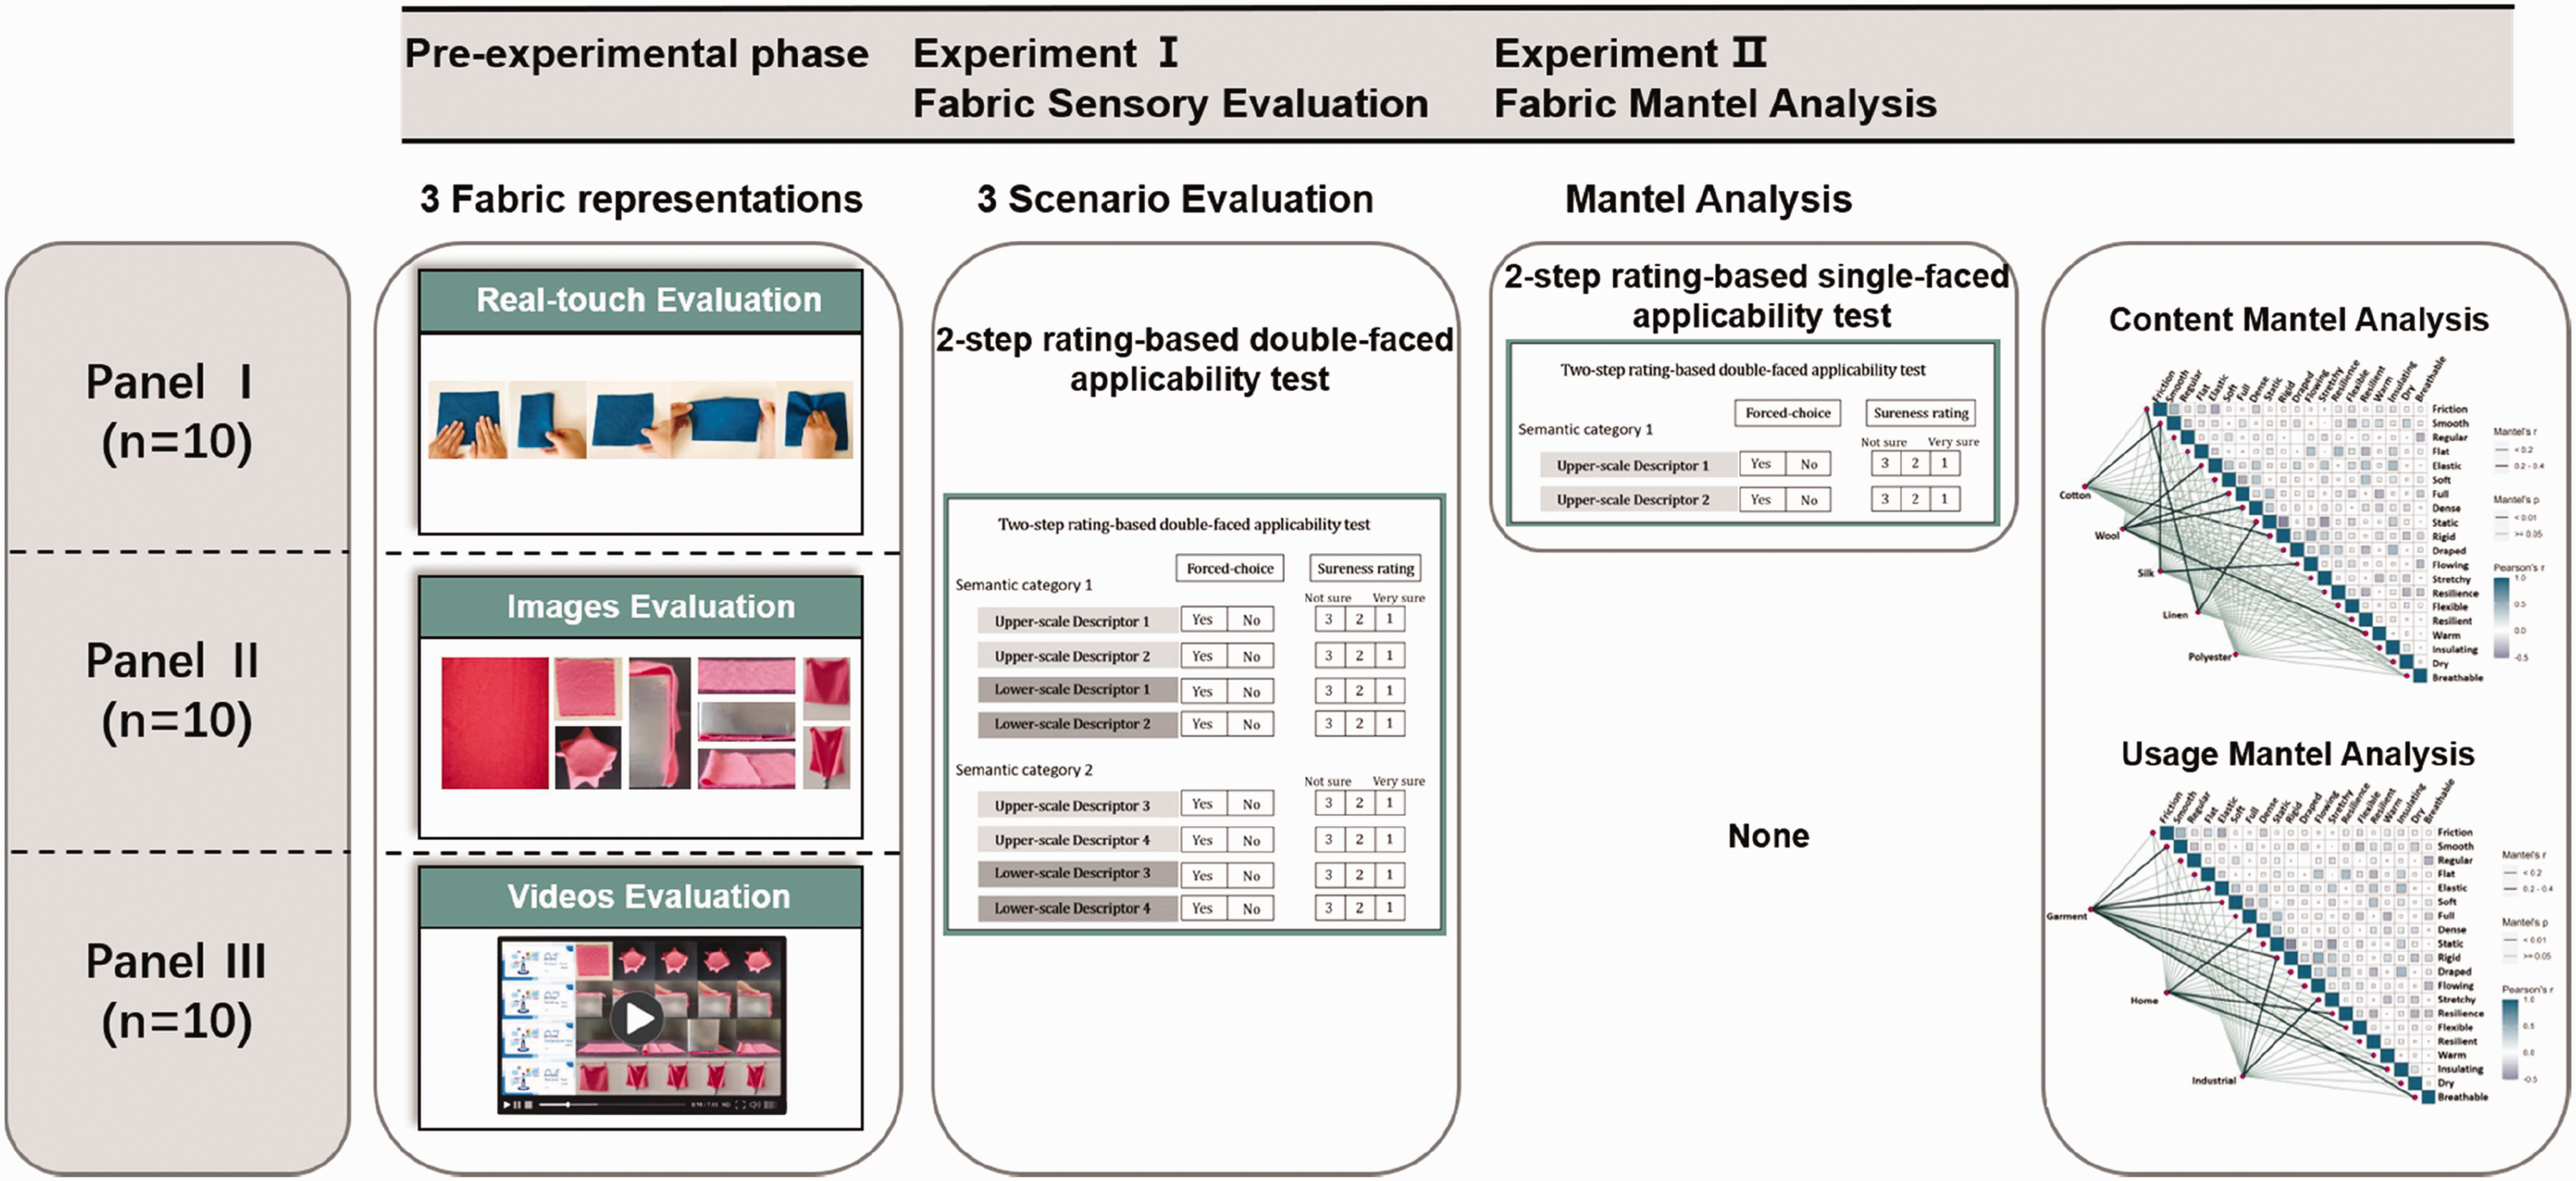
Overall, the primary objective of this study was to delve into the effect of varied fabric visual representation scenarios on subsequent fabric hand evaluations and then to understand the relationships between sensory evaluation outcomes and the intrinsic properties of the samples. Initially, three distinct fabric representations were introduced for evaluation in Experiment I: real touch (Panel I), image-based (Panel II), and video-based (Panel III). These representations served as distinct scenarios within a between-subject experimental design to examine the potential differences in fabric hand evaluations across the scenarios. Subsequently, Experiment II, which was limited to Panel I, delved into the fabric Mantel analysis, which used the Mantel test to decipher correlations between sensory results and intrinsic fabric properties. The overview of the whole experimental design is provided in Figure 1.
Materials and methods
Samples
A total of 101 textiles fabrics with diverse tactile properties were carefully chosen and fabricated into samples of specific dimension (15 cm × 15 cm). The various statistical information of the 101 samples is shown in Figure 2.
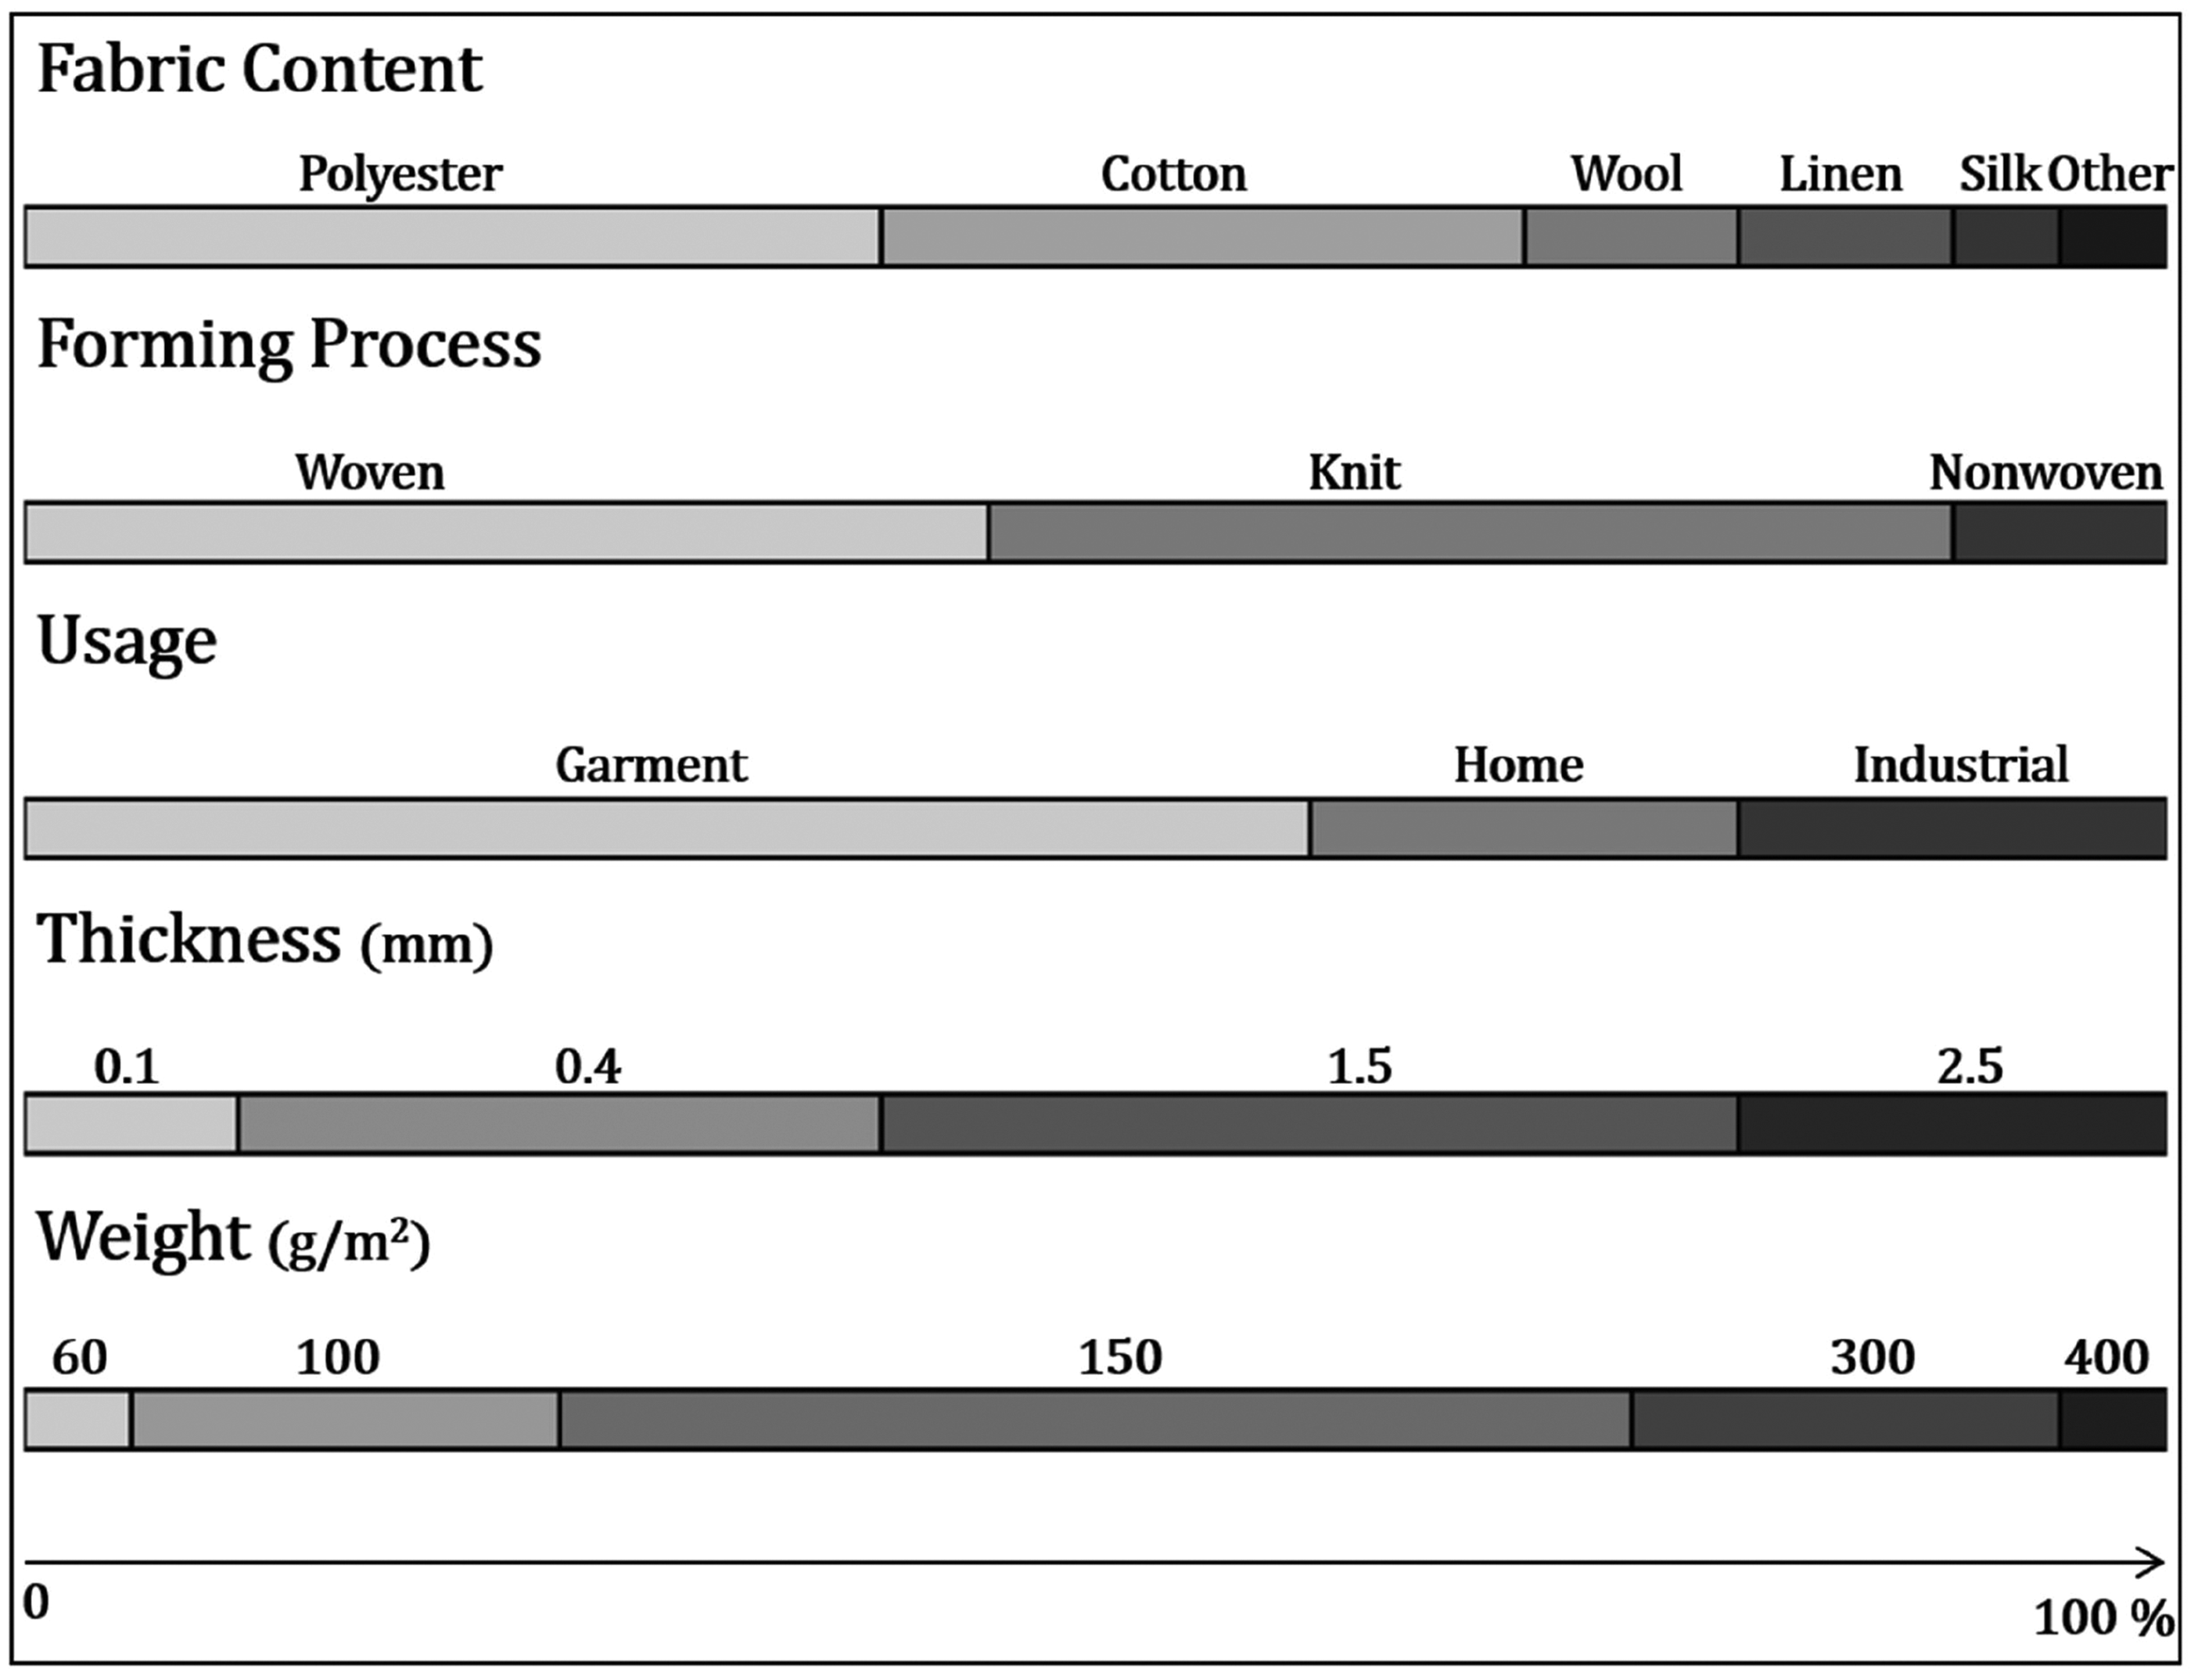
Statistical information of the 101 samples.
Creation of visual representations
For each sample, two visual representations were developed: static images and dynamic video clips. These two visual representations reflect the static deformation state of the sample as well as the time-series dynamic deformation process, respectively.
Creation of image representations
A digital single-lens reflex camera, capable of maximum resolution of 6720 × 3776 pixel, was used to capture images of each sample in 5 different states: surface image, drape deformation, compression deformation and recovery, bend deformation and stretch deformation. These states were selected to mirror potential interactions with the fabric, emphasizing visual indicators linked to tactile characteristics. Taking sample 1 as an example, Figure 3 shows its image representations consisting of five different states.
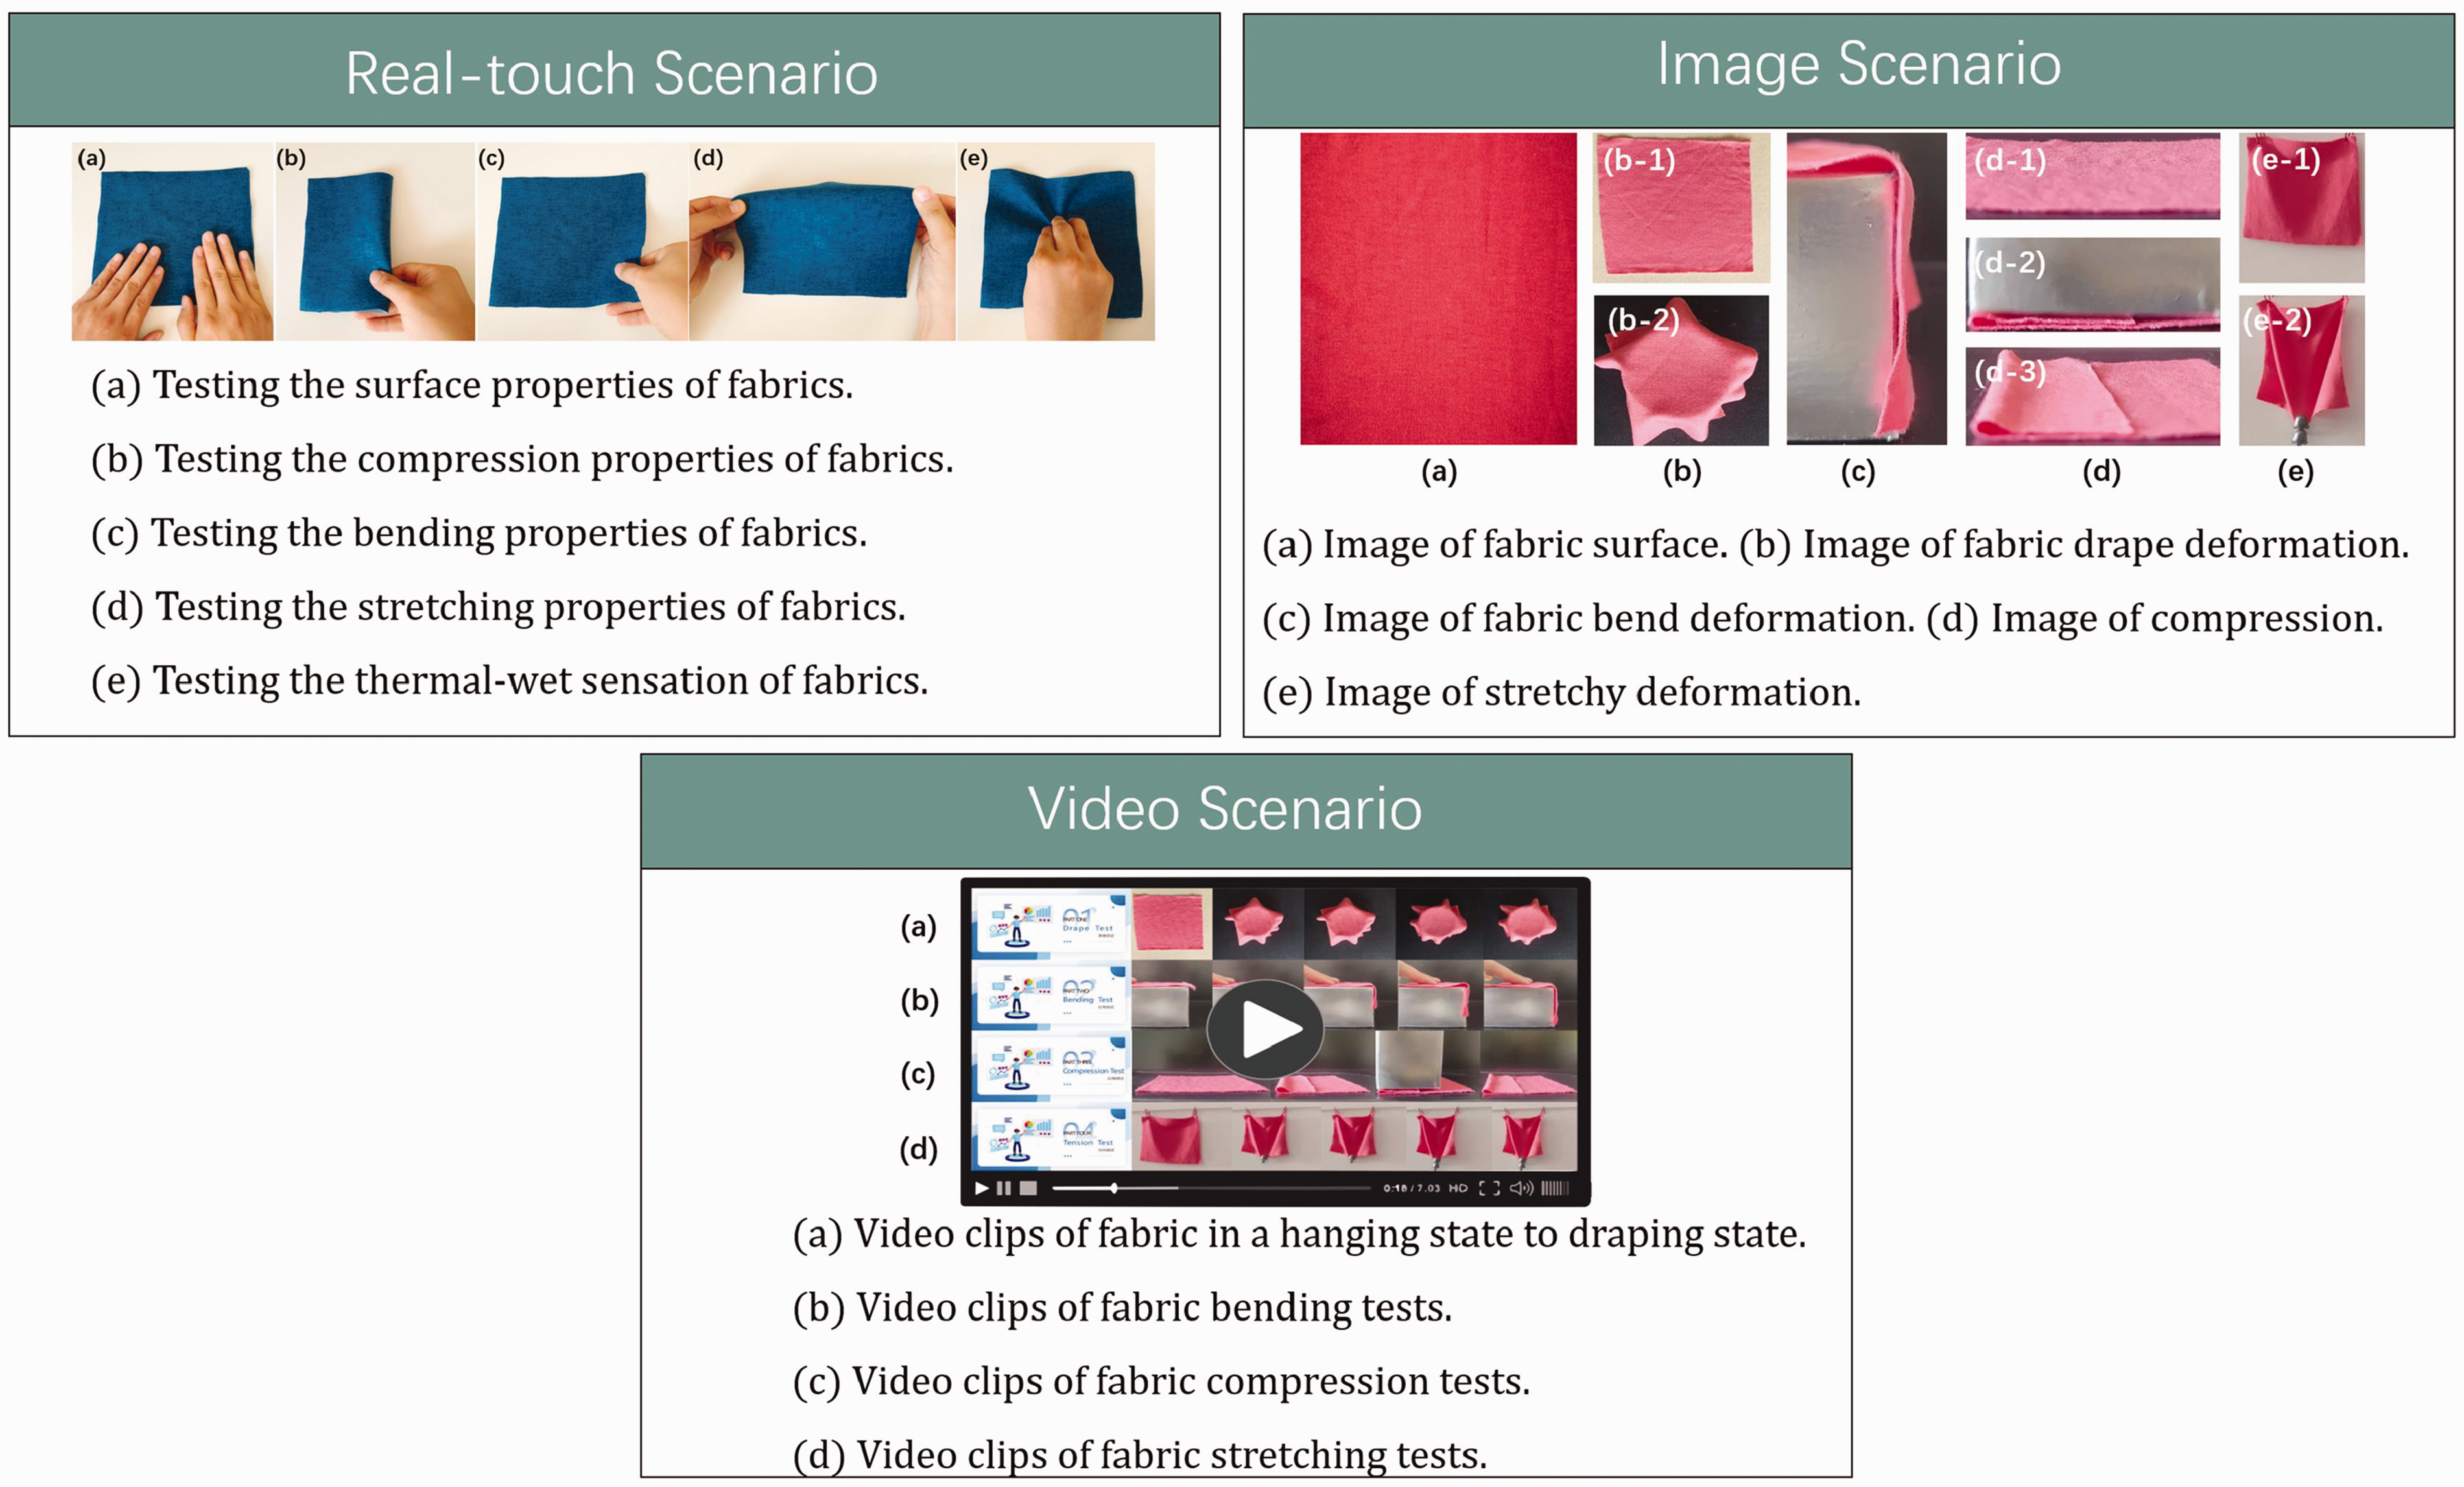
Representations with description of three scenarios for sensory evaluation.
Creation of video representations
A camera with a maximum resolution of 1920 × 1080 pixels was used to capture video clips for all samples. Four video clips were for each sample, including the entire deformation process of draping, bending, compression, and stretching, with the aim of dynamically presenting the tactile characteristics of the fabric. To maintain consistency in the video recordings, a set of predefined standards was established to ensure that each fabric sample was handled in the same manner. Figure 3 shows a screenshot of sample 1.
Panel
In the present study, hand evaluations were undertaken by a specialized panel of experts with a background in textiles. This panel included 30 individuals, split evenly by gender, with ages ranging between 23 and 55 years. Members of the panel were grouped into four distinct categories: academic faculty from textile institutions (encompassing lecturers, researchers, and research assistants), professionals from the textile industry (mostly those involved in fabric and fashion design), doctoral candidates, and postgraduate students affiliated with textile academies. Each member had previously been involved in at least two subjective evaluations assessing fabric hand.
Throughout the evaluation, every panelist assessed the samples across three distinct scenarios: real touch, image, and video. To avoid potential biases resulting from overlapping evaluations, each panelist was assigned to only one evaluation setting. The total of 30 panelists were arbitrarily divided into 3 panels of 10 participants each, who were then assigned to evaluate the 3 different scenarios.
Fabric tactile descriptors
Establishing evaluation criteria is essential for characterizing sensory space. To provide comprehensive tactile descriptions of the samples, the following procedure was designed and implemented.
Lexicon
Textile industry experts gathered to develop a comprehensive lexicon for fabric tactile properties. The session produced around 150 unique descriptors for everyday textile sensations.
Streamlining
Experts reconvened to filter the initial list of textile descriptors, eliminating subjective or ambiguous terms. The refined process resulted in a concise list of over 70 relevant terms.
Consolidation
The final list of descriptors was refined against relevant literature, 26 removing non-standardized terms or those with established equivalents, honing the preliminary list to an industry-standard lexicon.
Finally, the list of attributes used for the hand evaluation was composed of 20 pairs of semantic differential descriptors of 20 upper-scale (+) and 20 lower-scale (–) descriptors (listed in Table 1). To enhance comprehension, the experts categorized these tactile descriptors into five major classes based on the fabric properties they were intended to express. These categories include surface properties (four pairs), compression properties (four pairs), bending properties (four pairs), stretching properties (four pairs), and thermal-wet sensation (four pairs).
List of descriptors used for evaluation.*
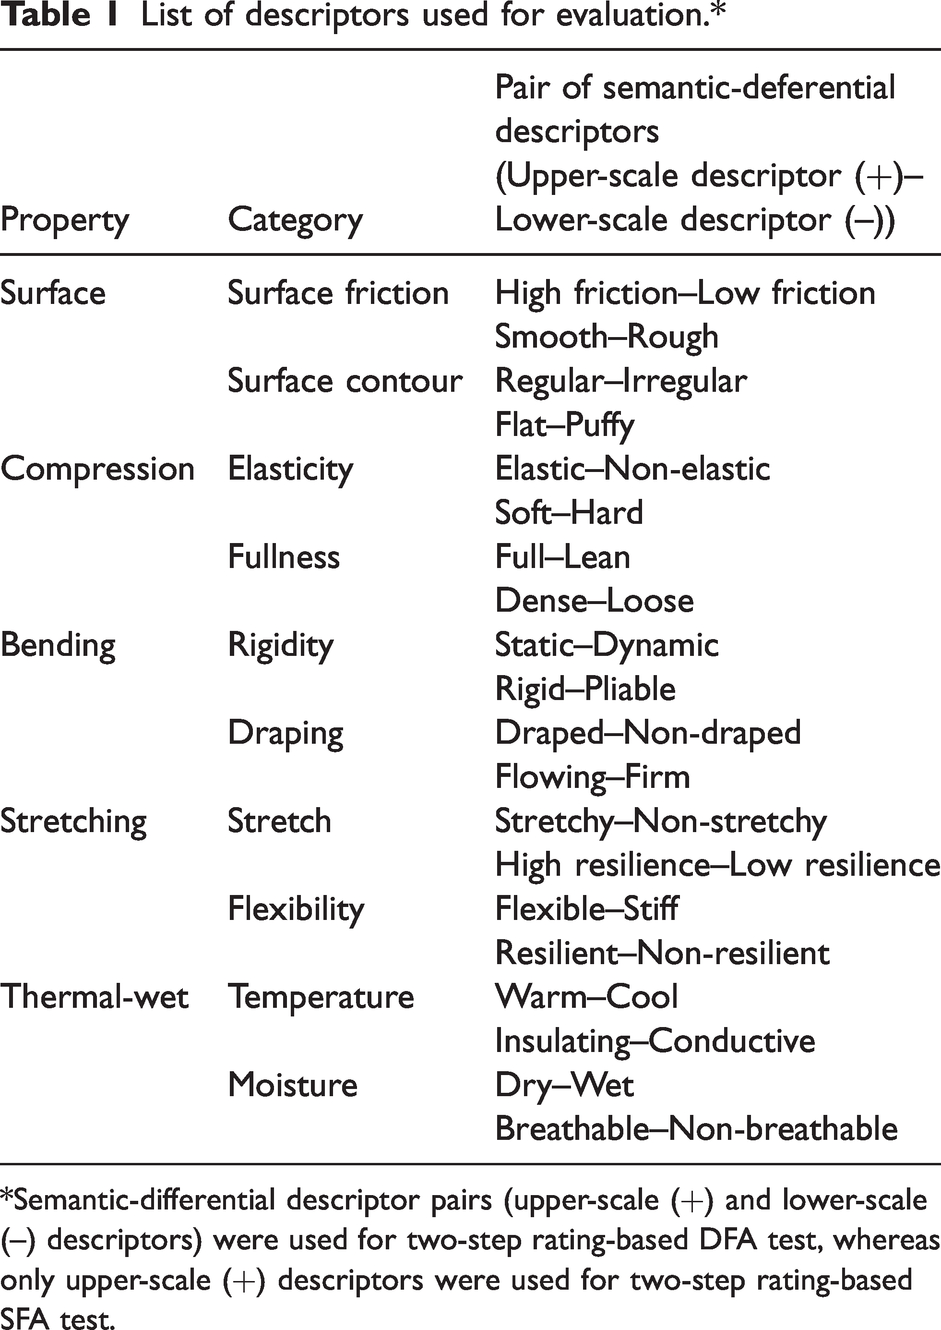
*Semantic-differential descriptor pairs (upper-scale (+) and lower-scale (–) descriptors) were used for two-step rating-based DFA test, whereas only upper-scale (+) descriptors were used for two-step rating-based SFA test.
For each descriptor pair, a detailed explanation to both its definition and the corresponding assessing gestures was determined by referring to the literature12,27 and, in particular, by carrying out a discussion among the experts. Initial tests were carried out to determine whether the evaluation methods were comprehensible and readily applicable for the panelists. An illustration is provided below.
Smooth-Rough:
Definition: This pertains to the surface texture of the fabric. Smooth fabrics present a slick tactile sensation, while rough fabrics present a textured or grainy one.
Gesture: To assess this attribute, the panelists felt the resistance by gently moving their dominant hand back and forth across the surface of the fabric.
Evaluation method
Evaluation environment and procedures
(a) Training
In the sensory evaluation, panelists were prepared to examine the fabrics through visual, tactile, or a blend of both perceptions. It was established that in a “real-touch” scenario, the comprehensive approach of seeing and touching would be employed for a more thorough evaluation. Prior to the evaluation, the 30 panelists underwent 6 hours of training to understand the sensory evaluation process and the objectives of various techniques. They were also briefed on the evaluation procedures tailored to different scenarios. To ensure familiarity with the descriptors and gestures to be used, training involved practice with a set of samples that were different from the 101 samples designated for the actual evaluation.
(b) Real-touch scenario
In the real-touch scenario, 10 panelists conducted evaluations after the 101 fabric samples were conditioned in a standard atmosphere of 20 ± 2°C and 65 ± 2% relative humidity for at least 24 hours. The assessments took place in a laboratory maintaining these conditions. Samples were arrayed on a large table, where panelists individually rated each one by a specific descriptor before proceeding to the next, ensuring a focused and isolated assessment. Before commencing, panelists were instructed to wash their hands with non-moisturizing soap and dry them with paper towels provided, starting their evaluations only when ready.
(c) Image scenario
For the image scenario, 10 panelists were tasked with evaluating 101 fabric samples through their images, which were displayed one by one on computer screens calibrated to identical display parameters. Each panelist conducted their assessment independently, with the flexibility to alter the sequence of images or adjust their size by zooming in or out as needed to facilitate a detailed examination.
(d) Video scenario
In the video evaluation scenario, 10 panelists individually assessed the fabric samples through video clips presented sequentially on computer screens, all meticulously adjusted to the same display parameters. They had autonomy over the playback, with the ability to pause the videos at their discretion for a more precise evaluation.
Evaluation scales
For evaluating fabric hand, the two-step rating-based DFA test was applied to measure panelists’ evaluations under each scenario. Panelists were presented with the question, “Please indicate whether the descriptor is applicable to your evaluation of fabric tactile properties in the specific evaluation scenario, and the sureness of your response.” Panelists were asked to respond with either “Yes” or “No” and then rate the certainty of their previous response using a three-point categorical scale marked as 1 = “not sure” and 3 = “very sure” for each descriptor (Figure 4(a)).
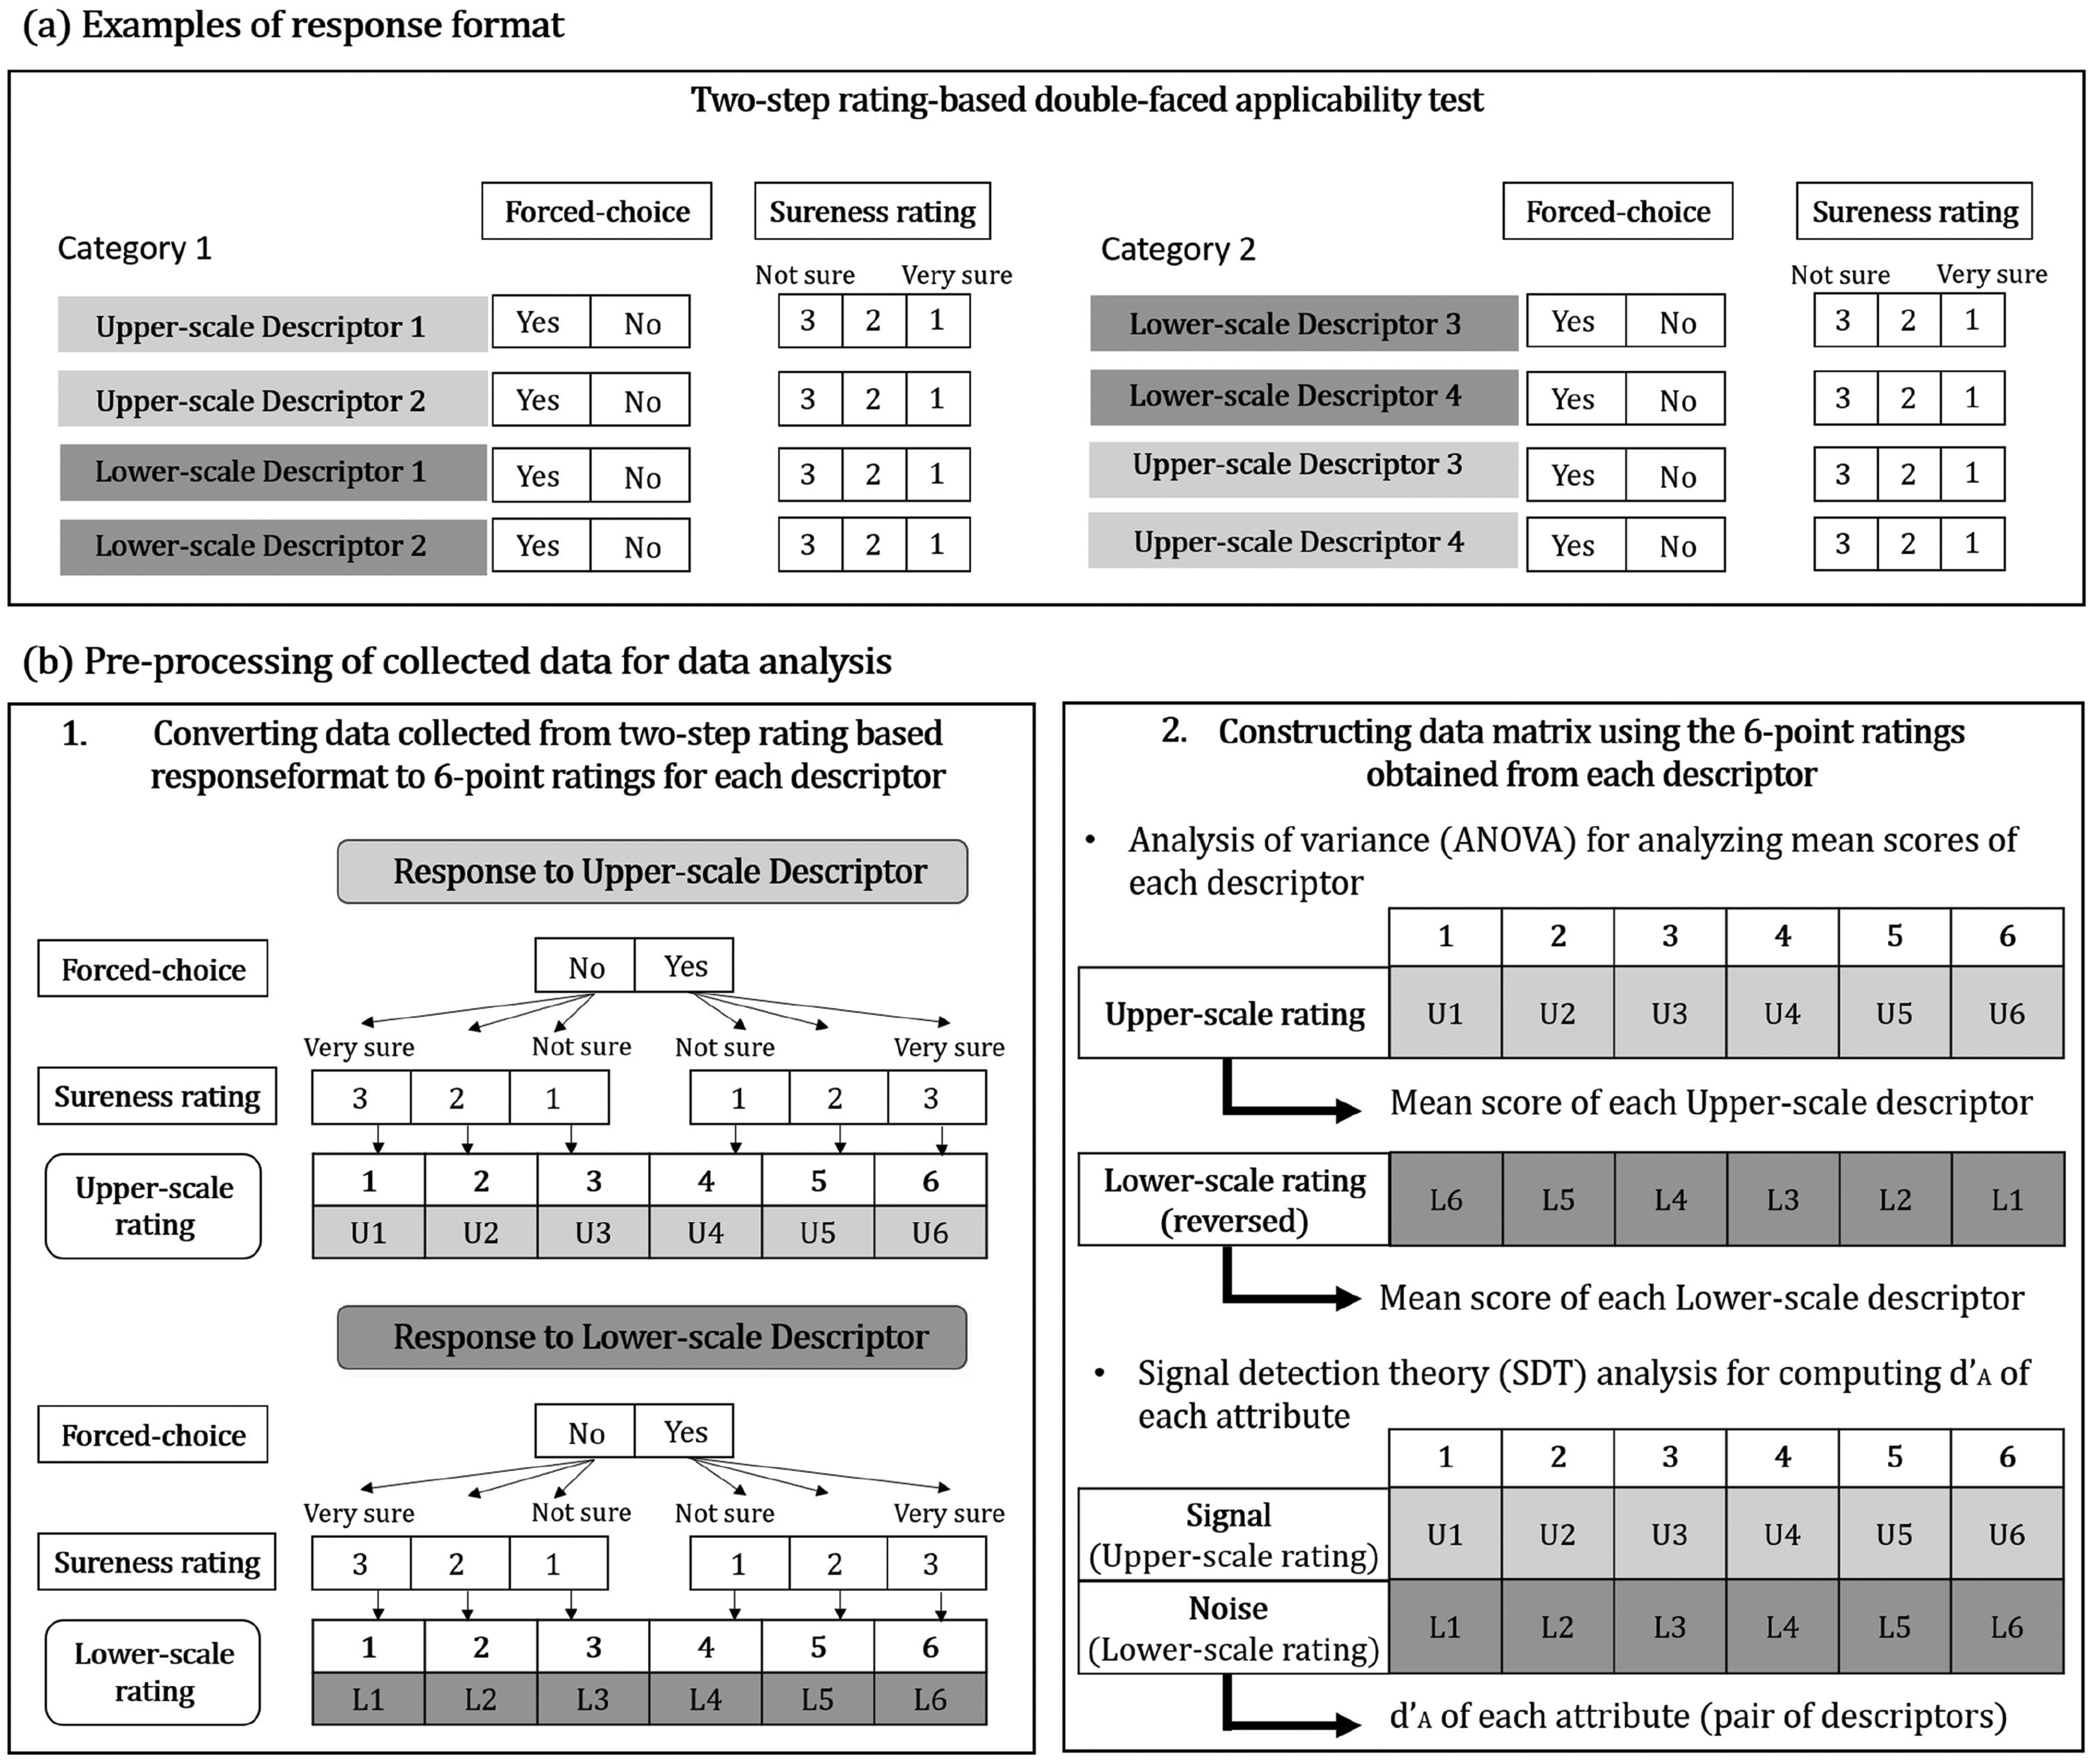
Illustration of example of the (a) double-faced applicability (DFA) test. (b)-1 How to convert the collected data for each upper-scale (+) and lower-scale (–) descriptor to two different ratings and (b)-2 data matrix for data analysis.
The evaluation attributes consisted of 20 pairs of semantic differential descriptors, with each pair composed of an upper-scale (+) descriptor and a lower-scale (–) descriptor. In the present study, the upper-scale (+) descriptors can be interpreted as positive hand attributes, while the lower-scale (–) descriptors can be interpreted as negative hand attributes for the panelists.
Data for each descriptor collected from the rating-based scale were aggregated and transformed into two different types of six-point ratings: upper-scale (+) ratings and lower-scale (–) ratings (Figure 4(b)-1). For upper-scale (+) ratings, responses obtained from the upper-scale (+) descriptors were converted into a single six-point rating scale ranging from 1 to 6. For example, if a panelist selected “Yes” and “3” (very sure) on the rating-based scale, the response would be converted into a rating of 6. Conversely, if a panelist selected “No” and “3” (very sure), the response would be converted into a rating of 1. In the case of lower-scale (–) ratings, responses obtained from the lower-scale (–) descriptors were also transformed into six-point ratings. For the purpose of analysis of variance (ANOVA) with upper-scale (+) ratings, the ratings for the lower-scale (–) descriptors were reversed to create a mirror structure. This was done to test the influence of descriptor conditions (differences in response patterns caused by using upper-scale (+) or lower-scale (–) descriptors). Thus, for the lower-scale (–) descriptor condition, if a participant selected “Yes” and “3” (very sure), the response would be converted into a rating of 1. Similarly, if a participant selected “No” and “3” (very sure), the response would be converted into a rating of 6.
Data collection
All data for the experiment were collected using computers with Microsoft Excel 2016, which included the CheckBox function. The response sheets for each test were displayed on the computer screens, and participants were required to click on the CheckBox corresponding to their responses.
In the sensory evaluation, the presentation order of descriptors on the response sheet was randomized within each panelist to reduce primacy bias and avoid satisficing response behavior. 28 However, considering the potential confusion for the panelists, the presentation order of descriptors was randomized within each category rather than across categories. In addition, in the case of DFA testing, the upper-scale (+) and lower-scale (–) descriptors were presented separately within each category. For example, within a category, all the upper-scale (+) descriptors were presented first, followed by the remaining lower-scale (–) descriptors; alternatively, all the lower-scale (–) descriptors were presented first, followed by the remaining upper scale (+) descriptors.
Data analysis
To investigate the effects of scenarios and descriptors, a multiway mixed ANOVA model was applied to the converted six-point rating results for each attribute (Figure 4(b)-2). For the sensory evaluation data, a four-way mixed-effects ANOVA model was utilized. The scenarios, descriptors, and their interaction were set as fixed factors, while the panelists and samples were set as random factors. The descriptors were one of the fixed factors in the mixed ANOVA model, and for each evaluation scenario, the two different upper-scale (+) and lower-scale (–) ratings obtained in the DFA testing were compared.
The four-way mixed-effects ANOVA model was fitted using the lmer function in the lme4 package. 29 Analysis was conducted via the variance function of the lmerTest package 30 in the R statistical software. 31 The Satterthwaite's approach was used to estimate the degrees of freedom. For identifying significant differences between various scenarios and descriptors in multiple comparisons, post hoc test was conducted utilizing least squares mean differences with a 95% confidence interval.
The non-parametric estimates of the measure of output for group mean were computed by adopting SDT to analyze the sensory evaluation in the DFA testing. By using the converted six-point ratings for each upper-scale (+) and lower-scale (–) descriptor in the DFA testing,
Results
Mean score calculated from the mixed ANOVA model
As shown in Figure 5, out of the 20 pairs of descriptors, 4 pairs exhibited significant scenario effects, and 6 pairs showed descriptor effect. In addition, among the descriptors that exhibited an interaction effect between scenarios and descriptors, two pairs of descriptors showed significant interaction effects between the scenario conditions and descriptor conditions.
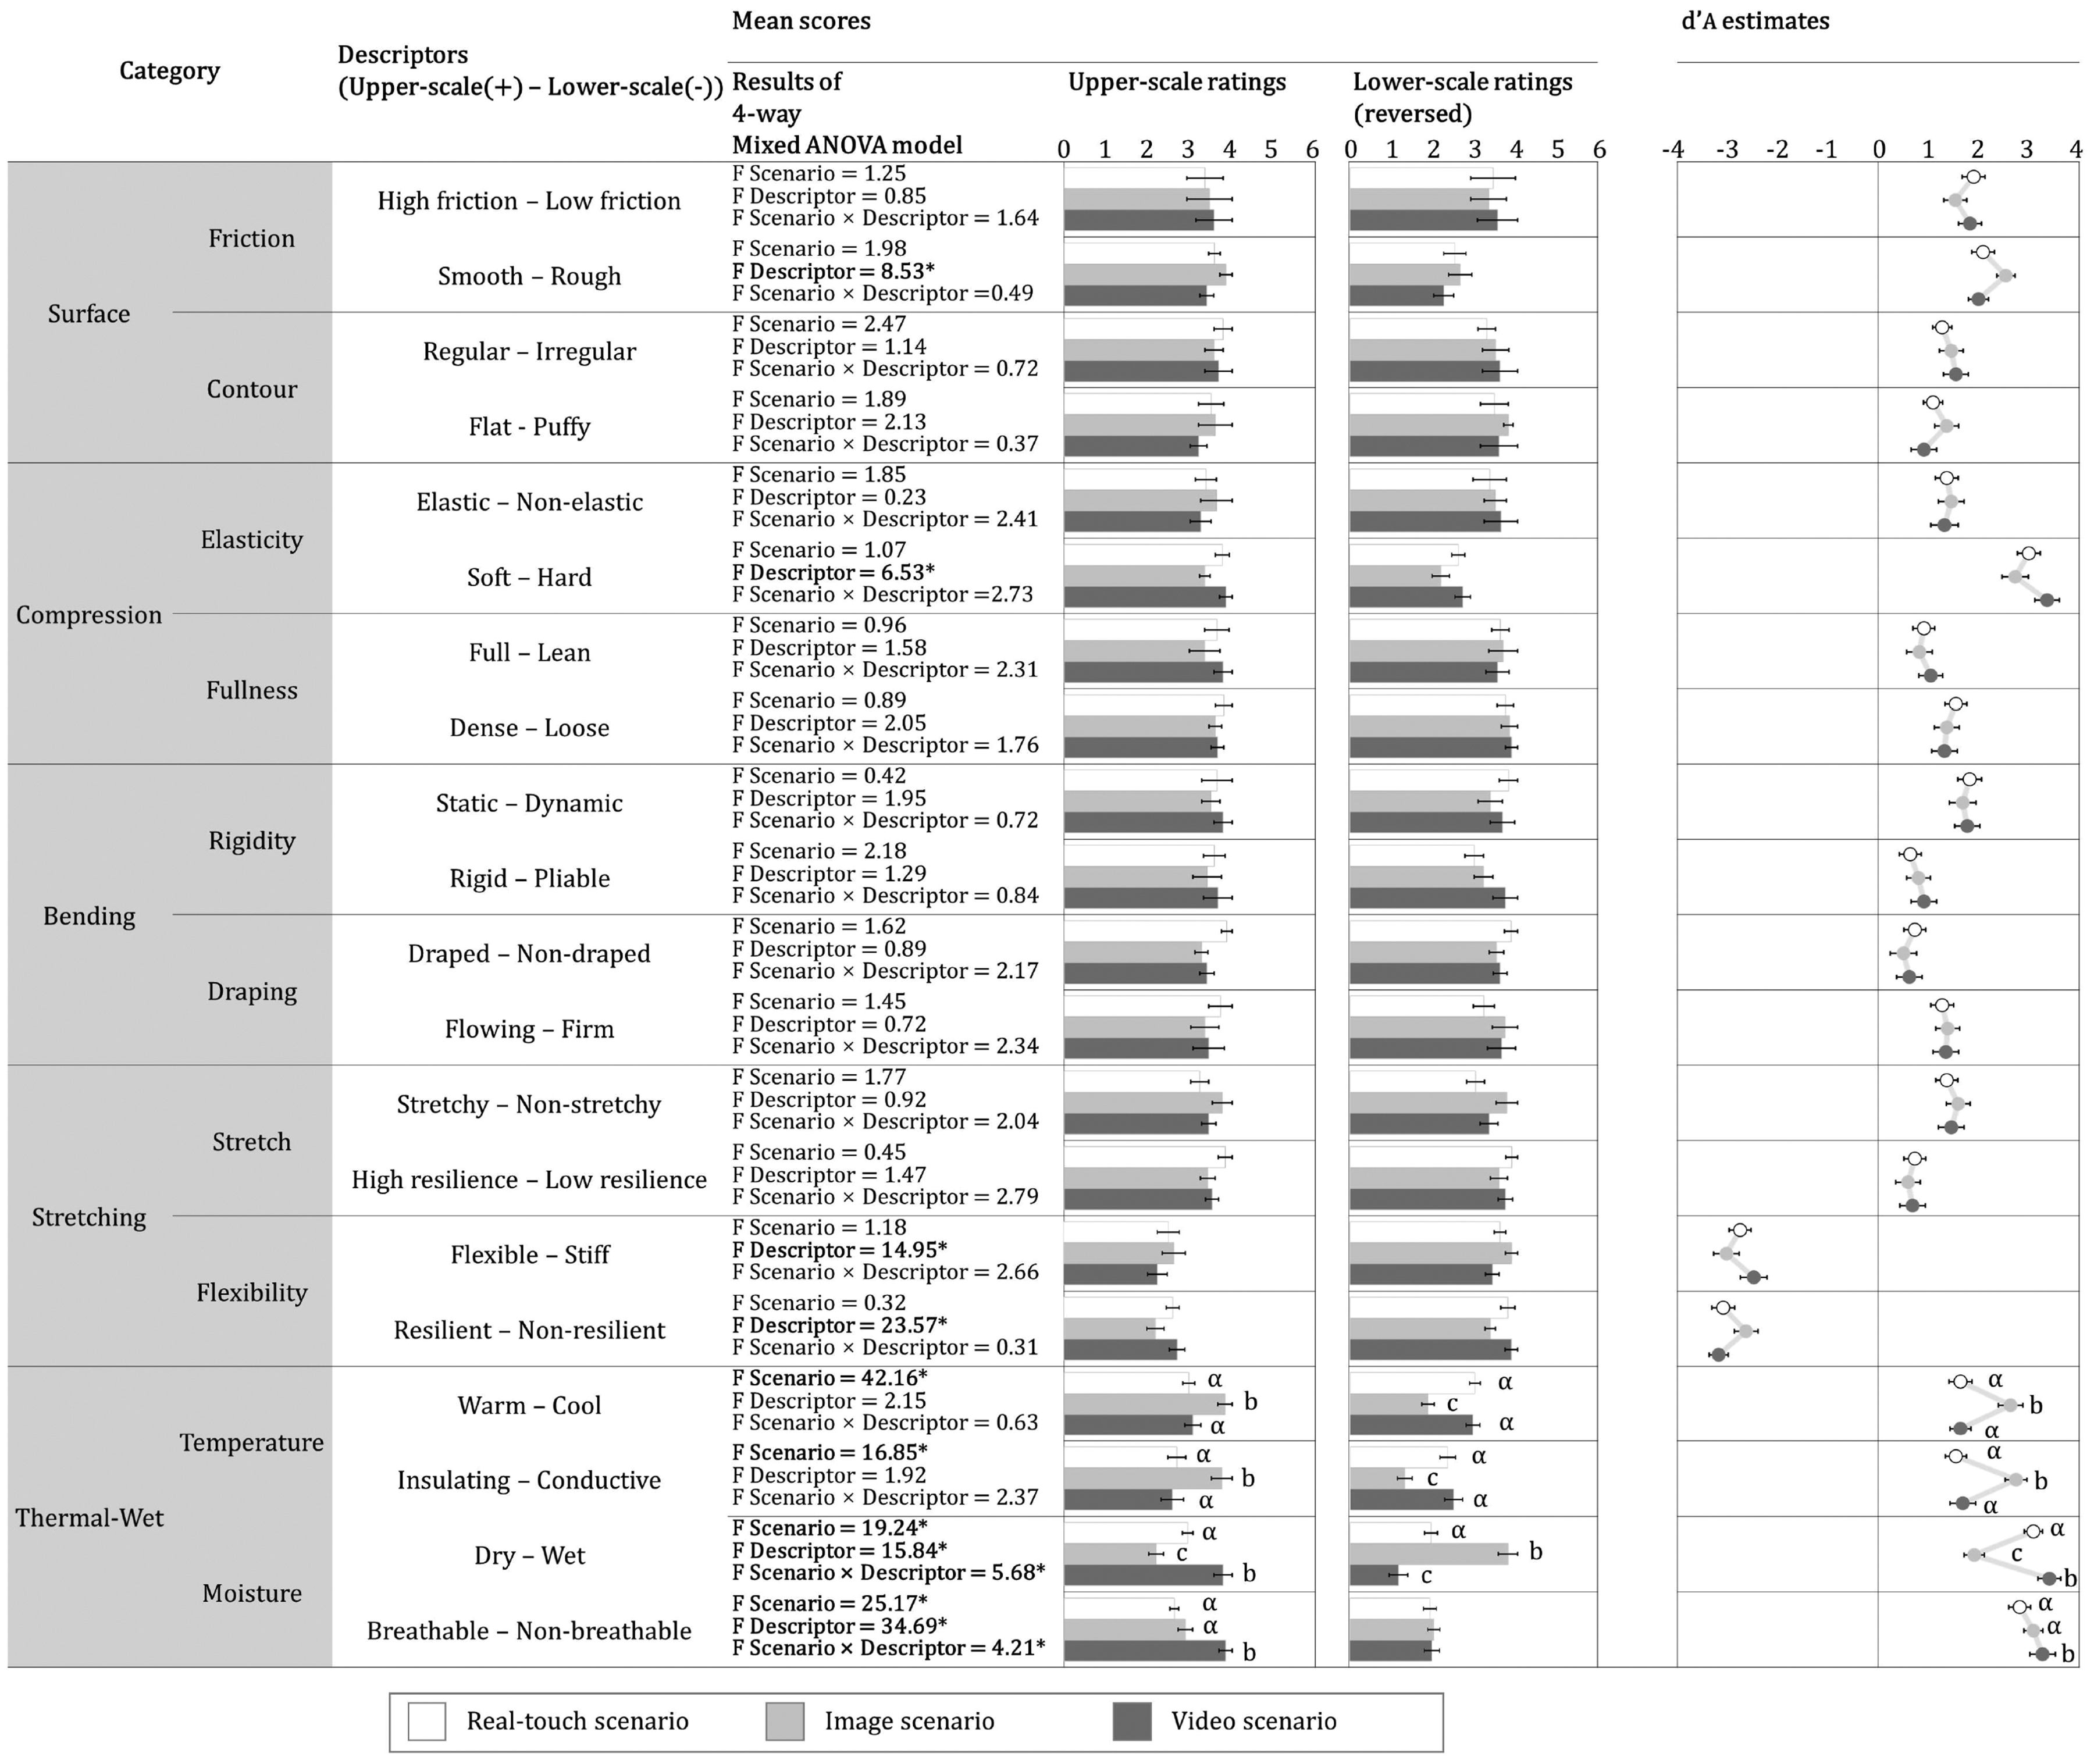
Results of panelists responses to fabric hand evaluation. The mixed model ANOVA was used to evaluate the influence of scenario and descriptor condition on fabric hand means of 1 to 6 point indirect scale ratings, and
Scenario effects
All descriptors, including the pairs of “Warm (+)–Cool (–),” “Insulating (+)–Conductive (–),” “Dry (+)–Wet (–),” and “Breathable (+)–Non-breathable (–),” in the thermal-wet category showed significant difference in mean scores for scenario (Figure 5). All these descriptors were significantly reflecting the thermal-wet properties of the fabric, which can be directly assessed in the real-touch scenario. The mean scores of all these descriptors exhibited irregular patterns across the three scenarios. For the descriptor of “Warm (+),” mean score of the image scenario was significantly higher than scores of the real-touch scenario. In contrast, the mean score of the descriptor “Cool (–)” in the image scenario was significantly lower than in the real-touch scenario. This result suggested that in the image scenario, the panelists perceived a majority of the samples to have both a “warm” and “cool” sensation in the temperature category, which is inconsistent and indicates a lack of clarity in the panelists’ criteria for this particular descriptor pair. The same result is also observed for the “Insulating (+)–Conductive (–)” descriptor, where the mean score of “Insulating (+)” in the image scenario is significantly higher than in the real-touch scenario, whereas the mean score of “Conductive (–)” in the image scenario is significantly lower than in the real-touch scenario. This difference indicated that panelists in the image scenario perceived higher levels of insulation and conductivity compared with the real-touch scenario. In the moisture category, the “Dry (+)–Wet (–)” descriptor showed the same result in the image scenario but exhibited the opposite result in the video scenario. On the other hand, the “Breathable (+)–Non-breathable (–)” descriptor only demonstrated conflicting results in the video scenario, where the mean score of “Breathable (+)” in the video scenario is higher than in the real-touch scenario and the mean score of “Non-breathable (–)” in the video scenario showed little difference compared with the real-touch scenario.
Descriptor effects
There were significant differences between the responses of upper-scale (+) and lower-scale (–) descriptors in the DFA test in 6 of 20 descriptor pairs. Most of these are descriptors belonging to the stretching property and flexibility category. Of them, the mean scores of upper-scale (+) results were significantly higher than those of reversed lower-scale (–) results for the pairs of “Smooth (+)–Rough (–),” “Soft (+)–Hard (–),” “Dry (+)–Wet (–),” and “Breathable (+)–Non-breathable (–).” In contrast, the mean scores of reversed lower-scale (–) results were significantly higher than those of upper-scale (+) results for pairs of “Flexible (+)–Stiff (–)” and “Resilient (+)–Non-resilient (–).” It was evident that the results of the lower-scale (–) descriptors and upper-scale (+) descriptors for the same category vary depending on the specific sensory evaluation descriptor pairs.
Interaction effects of scenario and descriptor
The interaction between scenario and descriptor was established for the two pairs of “Dry (+)–Wet (–)” and “Breathable (+)–Non-breathable (–).” These results showed that the influence of scenario on these pairs differed across descriptor (upper-scale (+) versus lower-scale (–) descriptor). Concretely, for the descriptor pair of “Breathable (+)–Non-breathable (–)”, there was no difference in the mean scores of lower-scale (−) descriptors between the scenario of real-touch and image, whereas mean scores of upper-scale (+) descriptors for the scenario of image were significantly higher. For the descriptor pair of “Dry (+)–Wet (–),” mean scores of lower-scale (–) descriptors for the scenario of real touch was significantly higher than video, whereas the pattern was reversed for the upper-scale (+) descriptors.
Estimates of
calculated from SDT analysis
To determine the detailed and quantified sensory evaluation for fabric in each scenario,
Based on the
Correlation analysis between attributes and intrinsic properties
In Figure 6(a), a detailed correlation analysis is presented based on the sensory evaluation results obtained from the panelists. The sensory attributes evaluated in real-touch scenario were correlated with intrinsic fabric properties, such as fabric content and usage, using the Mantel test. It is observed that cotton has a marked correlation with attributes of smoothness and rigidity, reflecting the innate soft touch and superior shape retention that is characteristic of cotton fabrics. Wool, in contrast, aligns closely with elasticity, fullness, and density, mirroring its quintessential thick, soft, and resilient hand. Silk stands out with a notable association to smoothness and flowing, perfectly encapsulating the lustrous and elegant texture that is unique to silk textiles. Linen, on the other hand, reveals strong ties with friction and static, indicative of its inherent surface coarseness and stable form. An intriguing observation emerges with polyester; it does not show a substantial correlation with any specific hand attributes. This non-distinctiveness can be attributed to the myriad processing and finishing techniques employed for polyester, where varying methods can significantly modify its tactile perception, leaving it without a pronounced stylistic trait.
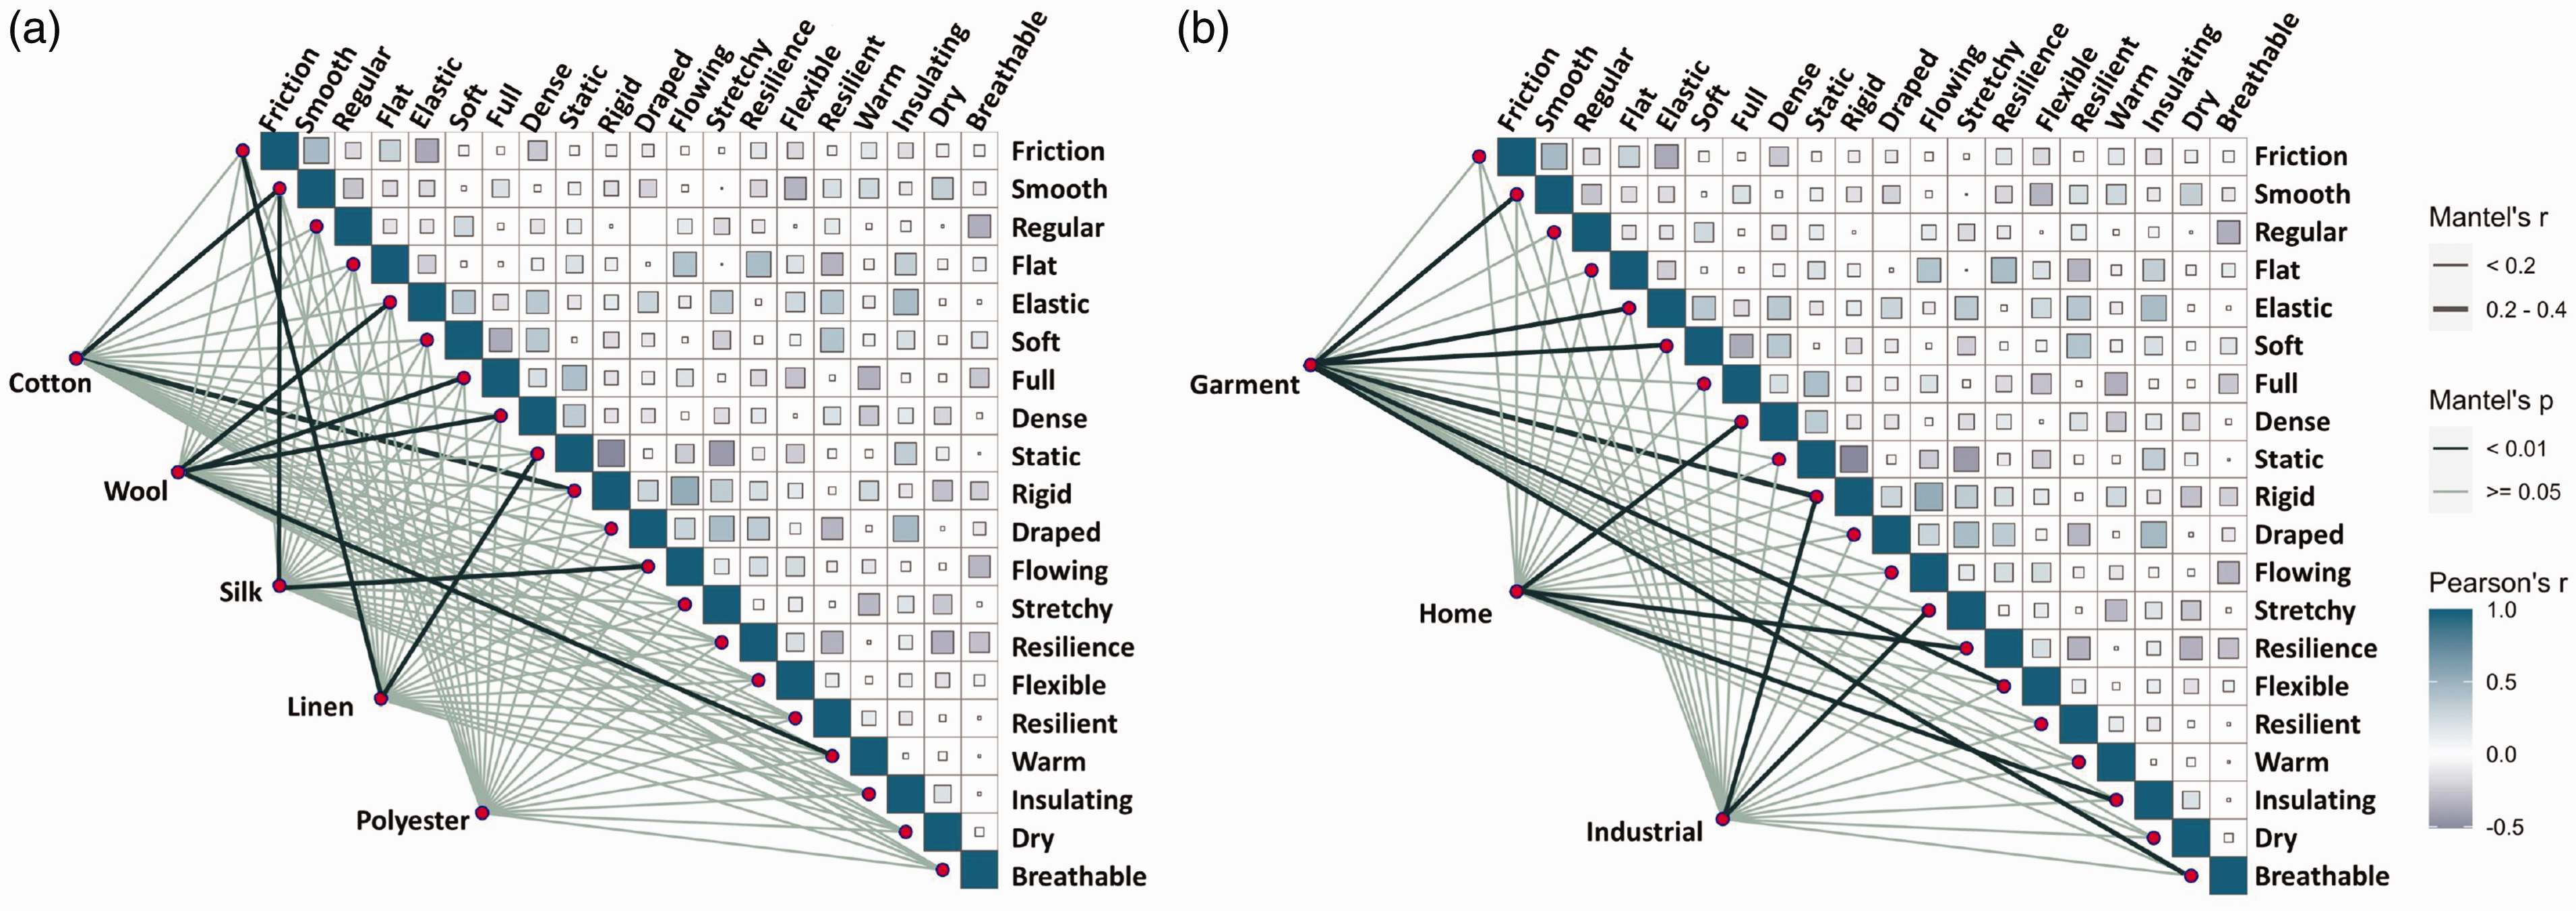
Correlation analysis between sensory attributes and intrinsic properties of fabrics are shown, with a color gradient denoting Pearson’s correlation coefficients. (a) Fabric content was related to each sensory attribute by partial Mantel tests. Edge with corresponds to the Mantel’s r statistic for the corresponding distance correlations, and edge color denotes the statistical significance and (b) Usage was related to each sensory attribute.
As shown in Figure 6(b), the correlation analysis based on usage reveals significant associations. Garments demonstrate strong correlations with attributes such as smoothness, elasticity, softness, rigidity, flexibility, and breathability. This is in line with the expectation that fabrics used for clothing prioritize comfort. For Home textiles, there are notable correlations with density, resilience, and insulation, which aligns with the anticipated emphasis on texture and shape retention for home textiles. Lastly, industrial textiles show significant correlations with rigidity and stretch, resonating with the expectation that industrial textiles emphasize mechanical properties and resistance to fatigue aging.
Discussion
The present study is a part of a large project focused on proposing an automated method for fabric hand evaluation. First of all, this part aimed to focus on the scenario effects and its interaction with the descriptor (upper-scale (+) versus lower-scale (–)) on fabric hand evaluation by independently analyzing the data obtained from each scenario as shown in Figure 1.
Effects of scenario on fabric hand evaluation
Based on our results, it was found that panelists evaluation results differed when under different evaluation scenarios for fabric hand evaluation. In other words, it was confirmed that the scenario affected panelists’ evaluation ratings of fabric hand. In particular, for the thermal-wet category, all attributes evaluated in this part showed significant differences between scenarios. This part of the experiment also confirmed that there was no significant difference observed in the evaluation of fabric tactile properties, specifically surface properties, compression properties, bending properties, and stretching properties, between the visual presentation (image scenario and video scenario) and real-touch fabric hand evaluation. In contrast, there were significant differences observed in the evaluation of fabric thermal-wet sensation, which considers the heat and moisture transfer properties of the fabric, between the visual presentation and real-touch fabric hand evaluation. Specifically, for the attribute “Warm (+)–Cool (–)”, the evaluations obtained from the image scenario reflected high levels of assessment for both “Warm (+)” and “Cool (–),” indicating a confusion in evaluation criteria when assessing this attribute based on visual presentation. Similar results were observed for the attribute “Insulating (+)–Conductive (–).” The confusion in evaluation criteria further demonstrates that using visual presentation to analyze the thermal-wet category deviates significantly from the actual real-touch results, indicating a lack of reliability in this context.
For the surface and compression category, mean scores for “Smooth (+)” and “Soft (+)” were significantly higher in the all three scenarios. This result can be easily understood by considering the fact that panelists tend to highly evaluate the attributes of smoothness and softness as excellent qualities of textiles when conducting hand evaluation. Similarly, panelists perceive attributes such as “Stiff (–)” and “Non-resilient (–)” as indicators of an unpleasant tactile experience. Therefore, these attributes are expected to be significantly less preferred or desired in hand evaluations of fabrics.
In this part, to quantify the evaluation profile, the DFA test format, which was previously developed for evaluating consumer sensory experience, was first applied to the fabric hand evaluation. Using this approach, the quantitative output measures (
In general, the upper-scale (+) and lower-scale (–) descriptors just indicate the two other directions or counterparts, not meaning positive or negative affect from a panelists’ point of view. However, since the fabric hand relevant attribute list used in the present study was derived from a preliminary study conducted in various experiences, upper-scale (+) descriptors are interpretable as a positive effect and lower-scale (–) descriptors as a negative effect. The evaluations for each attribute may differ depending on the group of panels, who vary in terms of culture and experience and, thus, the
Effects of scenario on upper-scale (+) and lower-scale (–)
The DFA test was designed to evaluate both the upper-scale (+) and lower-scale (–) aspects of an attribute, and it was found that panelists can perceive them ambivalently on the same sample at the same time, indicating that the panelist responses may vary depending on the upper-scale (+) and lower-scale (–) aspects of descriptors provided. When the DFA test was applied to measure panelists’ evaluation using the thermal-wet category, as in the descriptor pair of “Warm (+)–Cool (–),” panelists responded that they perceived both upper-scale (+) and lower-scale (–) descriptors, indicating that the sample evoked an ambivalent response to those descriptors.
In this part, the effects of descriptor have been observed in many attributes, meaning that panelists did not respond to the two-step rating response options of the upper-scale (+) and lower-scale (–) descriptors in a reciprocal or parallel bipolar dimension. In detail, panelists responded in reciprocal or parallel to upper-scale (+) and lower-scale (–) descriptors in the forced-choice yes/no question used as the first step in the DFA test. For example, if there were many yes responses to upper-scale (+) descriptors, there were many no responses to lower-scale (–) descriptors, and vice versa. In addition, there were differences between the upper-scale (+) and lower-scale (–) descriptors conditions, in the second rating step in the DFA test. Moreover, two descriptor pairs that had the descriptor effect on the evaluation rating also showed the interaction effect with the scenario effects: “Dry (+)–Wet (–)” and “Breathable (+)–Non-breathable (–)”. Among them, the sureness rating has been used more sensitively in the lower-scale (–) descriptors than the upper-scale (+) for the scenario, while in the case of “Dry (+)–Wet (–)” it was more rated ambivalently in the visual scenario than in real-touch scenario. There is still a possibility that these differences occurred by chance but the results imply that the panelists interpret the upper-scale (+) descriptor differently from the lower-scale (–) depending on the descriptor. As at present it is unknown if the effect of the descriptor is significant and/or which descriptor is more accurately reflective of panelist’s criteria, more research into this question is needed.
Regarding the list of attributes for the DFA test, when pairing the descriptors of a conceptual attribute, if possible, the counterparts of positive or negative descriptors were used for each descriptor for being evaluated as either upper-scale (+) or lower-scale (–) descriptor. On the other hand, if counterparts of upper-scale (+) descriptors are not available, lower-scale (–) descriptors were made by adding just non- to the upper-scale (+) descriptor. Most basic sensory quality attributes (e.g., Elastic, Draped, Stretchy, and Breathable) correspond to this case, and it could be interpreted whether the attribute is upper or lower in terms of sensory intensity attributes. However, by calculating the applicability magnitude of each attribute from the response ratio of upper-scale (+) and lower-scale (–) descriptors, it could be possible to check whether panelists consistently align or form a consensus with regard to the concept/meaning of the attribute. If a pair of descriptors is applicable to a sample, especially for the sensory quality attributes, then concept alignment has not been reached among a group of panelists since it might be awkward to respond that the pair of descriptors for sensory quality is elicited concurrently. Furthermore, by offering a broader range of response options using a pair of descriptors, it can prevent panelists from being restricted to express their sensory experience compared with when only a one-sided descriptor is provided. However, depending on how the pairs of descriptors are established, they may or may not be evaluated in a reciprocal and parallel bipolar dimension. If the pair of descriptors are evaluated consistently in a reciprocal manner, it may be more efficient to evaluate only a one-sided descriptor. Further study will be needed to determine how to select and establish appropriate pairs of descriptors to investigate the effects of upper-scale (+) and lower-scale (–) descriptors on the panelists’ responses in depth.
Sensory attributes and intrinsic properties of fabrics correlations
The correlation analysis presented in Figure 6 elucidates the sensory attributes of various textiles and their alignment with specific uses. Cotton's affinity with smoothness and rigidity, wool's with elasticity and density, and silk's with smoothness and flow each echo their traditional uses in garments that require comfort, warmth, and elegant drape, respectively. Linen's strong ties with friction and static reflect its natural coarseness and stability, whereas polyester's lack of significant correlations highlights its versatility as a result of diverse manufacturing techniques.
In terms of usage, the findings showed a clear alignment of garment textiles with comfort-related attributes, home textiles with structural and insulating properties, and industrial textiles with mechanical strength. These associations underline the importance of selecting appropriate materials to meet the functional demands of textiles in different applications, providing a nuanced understanding that can inform future material selection and textile design.
Conclusions
The results of the present study showed that it is possible to reliably evaluate panelists ratings of fabric hand by applying SDT rating measurements using the DFA test without influencing their bias and experience evaluation results. In addition, in comparing indirect panelist rating responses to a list of upper-scale (+) versus lower-scale (–) descriptors of fabric hand attributes, significant scenario effects were found in rating responses, which further supports the need to include a double-faced (having a pair of descriptors: upper-scale (+) and lower-scale (–)) attribute list when using attribute-based fabric hand evaluation to ascertain panelist rating and perception with improved ecological validity.
However, the study was limited in its ability to effectively capture thermal-wet properties through visual representations. As thermal-wet performance, including heat and moisture transfer, plays a crucial role in the evaluation of fabrics for clothing applications, future research will focus on addressing this limitation to provide more comprehensive evaluations. The use of SDT rating measure could help identify and prioritize fabric hand attributes for improved textile product development and communication to consumers by understanding evaluative criteria used in fabric hand evaluation. More research is needed to further test the types of appropriate attributes for textile product evaluation using attribute-based test methods with a range of hand categories.
By applying the Mantel test, the present study elucidated the subtle relationships between sensory ratings and fundamental properties of fabrics, deepening understanding of the influence of fabric composition and intended usage on tactile ratings. It becomes evident that the choice of material cannot be solely guided by esthetic and tactile preferences but must also consider the functional requisites dictated by the end-use scenario.
Footnotes
Acknowledgment
Bo Xing would like to thank the China Scholarship Council for awarding a scholarship to conduct PhD candidate research in the Gemtex lab at the University de Lille in France.
Data availability statement
All data that support the findings of this study are included in the article.
Declaration of conflicting interests
The author(s) declared no potential conflicts of interest with respect to the research, authorship, and/or publication of this article.
Funding
The author(s) received no financial support for the research, authorship, and/or publication of this article.