






Abstract
Since the dynamic and static scenarios of women’s loungewear involve multiple parts of bodies, it becomes a major factor in the assessment of comfort to measure dynamic pressure in loungewear. This study established a mathematical model for intelligent prediction of clothing pressure with 14 parameters based on fabric properties and shape size. Combining major influencing factors of clothing pressure, this model measures the clothing pressure exerted on the elbows, waist, buttocks, and knees in three scenes and seven postures, to study the predictive performance of support vector regression (SVR), backpropagation neural network (BPNN), and genetic algorithm (GA)-BPNN for dynamic pressure in women’s loungewear. According to the results, the accuracy of the three machine learning algorithms in the prediction of clothing pressure in loungewear, in descending order, is GA-BPNN, BPNN, and SVR. With complex influencing factors and limited sample sizes, the average relative errors of GA-BPNN for predicting the pressure on four body parts are 2.87%, 3.55%, 3.36%, and 4.35%, respectively, which can yield a science-based reference for the assessment of comfort in women’s loungewear.
Keywords
With the improvement of people’s living standards and the change of life style, loungewear is not only “sleep wear,” but also become free and comfortable casual clothes in indoor and outdoor scenes. The latest industry research report shows that the overall scale of China’s loungewear industry reached 96.1 billion yuan. From 2022 to 2023, e-commerce sales of women’s loungewear increased by 3% year-on-year; young and middle-aged women account for more than 55% of the consumer group of loungewear, becoming the main force of loungewear consumption. The way of wearing and the applicable scene are the key factors that affect the purchasing decision of women’s loungewear. “As light as being wrapped in clouds,” comfort has become the first demand of female consumers for loungewear. 1
There is no doubt that, as a long-term close-fitting clothing, the fit with no sense of pressure and bondage of the loungewear will make the woman’s body feel more relaxed, and obtain a better leisure, sleep, and light exercise experience. However, because loungewear pressure involves a variety of postures and body parts under dynamic and static conditions, there is a highly complex nonlinear relationship between clothing pressure and various influencing factors, which makes it difficult to measure and predict the clothing pressure of female loungewear under dynamic scenarios. This creates a problem: on the one hand, the existing loungewear cannot meet the increasingly demand of consumers for pressure comfort; on the other hand, it is difficult for manufacturers to make timely adjustments to products based on consumer feedback. In addition, before the launch of new products, the process of proofing, adjusting, and trying on clothing enterprises also has a lot of associated time, economic and human costs. Therefore, it is of practical significance to evaluate and predict the pressure comfort of loungewear quickly and accurately.
Usually, designers will evaluate the fitness of clothing according to their own experience and knowledge, but the fitness of clothing is not exactly equivalent to pressure comfort. The difference of fabric, shape, and human body structure will affect the rationality and accuracy of evaluation. In previous studies, the objective evaluation methods of clothing pressure can be divided into two kinds. One is direct measurement method, which uses pneumatic-type, airbag, flow-type, elastic fiber, and other instruments and equipment with different principles and forms to measure the pressure value. The other is the theoretical research method, which establishes a model based on Laplace’s law, three-dimensional (3D) CLO 3D virtual fitting, finite-element analysis, etc., to predict and analyze the pressure value.2–4 However, these methods also have some shortcomings. The direct measurement method often reflects the distribution law of clothing pressure according to the measurement data, but the threshold value of different parts of the human body can feel the pressure is different. The theoretical research method combines physical mechanics and clothing ergonomics, but lacks the simulation of dynamic contact between human body and clothing and the prediction of dynamic pressure distribution, so the application range of the model derived from it is limited. 5
In recent years, with the rapid development of artificial intelligence, the application of machine learning methods to combine direct measurement with theoretical research is an effective way to solve problems. 6 Table 1 lists some applications of machine learning in different directions of clothing contact-pressure comfort in recent years.
Applications of machine learning of clothing contact-pressure comfort
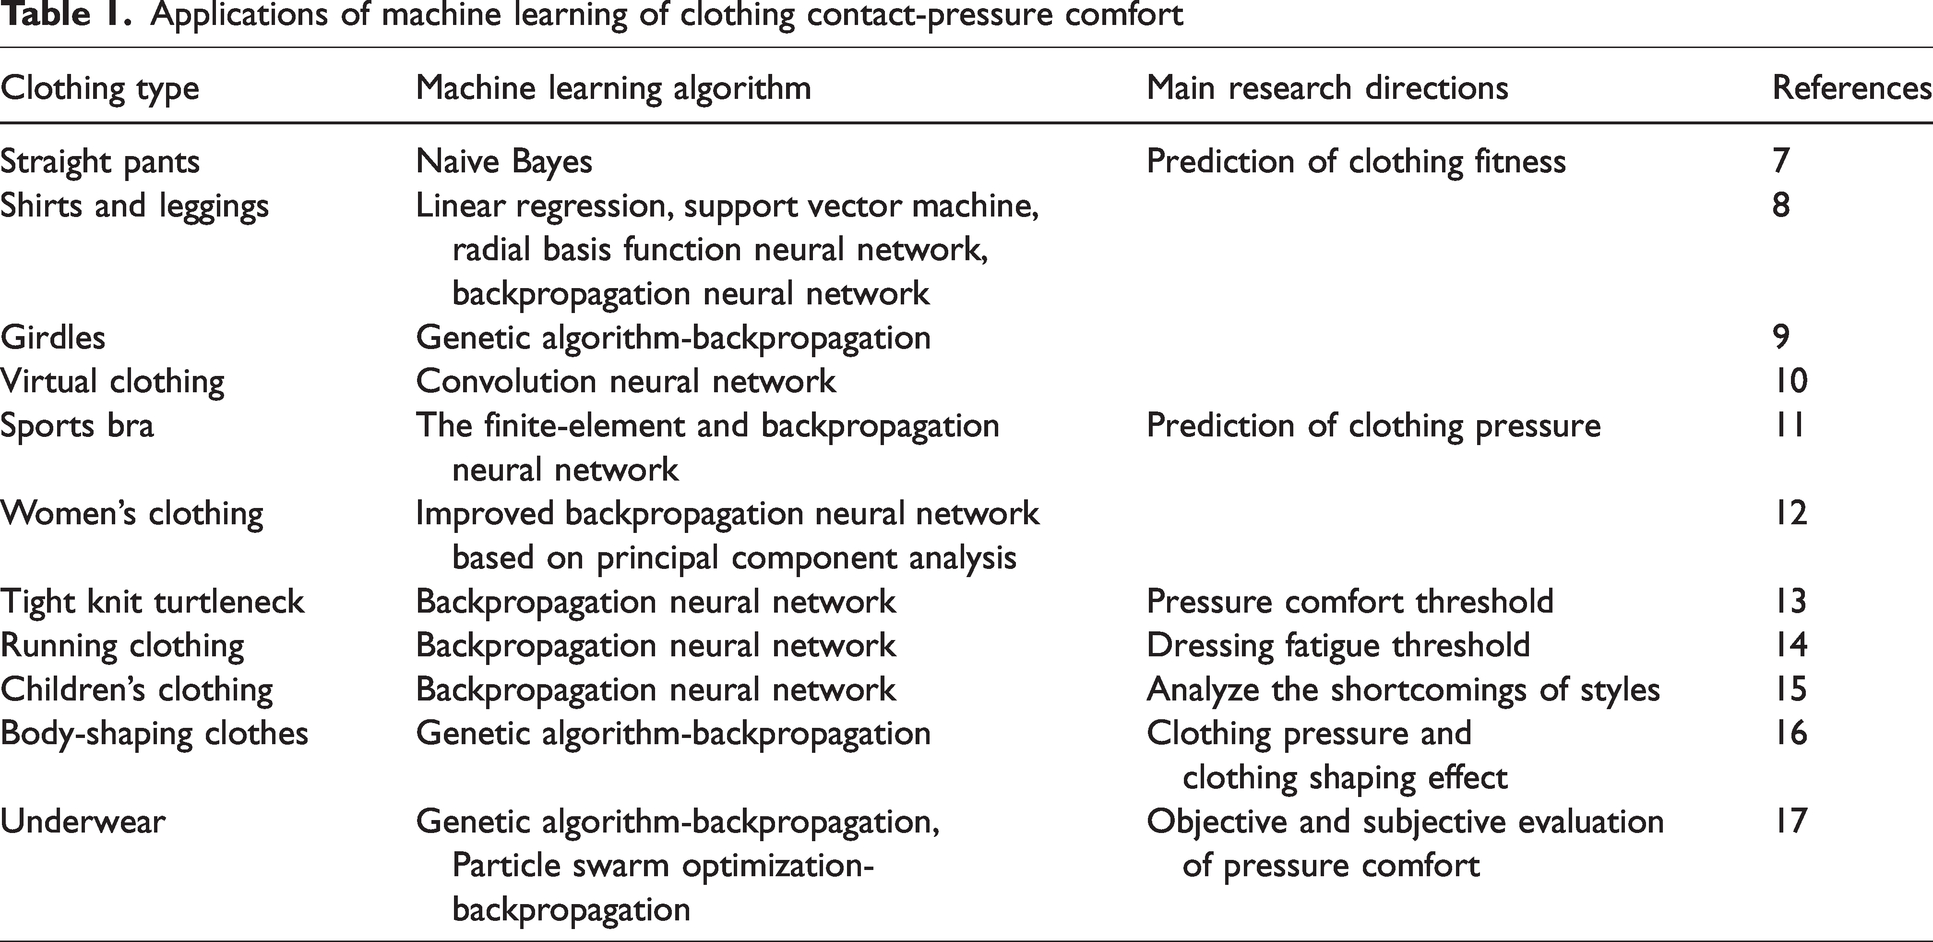
In particular, support vector machines (SVMs) have advantages in solving small-sample, nonlinear, and high-dimensional problems, such as virtual fitting to predict the fit degree of clothing, 8 or learning and discriminating cluster samples to determine the pressure comfort of clothing. Support vector regression (SVR) is a special case of SVM in regression analysis. The backpropagation neural network (BPNN) has strong nonlinear mapping ability and flexible network structure, and is widely used in numerical prediction fields such as clothing comfort sensation factor or clothing contact pressure.11–13 In view of the defects of the backpropagation algorithm, such as being easy to fall into local minima and slow convergence speed, the improvement of genetic algorithm (GA) makes artificial neural network models have better adaptability.16,17 The powerful computing power of machine learning shows the potential for broader and more diverse applications in solving comprehensive and complex prediction problems. However, the current application of machine learning in the field of textile and garment mainly focuses on virtual clothing, elastic clothing, or a specific body part. The existing research has not discussed deeply the clothing pressure comfort of multiscene, multipoint, and dynamic changes, and has not conducted research on the emerging subcategory of women’s loungewear.
In order to address the aforementioned issues, this study measured the dynamic clothing pressure on key body parts of female subjects as they imitated various movements in a home environment, taking into account the characteristics of loungewear. We conducted an in-depth discussion on the comfort associated with clothing pressure in female loungewear across multiple scenarios, points of measurement, and dynamic changes, exploring the primary factors influencing this pressure. A comprehensive mathematical model was developed based on two dimensions: fabric properties and garment shape size. Three machine learning algorithms: SVR, BPNN, and GA-BPNN, were employed to predict clothing pressure across three scenarios, seven postures, and four body parts. The principles of their calculations were elucidated, and their predictive performance was thoroughly analyzed. This study addresses the challenge of rapidly and accurately predicting and evaluating the clothing pressure of female loungewear across multiple scenes, body parts, and dynamic–static combinations. It helps to omit the time-consuming subjective experiment and calculation process, and provides a scientific reference for comfort evaluation in the research and design of loungewear products.
Experiments
The general experimental process and framework of the intelligent assessment of pressure in women’s loungewear model is described in Figure 1. In order to obtain model input parameters as training data for machine learning, we designed a three-step experiment.

General experimental process and framework.
First, through pre-experiments, the four key body parts of the three subjects were determined to experience the maximum clothing pressure in which scenario and posture.
Second, all 7 subjects wore 31 sets of loungewear in sequence and performed the posture that generated the maximum clothing pressure in the pre-experiment. Obtain pressure measured value through the sensor system.
Finally, measure the parameters of two dimensions of 31 sets of loungewear samples, and combine the pressure value as the training data of the model. Analyze the prediction errors of SVR, BPNN, and GA-BPNN algorithms.
Measurement of model parameters
Pressure measuring system
The AMI 3037-2 airbag contact pressure measurement system (AMI, Japan) was used to measure the clothing pressure values on their body, which was described in Figure 2. The airbag sensor was fixed on the skin with a special adhesive tape, and the subject wore a set of loungewear. The test system was connected to the computer, and after clicking the test for 30 seconds, the stable pressure value was recorded on the AMS 950 software. When measuring the clothing pressure at the elbow, the sensor was placed at the subject’s elbow joint (2 cm above the olecranon of the ulna, between the condyles of the humerus); when measuring at the waist, the sensor was placed at the subject’s iliac bone; when measuring at the buttock, the sensor was attached to the peak of buttock; and when measuring at the knee, the sensor was placed at the patella. For the same subject, the same side of the limb (either left or right) was consistently tested throughout the entire experimental process. The subjects did not wear underwear or bra.
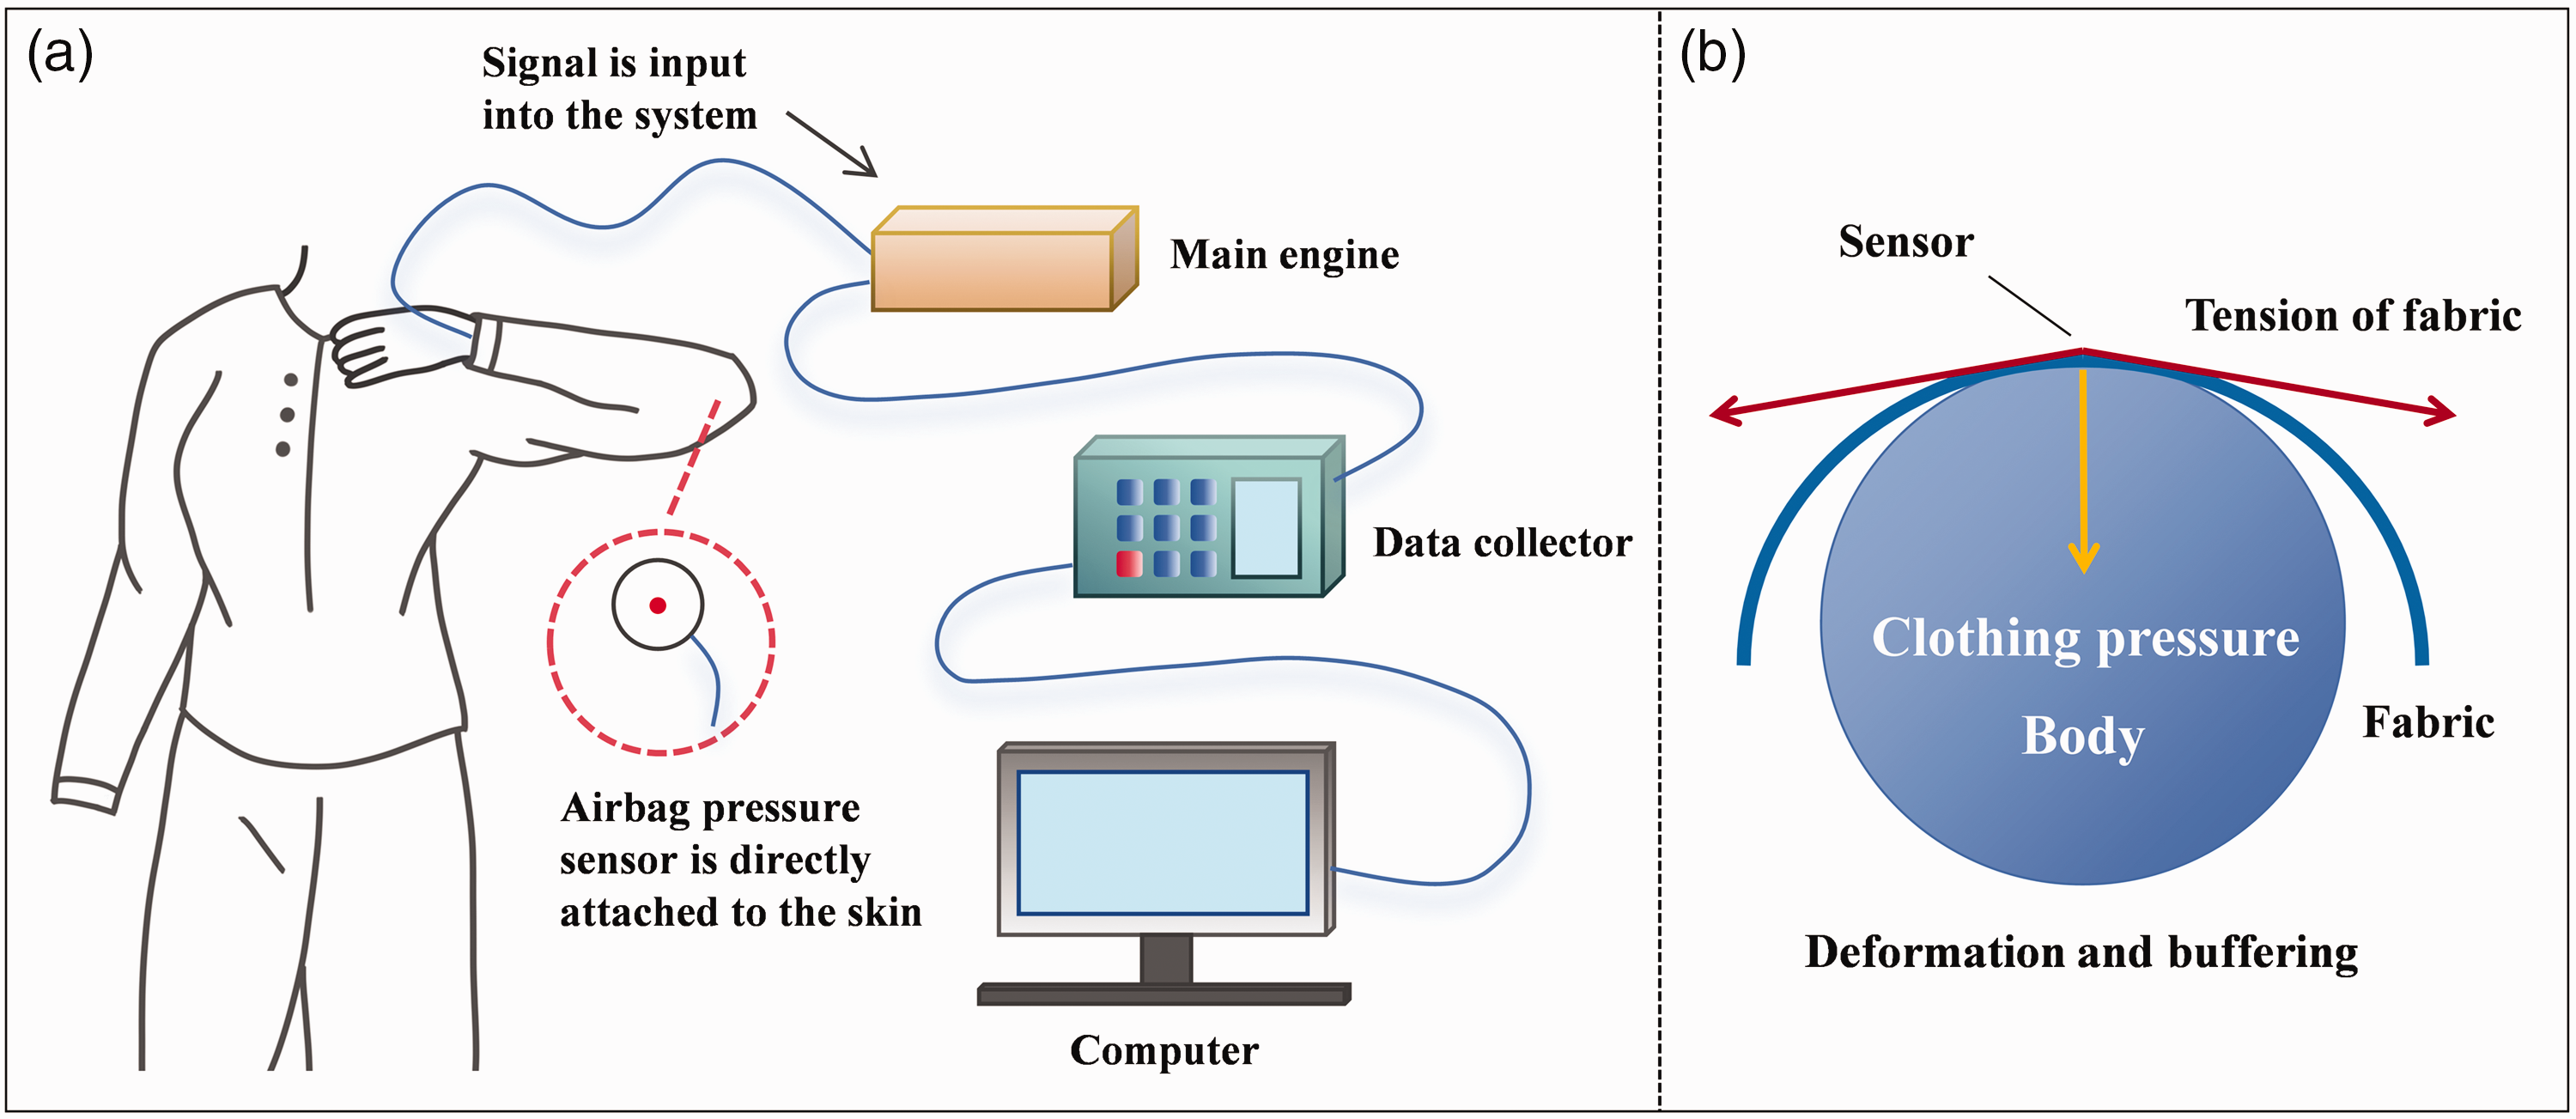
The measurement of clothing pressure: (a) pressure measurement diagram of the subject wearing loungewear and (b) schematic diagram of clothing pressure acting on the human body.
Loungewear samples
The 31 loungewear samples (S1–S31) used in the experiment came from 11 famous brands in the Chinese clothing market, which were mainstream products being sold by these brands and are purchased by a large number of female consumers. They are different in fabric and shape. Among them, 22 sets are cardigans, and 9 sets are pullovers. All of which are spring and autumn styles with moderate thickness.
Participants
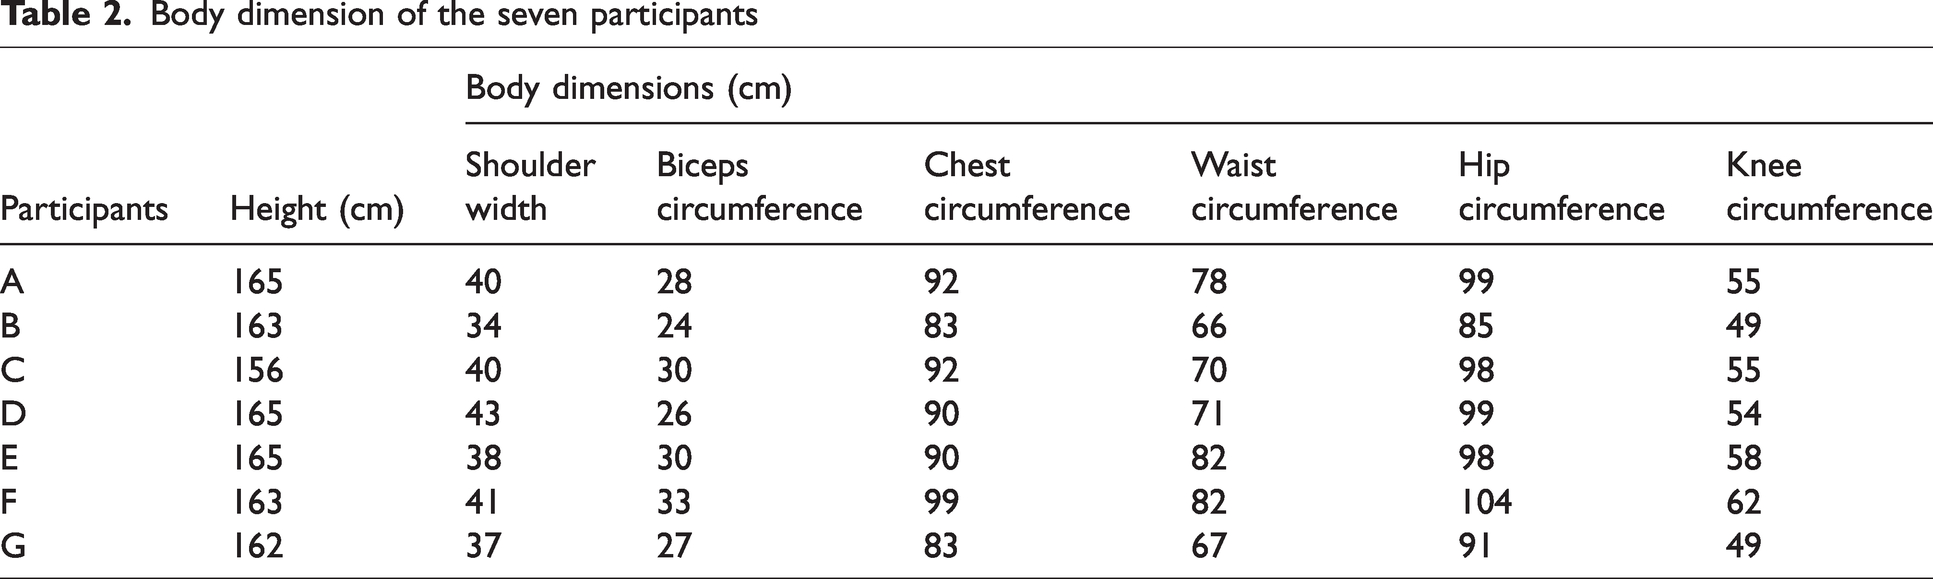
Seven adult females (A–G) between the ages of 22 and 25 years, with a height of 160 ± 5 cm, weight of 55 ± 5 kg, and normal clothing selection size M were selected as participants, all in good health and not in a special physiological period. According to the China National Standard (GB/T 1335.2-2008), their body shapes are different within the allowable range of the experiment, covering the common body shapes of most young women in China. 18 The specific parameters are listed in Table 2.
Body dimension of the seven participants
Experiment environment
The experiment was conducted under conditions of temperature (20 ± 5)°C, relative humidity (45 ± 5)%, and wind speed (0.2 ± 0.2) m/s, which is similar to the general indoor home environment.
Pre-experiment
In sleep, relatively static, and dynamic scenes, with changes in posture, some body parts are easily pulled and bound by loungewear, making people feel uncomfortable. In the pre-experiment, seven postures were designed to simulate the daily activities, involving four parts of the body: the elbow, the waist, the buttocks, and the knees, as shown in Figure 3(a)–(g). Ten samples of loungewear (S1, S4, S5, S6, S11, S12, S13, S23, S27, and S29) were randomly selected to perform clothing pressure tests on three of the subjects. The results are shown in Figure 4, the human elbow clothing pressure reaches the maximum value when doing chest expansion (e); the waist clothing pressure reaches the maximum value when bending around 90° (f); the buttocks and knees clothing pressure reaches the maximum value when the human body’s feet are parallel to the ground in a deep squatting posture (g). The elbow and lumbar pressures tend to be stable, while the knees pressure fluctuates the most, followed by the buttocks. The average pressures, in descending order, were: knees, buttocks, waist, and elbows.

Seven postures in three scenarios with four body part schematics: (a) lying flat; (b) lying down; (c) sleeping on the stomach; (d) sitting cross-legged; (e) expanding the chest; (f) bending over and (g) squatting.

Distribution of the average pressures.
The pre-experiment also explored the causes of clothing pressure and the distribution of pressure on the human body. According to Laplace’s principle, clothing pressure is directly proportional to fabric tension and inversely proportional to the curvature radius of specific parts of the human body.19,20 The clothing pressure on the knees and buttocks is greatly influenced by the distribution of tissues such as fat, bones, and muscles. Subjects with similar height and weight, with uniform subcutaneous fat distribution, have larger knee joint curvature, resulting in lower pressure between the knees and the fabric. In contrast, subjects with larger skeletons and protruding knee joints have greater pressure between their knees and the fabric. Subjects with flat and soft buttocks and thick soft tissue will experience less clothing pressure than those with round buttocks, tight muscles, and protruding pelvic bones. Related studies have shown that clothing pressure increases in the area with the highest body curvature, with the highest pressure on both sides and the lowest pressure on the front and back centers of the body. 21
The effects of clothing on the human body are two fold: first, the compression caused by the weight of the fabric itself; second, the tension generated by the deformation of the fabric constrains the human skin. For the curved parts of the human body, both types of pressure may exist simultaneously. For flat parts, in general, clothing pressure is generated by one of two factors. 22 During squatting, the skin on the buttocks and thighs, as well as the fabric of loungewear, undergo relative deformation. The elastic modulus and bending stiffness of the fabric in the warp and weft directions are positively correlated with the clothing pressure coefficient; the increase in fit and size of clothing reduces the pressure on the human body. 5 Therefore, loungewear made of loose, soft, and elastic knitted fabrics has better cushioning when they rub, slip, or deform with the skin, resulting in less clothing pressure.
Measurement of input parameters Y1–Y4
Based on the pre-experiment, when a total of 7 subjects wear 31 sets of loungewear for the maximum pressure posture (as shown in Figure 3(e)–(g)), take the arithmetic mean of the pressure values on the same body part of 7 subjects as the input parameters Y1–Y4 for the prediction model, which represents the maximum pressure that the subject group may experience on that body part during daily activities at home. This maximum pressure value reflects the particular situation in which loungewear makes the human body most uncomfortable. For instance, when a person is squatting (Figure 3(g)), the clothing pressure on the knees reaches its maximum. The average knee pressure measured from 7 subjects during squatting is defined as Y4 and used as an input parameter for the model. The instruments, methods and details of measurement are the same as previously.
Measurement of input parameters X1–X14
For fabric tensile elasticity (parameter X1, %), refer to the China National Standard (GB/T3923.1-2013) for testing. An electronic fabric strength tester (YG065, Laizhou Electronic Instrument Co., Ltd) was used to test the tensile elasticity of the fabric. In the warp and weft directions of fabric, five samples were cut from each loungewear piece. The sample size was 200 mm × 50 mm (woven fabric) or 300 mm × 50 mm (knitted fabric), and the tensile speed was 100 mm/min.
For fabric stiffness and flexibility (parameters X2 and X3, N/m), refer to the China National Standard (GB/T 18318.1-2009) for testing. Measured by an electronic stiffness tester (Shanghai Nayou Instrument Co., LTD). A set of loungewear was sampled from different parts of the fabric, avoiding fabric blemishes and 150 mm from the fabric edge, with a sample size of 200 mm × 25 mm in length and width, and 5 pieces were taken in each direction of warp and weft for testing. The bending angle was set at 41.5°, and the advancement speed of the platen was 5.0 mm/s.
For grammage of fabric (parameter X4, g/m2), refer to the China National Standard (GB/T4669-2008) for testing. After pre-conditioning the loungewear in a standard atmosphere for 24 h, we cut the fabric specimen with the size of 100 mm × 100 mm and weigh it using the electronic balance (ME204E/02, METTLER) to calculate the mass per unit area.
For clothing size (parameters X5–X14, cm), refer to the China National Standard (GB/T 31907-2015) for testing. Spread the loungewear flat and used a tape measure with a division value of 1 mm to measure its arm circumference, shoulder width, chest circumference, armhole, laying waist circumference, maximal stretch waist circumference, hip circumference, front crotch length, thigh circumference, and knee circumference for a total of 10 parameters (as shown in Figure 5).

Schematic diagram for measuring the size of loungewear.
Establishment of predictive model
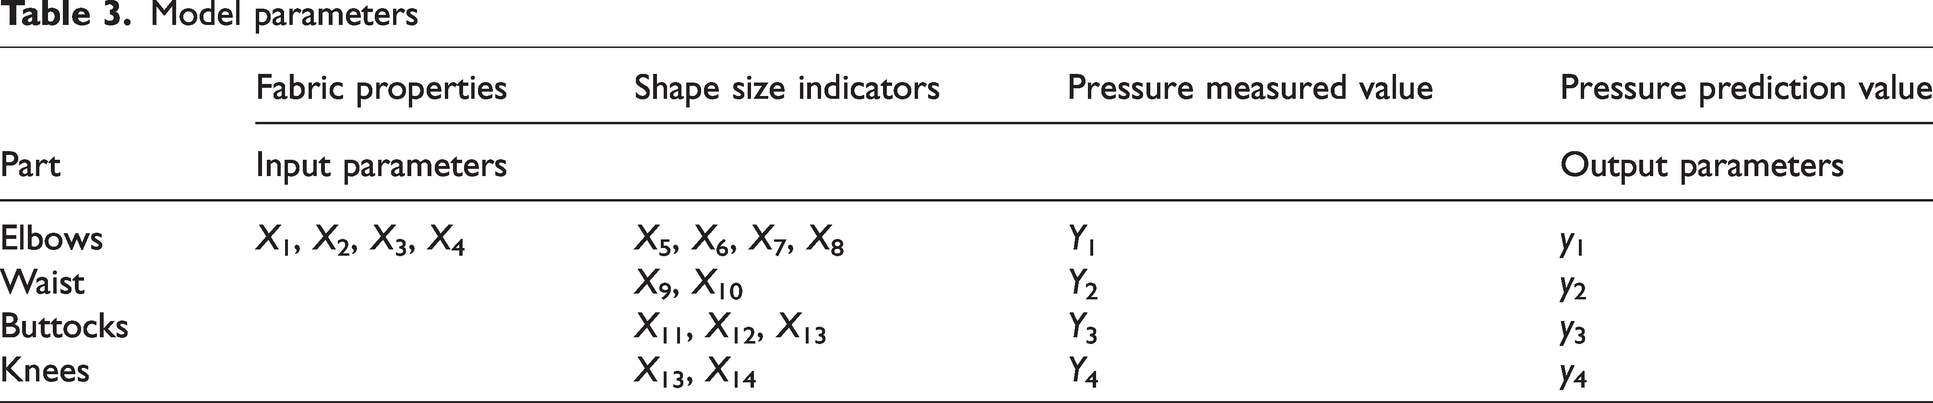
Machine learning is a technology that enables computers to improve themselves through experience and data. It has become the core of the field of artificial intelligence. 23 Based on the research described previously, SVR, BPNN, and GA-BPNN were used in the Matlab toolbox to establish response mechanism models for clothing pressure in four body parts of loungewear to 4 fabric properties (X1–X4) and 10 shape size indicators (X5–X14). The model parameters are listed in Table 3.
Model parameters
To reduce the complexity of the model, and improve the computational speed and prediction accuracy, Grey relational analysis was used to conduct correlation analysis on the factors affecting the pressure comfort of loungewear, and the parameters with high correlation were selected as independent variables. The higher the correlation, the more significant the impact between the two.24,25 Calculate the correlation coefficient according to
Here, x(i) is the reference sequence, and k is the index variable of the ith evaluation object, and ρ is the resolution coefficient, taken as 0.5.
The results in Figures 6(a) and (b) show that the correlation between the warp and weft fracture elongation of the fabric (parameters X1 and X2) and clothing pressure was between 0.638 and 0.698, the correlation between the bending stiffness (parameter X3) and clothing pressure was between 0.889 and 0.938, and the correlation between the weight (parameter X4) and clothing pressure was between 0.893 and 0.943; The correlation between clothing pattern size (parameters X5–X14) and clothing pressure is above 0.9. This proves that there is a strong correlation between the selected model input parameters and the clothing pressure values on different body parts.

Correlation between clothing pressure values of four body parts and input parameters: (a) elbows; (b) waist; (c) buttocks and (d) knees.
As a supervised machine learning algorithm, SVM is defined as a linear classifier with the largest interval in the feature space. By using the kernel function, it can be transformed into a high-dimensional space to obtain the optimal hyperplane, becoming essentially a nonlinear classifier. SVR is a model that uses SVM to fit curves and perform regression analysis, analyzing and simulating nonlinear data by transforming complex data into simple vectors.
26
The main mathematical expression of SVR is
Here,
When regressing and predicting the pressure on loungewear, set the penalty factor value to 300 and the kernel parameter value to 0.1. Randomly select 10 loungewear each time and use their test data as the predictive test samples for the SVR model, and use the test data from the remaining loungewear as the training samples for the SVR model. Run the program code multiple times until each sample was randomly chosen for both the training and testing sets. This method can make full use of data and reduce the dependence of prediction results on data partitioning.
BPNN is an artificial neural network that is a multilayer feedforward network trained using the error backpropagation algorithm. It applies backpropagation algorithm to the hidden layers of multilayer neural networks for error correction, obtaining the result closest to the expected output value when given an input value. It continuously reduces the error between actual and predicted values through model training and feedback learning. When the training error is less than the preset error, it ends the training. Combined with experimental results, it iteratively optimizes the optimal number of hidden layer nodes, weights, thresholds, learning rate, momentum coefficient, and other parameters of the model. BPNN can learn and store a large number of mapping relationships between input and output so that we do not need to describe the specific relationships between variables in advance. The three-layer structure was used in this study, as shown in Figure 7. In theory, a three-layer BPNN can complete any N-dimensional to M-dimensional mapping.27,28

The topology structure of three-layer BPNN.
Among them,
Here,
The MATLAB R2021a neural network toolbox was used to debug the program. The response function of hidden layer neurons adopts the logarithmic sigmoid function tansig, expressed as
The output layer response function is set to a linear function purelin, and the hidden layer transfer function is the momentum batch gradient descent function traingdm. The gradient descent method iteratively searches with a specified step size in the opposite direction of the gradient or approximate gradient corresponding to the current point on the function, in order to find the local minimum of a function. As the core algorithm for training neural network models, the backpropagation algorithm can optimize parameter values in neural networks based on defined loss functions. It tests the difference between the predicted value and the true value, and compares whether the expected error is met or minimized. If it is met, it ends; If it does not meet the requirements, it will propagate back along the network path and adjust the weight to minimize the error. The mean squared error (MSE) loss function is calculated as
Here,
According to the empirical formula, determine the number of hidden layer neurons as 12. The number of neurons in the output layer is 1. Set maximum training steps of 1 × 10⁵, learning rate 0.1, accuracy target value 1 × 10⁻⁵. Similarly, randomly select 10 loungewear each time and use their test data as the predictive test samples for the network model, and use the test data from the remaining loungewear as the training samples for the network model, until the clothing pressure of all 31 loungewear samples are predicted.
The backpropagation algorithm based on error gradient information enables the BPNN to obtain the optimal solution in local space. However, due to the sensitivity of gradient optimization to initial values and the randomness of network weight thresholds, the backpropagation algorithm tends to converge to different local minima, resulting in a lack of global optimization ability. 29 GA is a global adaptive probability search algorithm based on the principles of genetics, which draws on the natural selection and reproductive evolution, gene recombination, and mutation mechanisms of biological survival of the fittest. 30 It has good global optimal solving ability, can effectively jump out of local extrema, overcomes the shortcomings of BPNN, such as easily getting stuck in local optimal solutions and having multiple iterations, and improves the speed and accuracy of regression prediction.31,32
At present, GAs have three optimization methods for BPNN, which include using their initial weight threshold, topology, or learning rules as evolutionary objects. This study uses GA to select the initial weight threshold as the optimal value to solve the problem, and conducts global optimization within the solution interval, ultimately obtaining the optimal initial weight threshold of the BPNN. The process of using GA to improve BPNN is shown in Figure 8.

The operation of GA to improve BPNN.
Determine feasible solution domains and encoding methods based on specific problems. Using a series of numerical strings or strings to represent chromosomes, that is, each feasible solution in the feasible solution domain.
Construct a nonnegative fitness function to measure each solution. In GAs, the higher the fitness of an individual, the closer it is to the optimal solution, and the greater the genetic chance. In contrast, it deviates more from the optimal solution.
Determine the population size, selection, crossover, and mutation methods and probabilities, determine termination conditions (a certain threshold or maximum evolutionary number), and ultimately find the optimal individual.
After debugging the model, a population size of 5 was ultimately selected, with a maximum number of evolutions of 50, a selection probability of 0.08, a crossover probability of 0.6, and a mutation probability of 0.05. The parameter settings of the BPNN, the proportion of training samples to prediction test samples, are the same as previously.
Results
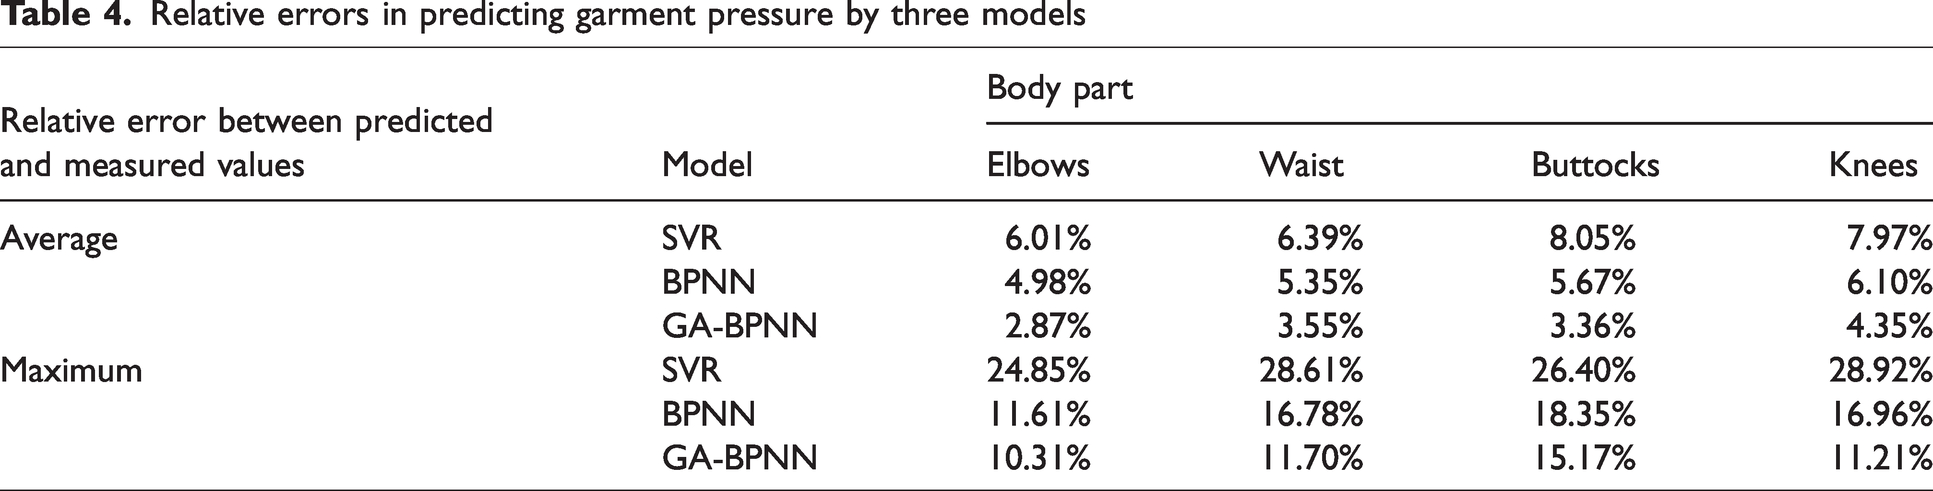
Analyze the errors of SVR, BPNN, and GA-BPNN models in predicting pressure on women’s loungewear, as listed in Table 4. Our study has found that the prediction average relative error and maximum relative error of Support Vector Regression models are larger than those of neural network models. With the improvement of Genetic Algorithm, the average relative error and maximum relative error of GA-BPNN for clothing pressure prediction of four body parts are reduced compared with BPNN. The average relative errors of GA-BPNN are only 2.87%, 3.55%, 3.36% and 4.35%. The maximum relative error predicted by the three models all occurred at the knee, possibly due to the largest fluctuation range of clothing pressure at the knee and more complex influencing factors. However, the maximum relative error in predicting clothing pressure for four body parts using the three models does not occur in the same loungewear sample, indicating that certain characteristics of individual loungewear have not had a significant impact on pressure prediction, and the applicability and generalization performance of the models are good.
Relative errors in predicting garment pressure by three models
By calculating root-mean-square error (RMSE) and R2, the prediction performance of three algorithms for clothing pressure of home clothes is analyzed in depth.
RMSE is a commonly used indicator to measure the difference between predicted and measured values, and is extremely sensitive to outliers. Generally speaking, the smaller the RMSE value, the better the prediction accuracy of the model, and the appropriate range depends on the specific application scenario and dataset. Calculated according to the following equation, the results are listed in Table 5:
RMSE of three models for clothing pressure prediction

Here,
It can be seen that the prediction performance of BPNN is better than that of SVR, and the prediction accuracy of GA-BPNN improved by the GA is better than that of unimproved BPNN. The GA-BPNN has a smaller prediction RMSE than the SVR and BPNN models, which the RMSE of predicted clothing pressure on the elbow, waist, buttocks, and knee are 0.0528, 0.0833, 0.1148, and 0.2811. The RMSE of three different prediction models for predicting the pressure of female home clothing on four human body parts is within 0.5, achieving the expected prediction accuracy.
Using R2 to conduct a linear regression analysis on the correlation between the predicted and measured values of the three models, it found that we can explain around 93.1–98.6% of the variance (

Scatter plots achieved from the SVR model, BPNN model, and GA-BPNN model: (a)–(c) elbows; (d)–(f) waist; (g)–(i) buttocks and (j)–(l) knees.
Conclusions
This has study proposed a method for measuring and predicting the dynamic and static clothing pressure of women’s loungewear at multiple points, and conducts new practices for the application of machine learning algorithms in clothing design and engineering.
By establishing a mathematical model from 14 parameters in 2 dimensions of fabric properties and shape size, the prediction performance of SVR, BPNN, and GA-BPNN algorithms on the clothing pressure of 4 body parts of women’s loungewear has been investigated. Compared with traditional methods, this model has stronger pertinence and higher efficiency in assessing the pressure comfort of loungewear. Depending on the intelligent assessment model, in the early stage of product development, fashion designers do not need to convene subjects for high-cost subjective experiments to know whether a women’s loungewear design scheme has good body pressure comfort. The basic parameters required by the model are easy to obtain, and there is no need to repeat the time-consuming and laborious tests.
In the experiment, we found that the RMSE of regression prediction for SVR, BPNN, and GA-BPNN for the pressure of women’s loungewear on four body parts is within 0.5. The prediction effect of BPNN is better than that of SVR, and GA can effectively improve the generalization ability and prediction accuracy of BPNN. Despite the limited number of samples and subjects, the results showed that GA-BPNN, after learning and training, can eliminate time-consuming simulation and calculation processes, and demonstrates the best performance in predicting clothing pressure under complex influencing factors and combining static and dynamic conditions.
In the pre-experiment, we also found that in the home scenario, the clothing pressure fluctuation range of the knees and buttocks of the human body is large, while the pressure on the elbows and waist tends to be stable. The shape and size of the clothing have the greatest impact on the pressure of clothing, followed by the weight, bending stiffness, and warp–weft breaking elongation of the fabric. Therefore, the design and production of women’s loungewear should focus on these points.
The method proposed in this study is not limited to predicting the clothing pressure of women’s loungewear. It can be applied to other prediction applications with small samples, high dimensions, and complex influence mechanism in the field of clothing science and engineering, such as the performance test of textiles with special functions. Performance prediction in these areas usually requires a large number of training samples. However, in practice, due to many factors, it is difficult for researchers to obtain such a large amount of data, or to fully and comprehensively consider all aspects. Therefore, for future work, we hope to continue to reduce the dependence of the model on the amount of data and make the collection, selection and calculation of model training samples more scientific and reasonable. In addition, by exploring the adjustment of model parameters and applying new and more advantageous machine learning algorithm to iteratively optimize the existing model, it will also make the application more extensive, the training process faster and the prediction results more reliable.
Footnotes
Acknowledgement
We very much appreciate the participation of our study subjects.
Declaration of conflicting interests
The author(s) declared no potential conflicts of interest with respect to the research, authorship, and/or publication of this article.
Funding
This research is funded by the National Natural Science Foundation of China (grant number 52203276).
