
Abstract
In daily exercise, sports-related injuries due to posture and other factors are inevitable. Knee sleeves can alleviate injury severity and prevent secondary damage from improper muscle protection. For sports enthusiasts, the protective efficacy is paramount. Nevertheless, conventional commercial knee sleeves frequently exhibit shortcomings such as inadequate functionality, uneven pressure distribution, poor performance of knee protection, and difficulty in combining the comfort and functionality of knee sleeves. To address these issues, this study developed a 3D human knee joint model, utilizing finite-element software to simulate pressure distribution, body surface displacements, and mechanical interactions between knee sleeves and the joint. Based on these simulations, the structure of the knee sleeve was optimized with a zoned design, ensuring both functionality and comfort. Compared with experimental knee sleeves revealed that the optimized, zoned design maintained protective capabilities while providing more even skin pressure distribution and comfort. In addition, it significantly reduced knee joint surface displacement during exercise, enhancing pressure stability. These findings were a valuable reference for knee sleeve design, ensuring functionality while maximizing wearer comfort.
With the rising living standards, light exercise has emerged as a popular fitness choice due to its minimal physical demands, low technical barriers, and flexible time requirements. 1 This trend has significantly bolstered the demand for sports protective gear, particularly knee sleeves. Knee sleeves, a staple in protective apparel, have seen rapid development, fueled by consumer aspirations for heightened functionality and comfort. 2 Knee sleeves serve a dual purpose: they prevent ligament injuries during sports and stabilize the patella, thereby minimizing the risk of noncontact knee injuries. 3 Furthermore, they mitigate strength loss caused by knee fatigue during prolonged exercise, reducing wear and enhancing athletic performance. 4 Compression comfort, a crucial sportswear aspect, greatly influences athletic performance and efficiency. 5
Clothing pressure, a pivotal metric in evaluating garment comfort, has garnered significant attention in the apparel industry. 6 Kim and Oh 7 studied the distribution of clothing pressure on cycling knee sleeves using a three-dimensional (3D) virtual clothing program. They discovered that all parts of the product with a relatively small perimeter had relatively high clothing pressure and that circumference had a greater influence on the clothing pressure of knee sleeves than length. In addition, research underscored 8 the threefold increase in skin pressure when wearing knee sleeves, emphasizing the need for optimal pressure distribution in design to minimize discomfort. To ensure knee sleeves that balance function and pressure comfort, systematic research on pressure comfort is imperative.
In the assessment of garment pressure comfort, whether using precise pressure sensor technology or quantitative analysis using airbag pressure tester, all belong to the try-on experimental method. 9 The approach can measure and record contact pressure when scientifically wearing clothes by simulating the actual wearing environment. 10 Traditional try-on experimental methods, though effective, are laborious and prone to bias. 11 As an alternative, the finite-element (FE) simulation method has emerged as a versatile tool for modeling human biomechanics and analyzing the interplay between functional clothing and the human body.12–14 It offers advantages such as reduced time costs, risk mitigation, and precise measurements of contact pressure and body surface displacement.
Wang et al. 15 established a partition design model for seamless yoga pants, providing a theoretical foundation for optimal structural and stylistic design. Feng and Wang 16 constructed an optimal mathematical model of soccer tights, which provided a solid theoretical basis for the distribution of loft in the design of soccer tights. Song et al. 17 utilized the surface-coated line method to simulate deliveryman skin deformation, resulting in a novel pant design. These studies emphasized that exploring body surface deformation under pressure improved clothing pressure comfort. Nevertheless, there are still some problems with knee protective products on the market, such as imperfect functionality, pressure distribution that does not match the characteristics of the human body shape, and inability to meet the human body’s needs for exercise as well as comfort after wearing the garment. Thus, considering contact pressure, body surface deformation post-wearing, and knee joint segmentation is vital. Optimizing structural, and functional designs, and fabric choices are crucial for enhancing garment functionality and comfort.
As a cutting-edge computational technique, the finite-element method (FEM) has achieved remarkable application results in the fields of clothing pressure comfort and structural optimization. However, there are comparatively fewer studies in the field of apparel compression research using FEM to guide the best design of knee sleeves, and comparatively more studies on the application of tight-fitting clothing, such as compression socks and yoga pants. To address these challenges, we conducted a study utilizing FE software to establish a 3D human knee joint model and simulated the mechanical interaction between the knee and knee sleeve. This approach facilitated the evaluation of pressure on the knee joint and body surface displacement caused by various knee sleeve designs. Based on the observed pressure and deformation characteristics, we structurally optimized the knee sleeves, introducing a zoned design for improved performance. To validate our improved knee sleeves, we conducted objective garment pressure tests and compared the results with those of experimental knee sleeves. Furthermore, we established an FE model of the optimized knee sleeves, analyzing the pressure exerted and body surface displacement. These findings underscored the superiority of our zoned design in enhancing both functionality and comfort. Combining the virtual simulation technology for the design optimization of apparel products provides a new idea for shortening the research and development cycle, reducing the cost and developing new functional products.
Materials and methods
Construction of a geometric model of the knee sleeve and knee joint
Data collection
This study adopted 3D computed tomography (CT) biomechanical simulation. A CT scan is a type of X-ray that can record high-quality images of organs and bones in a very short time. 18 CT scans of human knee joints were performed on 30 healthy male college students in the First Hospital of Jilin University (China). The scanning equipment was Biograph16HRPET-CT (Siemens GMBH). The selected male college students all met the national standard for Human Dimensions of Chinese Adults (GB10000-2023). 19 The subjects (24 ± 2 years old; average height 175.5 ± 5.05 mm; average body weight 67.8 ± 5.16 kg) had no prior history of knee trauma or osteoarthritis.
Spiral scanning was performed on the upright position of the knee joint of the subjects using CT. The scanning parameters were 0.5 mm layer thickness, 1 mm layer spacing, and 512 × 512 pixels resolution. A total of 452 CT scans were taken, and the scan data were saved in Medical Digital Imaging Communication (DICOM) format.
Considering the time-consuming construction of a high-precision model and the large demand for computing resources, this study aimed to explore the feasibility of optimal design of knee sleeves and preliminarily verify the effect of a pressure zoning model, which needs to balance research quality and time cost. Based on the above considerations, we finally selected a clear and representative CT image of the subject for 3D reconstruction.
Modeling location and action determination
In the determination of the modeling part of the knee sleeve, Leizerowitz et al.’s research 20 showed that 93% of the participants preferred to use the right leg in the object management task, whereas 40% chose the right leg, 13% chose the left leg, and the rest chose the left leg alternatively. Although the proportion of the right leg as the support leg is not absolute, it may participate in the action more frequently due to the operational advantage in tasks that require dynamic stability. For example, Lesmawanto et al.’s riding studies 21 found that the right leg generally exerts more torque (especially during maneuverability tasks), whereas the left leg may carry more support during stability tasks. These studies all justified the choice of the right leg as the base for modeling.
According to the previous data collection, the length of knee sleeves on the market is usually between 18 and 35 cm, and there is no uniform standard, because the design of knee sleeves of each brand and model is different. For example, the standard length of the Z-13 knee sleeve is 13 inches (about 33 cm), whereas the length of the LP knee sleeves ranges from 18 to 25 cm, and the total length of the sports knee sleeves introduced by Gu Dong is 27 cm. In order to avoid the failure of subsequent simulation due to insufficient model length, 35 cm was chosen as the length of the model in this study. Wang et al. 22 pointed out that the length of the thigh accounted for 25.4% of the total length of the body, and the length of the calf accounted for 23.3%; that is, the length of the thigh was 1.095 times that of the calf, which contributed to the overall appearance and body balance. Therefore, the horizontal section of the model in this study is the upper end of the model at 18.5 cm from the center of the patella, and the lower end of the model at 16.5 cm from the center of the knee, as shown in Figure 1.
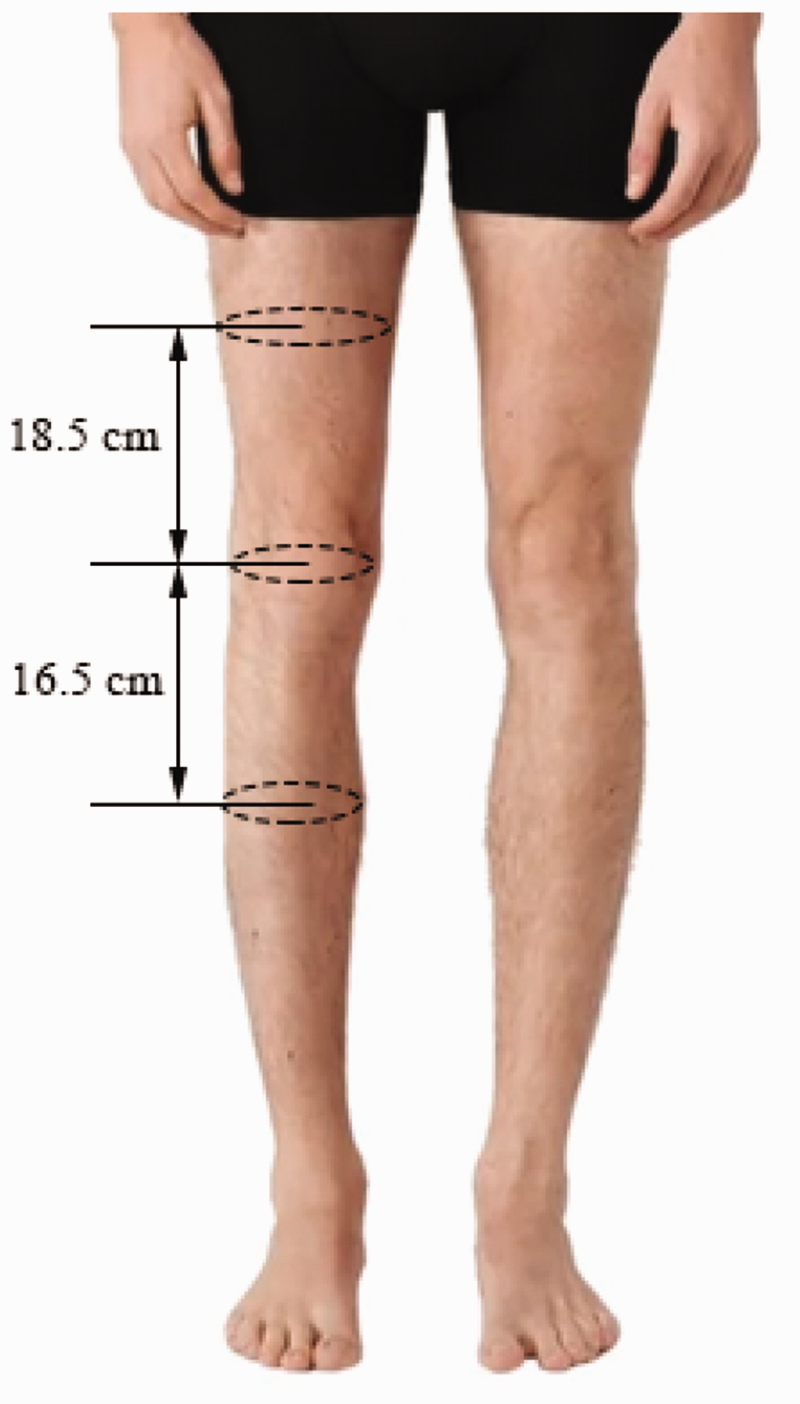
Schematic diagram of determining the modeling scope of the knee joint.
In determining the experimental conditions, this study focuses on the static state of a human body wearing knee sleeves, considering the complexity and variability of dynamic measurements. Although the human body exhibits various states during knee sleeve usage, including both static and dynamic conditions, significant measurement errors may occur in dynamic states due to the sliding movement of knee sleeves. Even under identical environmental conditions, the same individual wearing identical clothing may experience varying pressure distributions and sensory perceptions between static and active states.
The selection of static state for this study is further justified by the anatomical characteristics of the knee joint. The surface curvature of the human knee joint varies significantly across different postures, influenced by the skeletal muscle group. While the elastic modulus of skeletal muscles differs with varying tension levels, leading to changes in clothing pressure distribution and body surface displacement within the same dimension. 23 Although the elastic modulus of skeletal muscle under different stress levels cannot be measured directly, the elastic modulus of skeletal muscle under natural relaxation has been measured by many scholars. Therefore, this study selected the human knee joint in the natural standing relaxed state as the modeling object, as illustrated in Figure 2. This approach ensured methodological consistency while acknowledging the complex biomechanical interactions in the knee region.
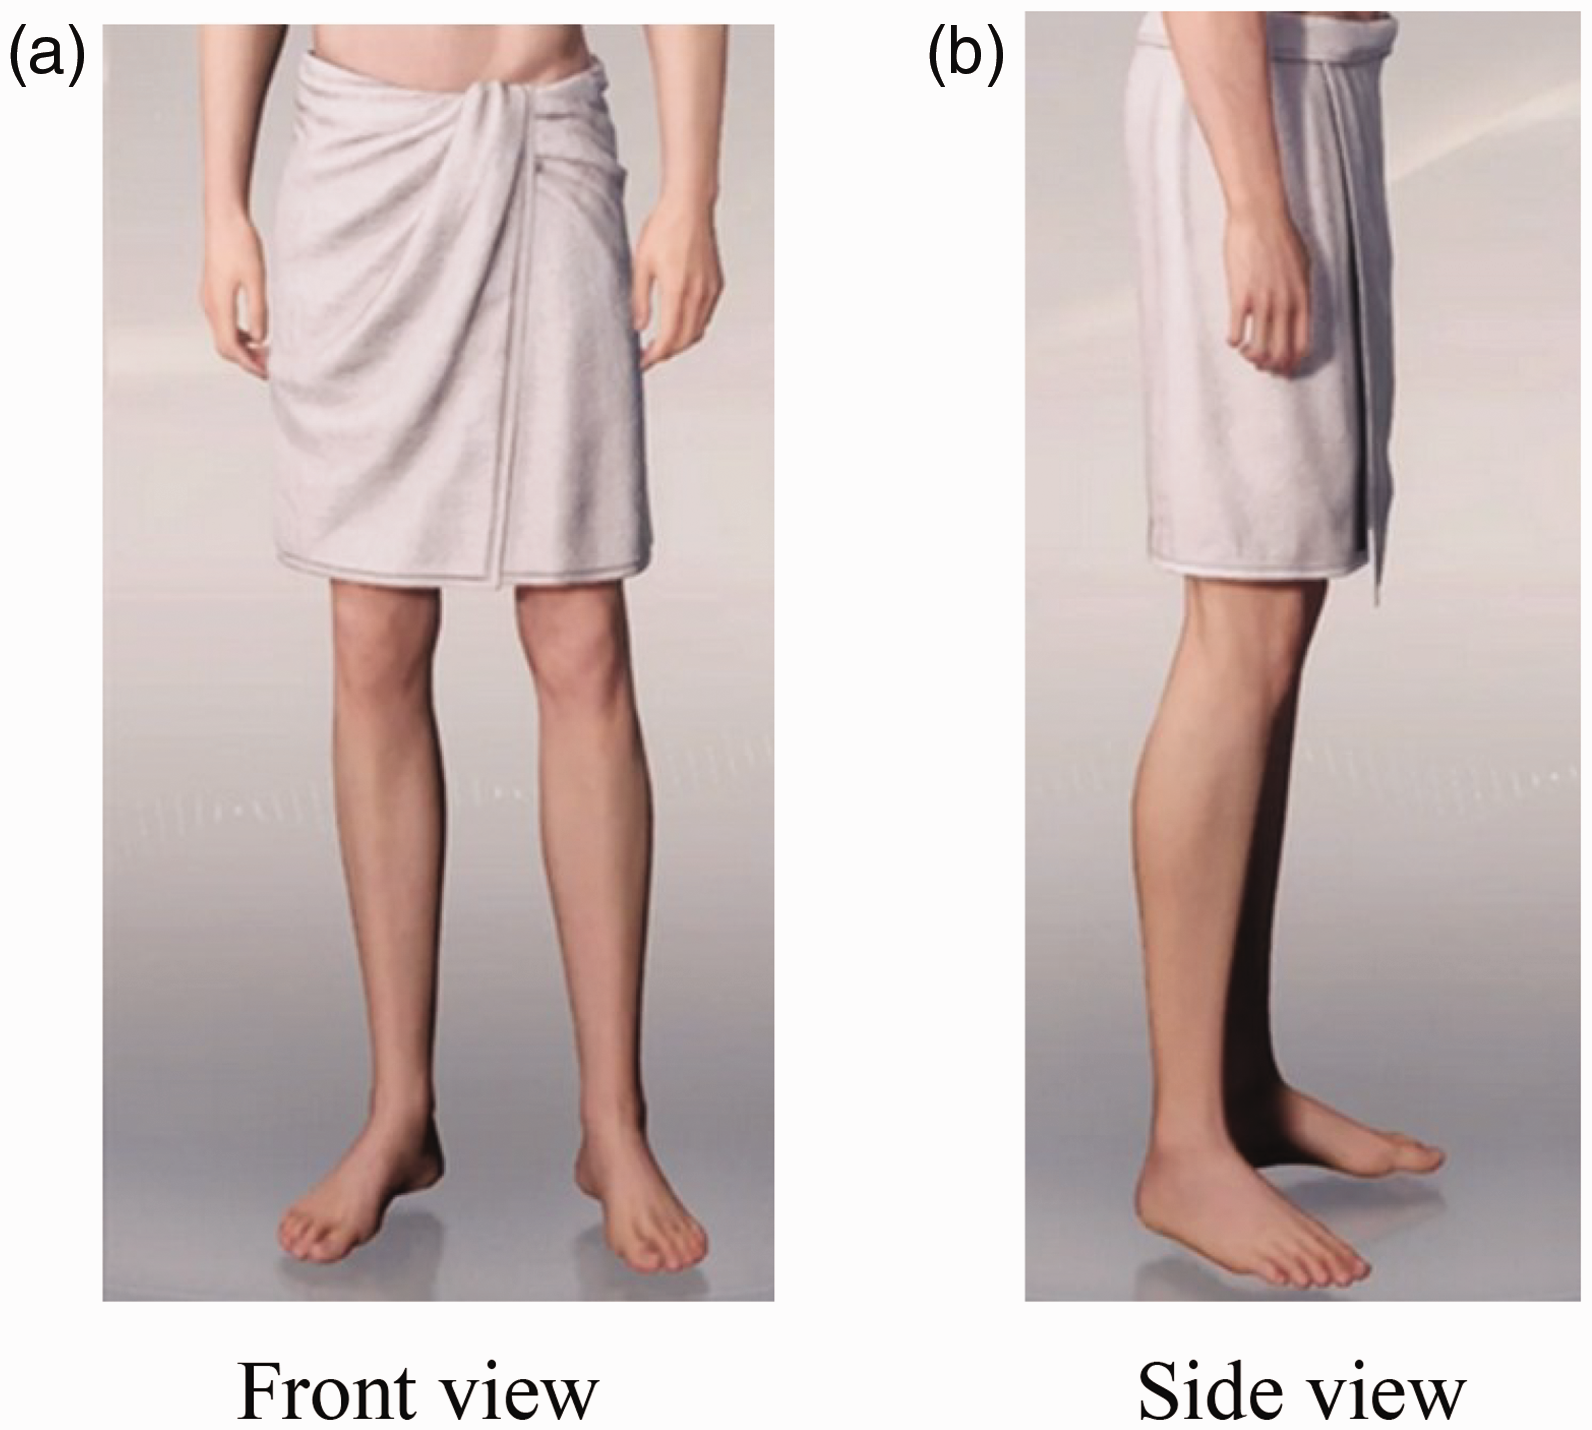
Schematic diagram of knee extension and relaxation: (a) front view and (b) side view.
Establishment of a 3D geometric model of the human knee joint
With advancements in medical device performance and computing power, 3D reconstruction technology, facilitated by Mimics 20.0, is experiencing steady growth. 24 The 3D images generated by Mimics can be further used in computer-aided design, rapid prototyping and virtual simulation techniques, and FE analysis. 25 Therefore, this research adopted the MIMICS 20.0 for 3D reconstruction, by setting threshold, filling holes, and dynamic operations such as regional growth process implementation from 2D image to 3D entity. 26 However, initial 3D models were coarse and prone to stress concentration. Hence, 3-Matic was utilized to refine models, eliminate imperfections, 27 and optimize knee joint geometry for FE analysis.
Considering that excessive clothing pressure will limit human activities, the clothing pressure value is usually not very large. Therefore, when the human body wears knee sleeves, the clothing pressure has almost no effect on the internal tissues of the knee joint. In order to optimize the efficiency and accuracy of the calculation model, a reasonable simplification strategy was adopted in this study: fibula, femur, patella, and tibia were combined into the skeletal layer; joint capsule, meniscus, cruciate ligament, tendon, and muscle were combined into the soft tissue layer; epidermis, dermis, and subcutaneous tissue were combined into the skin layer.
The optimized 3-matic model was exported. The establishment process and final components of the knee joint geometric model are shown in Figure 3.
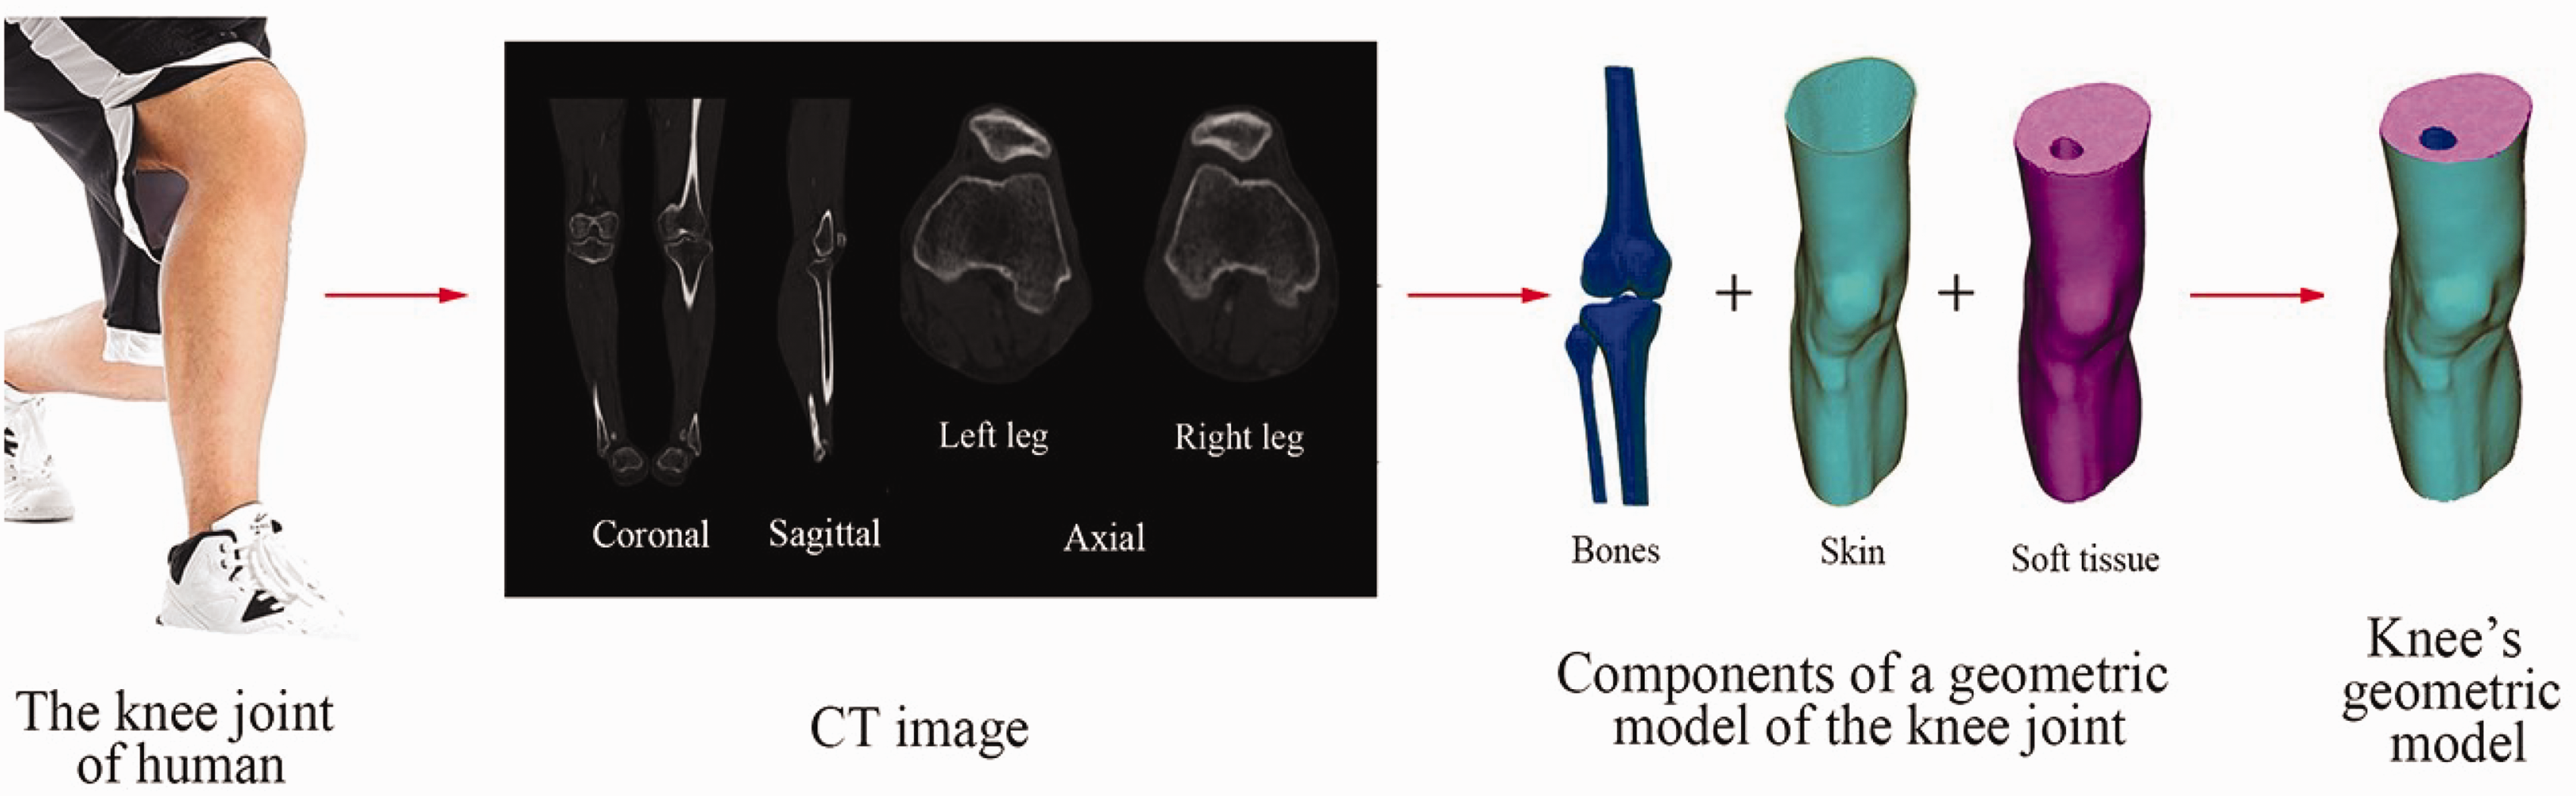
The process of constructing a geometric model of the knee joint.
Establishment and assembly of a geometric model of a knee sleeve
As the knee sleeves selected in this study are made of soft materials, they appear as 2D sheets when hanging, and are prone to wrinkles and distortions. As a result, it is not easy to obtain their accurate 3D shape data through 3D scanning under the natural relaxation state. When the subject wore the knee sleeves, the knee sleeves were close to the knee joints of the human body, and the geometric surface of the knee sleeves is basically consistent with the curve of the knee joints at this time. In addition, due to the draping feeling of knitted garments, there are gaps between some parts and the human body. SOLIDWORKS has a wide range of applications in product design. Based on this, leveraging SOLIDWORKS’ surface editing, this study efficiently captured the knee sleeve’s basic shape and ensured precise fit with the knee joint model. The integrated model was exported in X-T format, completing the 3D model of “knee sleeve and knee joint” as shown in Figure 4.
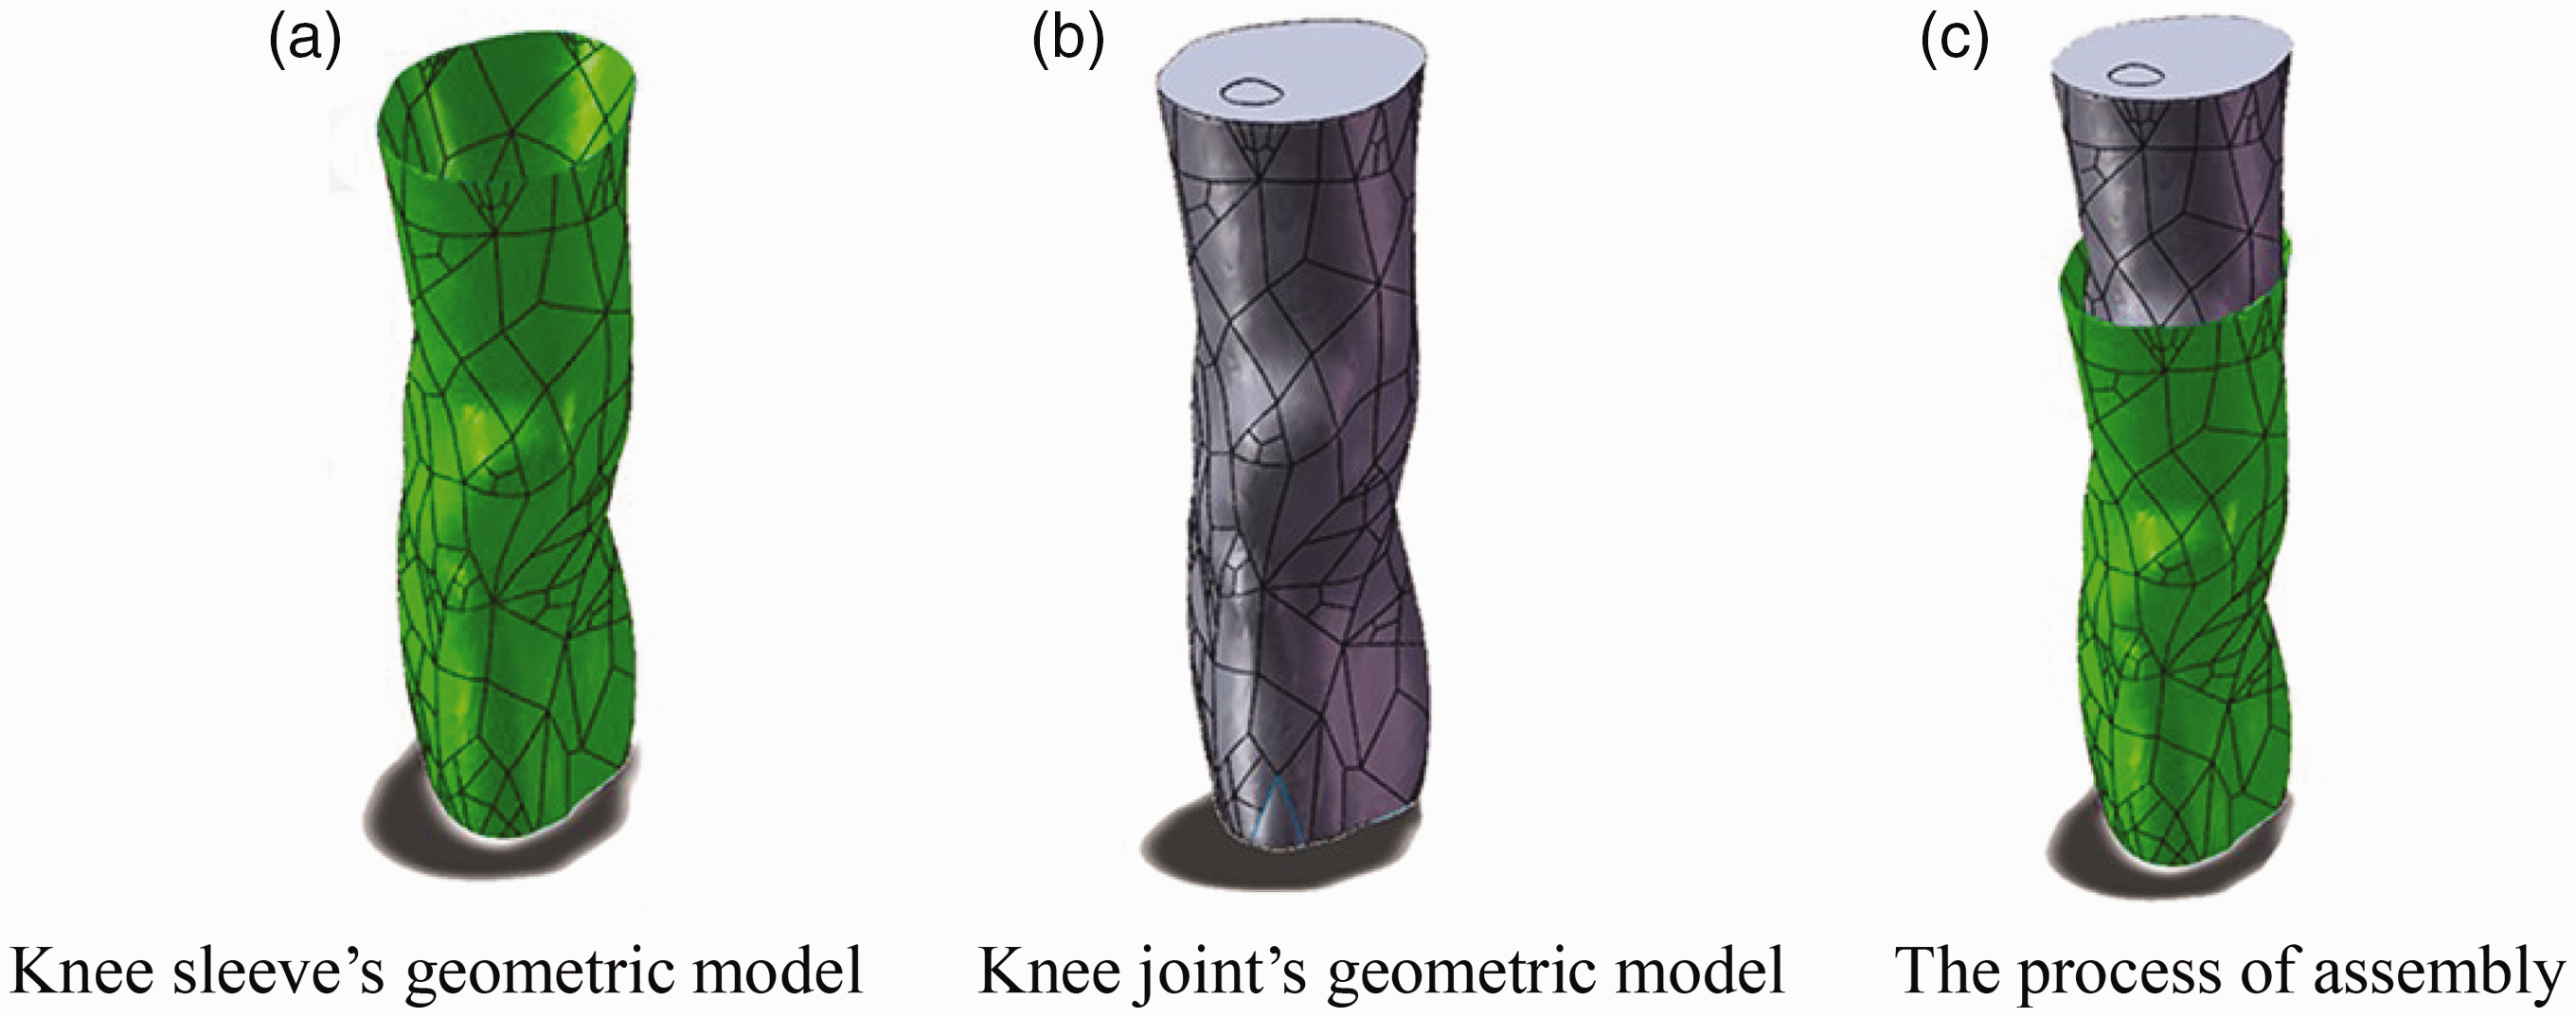
Assembly of geometric models of knee sleeve–knee joint: (a) knee sleeve’s geometric model; (b) knee joint’s geometric model and (c) the process of assembly.
FE preprocessing of the knee sleeve–knee joint model
Mesh generation
There are many types of FE analysis software, the most famous being ABAQUS and ANSYS. They each have their own characteristics and advantages, and are suitable for different engineering fields and analytical needs. ABAQUS has significant advantages in complex nonlinear structure analysis and high-precision material simulation, whereas ANSYS excels in multiphysics simulation, fluid dynamics analysis, and interdisciplinary cosimulation. In this paper, it is necessary to simulate the mechanical state of the knee joint with high precision, so ABAQUS is chosen in this study to be more suitable for complex nonlinear structural analysis.
Given the irregularity of human body surfaces, “mesh division” in ABAQUS is inapplicable. This study employed HYPERMESH for precise meshing of the “knee sleeve–knee joint” model. Considering that the soft tissue and bone are solid models with irregular curved surfaces, it is necessary to use tetrahedral meshes, which can accept irregular shapes without compromising accuracy. 28 Due to the thinness of skin and knee sleeve (1.5 and 2 mm), we utilized triangular surface meshes. The choice of mesh density has a significant effect on the effect of stress and strain analysis. 29 After multiple convergence experiments, we set bones at 3 mm, soft tissue and skin at 5 mm, and knee sleeve at 4 mm. Figure 5 depicts mesh types and sizes of the model.
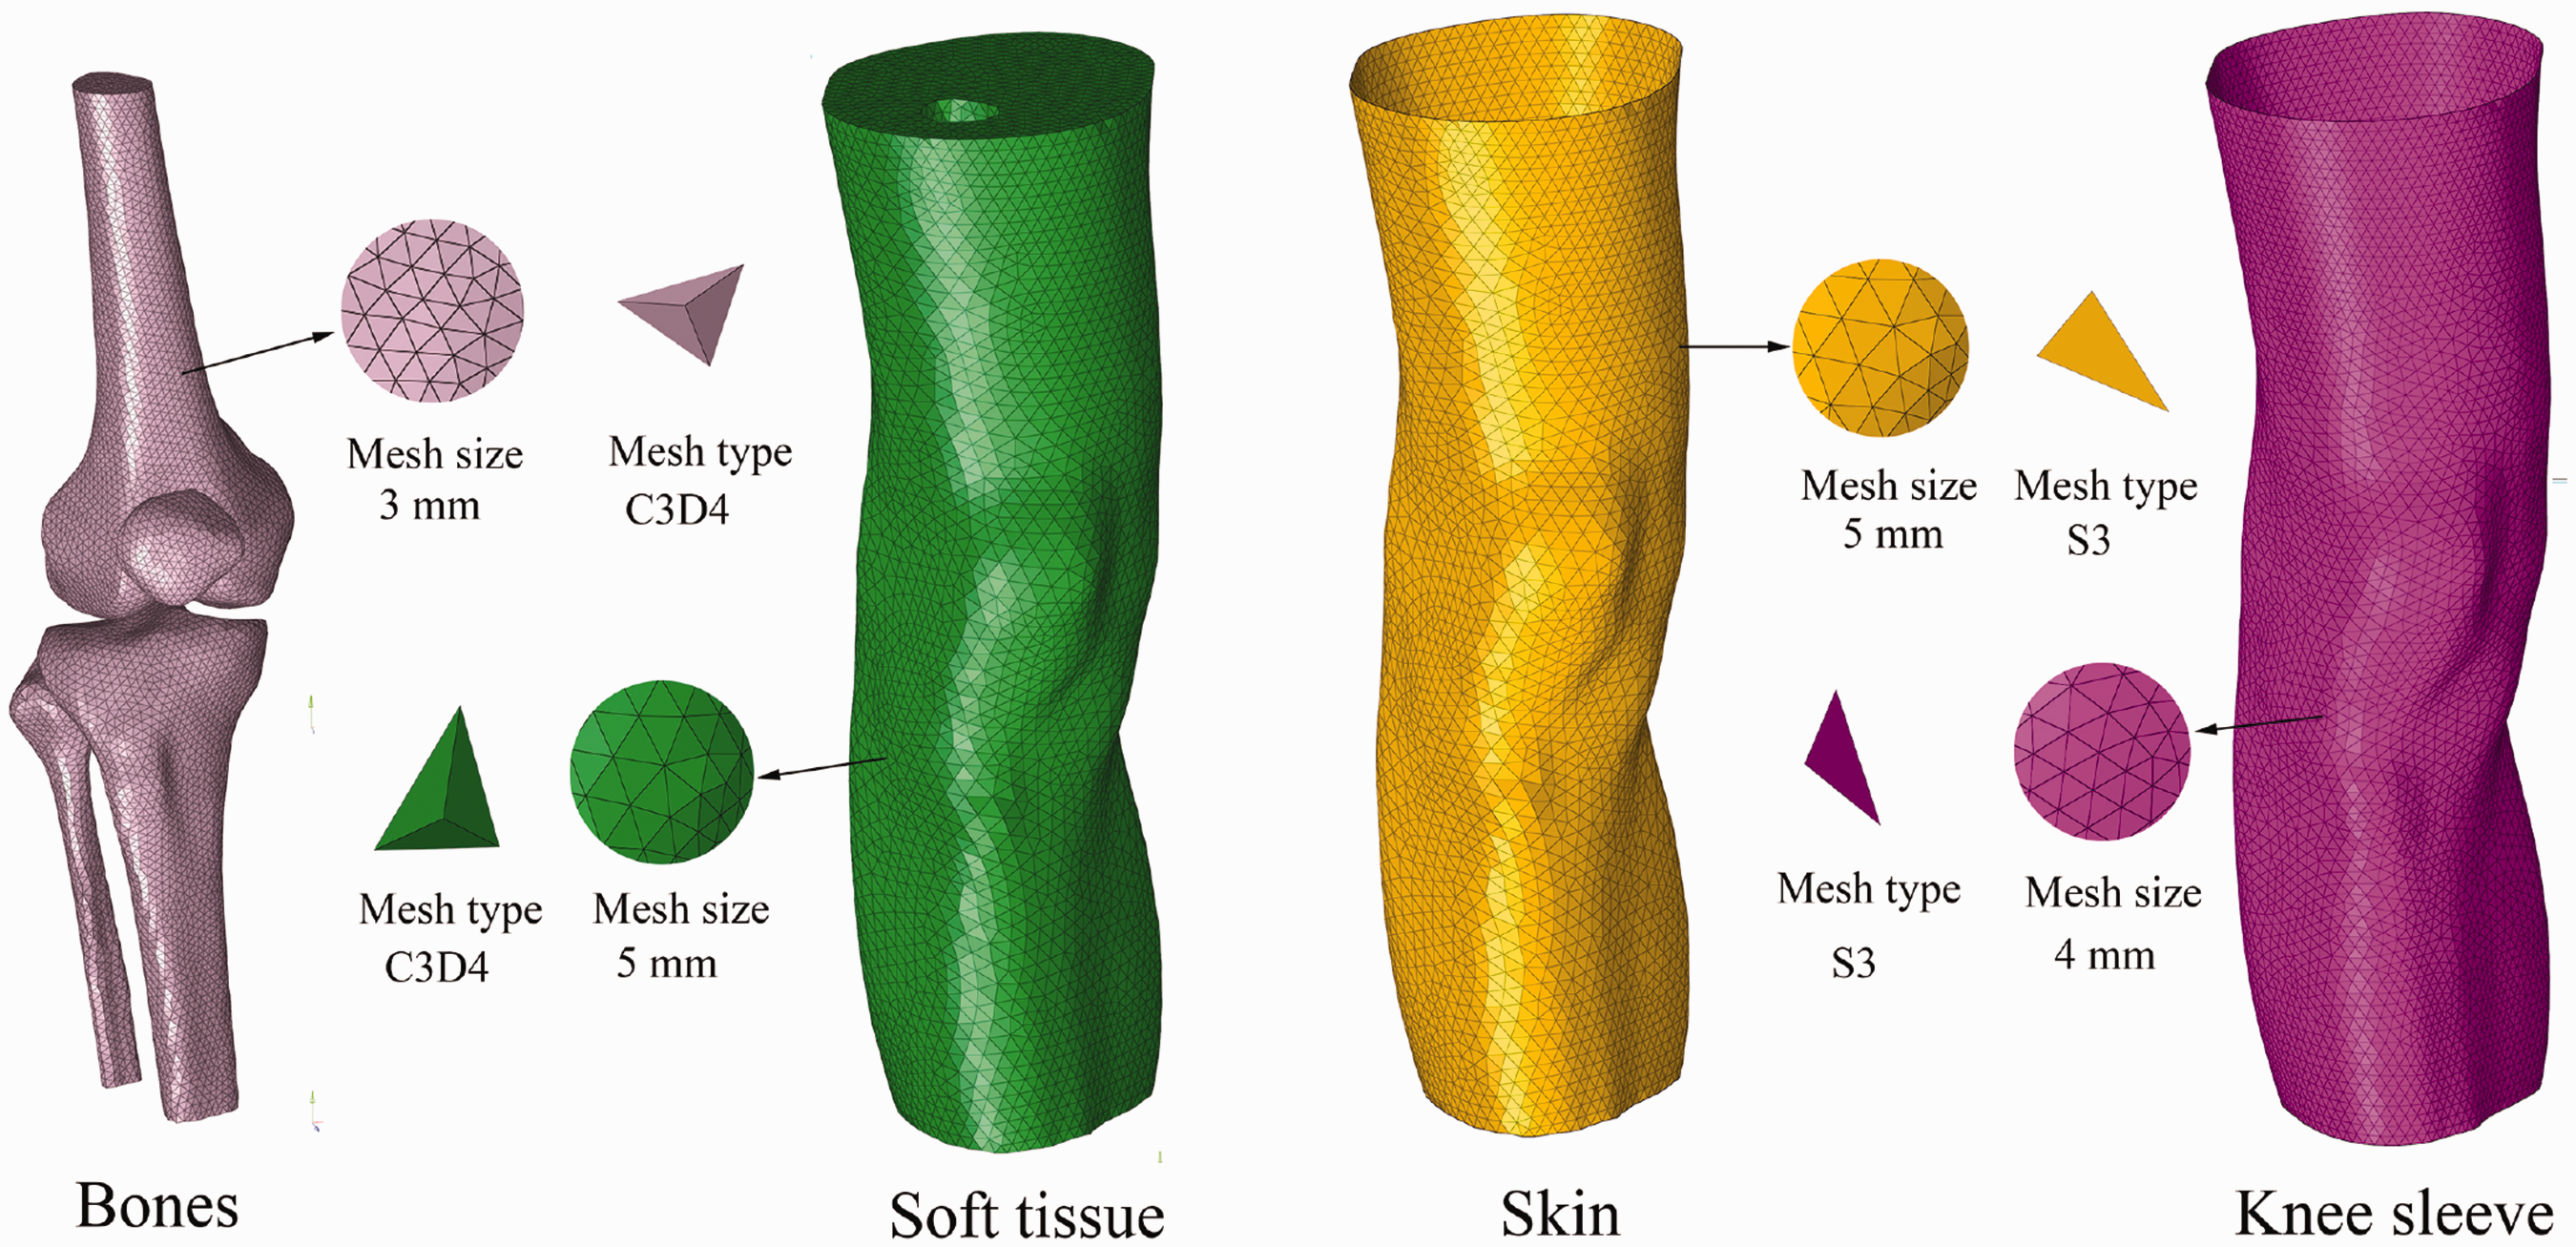
Mesh models of bones, soft tissue, skin, and knee sleeves.
Material attributes
Material properties of the knee joint
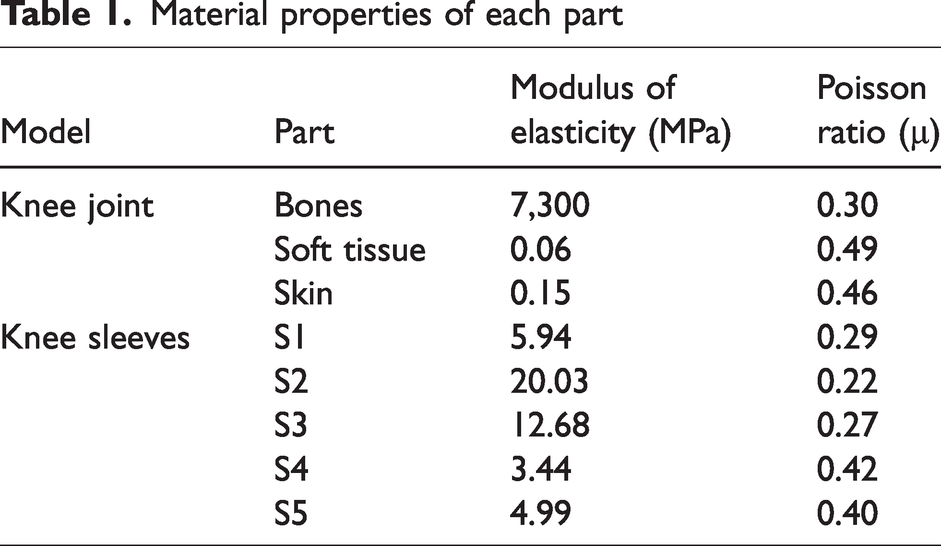
In this study, the human body was regarded as an elastomer, and the contact between the human knee joint and the experimental knee sleeve was defined as the contact between the elastomer and the elastomer. In order to simplify the calculation process, it was assumed that the skin, soft tissue, and bone of the human leg were isotropic uniform linear elastic materials. Concerning the studies of Hendriks et al. 30 and Lizee et al. 31 the material properties of each part of the human lower limbs are listed in Table 1.
Material properties of each part
Material properties of knee sleeves
After extensive literature review and market research on knee sleeves, it is found that knee braces are bulkier than knee sleeves. Knee braces are usually worn after severe knee injuries or surgery. Knee sleeves are more suitable for providing support and protection for the knee without affecting movement. On this basis, five knee sleeves commonly used in the market were selected as experimental samples in this study as shown in Figure 6, numbered S1, S2, S3, S4, and S5, respectively. The preliminary research found that most of the knee sleeves on the market were made of different fabrics. In order to facilitate subsequent material assignment in ABAQUS, the property measured were the fabrics with the largest area proportion in each type of knee sleeve.
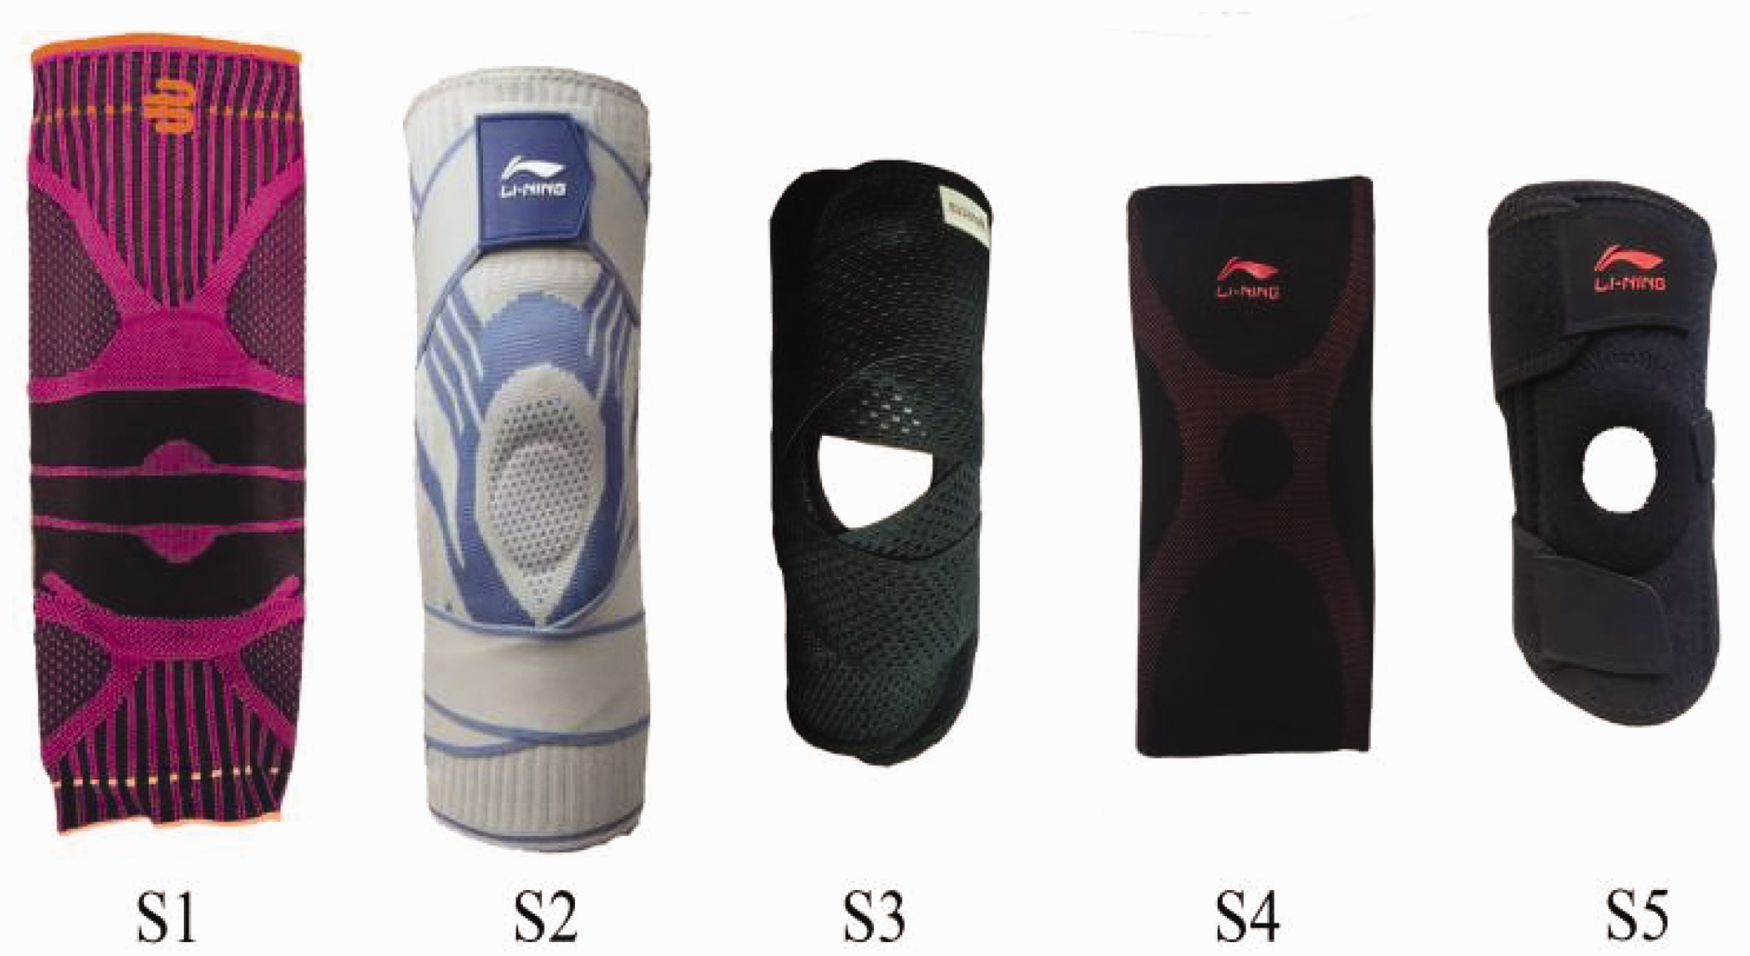
Five experimental knee sleeves.
As fabric tensile test equipment, we selected the universal material testing machine INSTORN5967, referring to the test standard “Fabric elasticity determination fabric strip strength test” (BS EN 14704-1-2005). We set the initial distance to 50 mm, returned to the initial distance after each stretch, and the stretching speed was set to 100 mm/min. When the stretch length was increased by 15 mm, we pressed the pause button to measure the fabric width during the stretch and calculated the Poisson ratio of the fabric. The material properties of different knee sleeves are listed in Table 1.
Setting of contact
Based on anatomical insights and literature, three contact pairs (“bone–soft tissue,” “soft tissue–skin,” and “skin–knee sleeve”) were defined. The interactions module in ABAQUS defined the contact relationships between models, defining the contact between the outer surfaces of the bones (patella, femur, fibula, and tibia) and the inner surfaces of the soft tissue as binding constraints. Similarly, the outer surface of the soft tissue and the inner surface of the skin were also set as binding constraints. The contact between the outer surface of the skin and the inner surface of the knee sleeve was frictional contact. That is, the two surfaces could be both normal separation and tangential sliding, so the two were set as binding contact, which was the closest to the actual situation, and the friction factor was set to 0.2. The contact setting is shown in Figure 7.
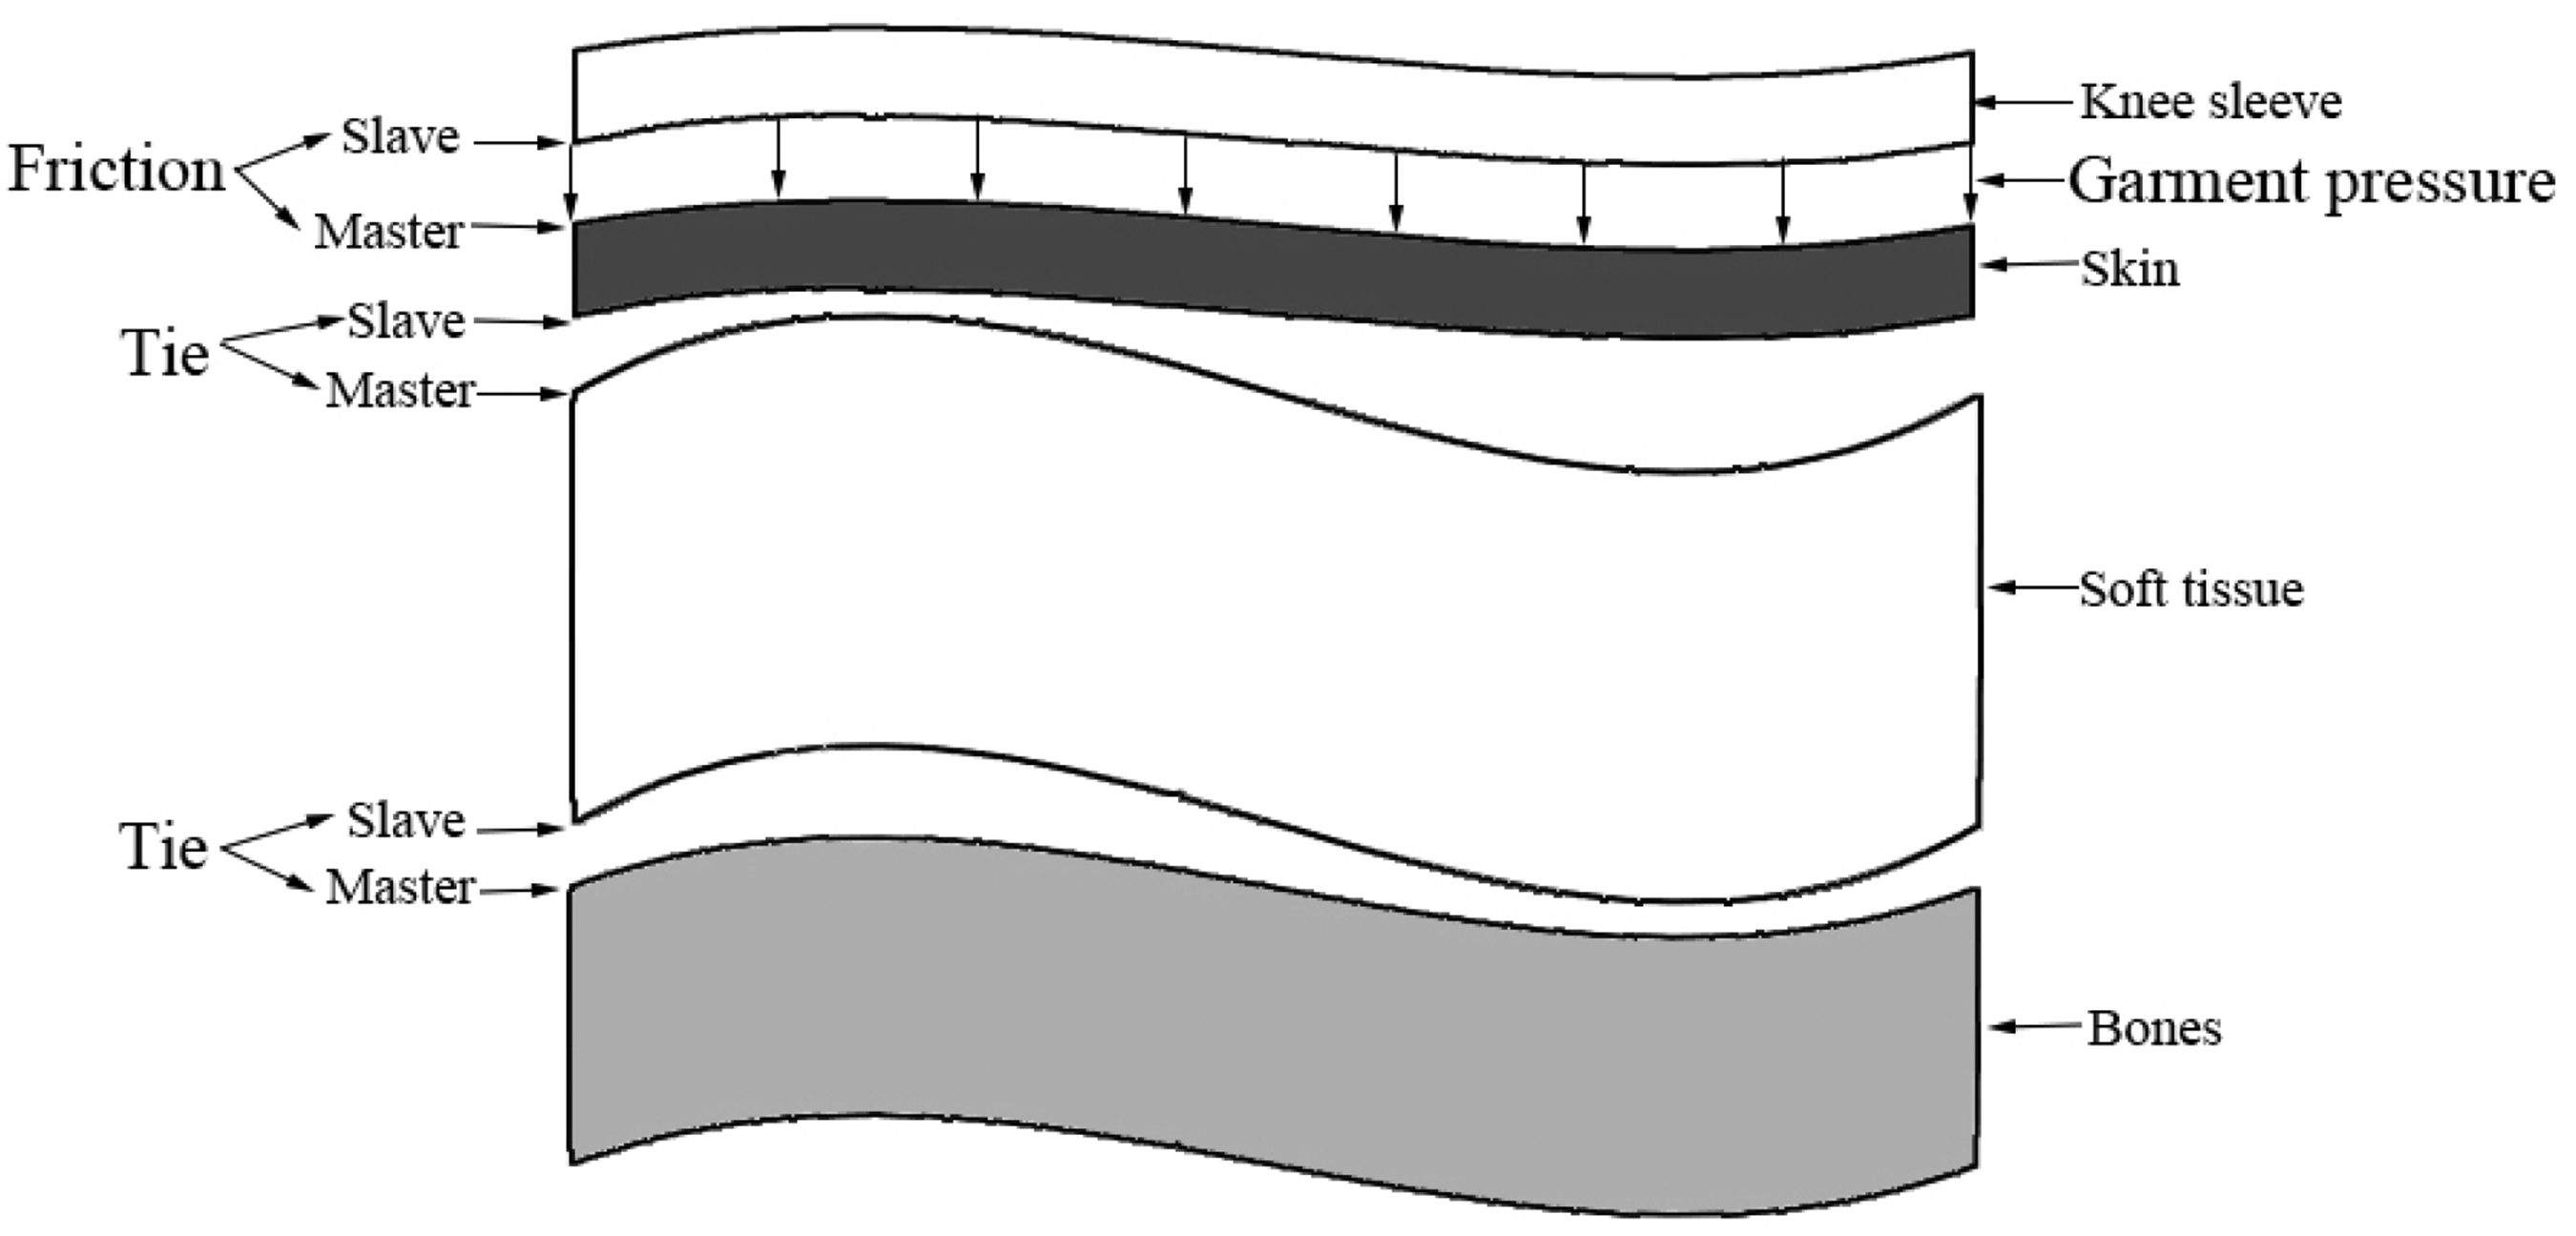
Contact setting.
Setting of boundary conditions and loads
Boundary conditions
The setting and processing of boundary conditions is a key part of the FE analysis process, which directly relates to the accuracy and rationality of the simulation result. 32 The knee joint is supported by high-strength bones and only withstands forces perpendicular to the surface of the skin under external pressure, such as clothing pressure. Meanwhile, the bones remain in a stable relative position during the wearing of knee sleeves and compression. Therefore, in order to simulate the clothing pressure in the actual scene, three directional fixed constraints were added to the upper end of the bone, the lower end of the tibia and fibula, and the entire patella.
Loads
In order to simulate the effects of external forces, the “Create loads” model is usually employed to apply loads. With a focus on static analysis, this study precisely replicated the vertical pressure experienced on the knee area when wearing knee sleeves by applying pressure directly to the skin’s surface. Because the load data were generated from the actual clothing pressure measurement, the simulated conditions were quite authentic. The “knee sleeve–knee joint” model was developed using the actual measured value, which was obtained through the garment pressure test. The pressure-measured data were then applied in the form of pressure load.
Objective pressure test experiment of knee sleeves
Selection of experimental samples
The knee sleeve samples for the objective test of clothing pressure are the five samples mentioned in “Material assignment.” Given the widespread phenomenon of knee sleeves in the current market, it is difficult to achieve diversified structural design under the premise of maintaining material consistency. This study focused on the influence of structural design differences on the pressure distribution and comfort experience of knee sleeves.
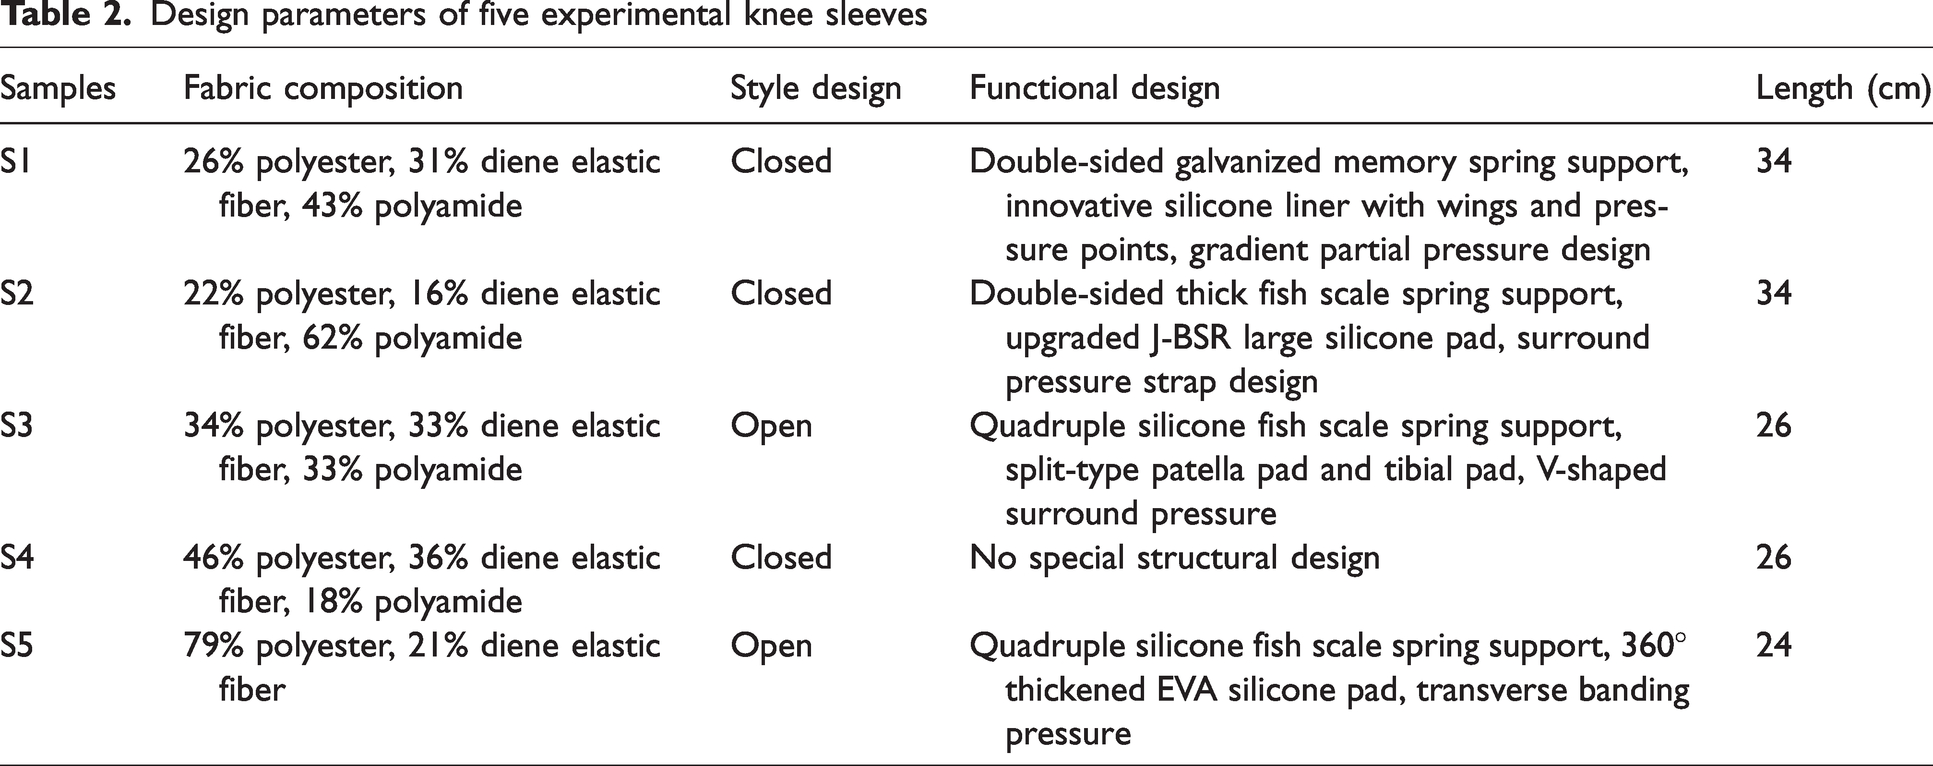
In order to further explore the optimization of clothing pressure distribution through the structural design of knee sleeves and further improve the pressure comfort of clothing, the five samples selected in this study have different structural designs but basically the same main fabric components. The specific parameters of knee sleeves are listed in Table 2.
Design parameters of five experimental knee sleeves
Clothing pressure experiment of knee sleeves
Clothing pressure is an important measure in verifying the validity of the “knee sleeve–knee joint” model. This study used the AMI3037-10-II airbag contact pressure test system for measurement. The sensor range was 0–35 kPa and the accuracy was ±0.1 kPa. To ensure the accuracy of the experimental results, the subjects were 30 healthy male college student volunteers who had previously received CT scans.
The patellar structure is protruding in the knee joint, which is an important part of realizing the basic functions of knee joint bending and straightening. In addition, the patella can more accurately reflect the change in clothing pressure. Thus, the center of the patella is selected as the reference point in this study. Manually outline the patellar structure on the skin to determine the approximate midpoint position. The height of the knee joint model and the length of the sports knee sleeves were measured, and the subjects wore five types of knee sleeves for pre-experiment to determine the range of the knee sleeves covering the human body. After comparing the knee joint model and the coverage area of the subjects wearing knee sleeves, the best measuring point was selected. The selection process of test points was as follows.
In the coverage of the knee sleeve, test the pressure of the knee sleeve from the top of the thigh down 2 cm as the first lap; then test 2 cm up from the bottom of the calf as the final lap. Then, divide the distance between the two circles into seven equal parts (but the shorter S3, S4, and S5 knee sleeves were divided into five equal parts). Starting with the first circle, each circle was labeled A, B, C, etc. until the last lap. Knee sleeves S1 and S2 were marked from A to H; knee sleeves S3, S4, and S5 were labeled from B to G. On each section, take the central point in front of the patella as the starting point and number the test point 1. Test points were then taken counterclockwise at 22.5° intervals until 16 points were taken, numbered 1 to 16.
Knee sleeves S1 and S2 had a total of 128 test points, knee sleeve S3 had 93 test points, knee sleeve S4 had 96 test points, and knee sleeve S5 had 95 test points (S3 and S5 had a patellar perforation design and fewer test points than S4). Taking the experimental knee sleeve S5 as an example, the selection of test points and measurement process of the pressure experiment are shown in Figure 8.
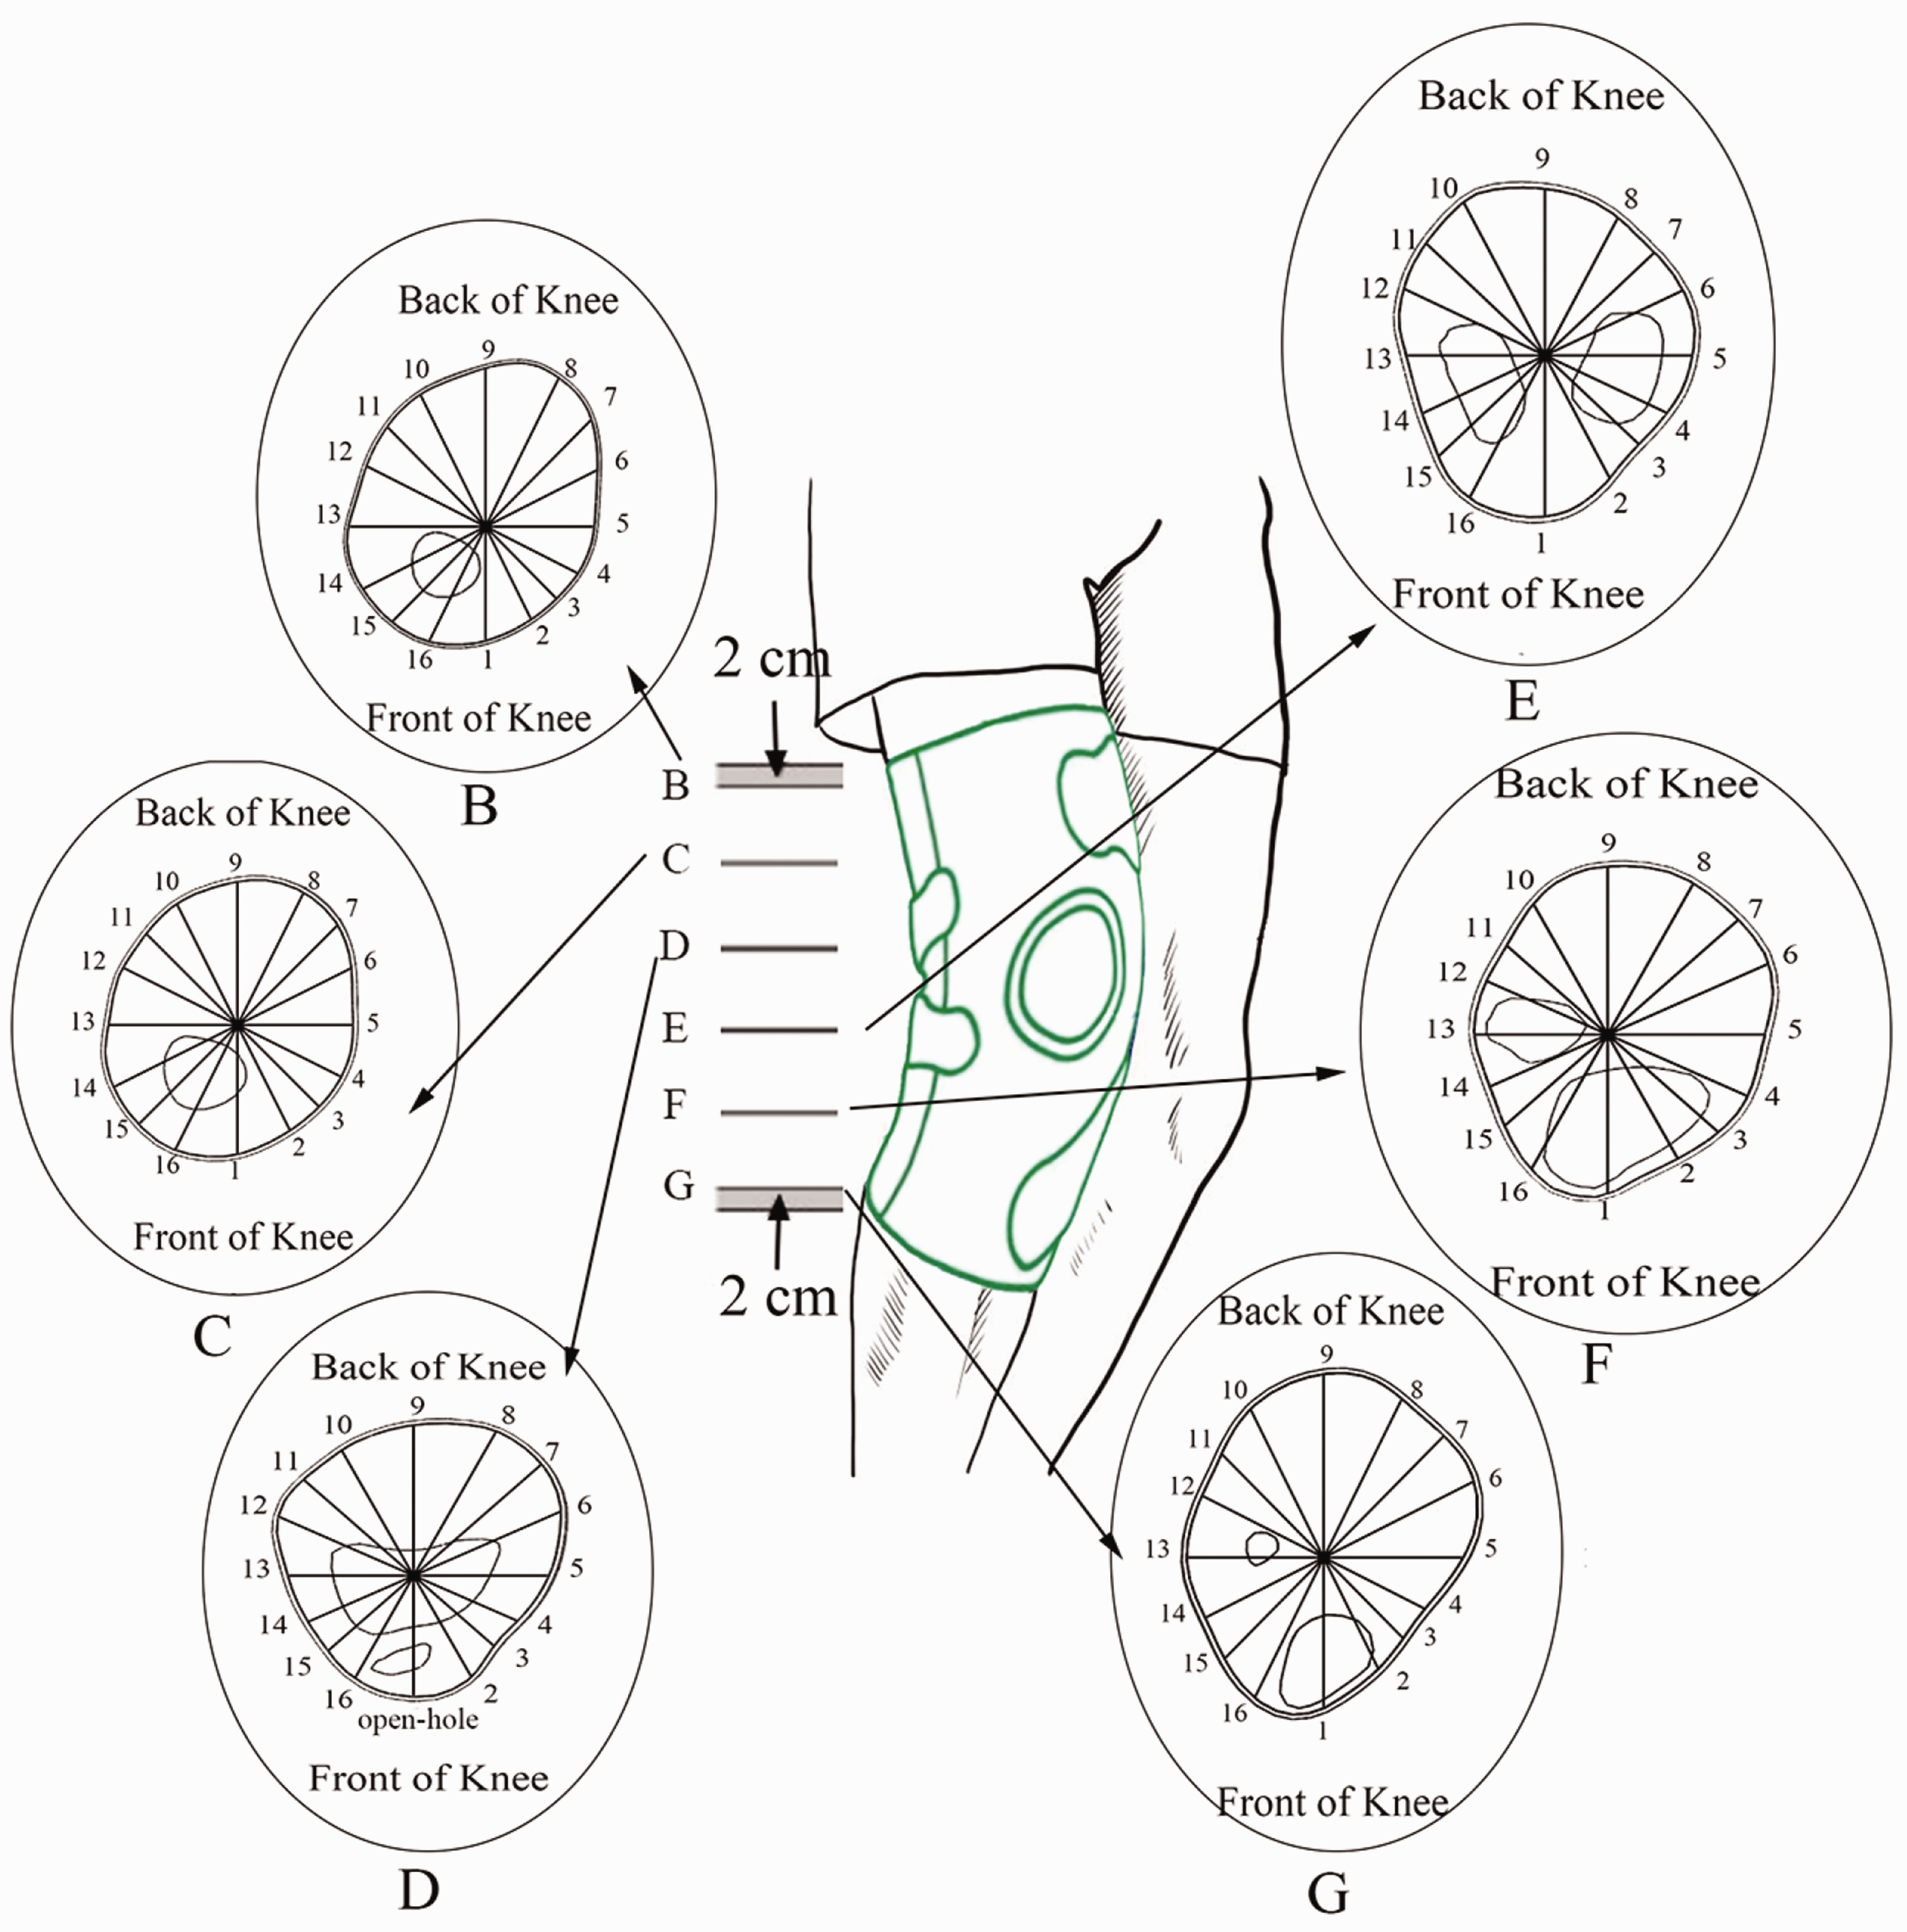
Pressure test points of knee sleeves.
Results and discussion
Validation of the knee sleeve–knee joint model
Analysis of clothing pressure test
Thirty experimenters wore five types of experimental knee sleeves of different structures to carry out the objective test experiment of clothing pressure, and the average pressure of the same measuring point was taken as the final pressure data. Taking the experimental knee sleeve S1 as an example, Figure 9 shows the clothing pressure distribution of each section.
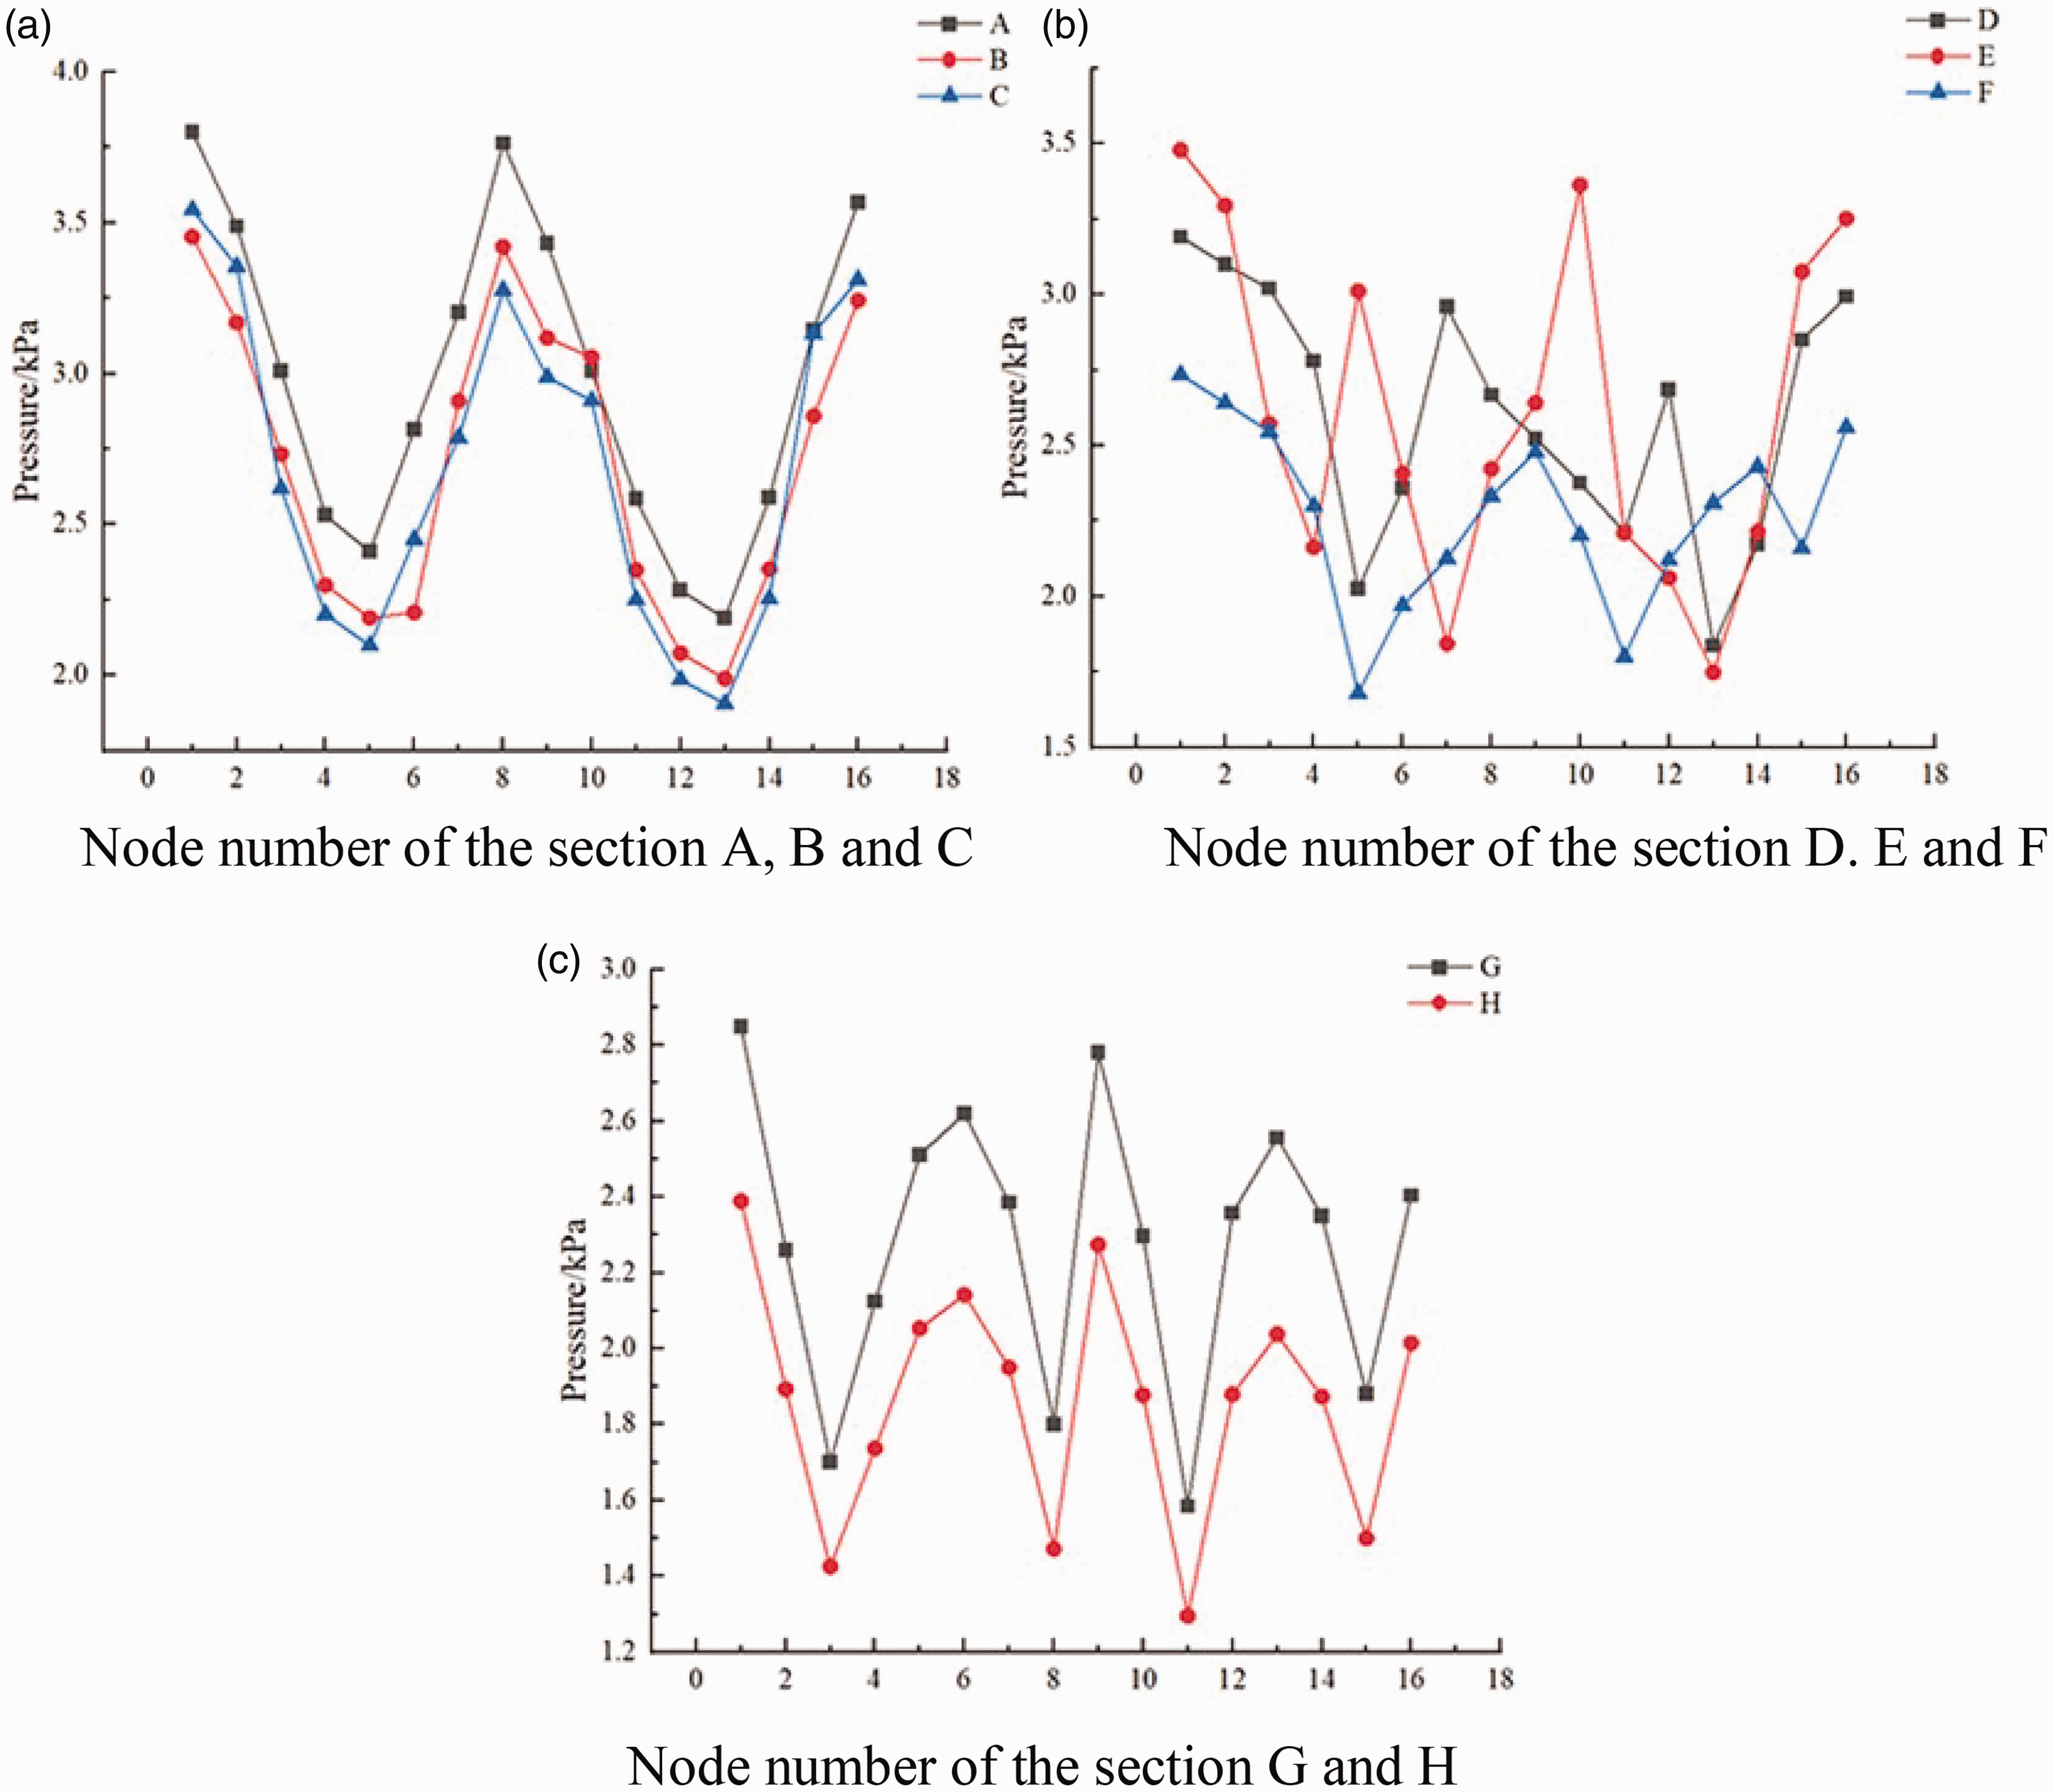
Clothing pressure distribution of each section after wearing sleeve S1. (a) Node number of sections A, B, and C. (b) Node number of sections D, E, and F and (c) Node number of sections G and H.
As shown in Figure 9, the clothing pressure distribution of eight cross-sections could be seen. The pressure values on cross-sections A, B, and C were very close and their distribution trend was highly consistent when the subjects wore knee sleeve S1. The pressure distribution trend of cross-sections G and H were similar, and the other four knee sleeves also followed the same trend. In addition, considering that the knee sleeves used in experiments S1 and S2 had two more cross-sections due to their longer length, the data of this study were optimized to facilitate the subsequent transverse comparative analysis of the five knee sleeves. That is, the pressure of corresponding points in sections A, B, and C was averaged and combined into 16 points. Similarly, the same method was used for cross-sections G and H with similar pressure trends. Figure 8 shows the combined diagram of pressure test points. After data optimization, each knee sleeve had five sections (renamed K1 to K5), and each section had 16 pressure test points.
Due to the different lengths of the five types of experimental knee sleeves, the number of sections was different, and the methods of combining pressure measurement points were also different. Figure 10(a) represents the combined method of experimental knee sleeves S1 and S2, and Figure 10(b) represents the combined method of experimental knee sleeves S3, S4, and S5.
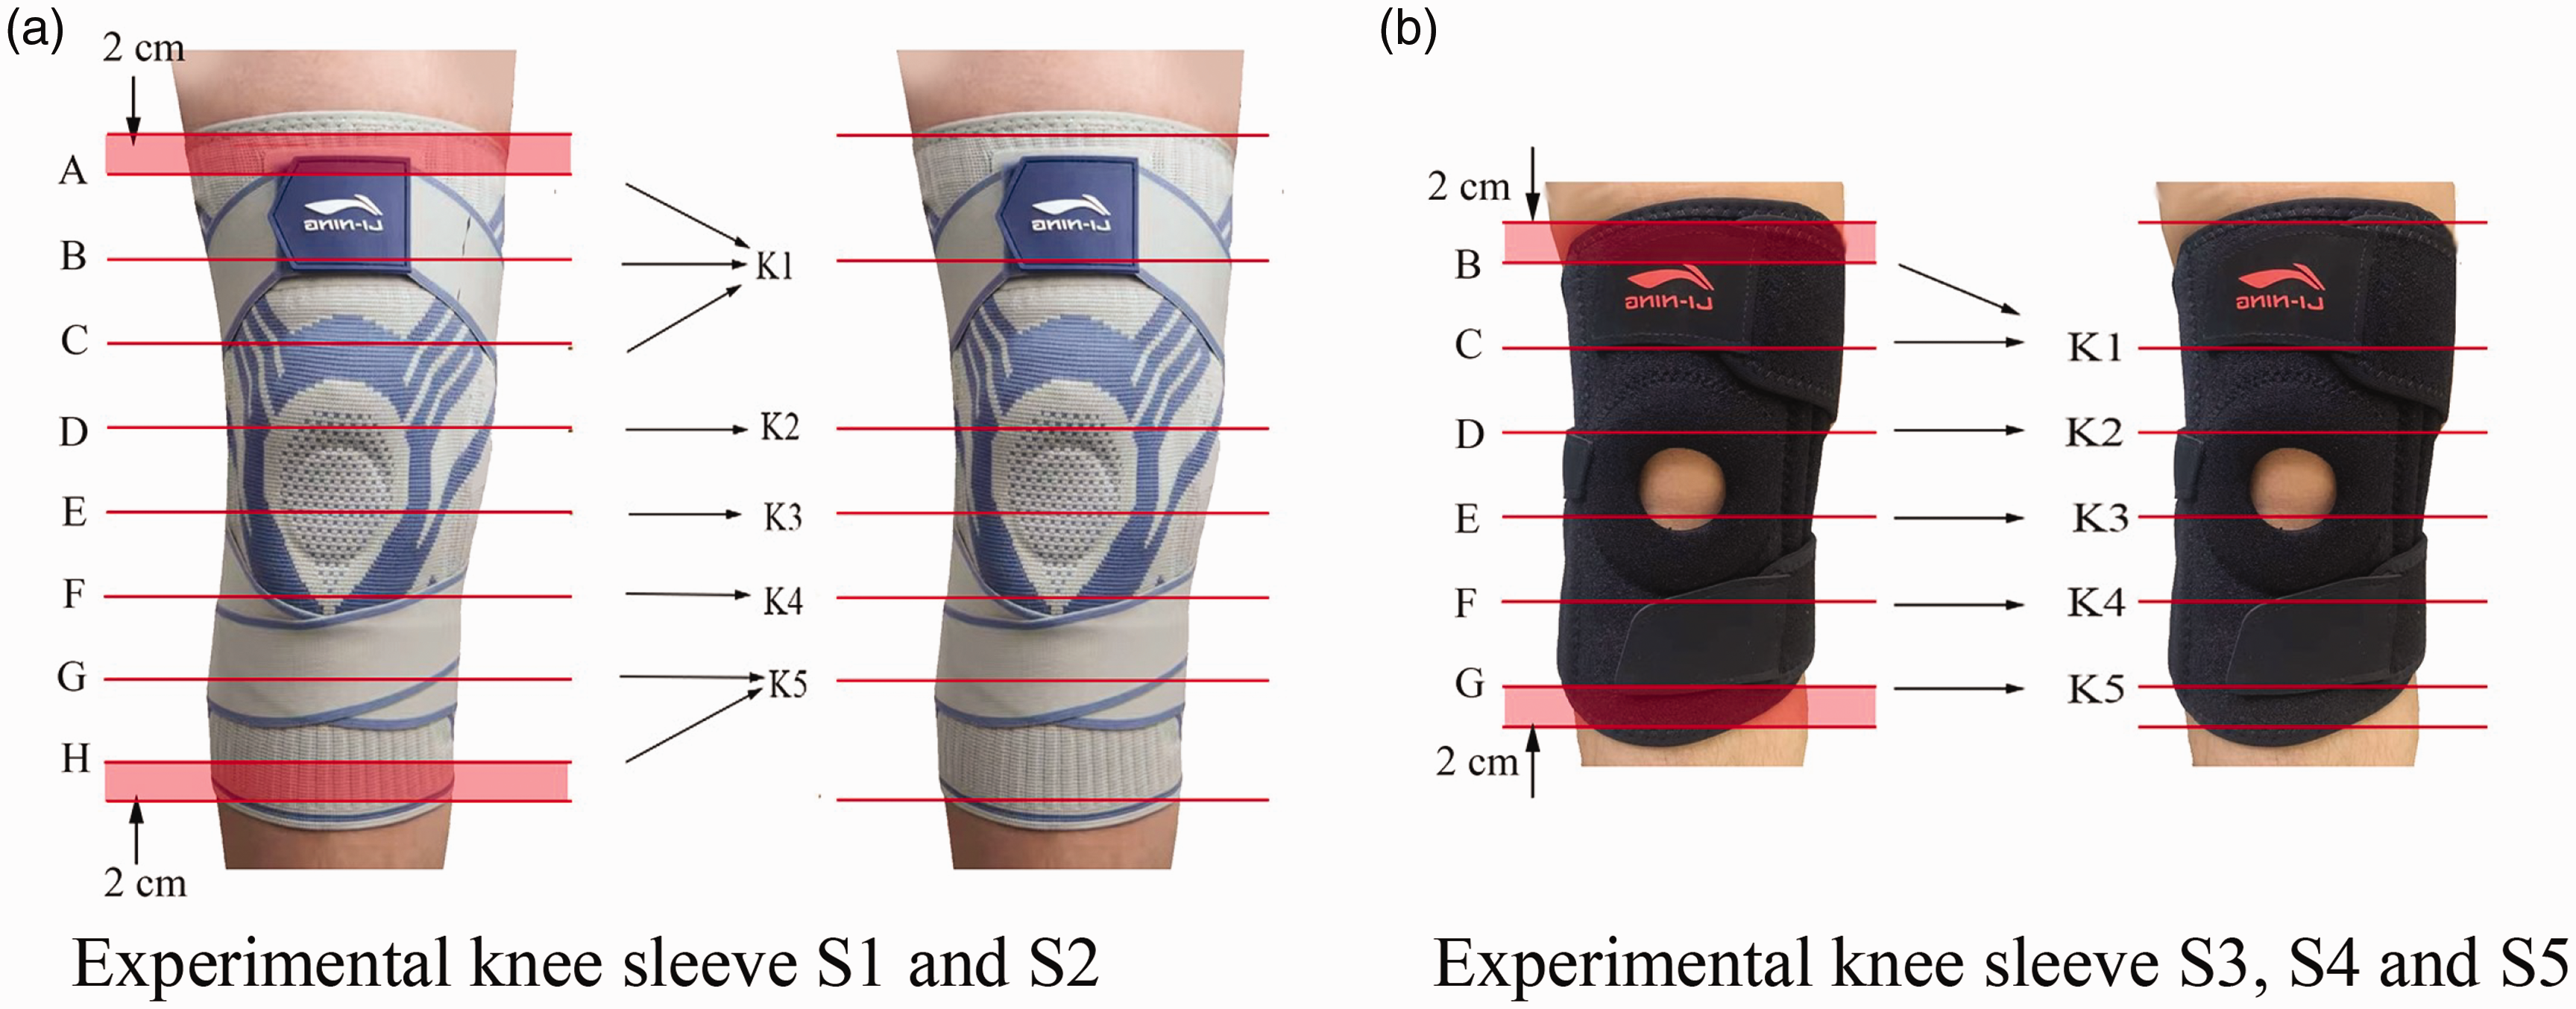
Merged pressure experiment test point. (a) Experimental knee sleeves S1 and S2 and (b) Experimental knee sleeves S3, S4, and S5.
Through data processing, the pressure data of 80 test points of the 5 experimental samples were obtained, as shown in Figure 11. Due to the open-hole design of the knee sleeve, the experimental sample S3 had no pressure value at point 16, point 1, and point 2 of section K2, and sample S5 had no pressure value at point 1 of section K2.
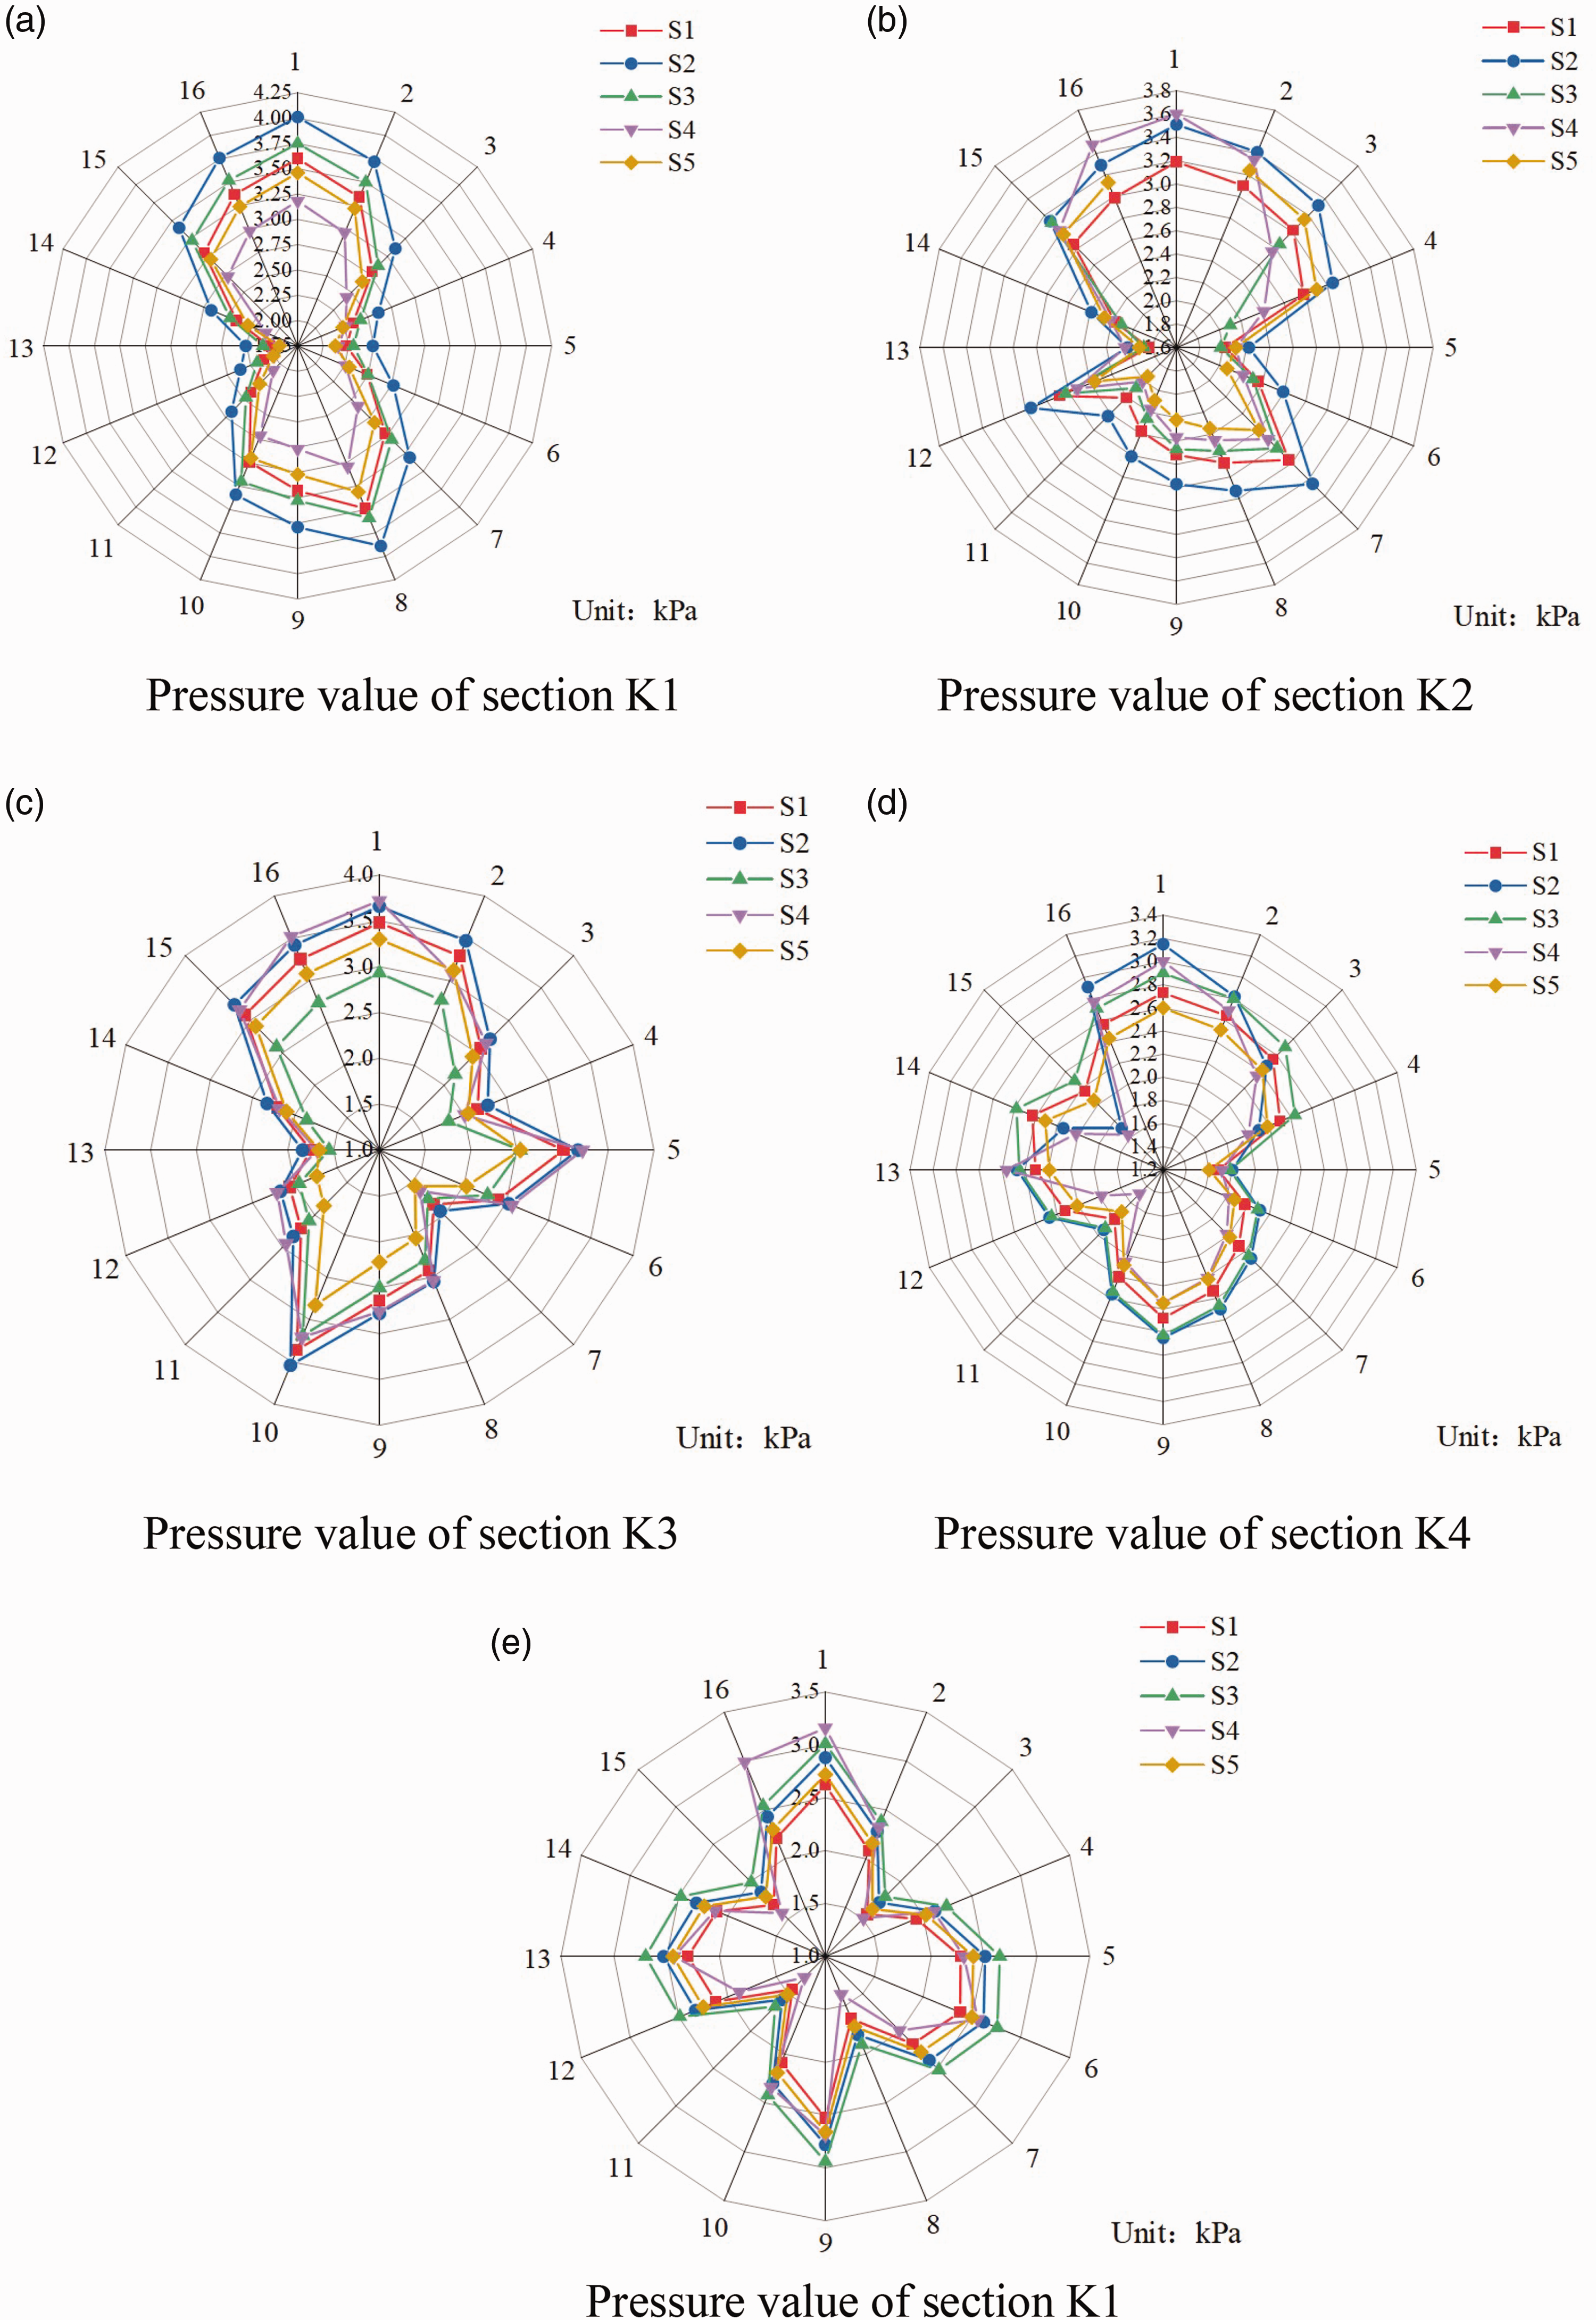
Clothing pressure value after wearing five knee sleeves: (a) section K1; (b) section K2; (c) section K3; (d) section K4 and (e) section K1.
As can be seen from Figure 11, the clothing pressure values of the same section of the human knee joint are different, but the overall clothing pressure distribution law is consistent. For example, in sections K1 and K2, the maximum pressure of the five types of knee sleeves all appeared near nodes 1 and 8, and the lower pressure points are located near nodes 5 and 13. Because according to Laplace’s law P = T/R, the pressure is inversely proportional to the radius of curvature when the elastic modulus is uniformly distributed. However, the radius of curvature near node 1 and node 8 is small, so the pressure value of node 1 and node 8 is large. In addition, the pressure value near node 1 in each section is too large. This is because, in cases where the curvature is similar, the distance between the skin and the bone has the greatest influence on the clothing pressure value. In human lower limbs, bones such as the femur, patella, tibia, and fibula are close to the front of the thigh (node 1). In addition, the elastic model of the bones is large, which is also the reason for the obvious pressure value.
Although the overall distribution trend of the five knee sleeves is consistent, there are still some differences between each knee sleeve due to the different structural design. For knee sleeves S4, in sections K1 and K5, the clothing pressure value was at the minimum value of the five knee sleeves. However, in cross-sections K2, K3, and K4, the clothing pressure value is higher than that of other knee sleeves in most parts. The clothing pressure value of knee sleeve S4 in each section fluctuated greatly, which indicated that the structural design of knee sleeve S4 was poor. Through the analysis of Figure 11, it is found that the overall clothing pressure fluctuation of the knee sleeve S1 is small, and the clothing pressure value in each section is in the middle position. This showed that the structural design of knee sleeves S1 is reasonable, and its shortcomings can be improved based on the knee sleeves S1 in the subsequent optimal design of knee sleeves, so as to obtain a knee sleeve with better clothing pressure comfort.
Analysis of FE simulation results
In the FE software, the pressure values measured by the experiment were averaged and applied to the surface of the FE model as loads to simulate the pressure values of 80 joints of the knee joint. Taking the experimental knee sleeve S5 as an example, the stress and displacement distribution cloud map of the knee joint obtained by FE simulation is shown in Figure 12.
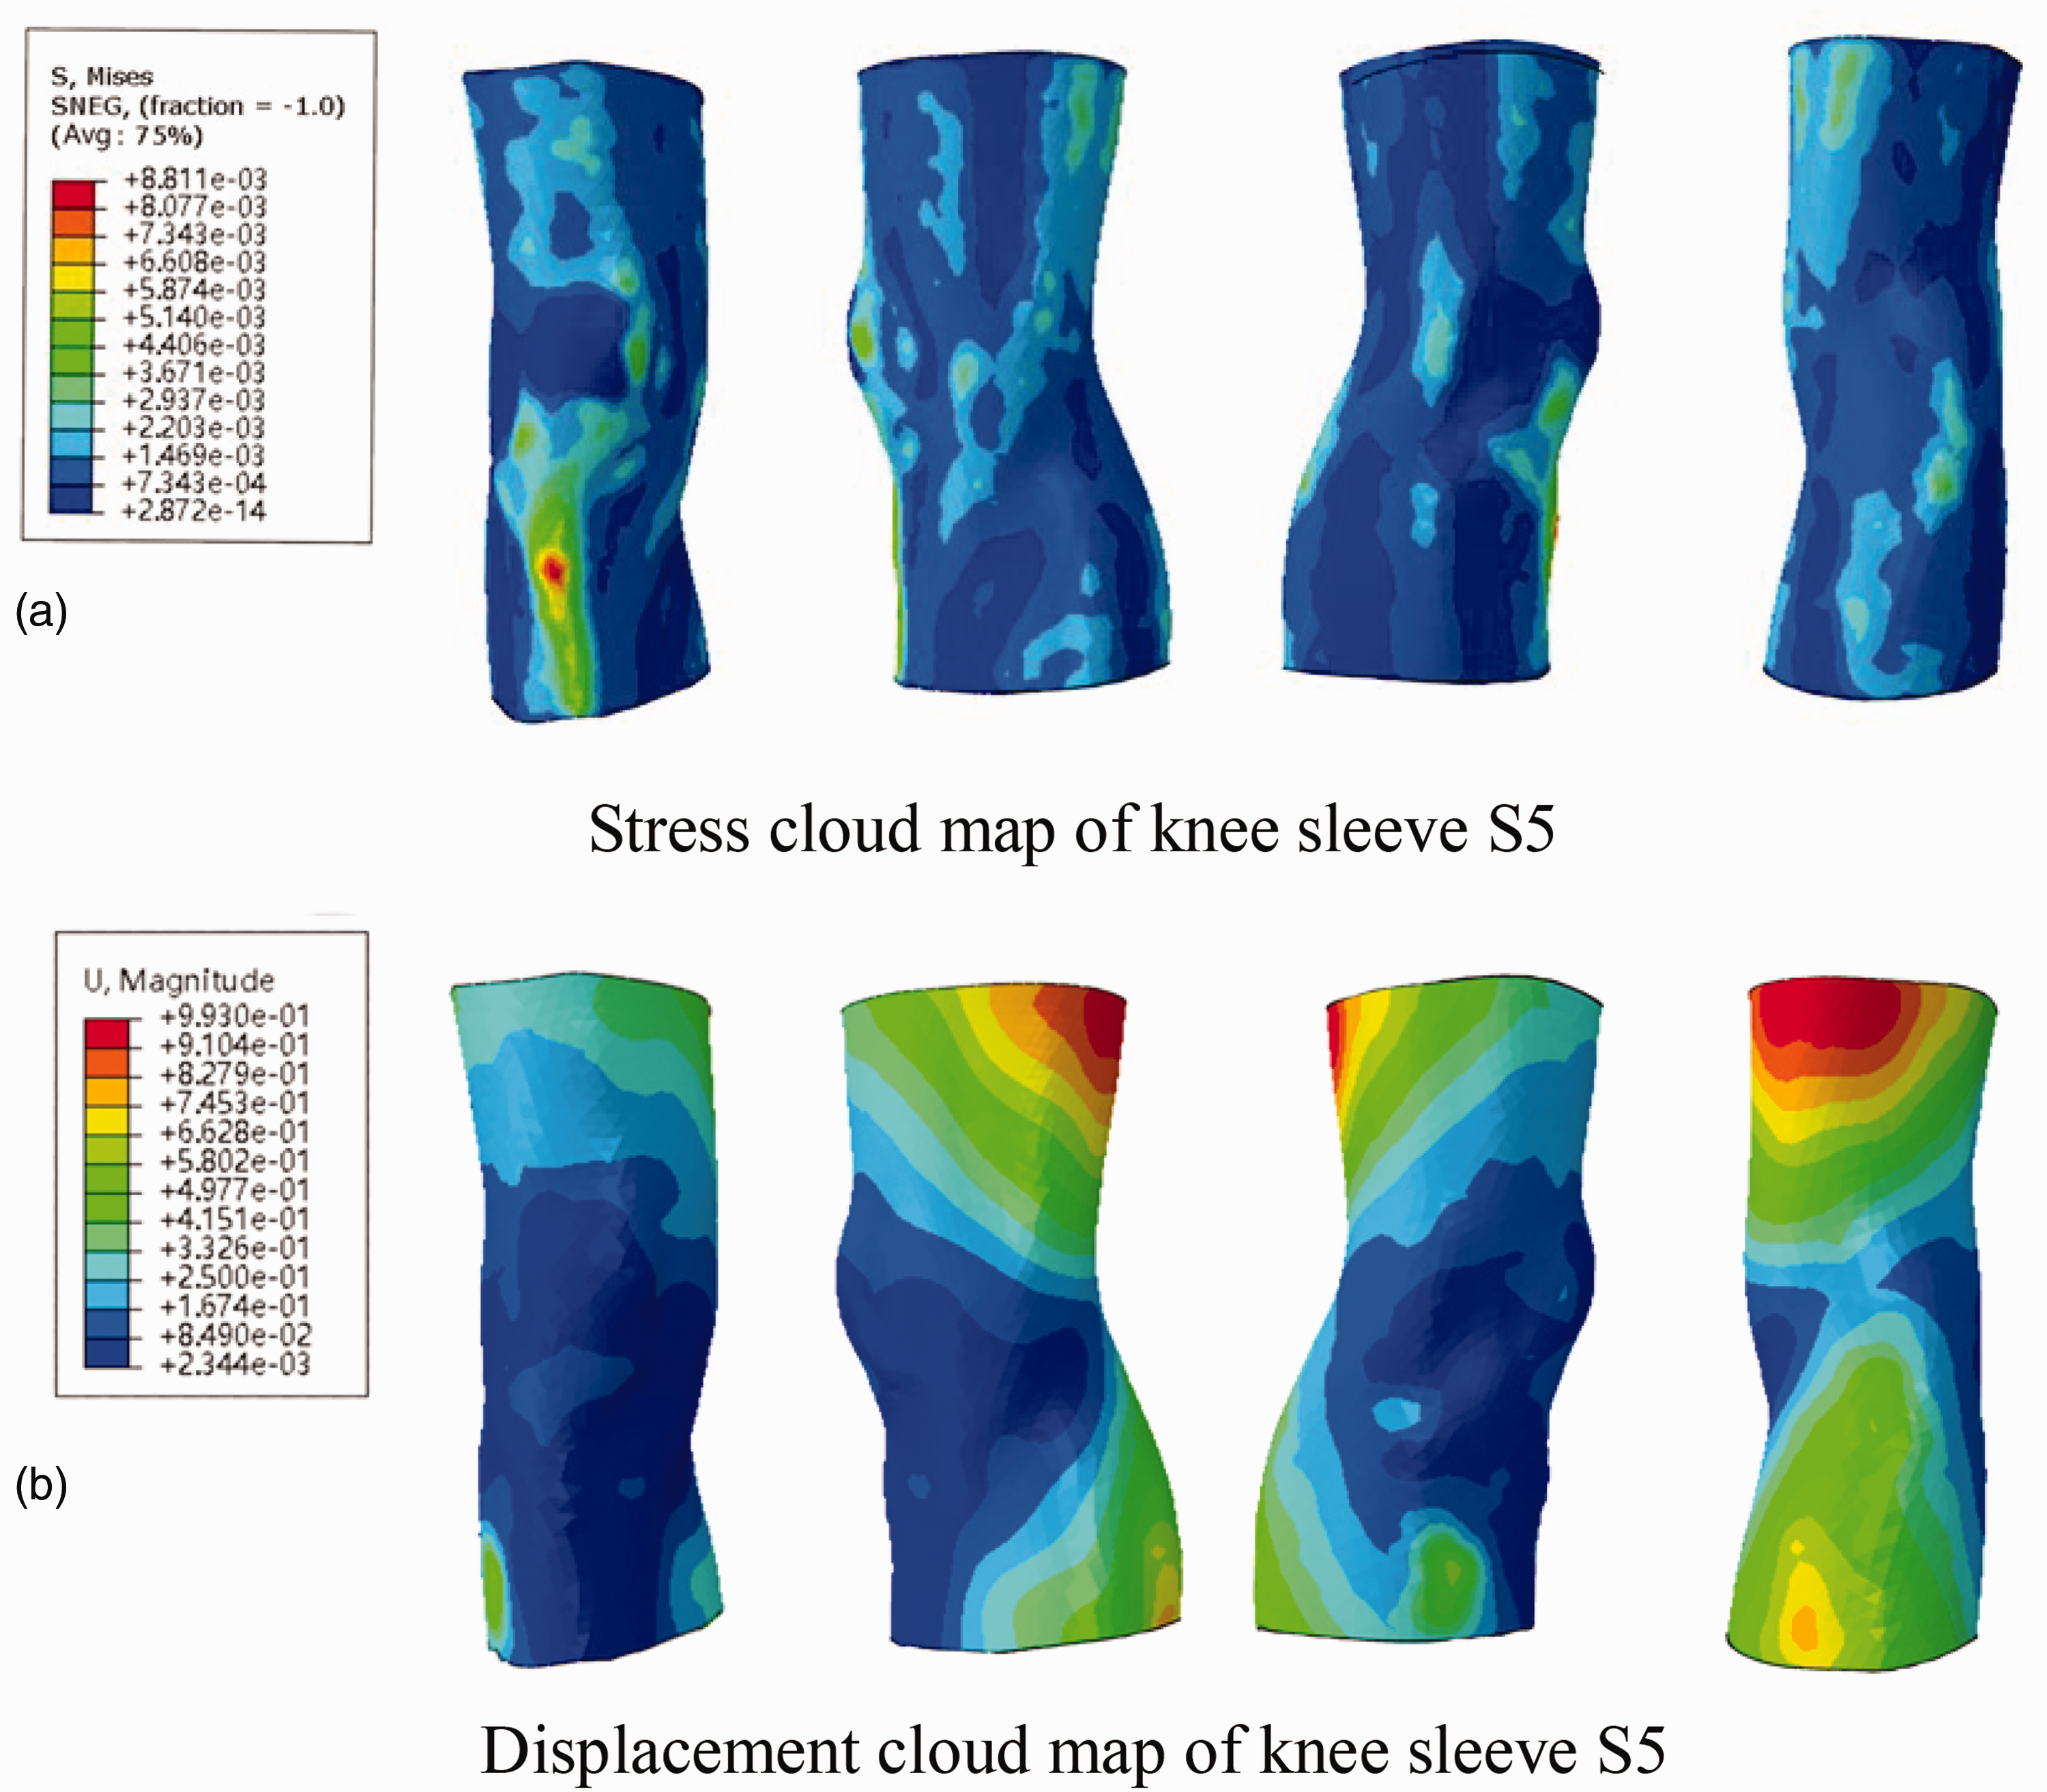
Stress and displacement cloud map of knee joint after wearing sample S5. (a) Stress cloud map of knee sleeve S5 and (b) Displacement cloud map of knee sleeve S5.
Figure 12 shows the distribution of stress and displacement of various parts of the human lower limb when wearing knee sleeve S5. In the color band on the left-hand side of the model, different colors represent different stress and displacement values, the bottom color indicates the smallest stress and displacement, and the top color indicates the largest value of stress and displacement. As can be seen from Figure 12(a), when wearing knee sleeves, the greatest equivalent stress occurs at the location where the shin is protruding. As shown in the displacement diagram in Figure 12(b), the posterior part of the human thigh has the largest displacement. From the two figures, it can be found that the maximum stress value and the maximum displacement value appear in different parts, which is attributed to the joint influence of the curvature radius of the human lower leg and the internal bone. It underscores that areas of peak stress do not necessarily coincide with those of maximal displacement, and vice versa. The result is in accordance with the actual measurement law, and the above conclusions are consistent with those of Ye et al. 33 and Lin et al. 34
Validation of the knee sleeve–knee joint model
By comparing the stress distribution obtained by FE analysis with the clothing pressure test results, it is found that the deformation curve of the elastomer under pressure only describes the deformation law of each region in the FE analysis. The displacement change is not exactly presented according to the actual deformation situation. Taking the experimental knee sleeve S5 as an example, the pressure data measured by the air-bag contact pressure tester was compared with the pressure on the skin surface of the FE model, as shown in Figure 13.
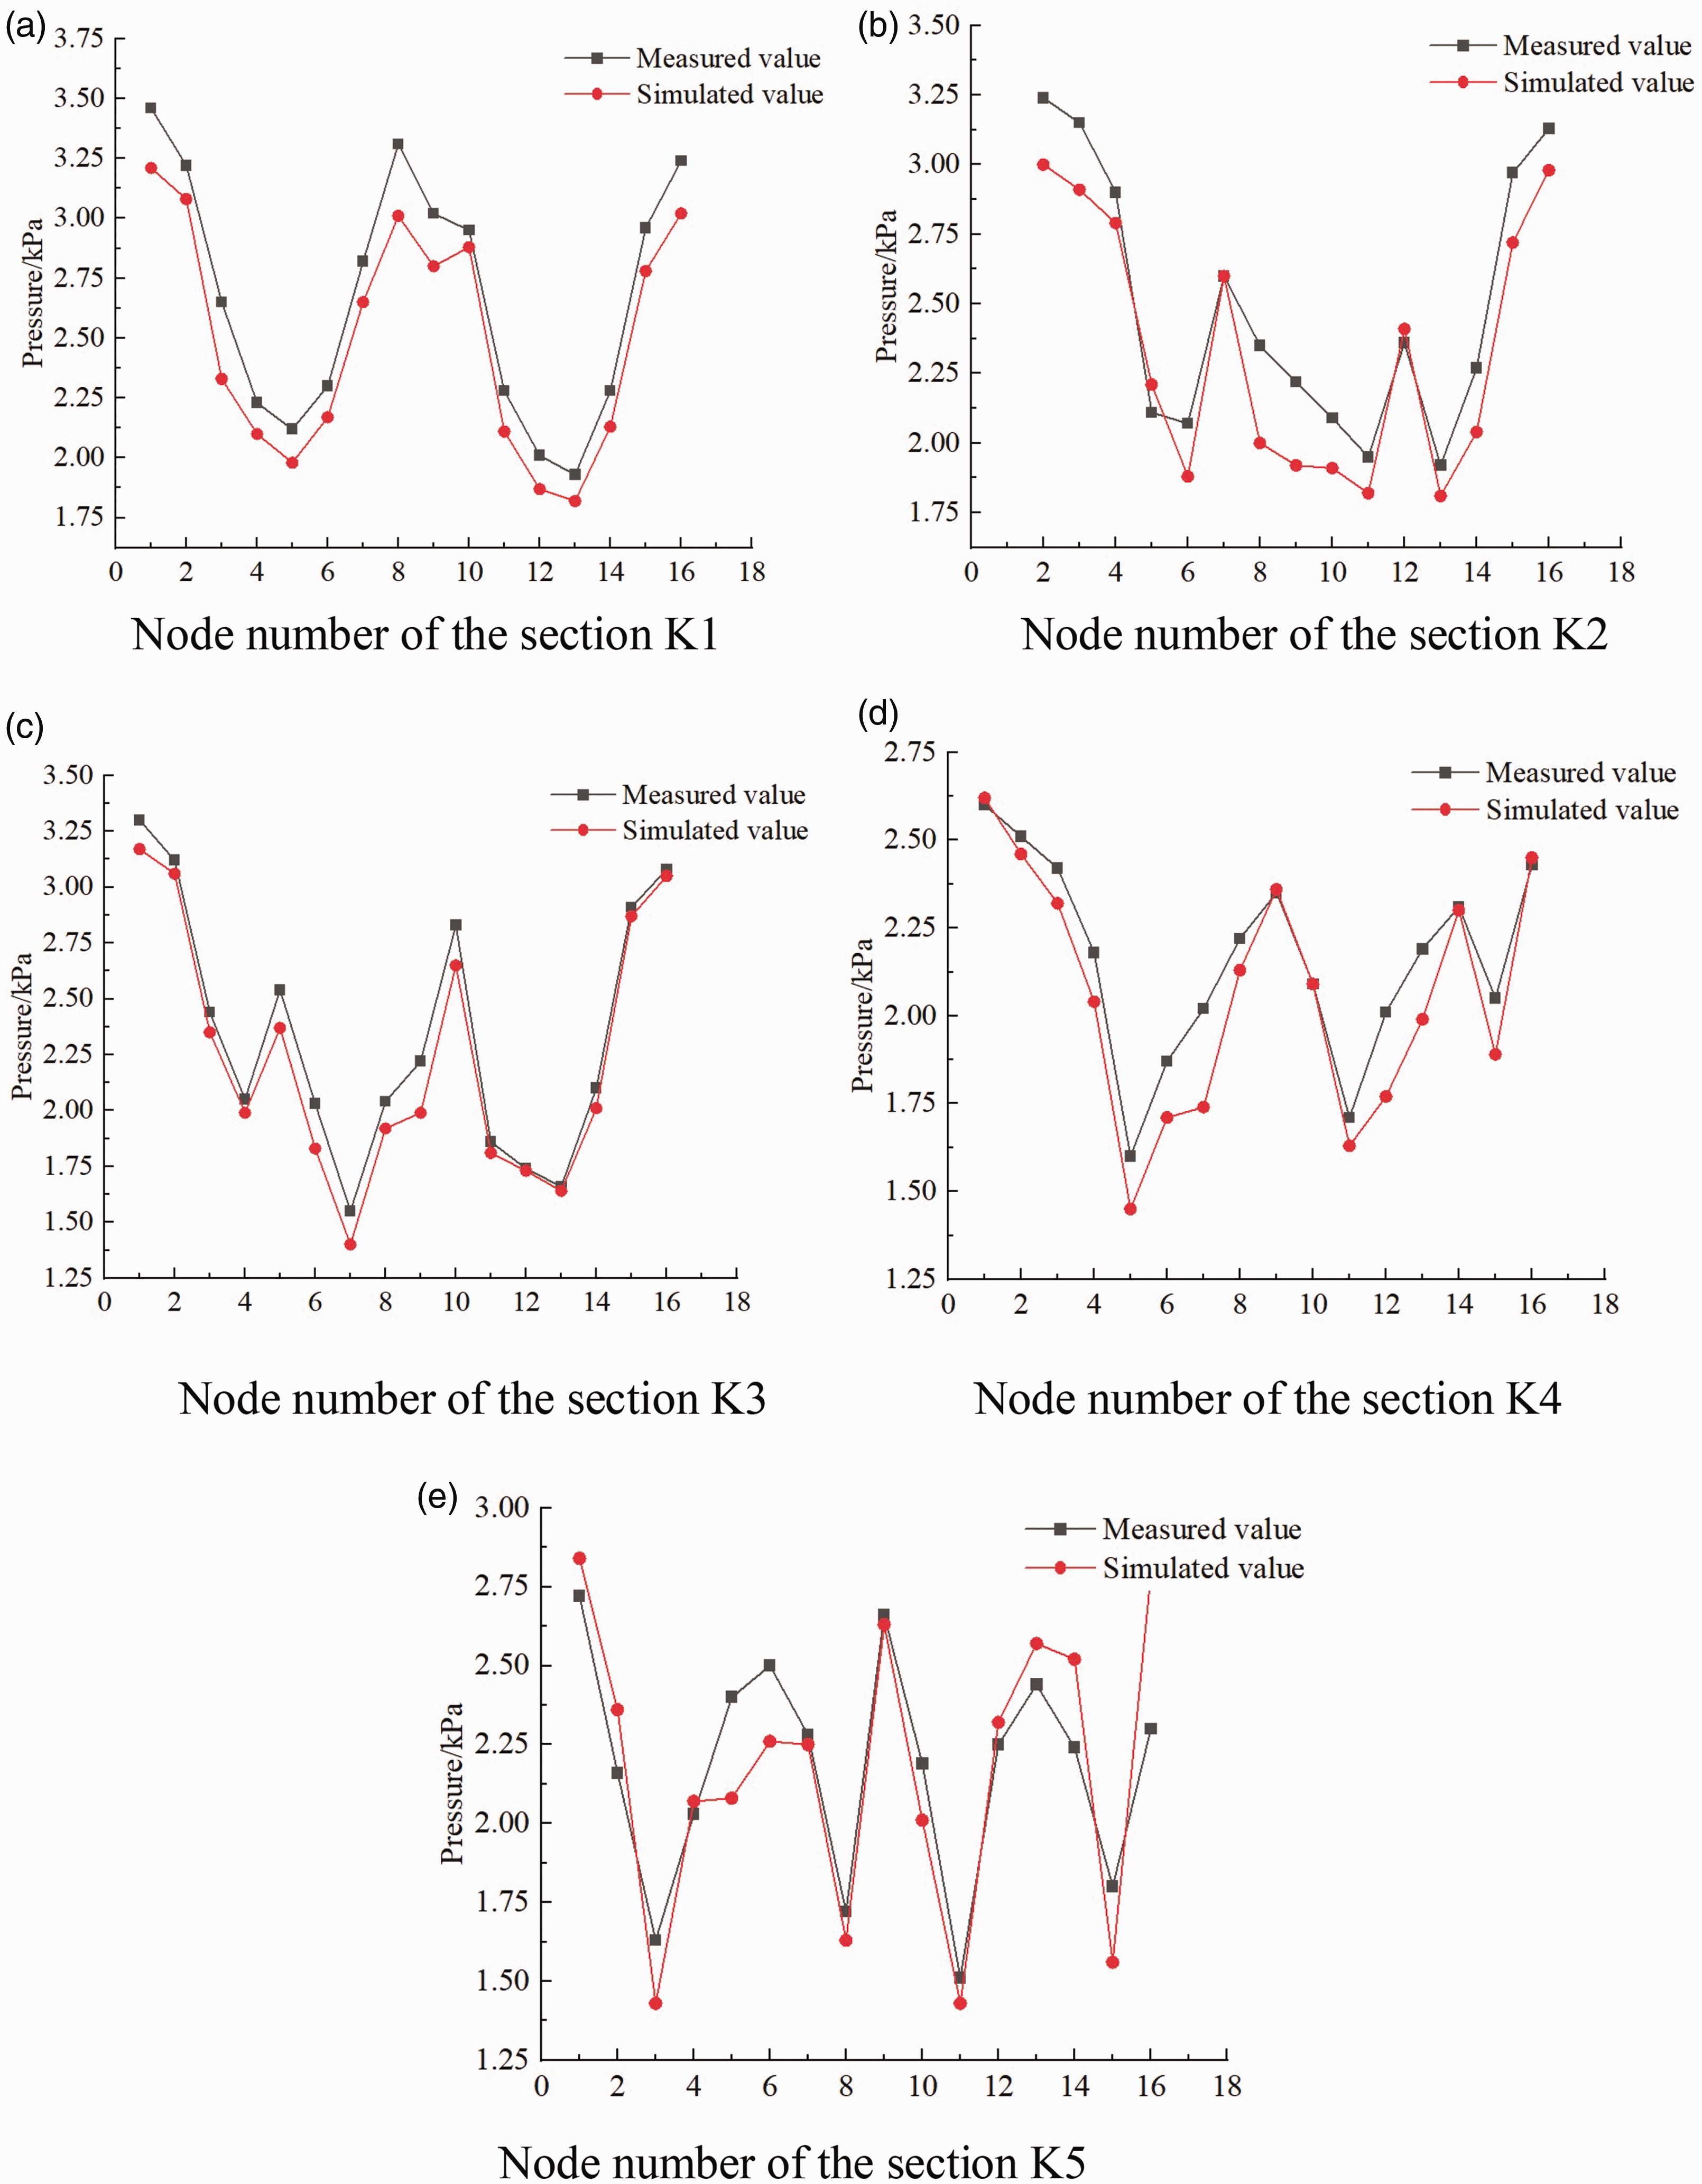
Comparison of clothing pressure test and FE simulation results: (a) node number of section K1; (b) node number of section K2; (c) node number of section K3; (d) node number of section K4 and (e) node number of section K5.
As can be seen from Figure 13, when the subjects wear the experimental knee sleeve S5, the actual measured pressure values are close to the simulated FE values, with a few errors. It may be caused by the following two reasons. (1) In this simulation, soft tissue was defined as linear elasticity, which was somewhat different from the real material properties of the human body. (2) Due to mechanical errors, the geometric characteristics of a certain part may be blurred when dividing the grid, resulting in a large error of the pressure value of the part. Through the statistics of 80 points of pressure measurement and simulation of 5 experimental knee sleeves, it is found that the average error is about 10%. Although there are outliers at individual points, the overall trend is consistent. Therefore, the FE model is effective and can be used for the optimization and improvement of the knee sleeve structure design.
Optimization of a functional knee sleeve based on a pressure zoning model
This study conducted relevant tests on the pressure distribution of knee sleeves and analyzed the influence of different structural designs on the pressure of knee sleeves. The experimental results showed that the pressure values of the patella and tibial anterior protrusions in human lower limbs were significantly higher than other parts. Furthermore, the functional zoning of knee sleeves in the experimental samples was not clear enough, and there was no reasonable zoning design based on leg characteristics. Therefore, according to the skin deformation law of different parts, the pressure comfort range, and the influence of clothing structure design on clothing pressure, an optimal design of knee sleeves based on the pressure zoning model was proposed and the optimization effect was verified.
Zoning design of knee sleeves based on pressure distribution characteristics
Sports knee sleeves are used as functional wear items for leisure sports. According to the way of wearing, the structure can be divided into open style and closed style, where the open style is mainly rubber binding and the closed style is mainly knitted sleeves. The open-style knee sleeve is mainly made of thick composite fabric, with poor air permeability, and the structural design is stiff and rigid. Thus, it is difficult to optimize in combination with ergonomic characteristics.
However, the wearing method of closed knitted knee sleeves is usually skin sticking, mainly using knitted fabrics, and relying on the high elastic performance of the fabric for fixation. It can be targeted to activate the muscle tissue that stabilizes the joint, thereby effectively reducing pressure on the knee joint and stabilizing the joint. Moreover, in the previous clothing stress tests, the structural design of the knee sleeve S1 was more reasonable. Based on this, this study took sleeve knee sleeve S1 as the basis of improved design and proposed a zoning model design based on clothing pressure.
From the objective pressure test, the pressure distribution law of the longitudinal circumference of the knee sleeve can be obtained, as shown in Figure 14. Firstly, the circumference of the thighs decreases from top to bottom. According to the pressure test, as the circumference decreases, the pressure value of the knee sleeve also gradually decreases. Secondly, due to the gradual reduction of the distance between the skin and the bone and the reduction of the radius of curvature, the pressure value of the patella and tibia is larger. Finally, the circumference of the lower leg becomes larger from top to bottom, and the pressure value of the knee sleeve gradually increases. Therefore, when designing knee sleeves, it is necessary to pay attention to the influence of the body surface circumference on the clothing pressure, and high-elastic materials need to be used where the body surface circumference is large.
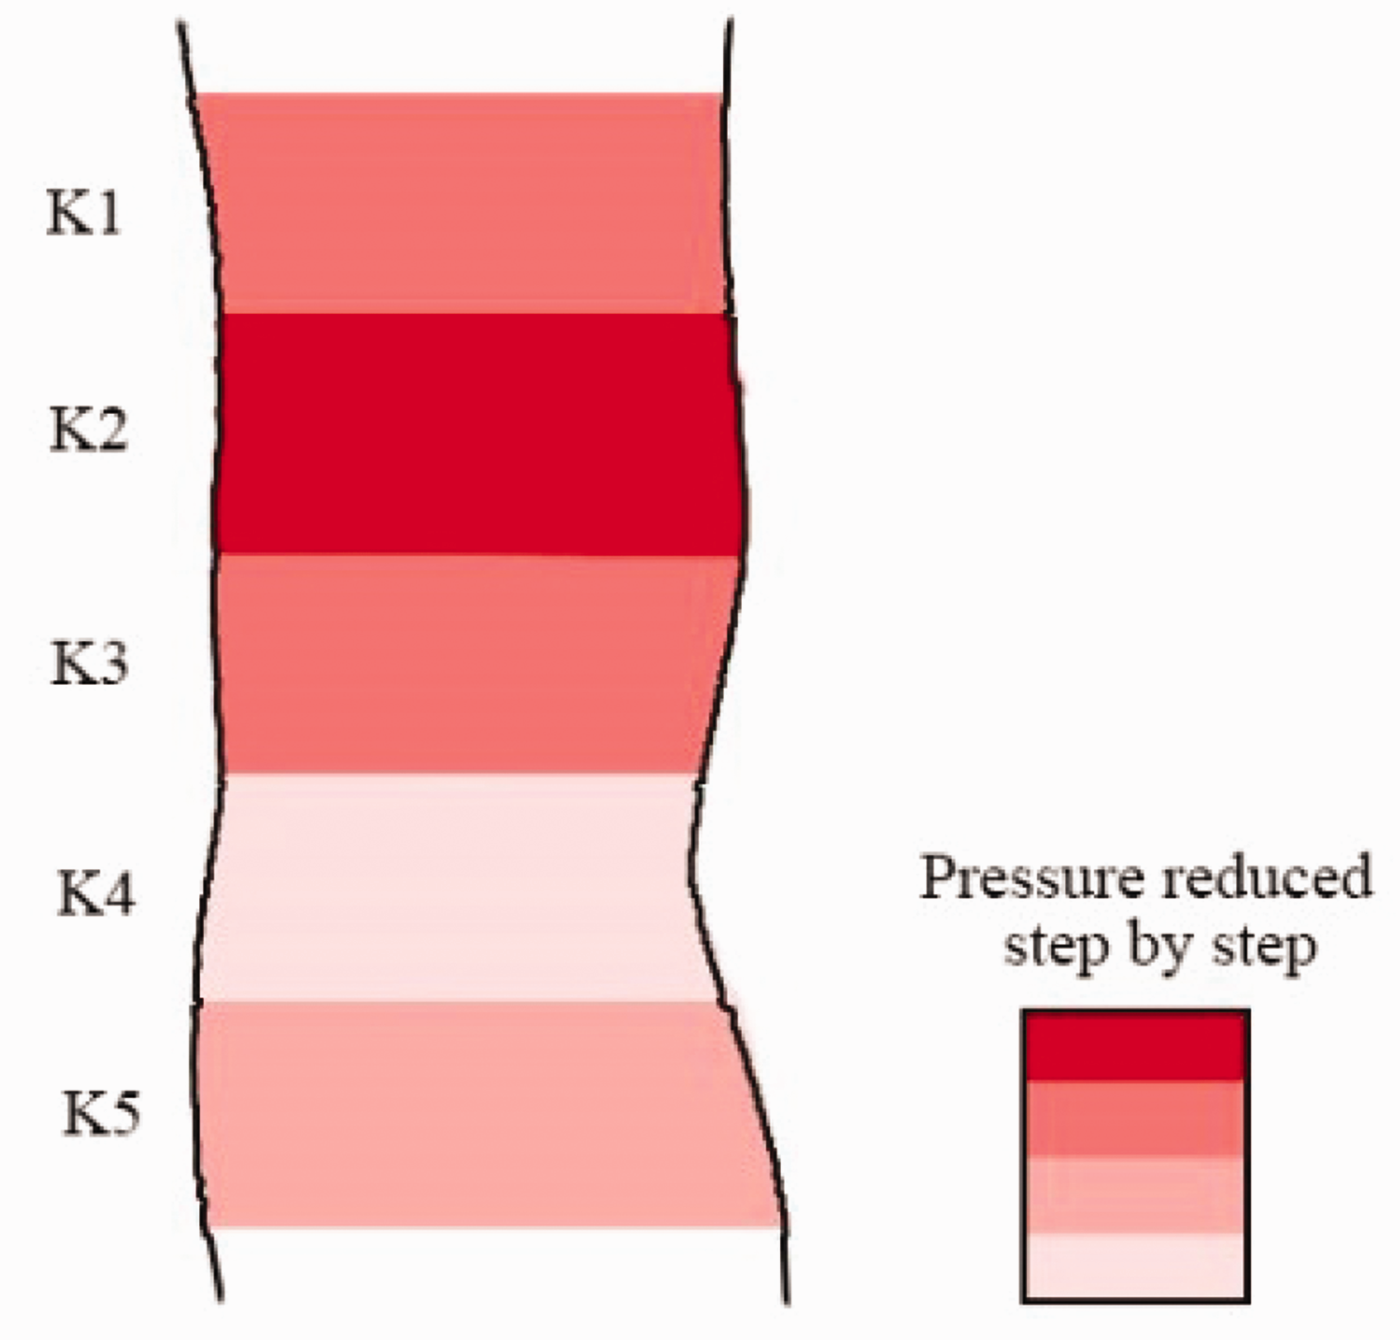
Longitudinal pressure distribution.
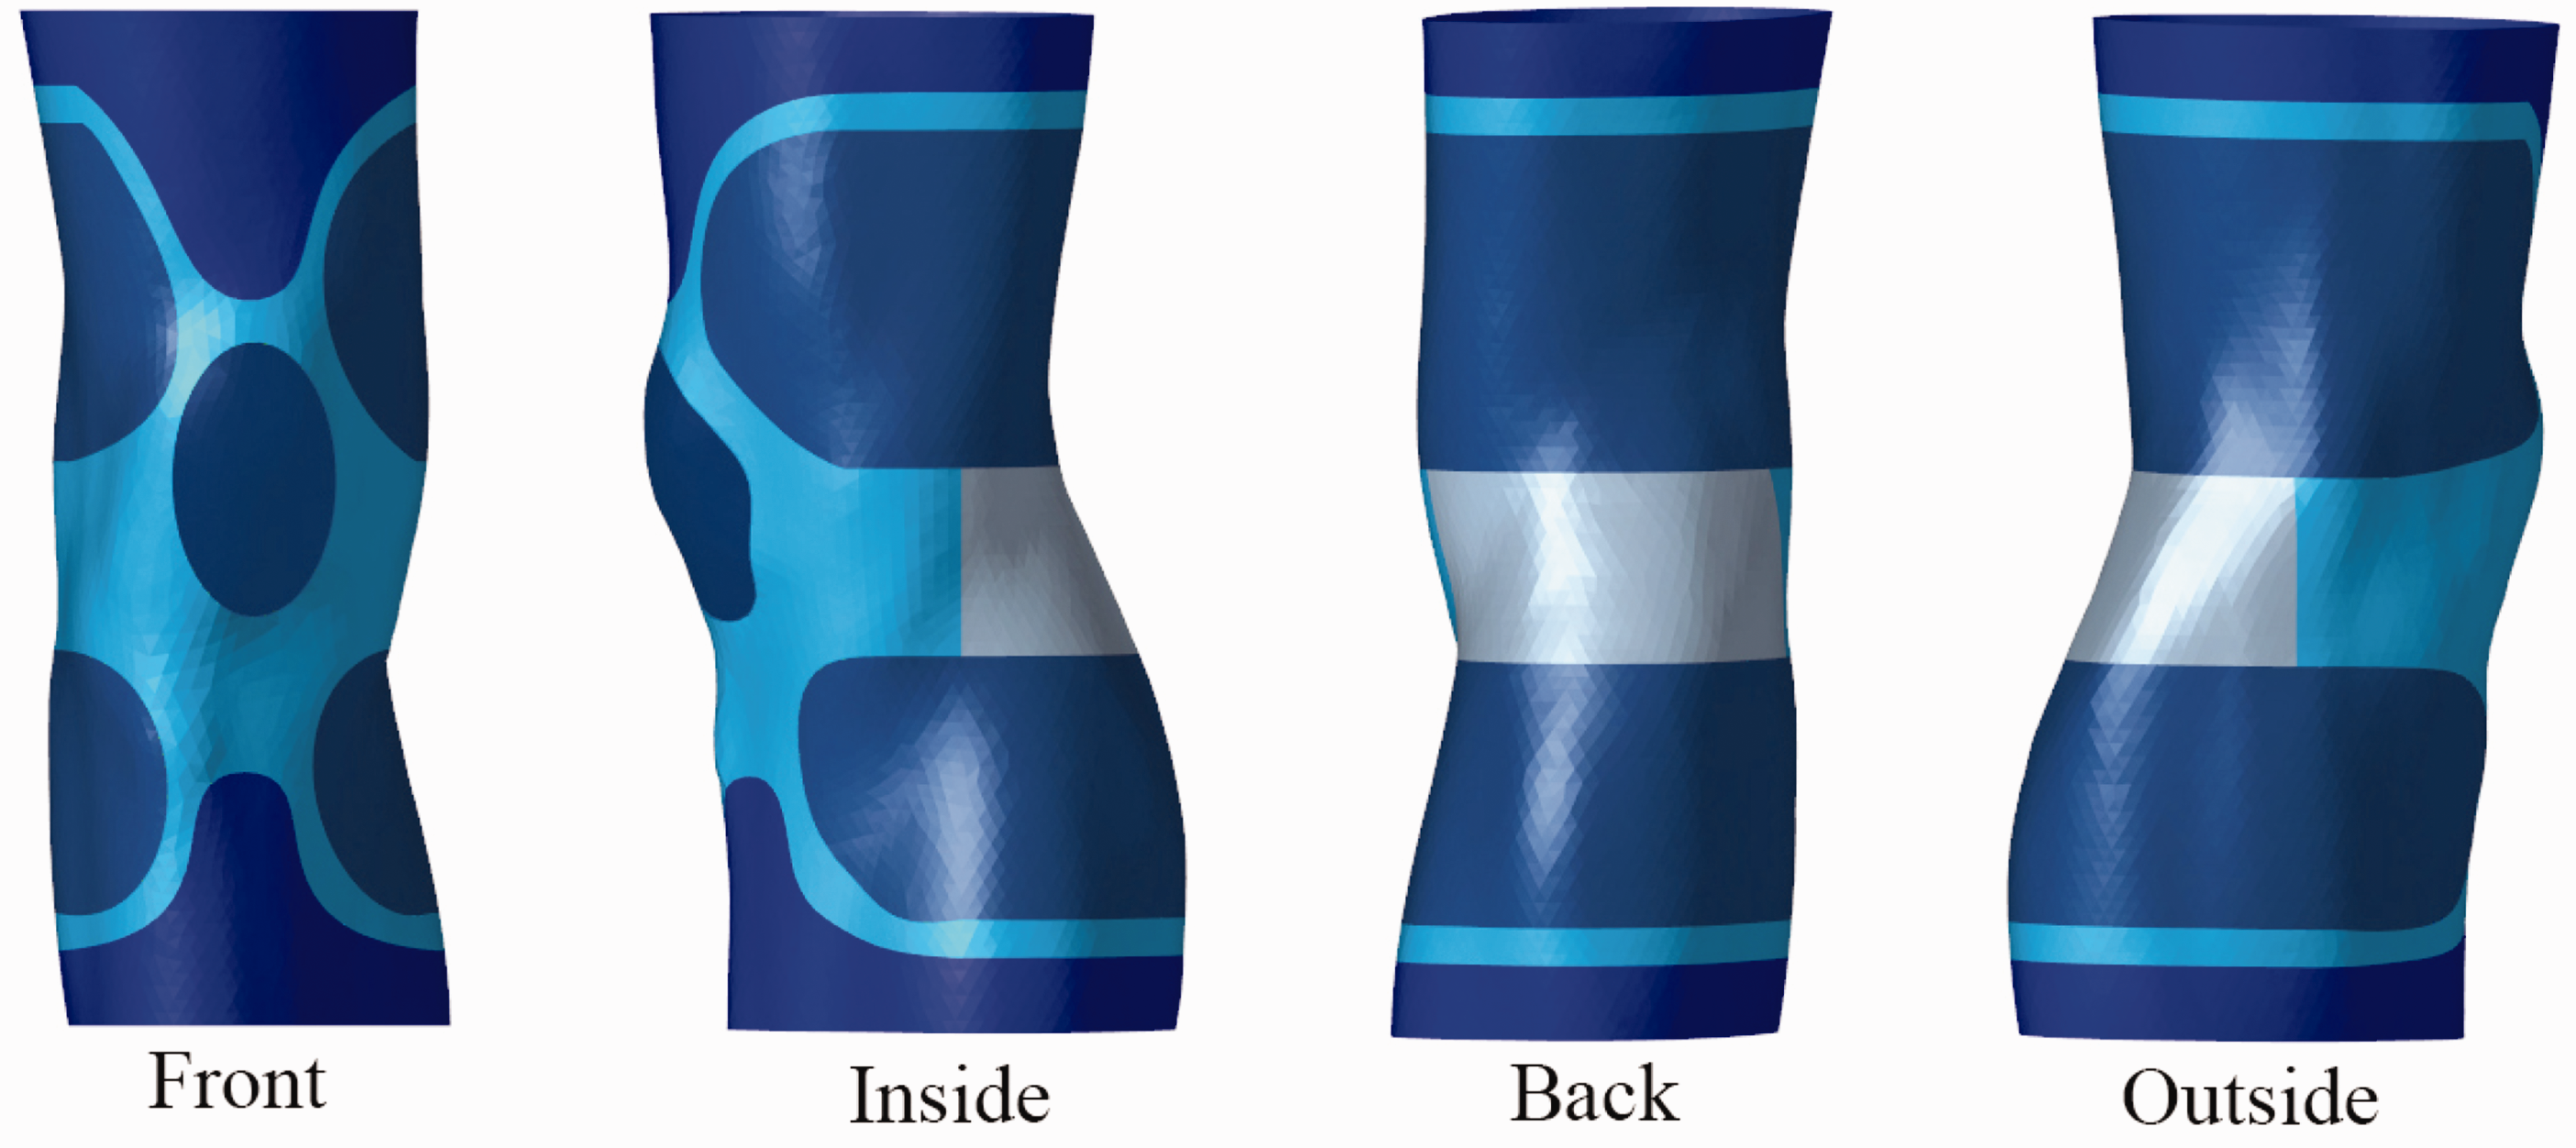
On the cross-section of human lower limbs, Figure 15 shows the stress cloud image of soft tissue after FE analysis of knee sleeve S1. It can be seen from the figure that the anterior stress in almost every cross-section is greater than the posterior, medial, and lateral stresses. However, affected by various factors such as the physiological characteristics of the knee joint and the structure of the knee sleeve, the posterior, medial, and lateral stress levels cannot be sorted. For example, in section K1, the cloud map color on both sides is blue, and the back side is green, indicating that the pressure value on the back side is greater than that on both sides. Nevertheless, in section K2, the stress values of both sides and rear sides are mainly blue, indicating that the stress magnitude is not very different. Therefore, when designing knee sleeves, attention should be paid to relieving the peak stress in the front and side of the human lower limbs, so that the stress is distributed evenly.
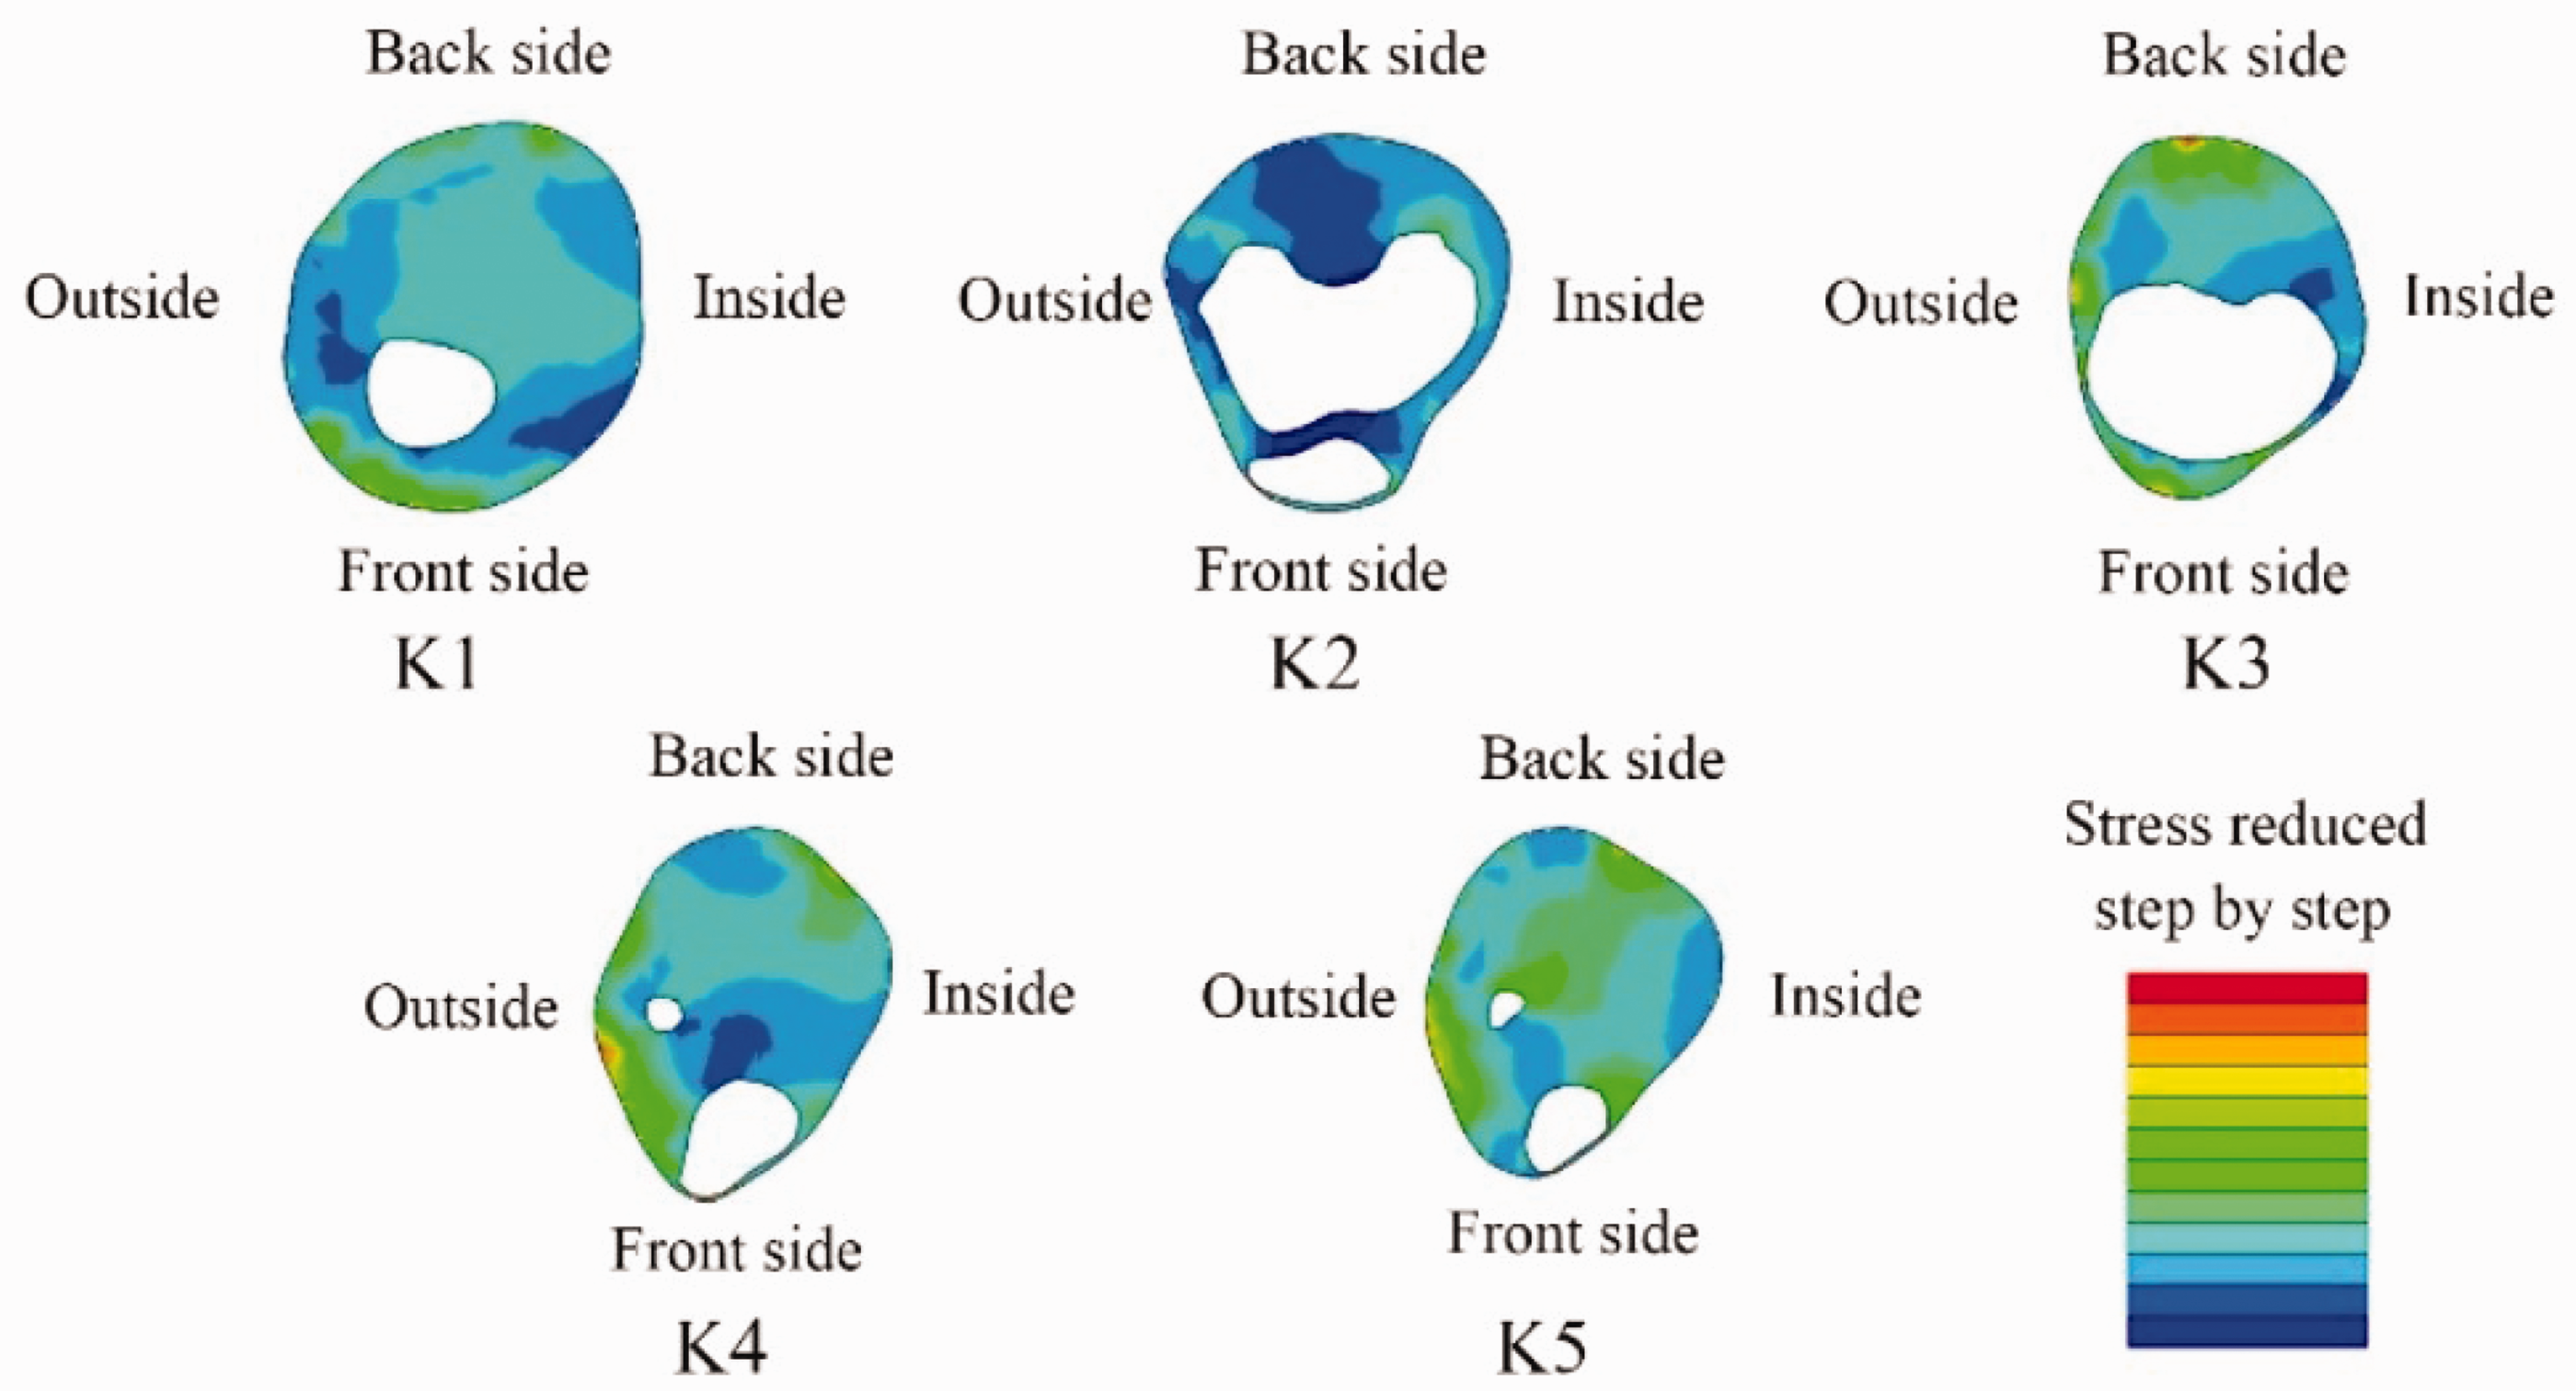
Soft tissue cross-section stress cloud map of knee sleeve S1.
Based on the results of previous studies, we calculated the zonal pressure design of knee sleeves. Figure 16 shows the pressure partition design of the knee sleeve. The darker the color, the greater the pressure. It is divided into four pressure levels.
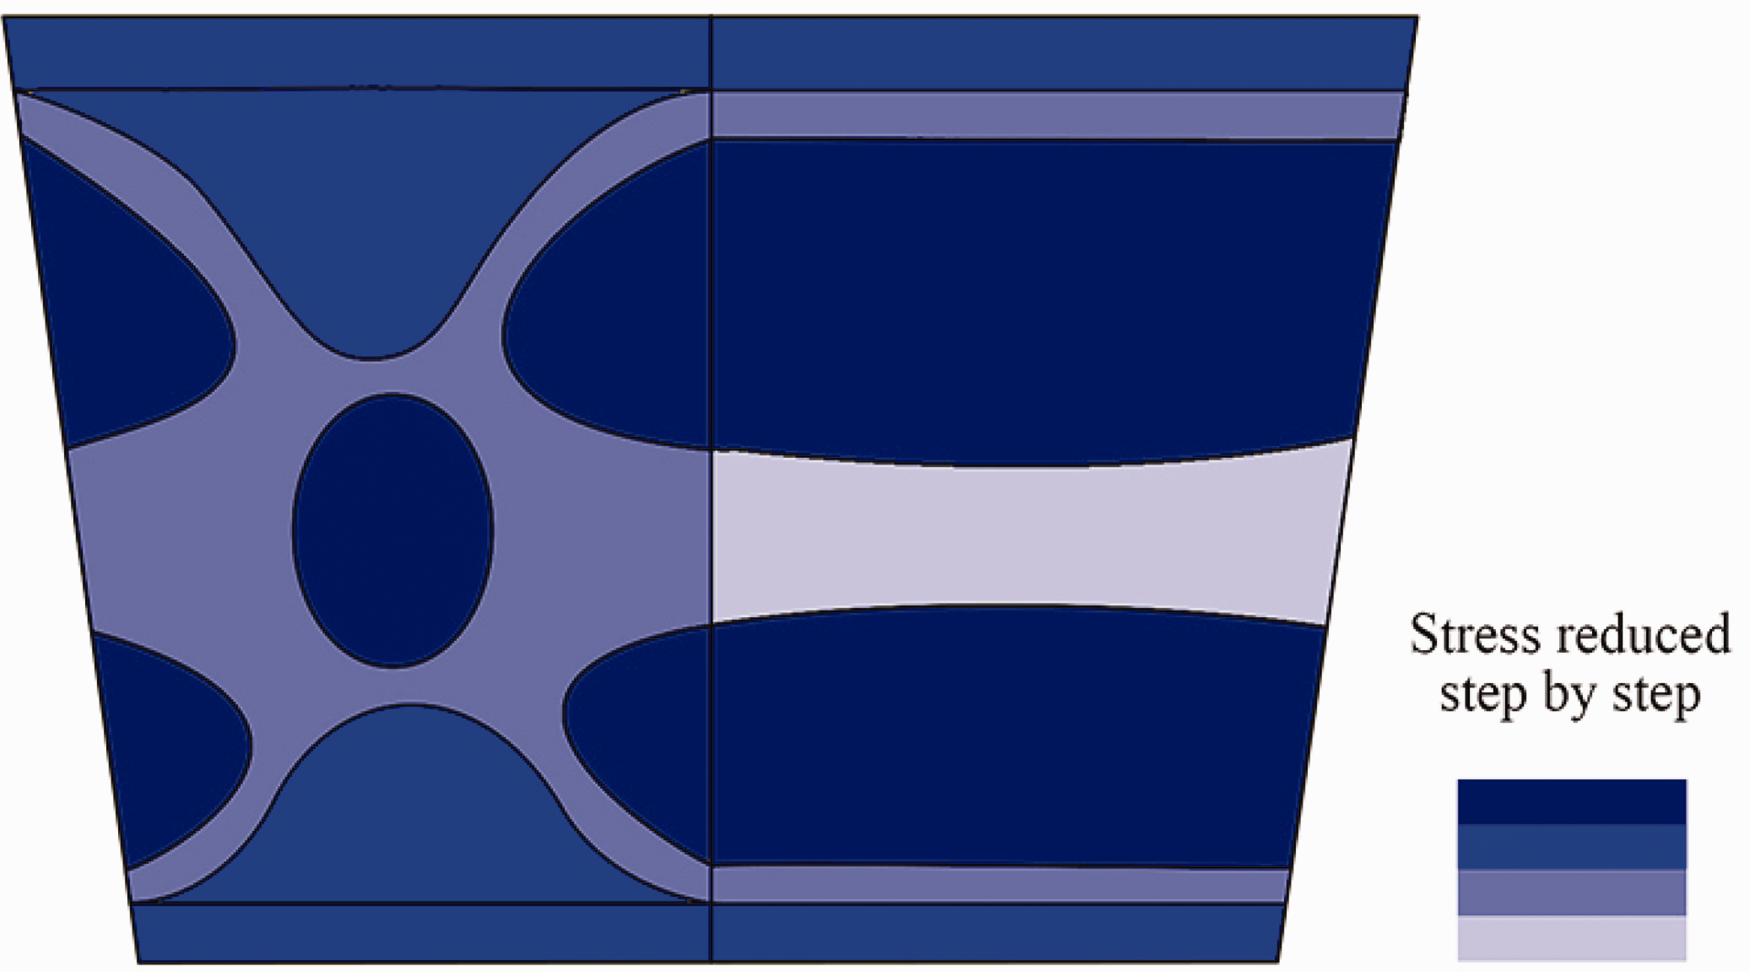
Design of knee sleeve pressure zones.
Size specifications and fabric selection of knee sleeves
Size specifications
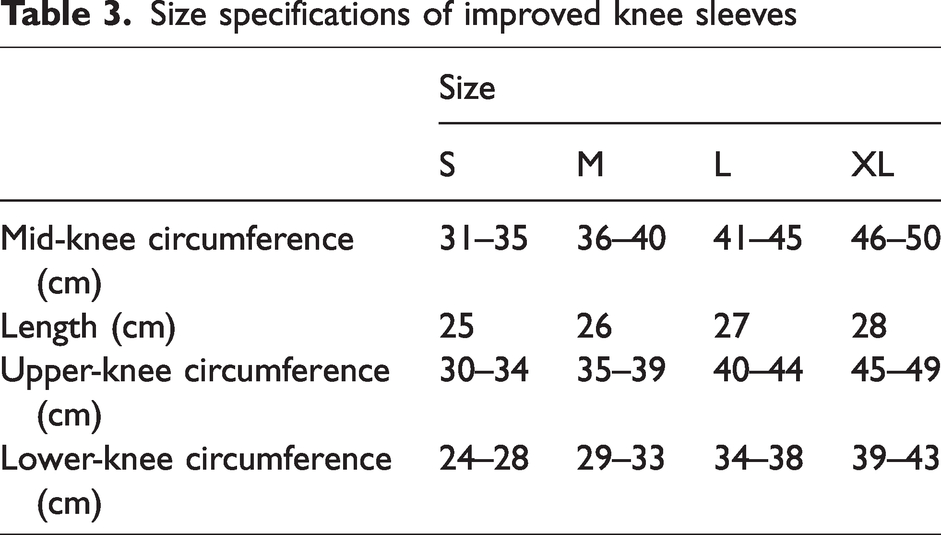
The size of the closed knee sleeve mainly includes the circumference of the big calf and the knee circumference of the patella. In the division of size, the experimental knee sleeves S1 and S3 are divided into international sizes, divided by inch as a unit, differentiated by numbers, and classified in more detail. However, there are some differences with the body characteristics of the Chinese people. The experimental samples S2, S4, and S5 are Li Ning brands, and their sizes and division methods are more in line with the selection habits and body type standards of Chinese people. Therefore, this study chose Li Ning’s size specification 35 as the basis for structural design. We referred to the specifications of knee sleeves in Table 3, and took size M as an example to draw the design drawing of knee sleeves.
Size specifications of improved knee sleeves
Fabric selection
Fabric selection is an important design point in functional clothing design. In addition, considering the functionality of the use process, it is also necessary to comprehensively consider the indicators of the fabric. Through the heat and humidity transfer of the knee sleeve fabric and other functions, the human body can maintain a comfortable and satisfactory performance in the “environment–knee sleeve–human body” system. 36 Wearing a closed knee sleeve is mostly skin wear, mainly knitted fabrics, relying on the elasticity of the fabric itself to adjust. According to the zoning design characteristics of each part and the fabric of knee sleeve S1, the appropriate fabric is selected for the optimized knee sleeves to achieve the purpose of different parts under different pressures.
The design of knee sleeves is shown in Figure 17, and the demand of each area and the compatibility of fabrics are presented in Table 4.
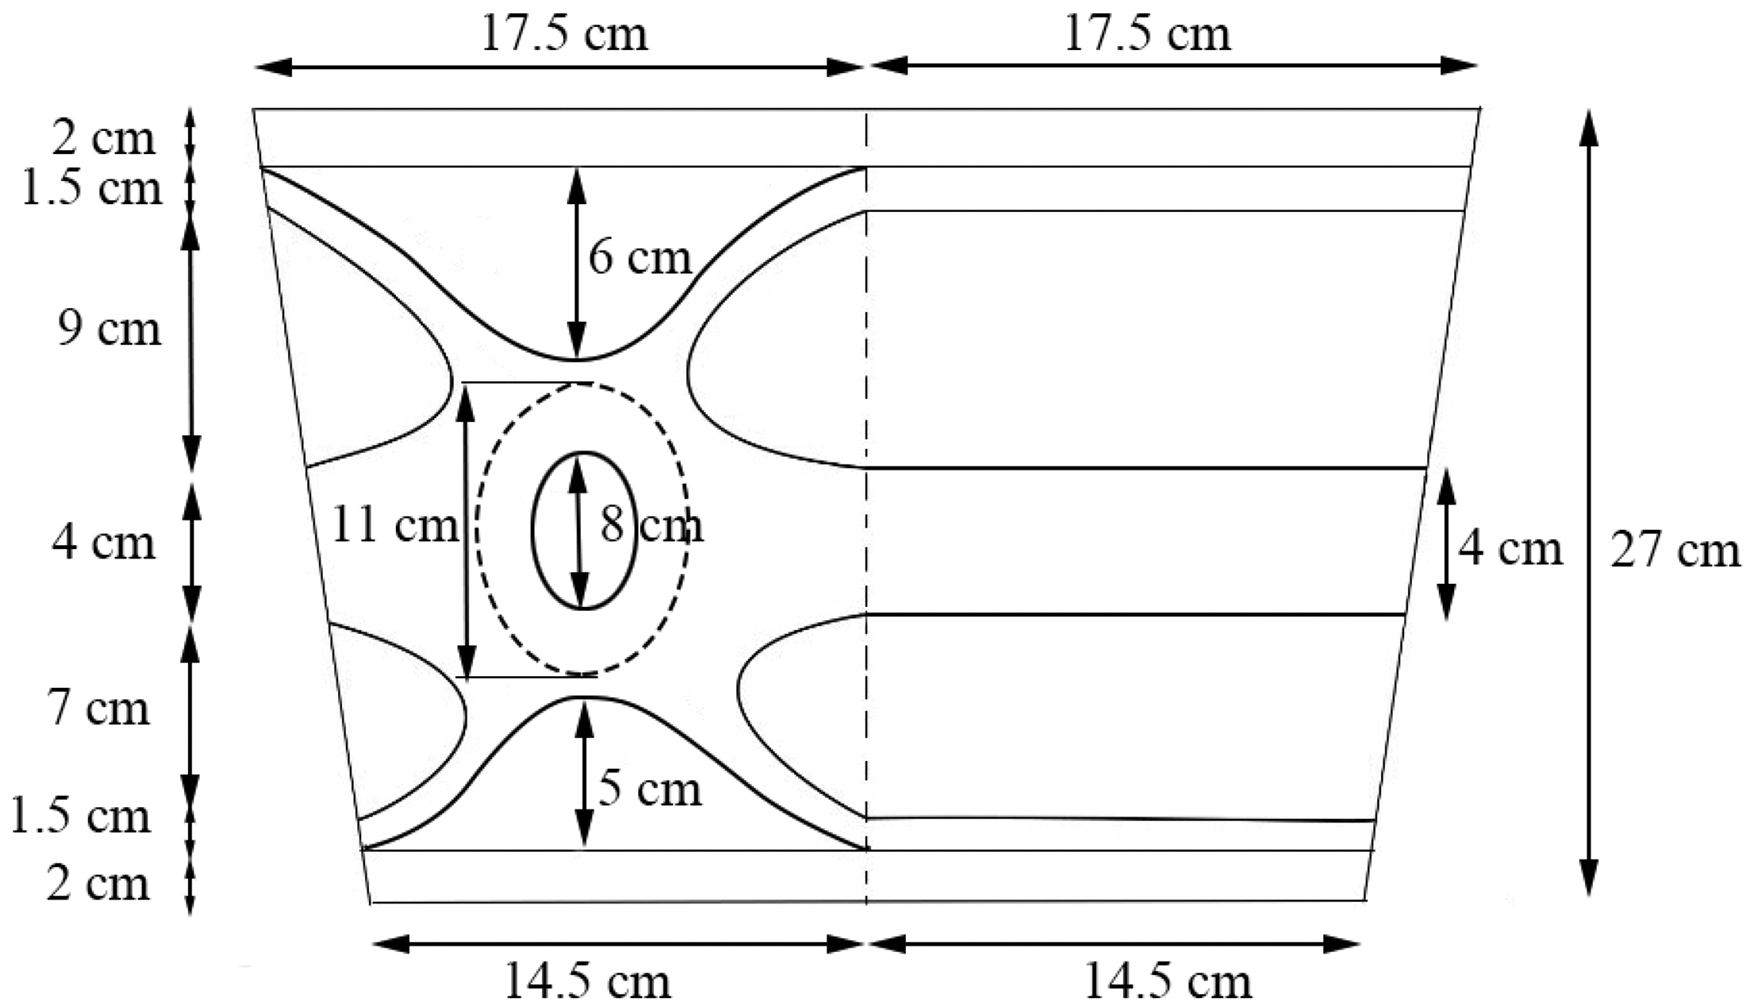
The structure of the improved knee sleeve.
Pressure zoning and fabric compatibility
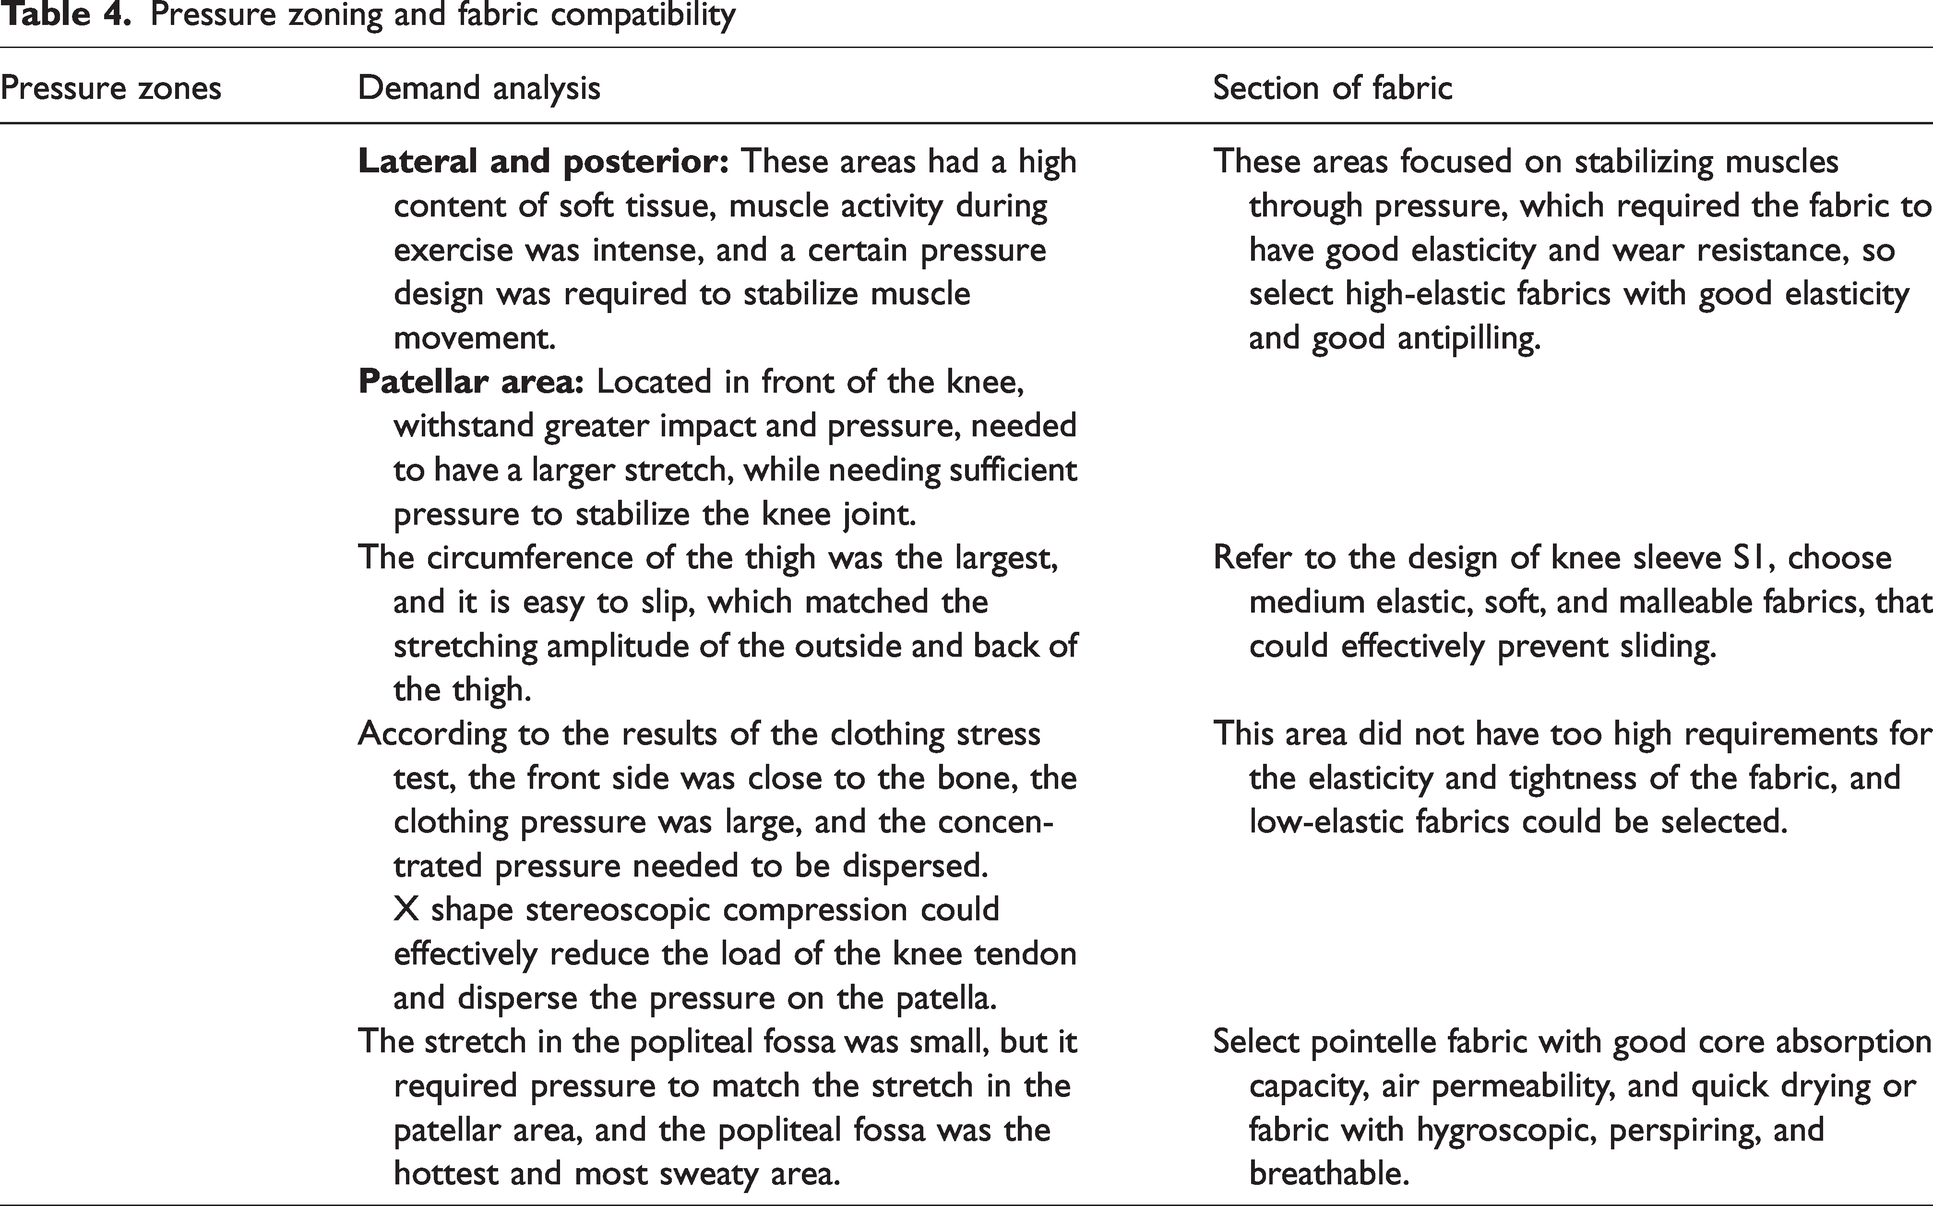
Functional structure design of knee sleeves
The structural design of knee sleeves is mainly based on style design and functional structure design, and the style design of knee sleeves is mainly divided into open knee sleeves and closed knee sleeves. The functional structure is designed with spring supports, patellar sleeves, and multiple ways of pressurization (surround pressurization, bidirectional band pressurization, and gradient partial pressure). According to the FE simulation of knee sleeves and the objective pressure test of clothing, it can be seen that knee sleeve S4 did not have any additional functional design, the pressure value of clothing fluctuates sharply, and the overall pressure value was too large. The overall pressure value of sample S2 was high. The pressure values at the left and right interface of open samples S3 and S5 were low.
This study comprehensively considered the performance of five experimental knee sleeves and improved the design on the basis of sleeve S1, which had the best overall performance. The design elements are reflected in the following aspects.
The use of upgraded and thickened silicone pads for knee sleeves could stabilize the knee joint and fix the patella. It was designed to wrap the knee in a 3D ring, which could better fit the surface around the knee joint, and could play a certain buffer effect on the pressure peak. Fixed the adjustable elastic adhesive bandage and strap Velcro on the outside of the knee sleeve (sewing process could be used), and pasted the fixed strap after the strap is adjusted. Elastic bandages could not only adjust the pressure by themselves but also improved the fit and flexibility of wearing, which had significant advantages for sports people with habitual sprains. On both the inside and outside of the knee joint increased four silica scales spring support. The spring accumulated force when the knee was bent and released force when the knee was raised, which could help the user reduce movement consumption. The choice of four silicone fish scale spring support was because compared with the steel plate, the spring support bar was softer, which could better adapt to different leg forms, and was easier to fit the human body. The silicone coated spring could also be washed, preventing rust and improving durability. Nonslip silicone strips were used on the upper and lower ends of knee sleeves. The size of a knitted knee sleeve mainly depended on the elasticity of the fabric itself to adjust. Due to the differences between individuals, there would inevitably be slippage in the process of wearing knee sleeves. Therefore, in the knee on both ends up and down the antiskid article silica gel, could effectively prevent the knee in the decline in the process of movement. It should be noted that considering the comfort of the human body, the area of the silicone strip should not be too large.
The effect diagram of the improved knee sleeve is shown in Figure 18.
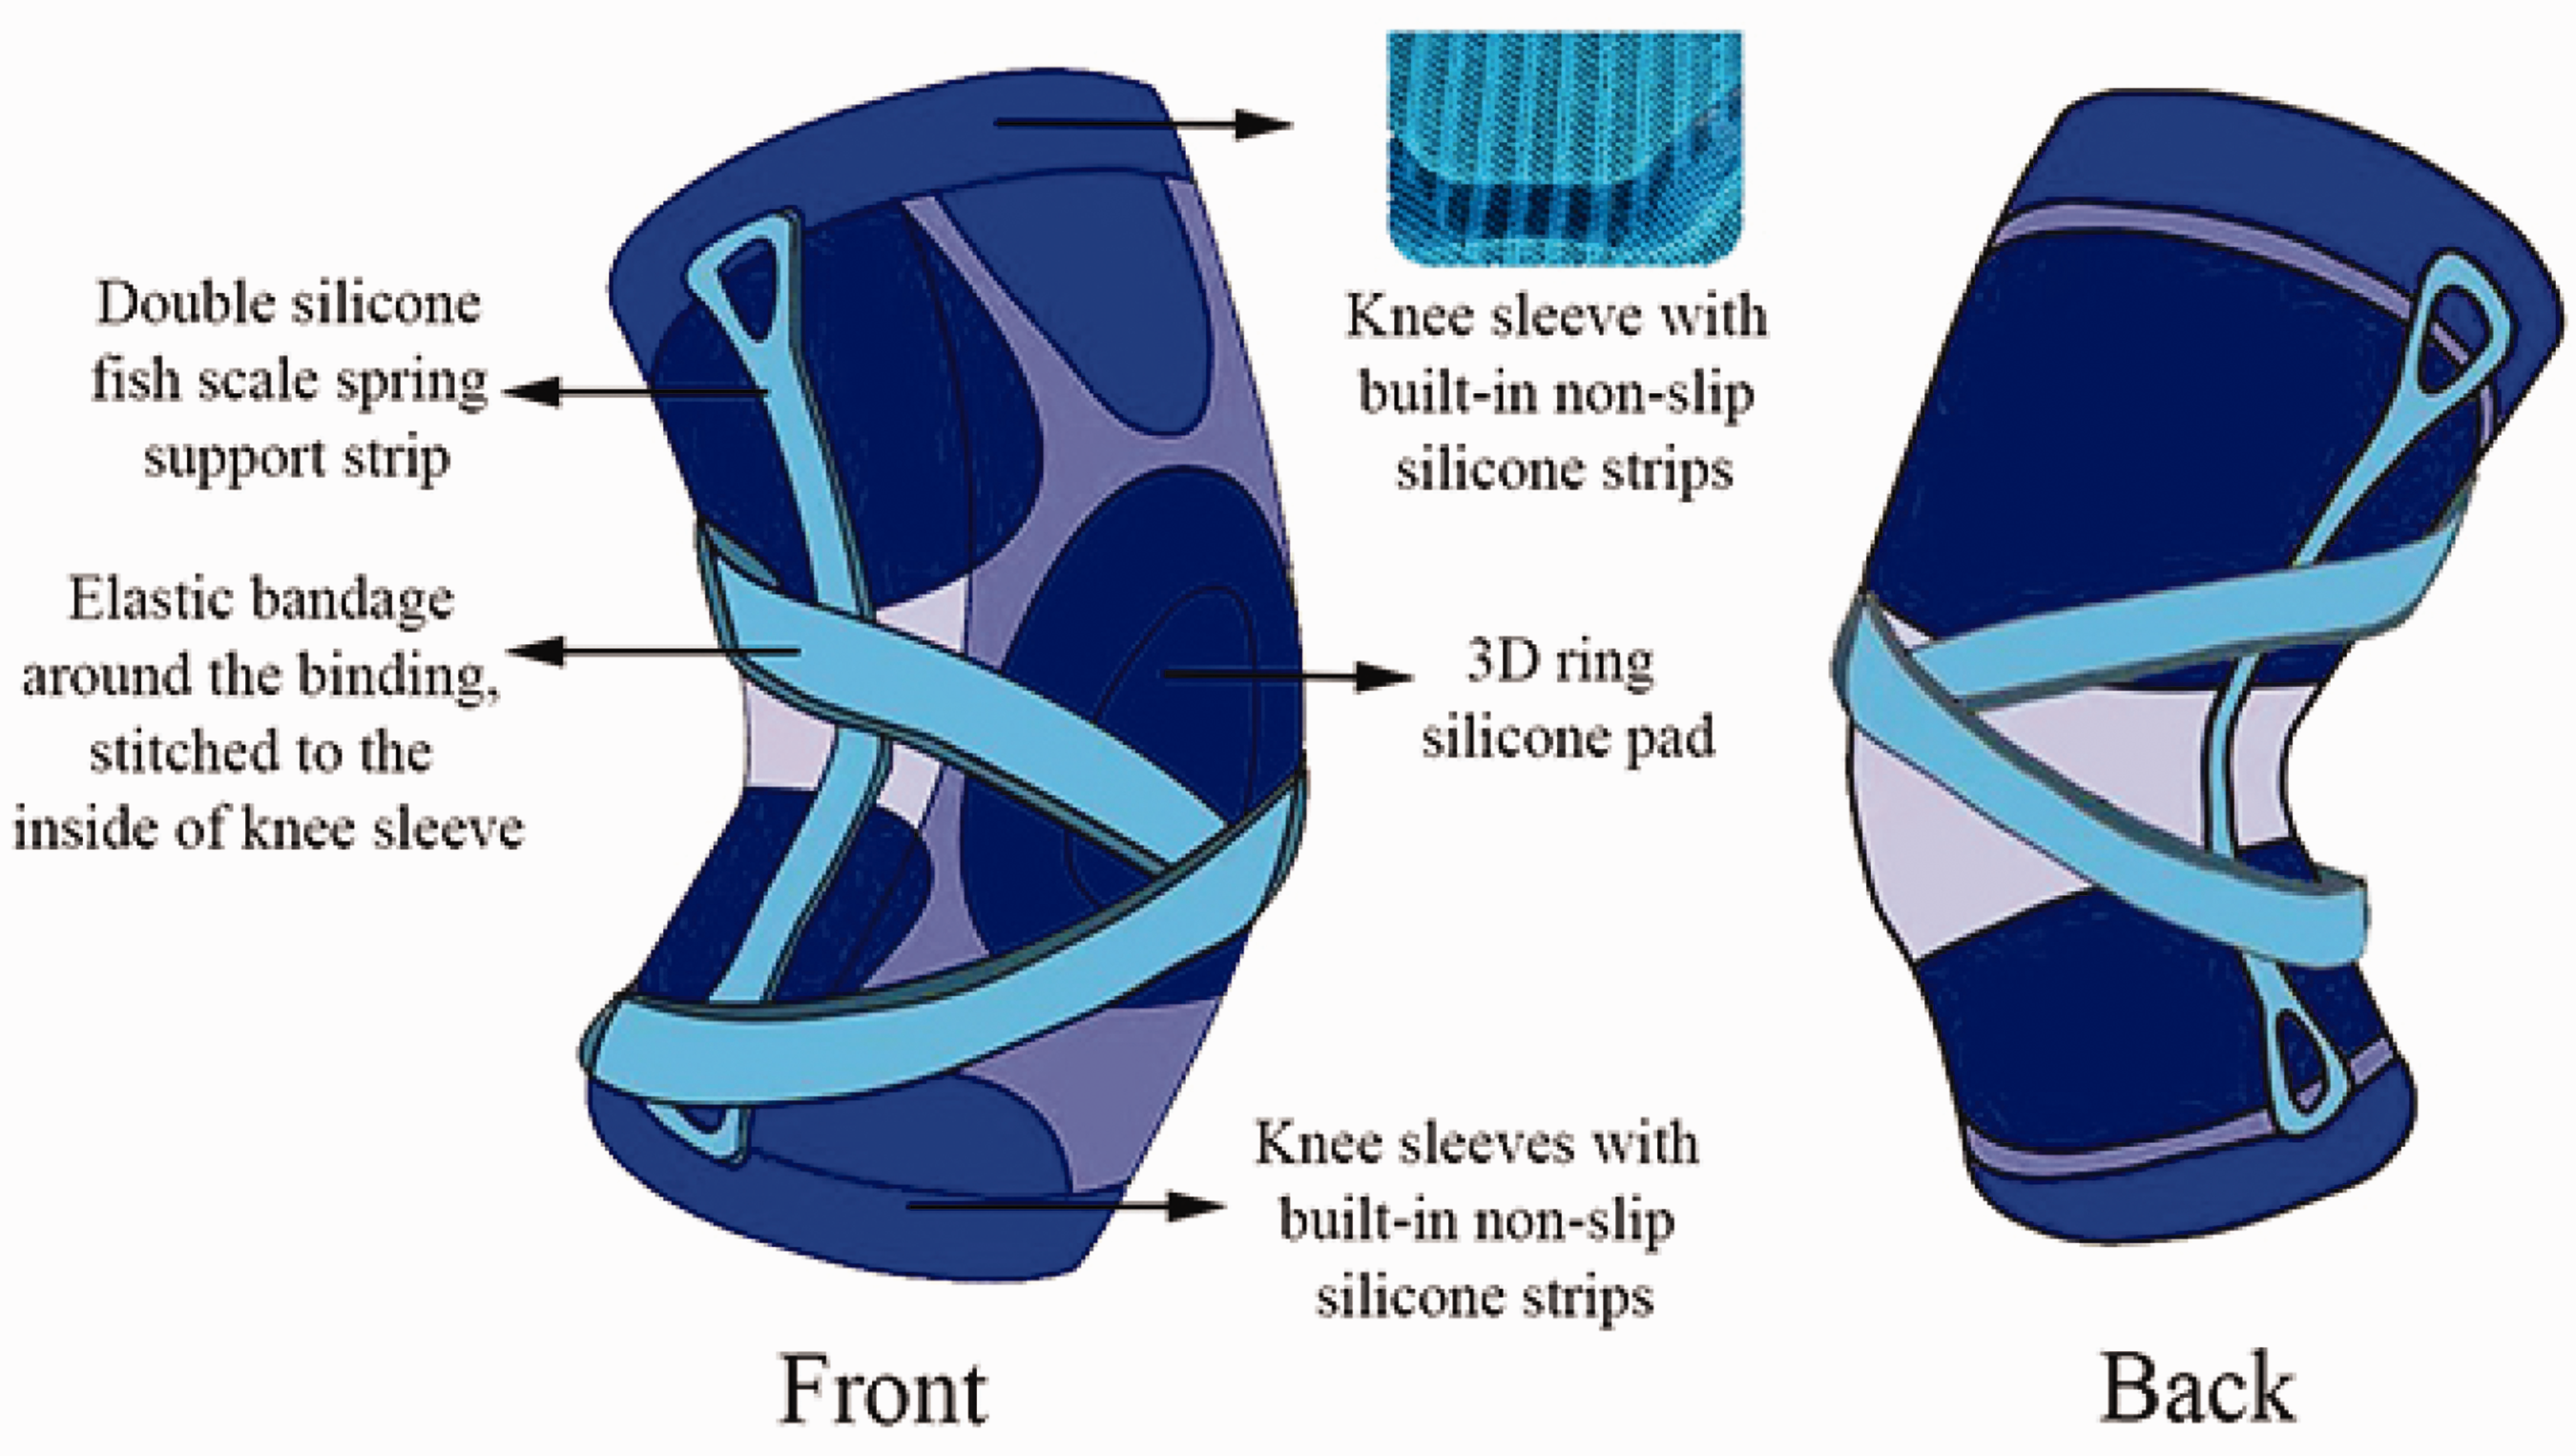
The effect diagram of the improved knee sleeve.
Performance evaluation of improved knee sleeves
Objective test evaluation of pressure
According to the compatibility of each part, the appropriate fabric was selected for the production of the improved knee sleeve, as shown in Figure 19.
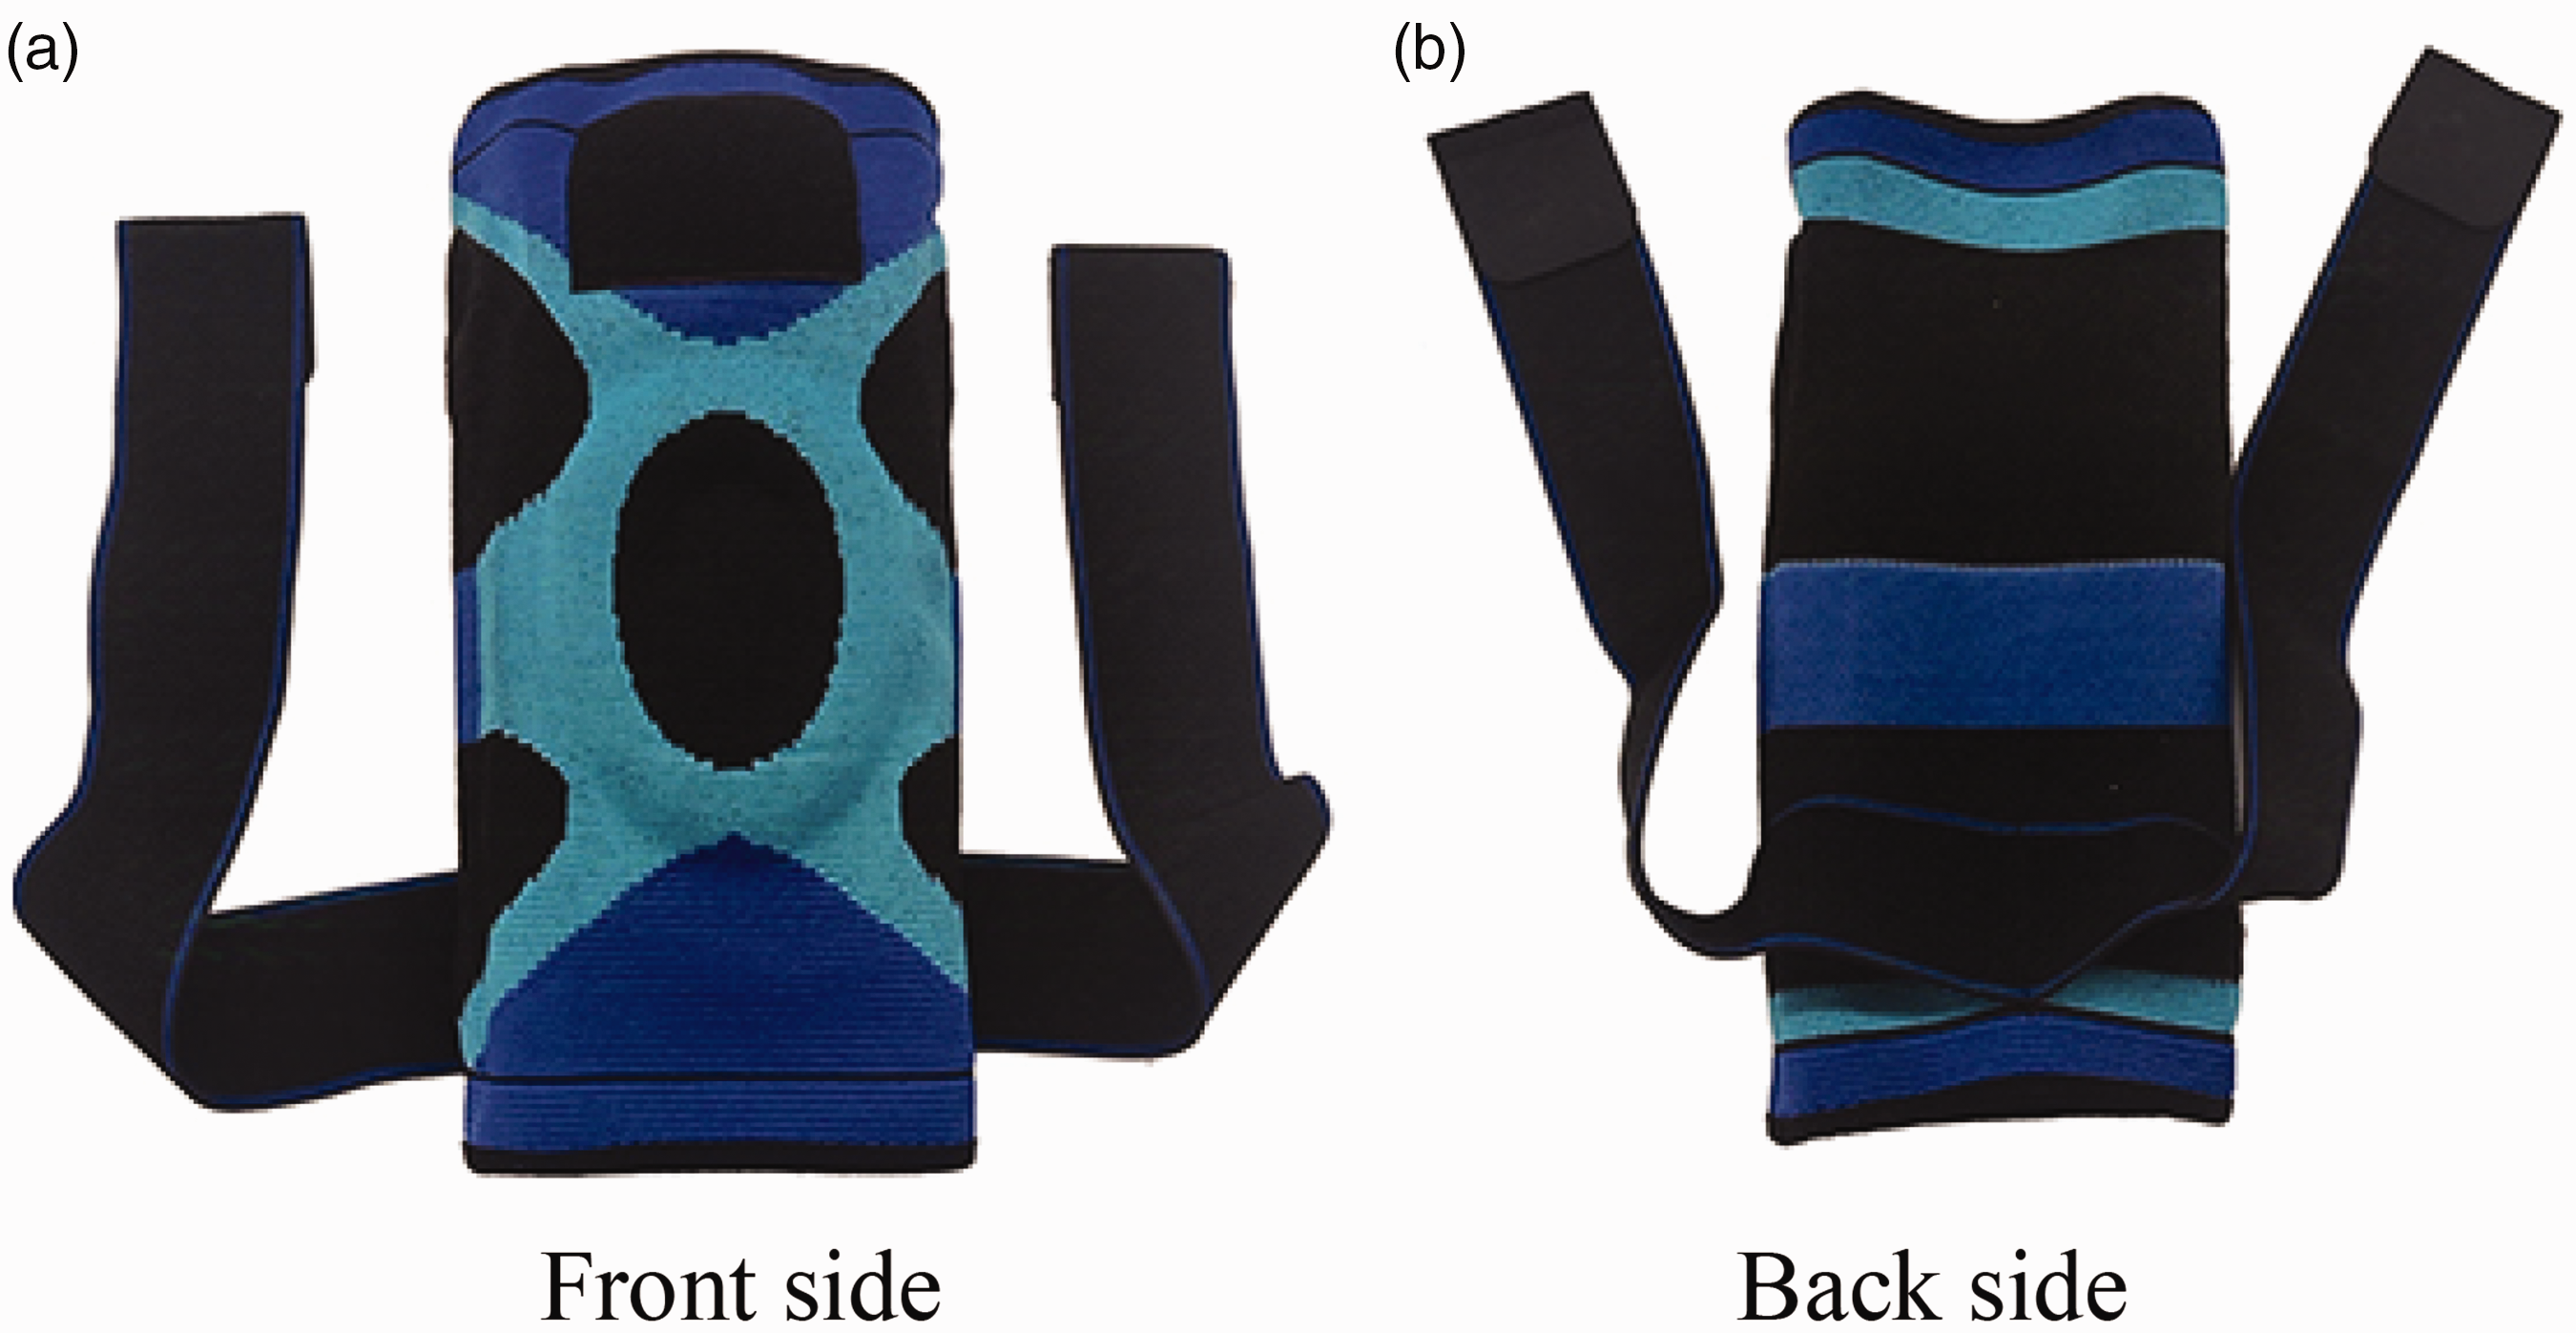
Physical picture of the improved knee sleeve: (a) front side and (b) back side.
In order to evaluate the use effect of the improved knee sleeves, the previous subjects were selected to wear the improved knee sleeves for another clothing stress test. The binding design was to provide the user with the choice to adjust the pressure, if the binding would cause the overall pressure value of the clothing to be too high. Thus, in this test, the subject did not wear the binding. An air-bag pressure tester was used in the experiment, and the pressure point selection method of the knee sleeve was consistent with that mentioned previously. After the test, the stress test points were merged using the previous method. The modified knee sleeve was optimized and improved on the basis of sample S1. Therefore, the clothing pressure value after wearing the knee sleeve S1 was used as the control group in this study. Figure 20 shows the comparison of the objective pressure values of the two knee sleeves.
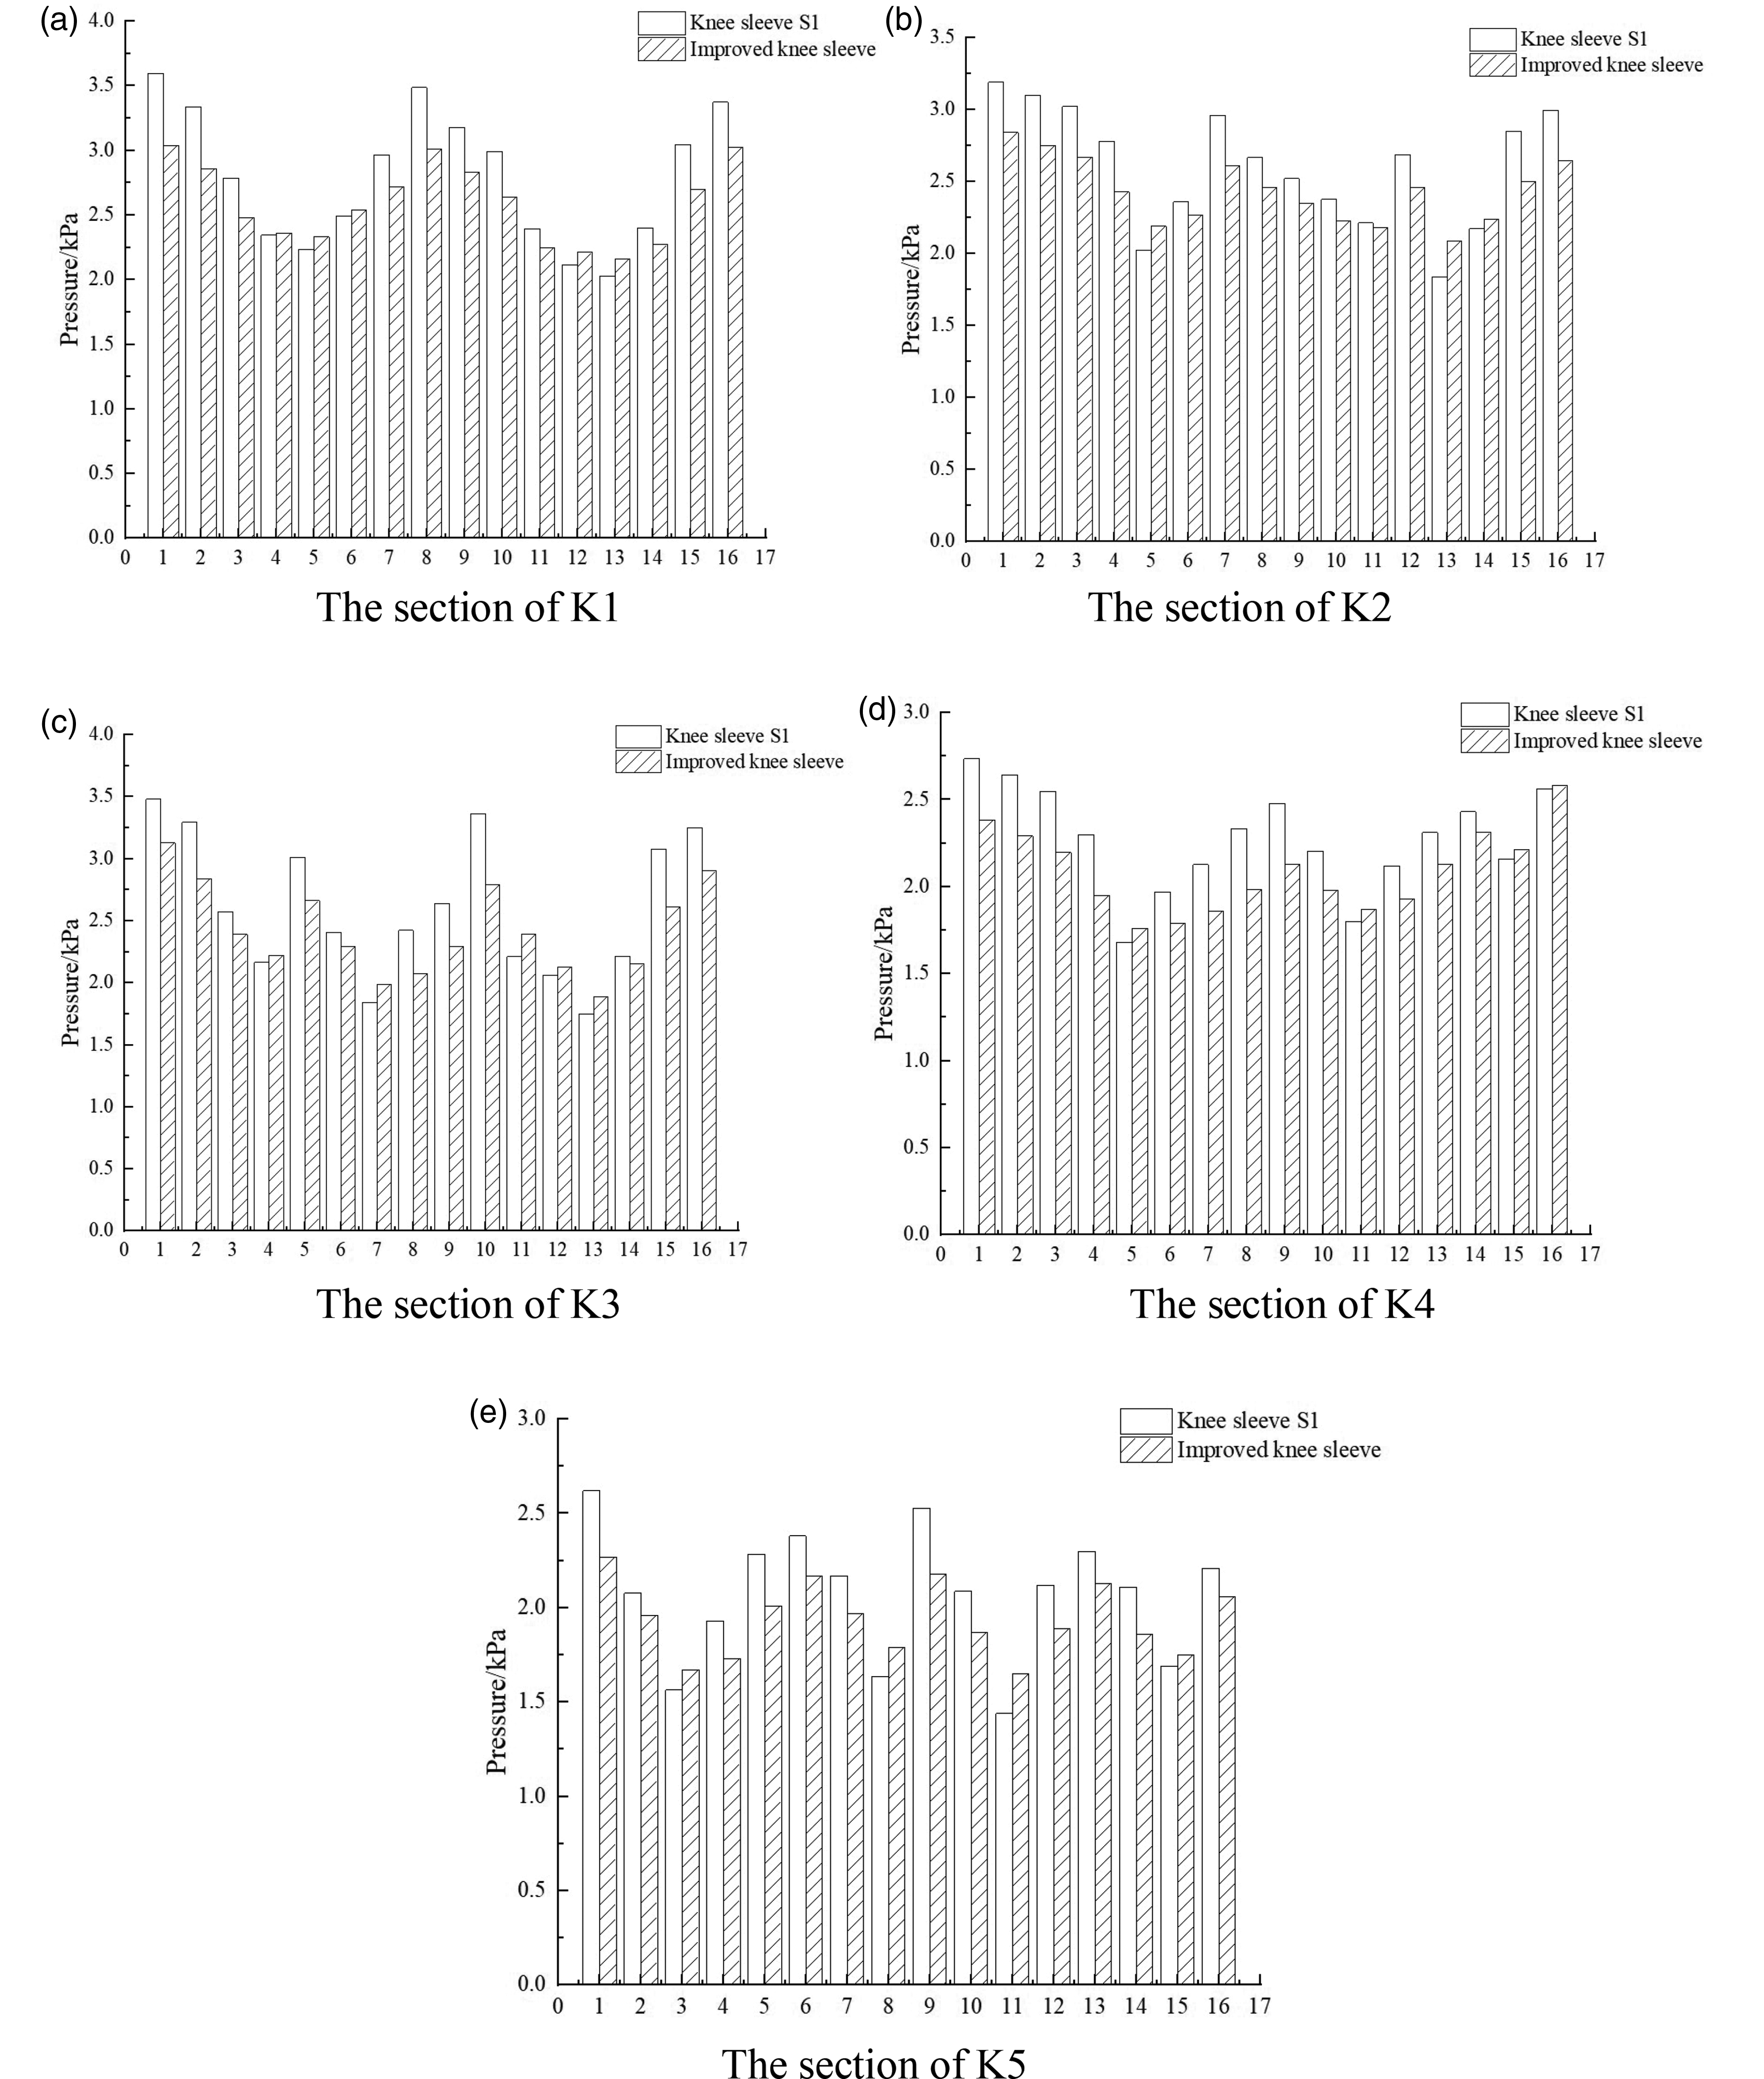
Comparison of clothing pressure value between sample S1 and the improved knee sleeve: (a) section of K1; (b) section of K2; (c) section of K3; (d) section of K4 and (e) section of K5.
As can be seen in Figure 20, the improved knee sleeve meets the pressure standard of the first-class pressure socks, and its pressure is between 1.33 and 3.33 kPa. The pressure in section K2 is greater than in the other areas, and the pressure in the calf area is lower than in the thigh area. The maximum pressure occurs at the anterior tibial protrusion (point 1 of section K3) and the minimum pressure occurs at the lateral leg (point 11 of section K5). The girth of the lower leg decreases upward, while the thigh enlarges from the bottom up. The change in the girth of the leg will affect the pressure. These laws are consistent with the conclusions of sample S1, indicating that the improved knee sleeve is basically in line with the law of human body pressure.
In order to more intuitively show the pressure stability of the improved knee sleeve, the pressure change rate of adjacent points in each section was calculated. Table 5 lists the pressure change rate between the pressure values of each adjacent node in the improved knee sleeve.
Rate of pressure change for improved knee sleeves
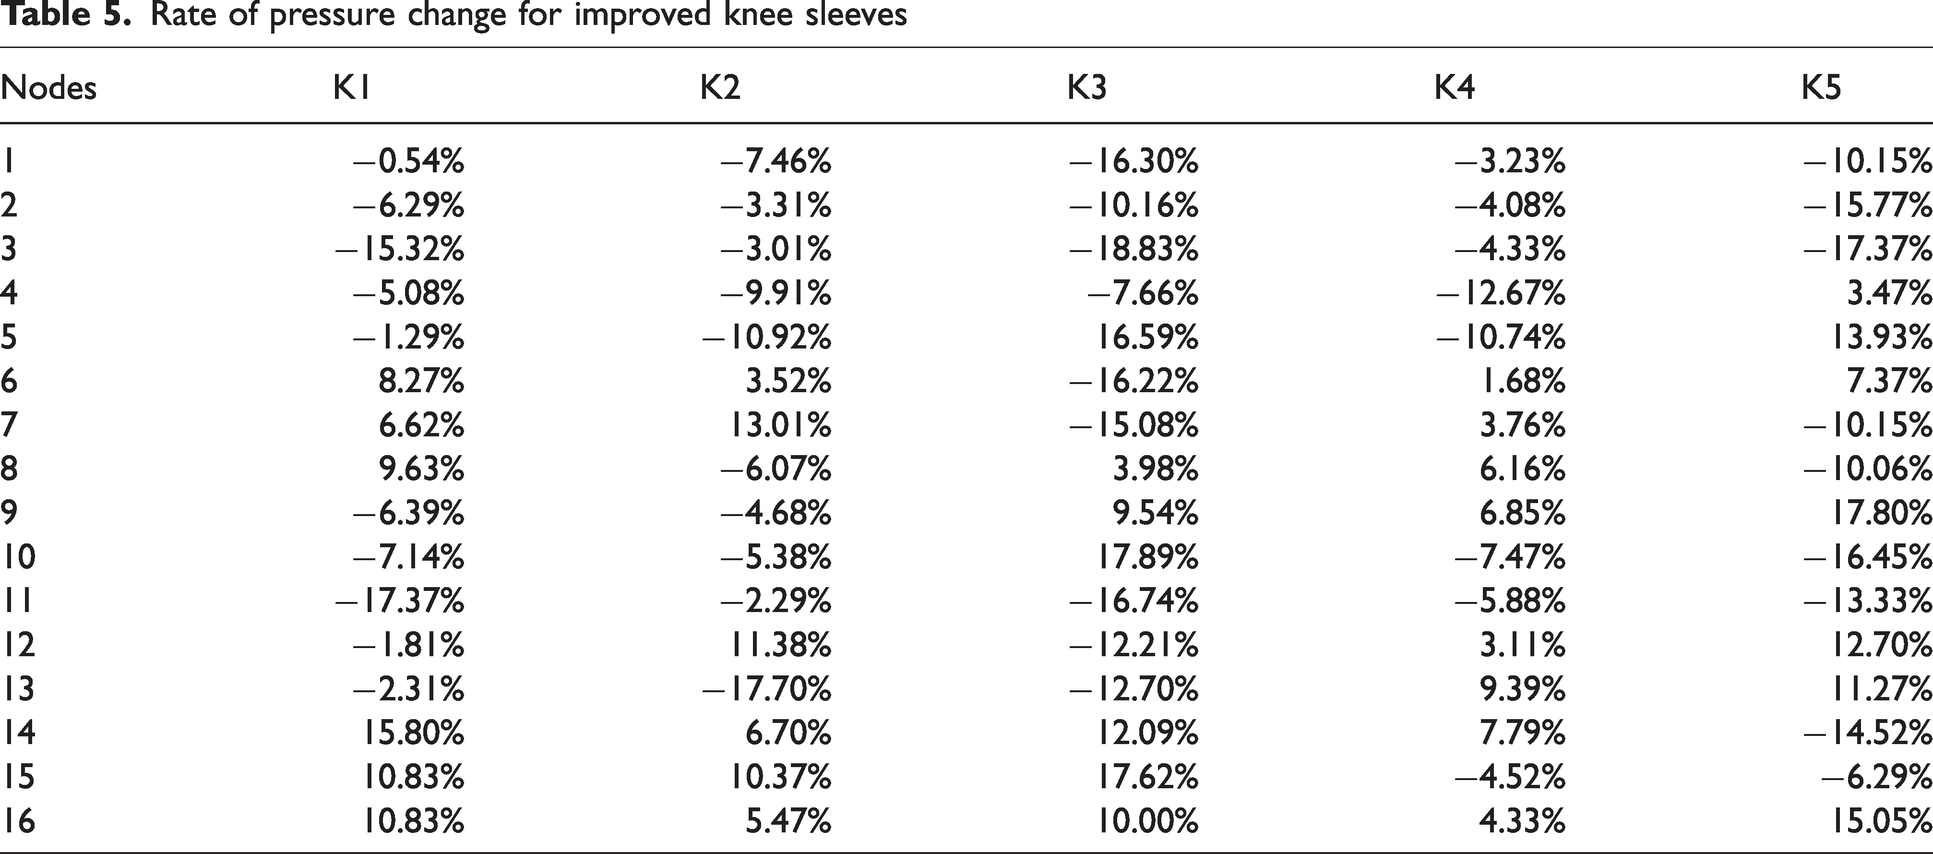
As can be seen from Table 5, the pressure change rate of the improved knee sleeve is less than 20%, indicating that the optimized knee sleeve designed with a zoning structure has a small range of pressure change on the human body and has good pressure stability. The optimized pressure distribution is more uniform, and the optimized design effectively improves the pressure comfort of the knee sleeve.
FE simulation verification
In order to verify the pressure comfort of the human body wearing the modified knee sleeve more accurately, the FE model of the improved knee sleeve was established and simulated. In the process of model construction, it is difficult to accurately simulate the interaction between the structural design of the patella pad, the strap, and the support strip (such as the fastening way of the strap and the support strip, and the fit degree of the patella pad and the knee joint) due to the complex issues such as nonlinear materials and contact mechanics. Meanwhile, considering the particularity of these component materials, it is difficult to accurately characterize the complex mechanical properties of these components only by the elastic modulus and Poisson’s ratio. Thus, it cannot accurately simulate the functional role of these components in practical applications. Based on this, only the FE model based on pressure zoning was established in this study, as shown in Figure 21.
FE model of the improved knee sleeve.
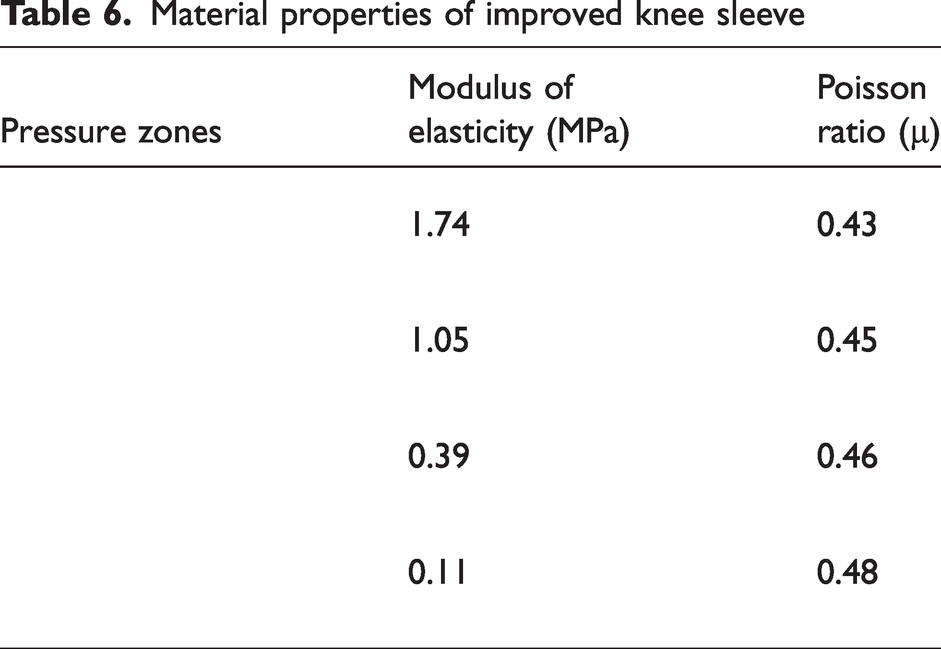
The basic process of FE analysis is the same as before, but the difference is that when assigning material, the elastic modulus and Poisson’s ratio of the fabric in the five zones need to be tested experimentally first, and then assigned separately. Table 6 lists the material properties of the five sections of fabric measured by the universal material testing machine and assigned in ABAQUS accordingly. After the pressure value obtained from the objective test of clothing pressure was input into ABAQUS as the load, the stress cloud image of the skin layer after wearing the improved knee sleeve and sample S1 was compared, as shown in Figure 22.
Material properties of improved knee sleeve
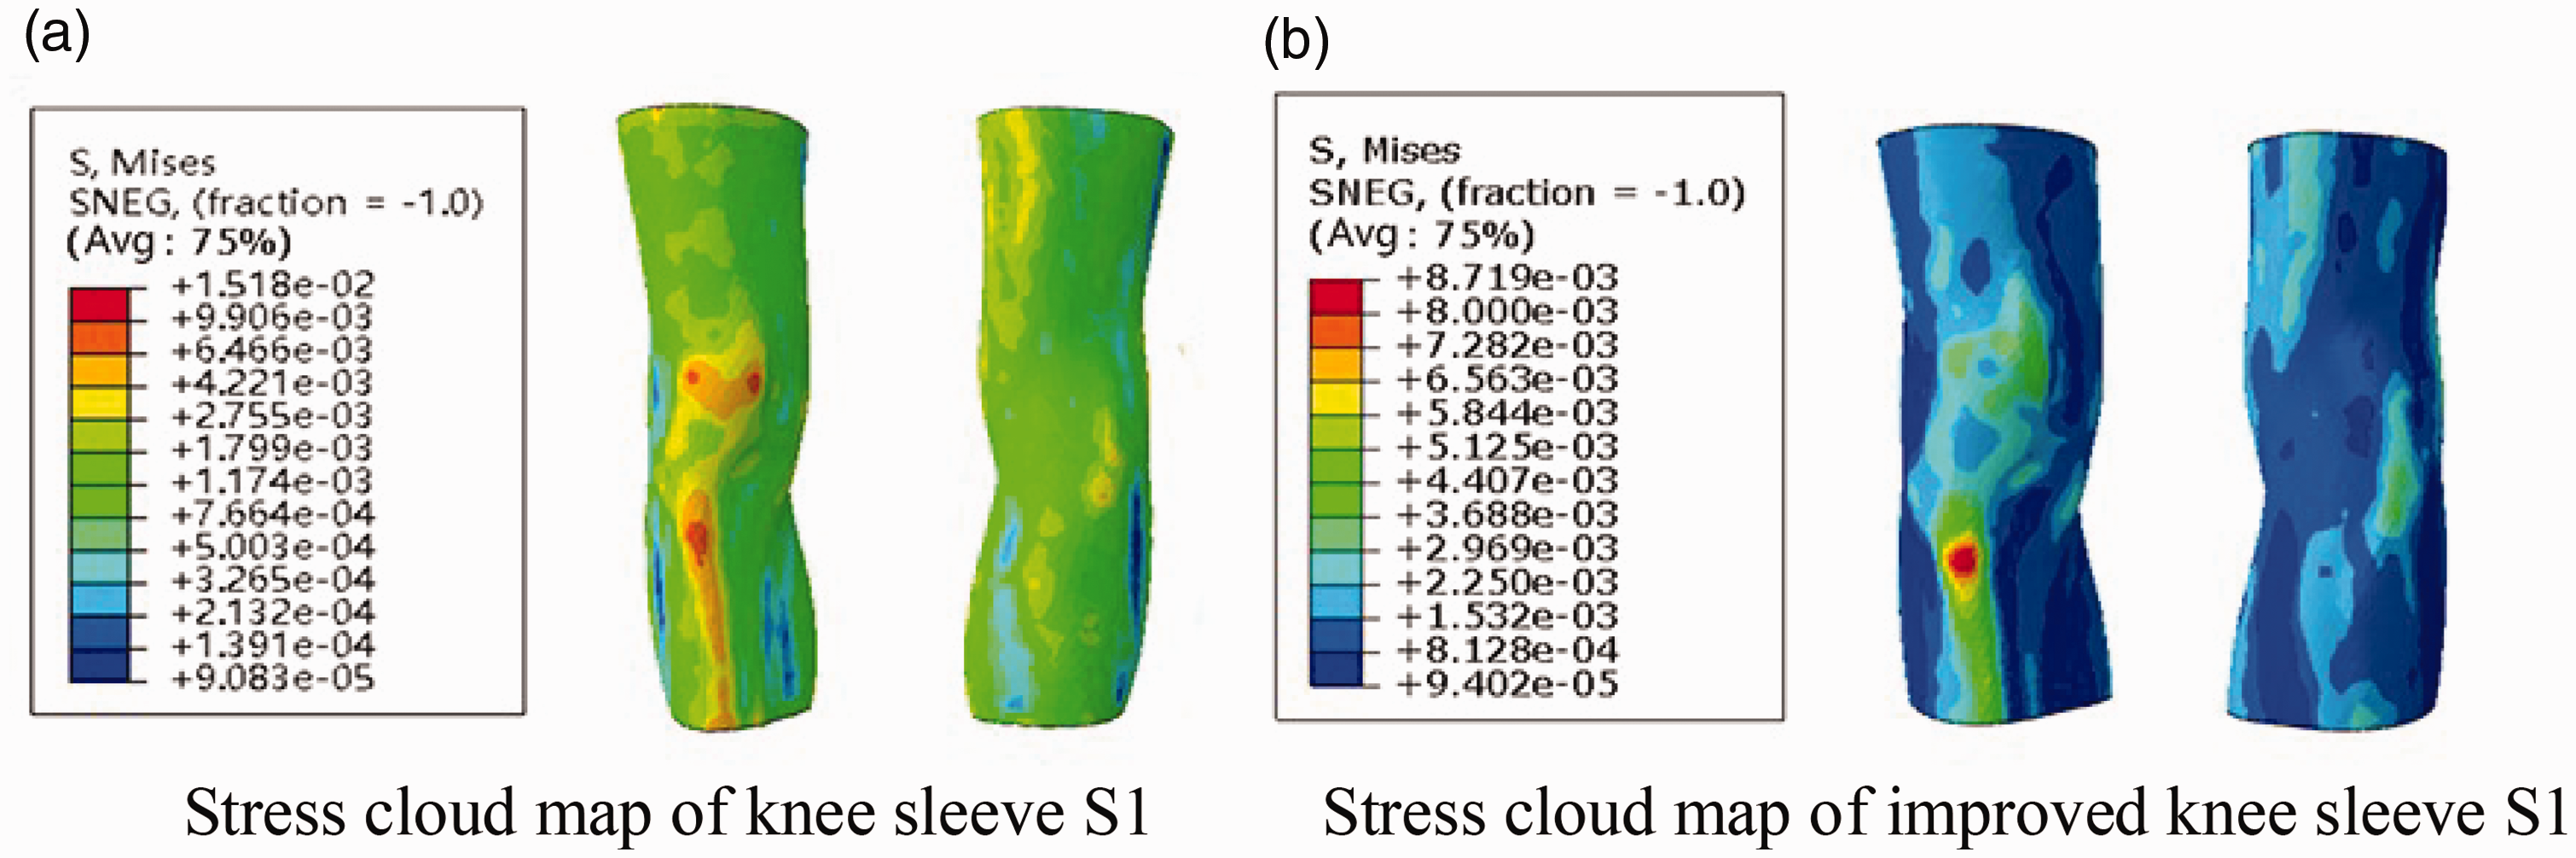
Comparison of stress cloud map between sample S1 and improved knee sleeve: (a) stress cloud map of knee sleeve S1 and (b) stress cloud map of improved knee sleeve S1.
It can be seen from the stress cloud map of the knee sleeve that the position of the stress peak of the improved knee sleeve is the same as that of the sample S1, which is the front side of the tibia. However, after the improvement, the stress value of the patella position is significantly reduced, indicating that the improved knee sleeve can effectively reduce the pressure on the knee. The position of the minimum stress value was also consistent with that of the knee sleeve S1, but the minimum value of the knee sleeve increased after the improvement. This shows that the range of the maximum and minimum values of the improved knee sleeve is reduced, the fluctuation range of the clothing pressure value is reduced, and the pressure stability is increased.
According to the study, 37 in the ideal state, when the displacement is less than 0.001 mm, it will produce pressure. Therefore, the deformation degree of the human body surface will affect the pressure comfort of clothing. Comparing the shape variables of the human body surface before and after optimization is an effective means to evaluate the performance of improved knee sleeves. The improved knee sleeve is optimized and improved on the basis of the experimental knee sleeve S1. Therefore, this study evaluated the performance of the improved knee sleeve by comparing the body surface displacement cloud image of the improved knee sleeve and the experimental knee sleeve S1 after wearing, as shown in Figure 23.
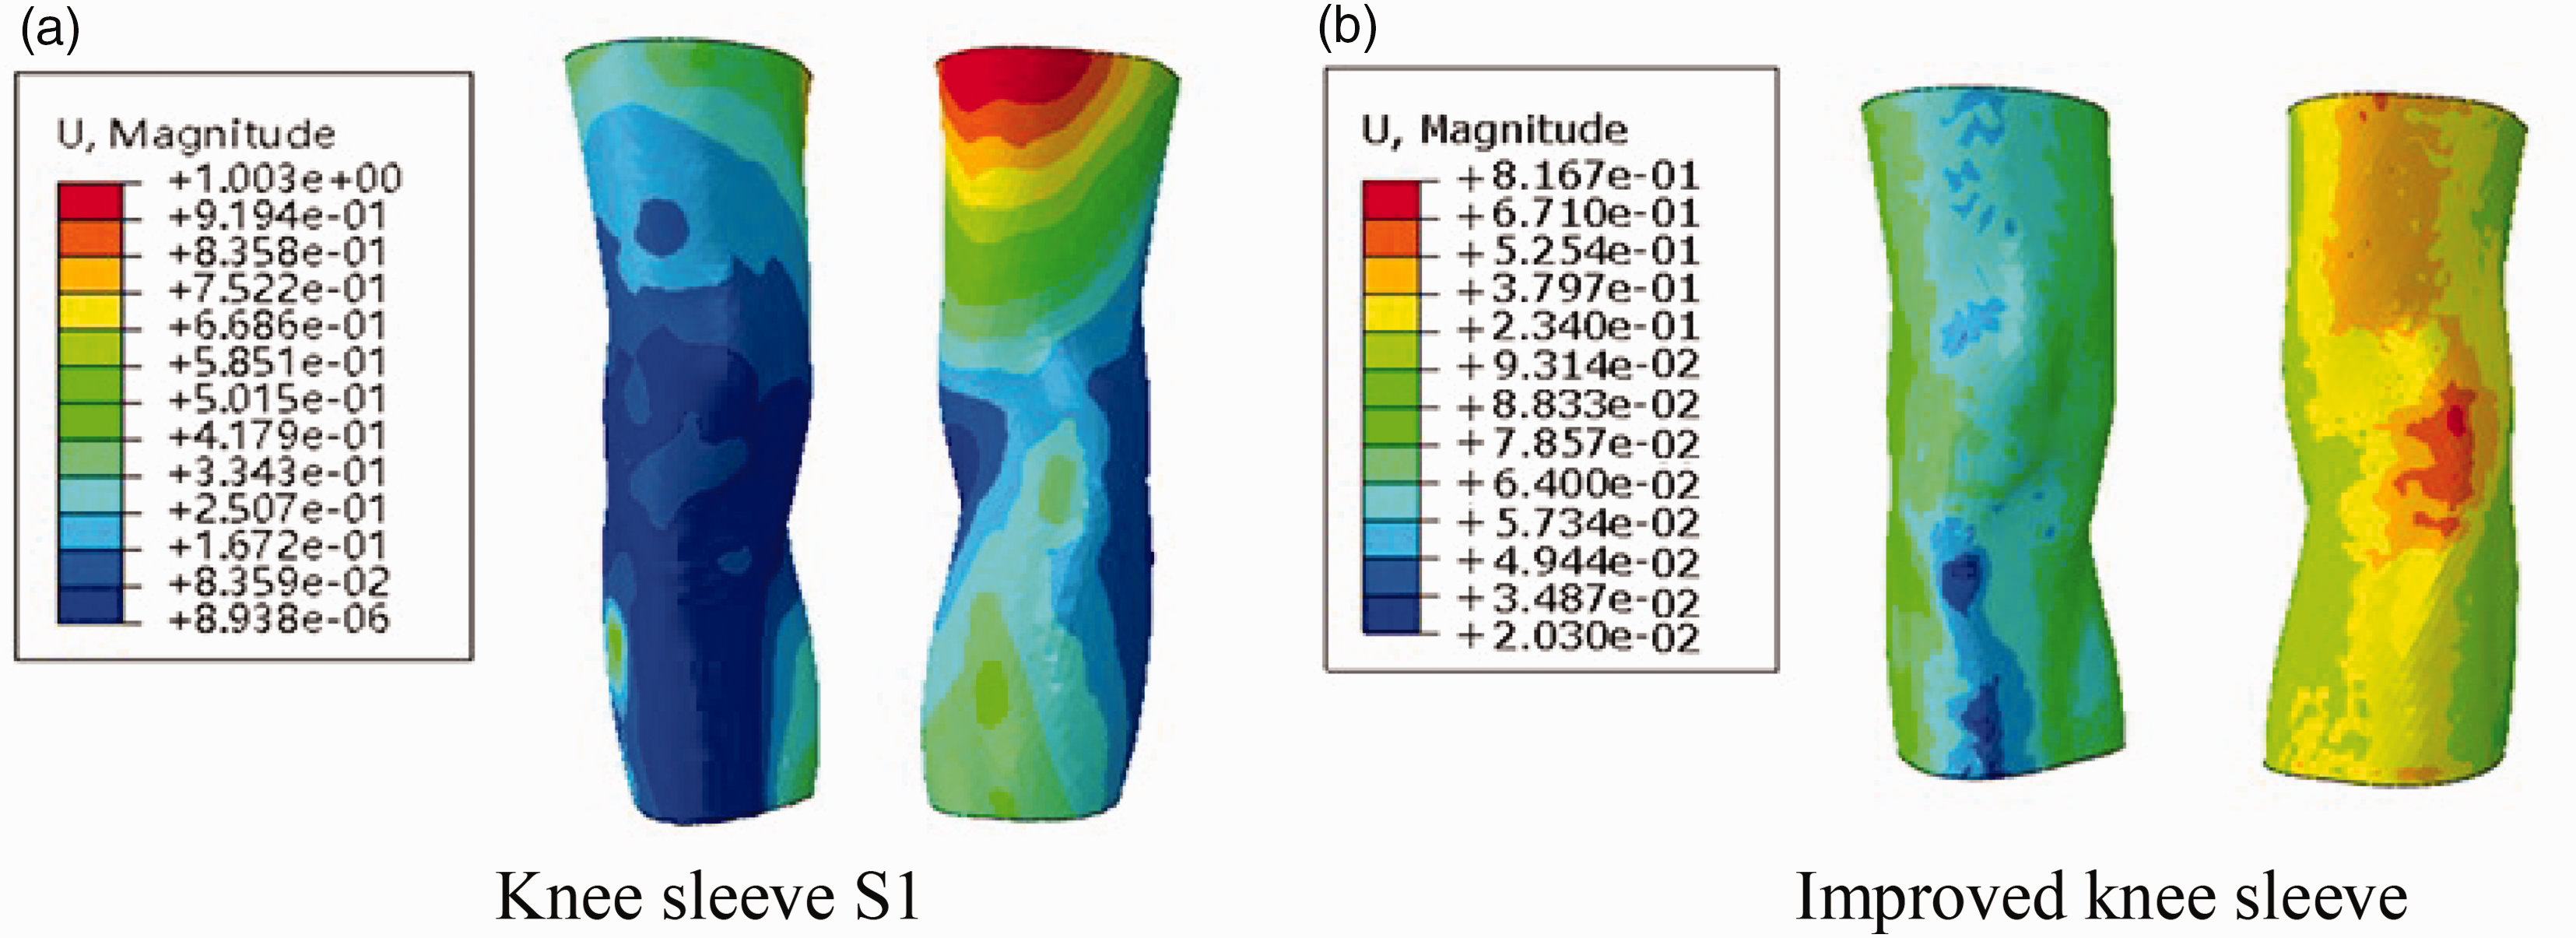
Comparison of displacement cloud maps between sample S1 and the improved knee sleeve: (a) knee sleeve S1 and (b) improved knee sleeve.
As can be seen from Figure 23, compared with the knee sleeve S1, the overall displacement value of the skin of the improved knee sleeve decreased during wearing. It shows that after wearing the improved knee sleeve, the degree of deformation of the human body is reduced, which will lead to weak pressure and will not restrict the activities of the human body. However, the overall displacement value of the improved knee sleeve does not decrease significantly, indicating that the improved knee sleeve can play a fixed and protective role on the human knee joint. In addition, the displacement value of the two sides of the thigh and the back of the calf of the human body is larger because of the use of high-elastic fabrics in this area, which can effectively limit muscle movement. The pressure displacement value in the popliteal fossa directly behind the patella is small, because the use of breathable and soft materials here can better fit the shape of the human popliteal fossa under the premise of ensuring pressure comfort. All these phenomena indicate that the zonal pressure design plays an important role in improving the pressure comfort of knee sleeves.
In general, through experiments and simulation, based on the design of the zonal structure, the improved knee sleeve can effectively protect the knee damage and improve the movement function of the wearer. The improved knee sleeve has been significantly improved compared with the sample S1 in terms of the support of the knee joint, the dressing comfort of the human body, and the fitting degree of the human knee joint, etc. It can play a better supporting effect on the knee joint, and ensure the comfortable state of the human body’s dressing under the premise of good functionality. These reflected the potential positive effects of improved knee sleeves in practical applications, and it will have a very broad market prospect.
Conclusion
Through the use of 3D modeling, FE analysis, and garment pressure testing techniques, the effects of the structural design of knee sleeves on their pressure distribution and comfort were comprehensively explored in this research. First, an accurate geometric model of the human knee joint was constructed by CT scanning and 3D reconstruction techniques, and the knee sleeve model was designed using SolidWorks software to realize the accurate assembly of the knee sleeve with the knee joint. Second, FE analysis was carried out using ABAQUS, and the pressure distribution of the knee sleeve under different structures was simulated through mesh generation, material assignment, contact setting, and boundary condition definition. Finally, the accuracy of the FE model was verified through garment pressure test experiments, and the optimized design of the knee sleeves based on the pressure zoning model was further proposed. The pressure test and FE simulation of the physical object of the improved knee sleeves showed that the improved knee sleeves significantly enhance the pressure comfort and support effect through the innovative design of zoned fabric selection, functional structural design, and adjustable straps. The results demonstrated that the zoned design can effectively reduce the peak pressure on the knee joint, improve the uniformity and stability of the pressure distribution, and thus make wearing more comfortable for users.
Current research utilizing FE analysis for predicting human body–clothing interactions predominantly focuses on human body modeling, often neglecting the development of comprehensive clothing models. This study addresses this gap by constructing both a detailed knee joint model through CT scanning technology and a realistic knee sleeve model using Solidworks 3D design software, subsequently assembling these components. This integrated approach enables more accurate representation of knee joint mechanics during actual knee sleeve wear. While existing literature primarily examines knee sleeves in the context of injury rehabilitation and prevention, there is limited research addressing the stress states in healthy individuals: a significant user demographic. This study contributes to this under-researched area by analyzing pressure comfort thresholds for healthy knee sleeve users. The application of FE simulation in this research allows for detailed analysis of various knee sleeve materials and structures, including their stress distribution and strain characteristics. This simulation capability not only facilitates the evaluation of protective performance but also identifies potential design flaws, providing valuable data for structural optimization. Consequently, this study offers both a scientific foundation for knee sleeve product enhancement and valuable theoretical insights for related research fields.
Footnotes
Declaration of conflicting interests
The author(s) declared no potential conflicts of interest with respect to the research, authorship, and/or publication of this article.
Funding
The author(s) disclosed receipt of the following financial support for the research, authorship, and/or publication of this article: This work was supported by the Key project of State Key Laboratory of Bio-Fibers and Eco-Textiles (Qingdao University; grant number ZDKT202103).