
Abstract
The thermal protection performance (TPP) of fire clothing is crucial to the safety of firefighters. The total burn area of burning dummies is an important index to evaluate the TPP of fire clothing. The prediction of the total burn area of burning dummies through the TPP experiment of fabrics and the physical properties of fabrics is the key to evaluating the TPP of fire clothing. This work employed the analytic hierarchy process (AHP)–Criteria Importance Through Intercriteria Correlation (CRITIC) combination weighting method and correlation analysis to determine the effect of various factors on the total burned area of the dummies. The results of the study showed that the weight of the fabric, TPP, garment shrinkage rate, and the flash fire exposure time had a greater influence on the total burned area of the burning dummies, while the thickness of the fabric had less effect on the total burned area of the burning dummies. In this work, the combined assignment method was used to determine the weights of the influencing factors in the influencing factor analysis, and this method made the decision results more comprehensive, accurate, and reliable. The weight vector of each influencing factor was calculated as
Keywords
Protective clothing for firefighting provides significant protection for firefighters in rescue work, and its thermal protection performance (TPP) will directly affect the personal safety of firefighters. 1 In modern firefighting operations, thermal threats exhibit multimodal coupled characteristics. On one hand, typical fire suppression environments involve heat flux densities of 200–800 kW/m2, comprising multiple heat transfer mechanisms: direct flame contact-induced convective heat transfer (accounting for approximately 60% of total heat flux), high-temperature object radiation (about 30%), and hot surface conduction (around 10%). 2 On the other hand, sudden explosions can generate impact-induced thermal fluxes exceeding 1,200 kW/m2, posing extreme demands on the thermal stability of protective equipment. Research indicates that firefighters experience thermal stress responses when the inner layer of protective clothing reaches 44°C, while skin contact with surfaces exceeding 80°C for merely 6 seconds can cause second-degree burns. 3 When firefighters carry out rescue work, the environmental thermal threat to fire clothing mainly comes from flames, the heat convection generated in the explosion process, the heat radiation, and the heat conducted when contacting a heated object. Its thermal protection function prevents or slows the heat flow to the human body 4 and reduce skin burns and provide safe working time for firefighters. 5
Fabric TPP experiment and burning dummy experiment are two commonly used experimental methods to evaluate the TPP of firefighting clothing at present. Scholars have conducted in-depth research on the fabric TPP experiment and the burning dummy experiment, mainly exploring the influencing factors of TPP, the establishment of TPP prediction model, and the influencing factors of the burn area of the burning dummy.6–10 In a comprehensive investigation into single-layer flame retardant fabrics, Yang et al. 11 discovered a notable positive correlation between the TPP value and the fabric thickness, as well as the gram per square meter, for fabrics with an identical fiber composition. Deng et al. 12 conducted a comprehensive assessment of the effect of air gaps on the TPP of firefighters’ garments. This involved a meticulous analysis of the distribution characteristics of air gaps inside firefighters’ garments, which were summarized into a number of key elements, including thickness, location, orientation, and dynamics. These elements were then used to assess the effect of air gaps on the TPP of firefighters’ garments. Su et al. 13 observed that reduced fabric thickness facilitates direct heat penetration through the material, while increased thickness resulting from water absorption enhances thermal conductivity due to water’s higher heat transfer capacity compared with air. Both mechanisms amplify heat flux toward the wearer, thereby elevating burn injury risks for firefighters. Wang et al. 14 concluded that the TPP of fabrics increase after initial washing or abrasion, but the TPP value decreases as the number of washings or abrasions is further increased. Wang et al.15,16 through the burning dummy experiment concluded that the TPP of the garment is not only related to the fabric, but also related to the structural design of the garment, the use environment and the performance of the accessories. Li et al. 17 performed TPP experiments and the burning dummy experiments and concluded that the TPP value and the burned area of the burning dummy can be used together as indicators to evaluate the TPP, and the different posture of the dummy also has an effect on the size of the burned area. Song 18 deeply analyzed the effect of the air gap layer between human skin and clothing in single-layer exothermic coveralls and constructed a model to predict the skin–clothing air gap dimensions on this basis. Tian et al. 19 employed computational fluid dynamics (CFD) advanced simulation techniques to predict the instantaneous heat flow and temperature distribution of the layers of clothing and skin. This was achieved by simplifying the heat transfer of the protective clothing system and considering the fabric as a three-dimensional medium, thus enabling the simulation of single-layer and multilayer clothing and contact combinations.
The advantage of fabric TPP experiment is that it is small in scale and low in cost, but its defect is that it is difficult to judge the performance of firefighting clothing because it only conducts experiments on small-sized fabrics. The advantage of the burning dummy experiment is that it directly tests the TPP of the garment and evaluates it by simulating the second- and third-degree burn area of the human body, but its limitation lies in the high cost and complex operation. 20 In a fabric TPP experiments, Xu et al. 20 comprehensively considered the influence of air gap on TPP. Moreover, in the burning dummy experiment, they discussed the influence of changes in the thickness of air layer under clothing before and after the flame burning on the burned area, and set up parameters to characterize the physical characteristics of fabric. Based in this, the TPP prediction model and the burn area prediction model were established. However, it is a relatively tedious process to measure the thickness of the air layer under clothing before and after the dummy burning experiment. Without knowing the specific value of the air layer thickness under clothing before and after the flame burning experiment, the burn area cannot be accurately predicted according to the formula of Xu et al. 20
Therefore, a new prediction model is proposed in this paper. The predictive model can more readily forecast burn injury areas on manikins by incorporating the “flash fire exposure time” as a factor in its parameters while minimizing the influence of air layer thickness factors at the same time. As previous studies have shown that flash fire exposure time also has a certain effect on the burn area of burning dummies, 18 in order to further improve the accuracy of the prediction model, an independent variable of flash fire exposure time was added to the model in this study. In addition, this study also adopts the combined weighting method of analytic hierarchy process (AHP)–Criteria Importance Through Intercriteria Correlation (CRITIC) to systematically determine the weights of relevant factors affecting the total burned area of burning dummies, and comprehensively evaluates the weight distribution results and the results of correlation analysis. Based on this, the effect and significance of each factor on the total burned area of burning dummies are discussed comprehensively and deeply, which provides strong support for establishing a better prediction model.
Experimental setup
Fabric TPP experiment
The TPP experiment is an internationally recognized method to evaluate the TPP of fabrics. In this experiment, the heat source is provided by two burners placed at a 45° angle to simulate the combustion flame. At the same time, in order to more fully evaluate the TPP of the fabric, the experiment also added an electrically heated quartz lamp to provide thermal radiation, so as to ensure more accurate and comprehensive test results. 17 In the experiment, a copper calorimeter test sensor was used instead of human skin. In order to simulate the air gap between the fabric and the skin under real conditions, a specific metal gasket was placed between the fabric and the test sensor to set the specific air gap. The fire source is set to 84 kW/m2, with equal radiation and convective heat fluxes of 50%, to ensure the accuracy and comprehensiveness of the experimental conditions. 5 The TPP value is calculated by multiplying the total heat flow of the fire scene by the time it takes for the skin to reach second-degree burns, The higher the TPP value of the fabric, the better the TPP, and vice versa. The device used in the experiment is DR255C TPP tester, and the schematic diagram of the experimental device is shown in Figure 1. The TPP experiment requires at least three replicates per group, with three specimens tested each time, and the final result is determined by averaging the outcomes. 6 For error control, individual specimen test results must not deviate from the average by more than 10%; otherwise, the data are discarded and replaced with new specimens. In addition, the heat source must be periodically calibrated during the experiment to maintain a stable heat flux within the range of (84 ± 2) kW/m2. 7
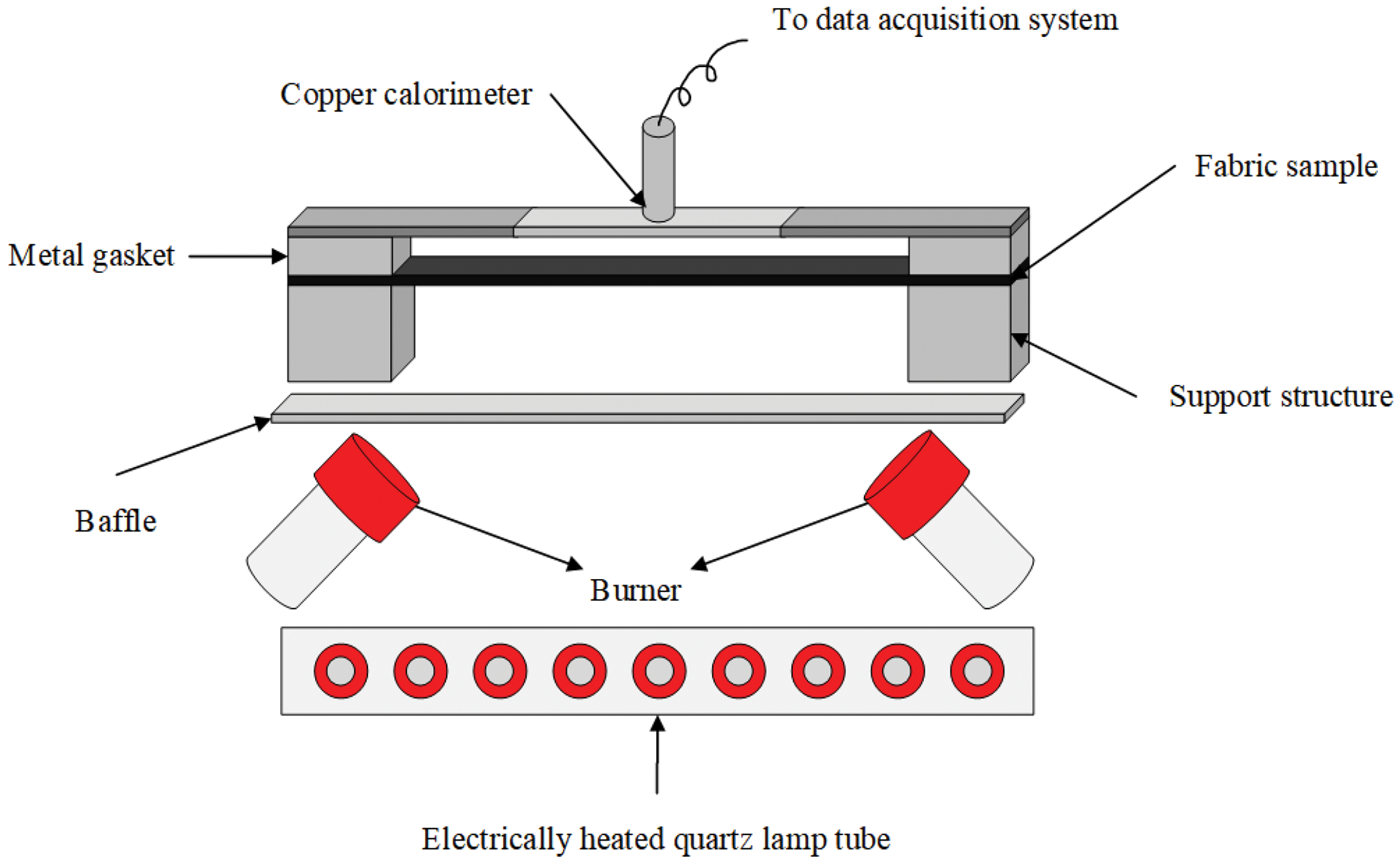
Schematic diagram of the TPP experimental device.
Burning dummy test experiment
The TPP of firefighting clothing is significantly influenced by multiple external factors. The number and structure of fabric layers affect sweat evaporation, thereby altering the risk of heat accumulation. 8 Posture and movement of the manikin dynamically modify the air gap thickness beneath the clothing, with areas such as underarms being more susceptible to localized overheating due to thinner air gaps. 9 Moisture conditions temporarily enhance TPP values, while increased perspiration-induced humidity in inner garment layers accelerates burn injury time. These interdependent variables require systematic evaluation through flame manikin testing systems to assess their compound effects on thermal protection.
A burning dummy test system is a highly effective tool for testing and evaluating the TPP of protective clothing. 21 In this experiment, the combustion dummy body was equipped with more than 120 heat flow sensors and its posture was set to stand still and upright. A total of 20 burners in 6 groups were set in the center of the burning dummy body. The heat flow generated by these burners could be precisely controlled by adjusting the fuel delivery velocity. During the experimental process, each garment sample must undergo combustion burning dummy test twice to ensure data accuracy and reliability. Prior to test initiation, the calibrated average heat flux density must strictly meet specifications, with the standard deviation rigorously controlled below 21 kW/m2. In addition, the combustion duration for each test cycle is explicitly set to 3 seconds. 10 In order to evaluate the degree of burn injury, we calculated the percentage of burn area based on Henriques’ burn integral model, 22 and used the percentage of skin burn area as the main evaluation indicator to quantitatively evaluate the TPP of protective clothing. The flow chart of the burning dummy experimental is shown in Figure 2.
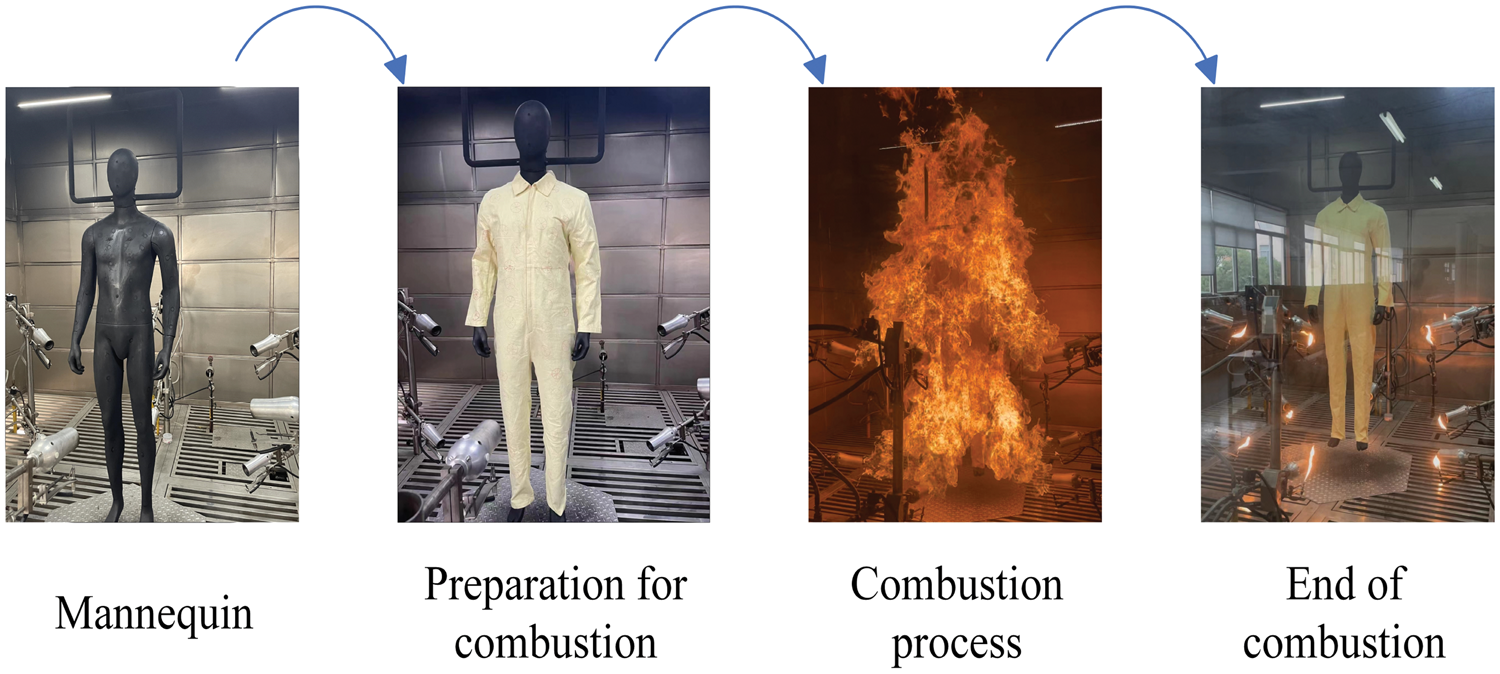
Flow chart of the burning dummy experiment.
Materials and data
Materials
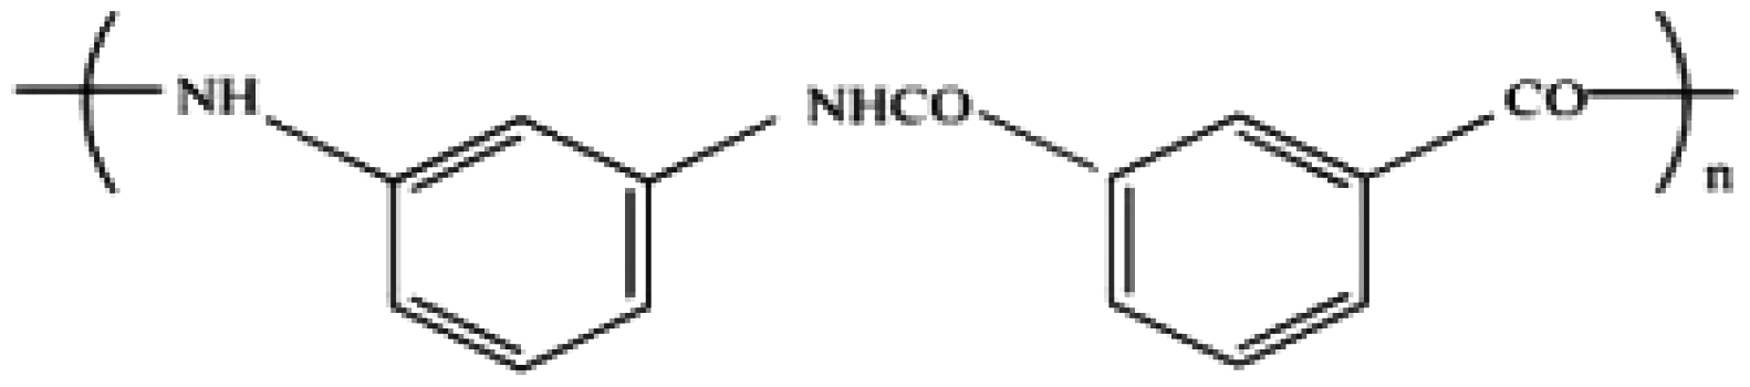
Aramid 1313 fiber: The chemical name is polyisophthaloyl metaphenylene diamine (PMIA), aramid 1313 fiber trade name “Nomex,” a fiber with good high temperature resistance.
23
Its chemical molecular formula is as shown in Figure 3.
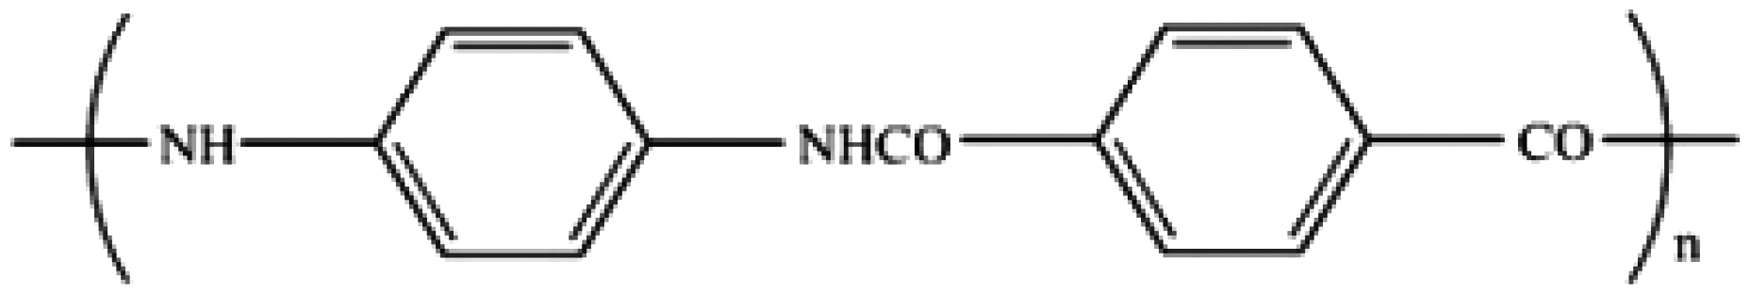
Molecular formula of aramid 1313 fiber. Aramid 1414 fiber: The chemical name is poly(p-phenylene terephthamide) (PPTA), the thermal decomposition temperature of the fiber is as high as 560°C, thus it has good high temperature resistance, and the limiting oxygen index (%) reaches 26–28, which is a little lower than that of aramid 1313 fiber.
24
Its chemical molecular formula is as shown in Figure 4.
Molecular formula of aramid 1414 fiber. Nomex IIIA: This fabric is a blend of 93% Nomex fiber (meso-aramid), 5% Kevlar fiber (para-aramid), and 2% antistatic fiber, which has excellent flame retardant and thermal insulation properties. Nomex IIIA fiber has an ultimate oxygen index of more than 28%. Fabrics made from Nomex IIIA fibers will contract dramatically and expand and carbonize at about 380°C, forming a carbon protective layer between the heat source and human skin, minimizing the hazard of heat or flame.
17
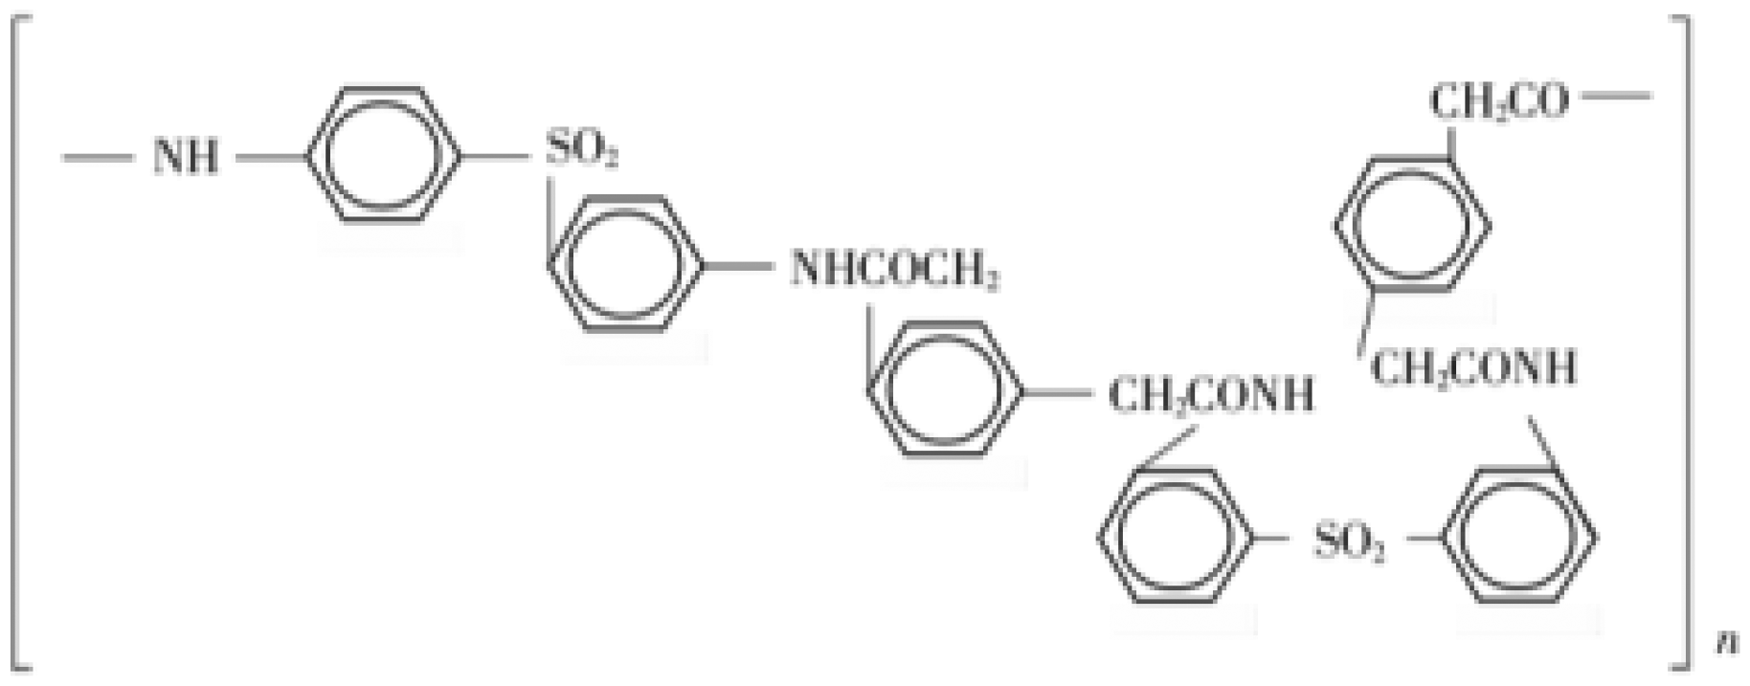
It has excellent high temperature flame retardancy, good antistatic properties, and the fabric has good strength and wear fastness, and its excellent performance has a wide range of applications in thermal protective clothing, fire resistant clothing, radiation protective clothing, and so on. PSA fiber: The chemical name is polysulphonamide.
25
Due to the presence of a strong electron-absorbing sulfone group in the main chain of the macromolecule, it has excellent heat-resistant properties through the double bond co-choking of the benzene ring. Aramid sulfone does not melt or shrink during combustion and self-extinguishes away from the flame, with very little negative or afterburning.
26
Its molecular structure formula is as shown in Figure 5.
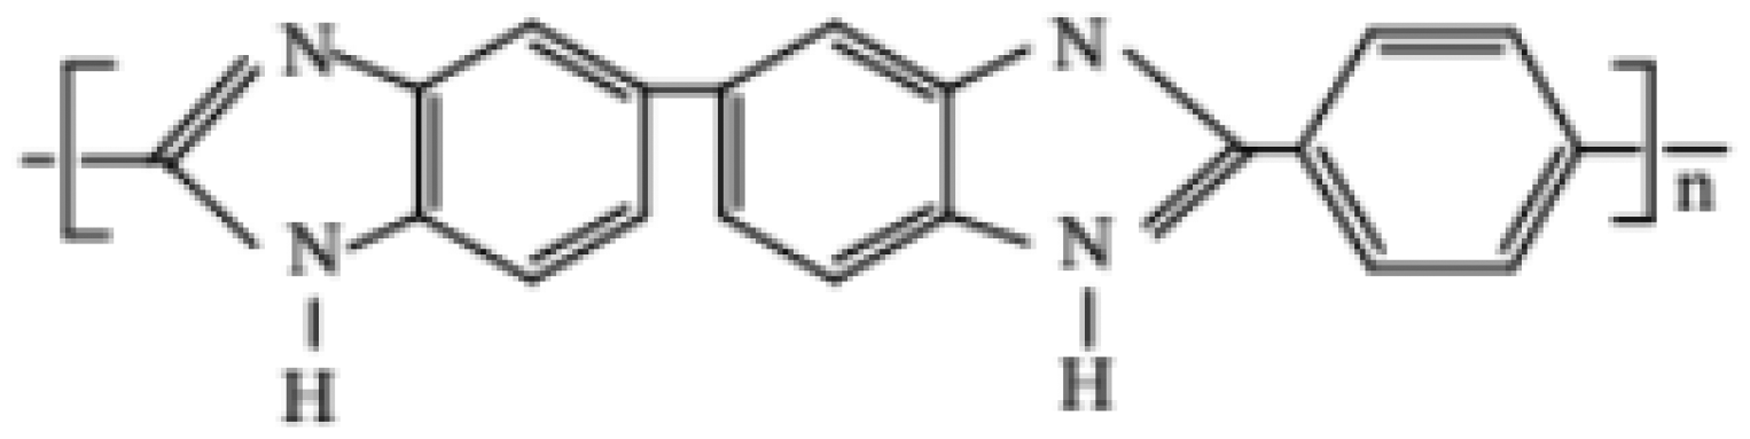
Molecular formula of PSA fibers. PBI fiber: The chemical name is polybenzimidazole, which is a solvatochromic liquid crystal heterocyclic polymer, and is usually produced by polycondensation of aromatic dicarboxylic acids and aromatic amines, or their derivatives. The macromolecular chain is highly aromatic, with excellent thermal stability, as well as resistance to strong acids and bases, and is usually used as a membrane material, conductive material, and flame-retardant material in the automotive industry, aerospace, microelectronics, and other fields.
27
. Its molecular structure formula is as shown in Figure 6.
Molecular formula of PBI fiber.
Data sources
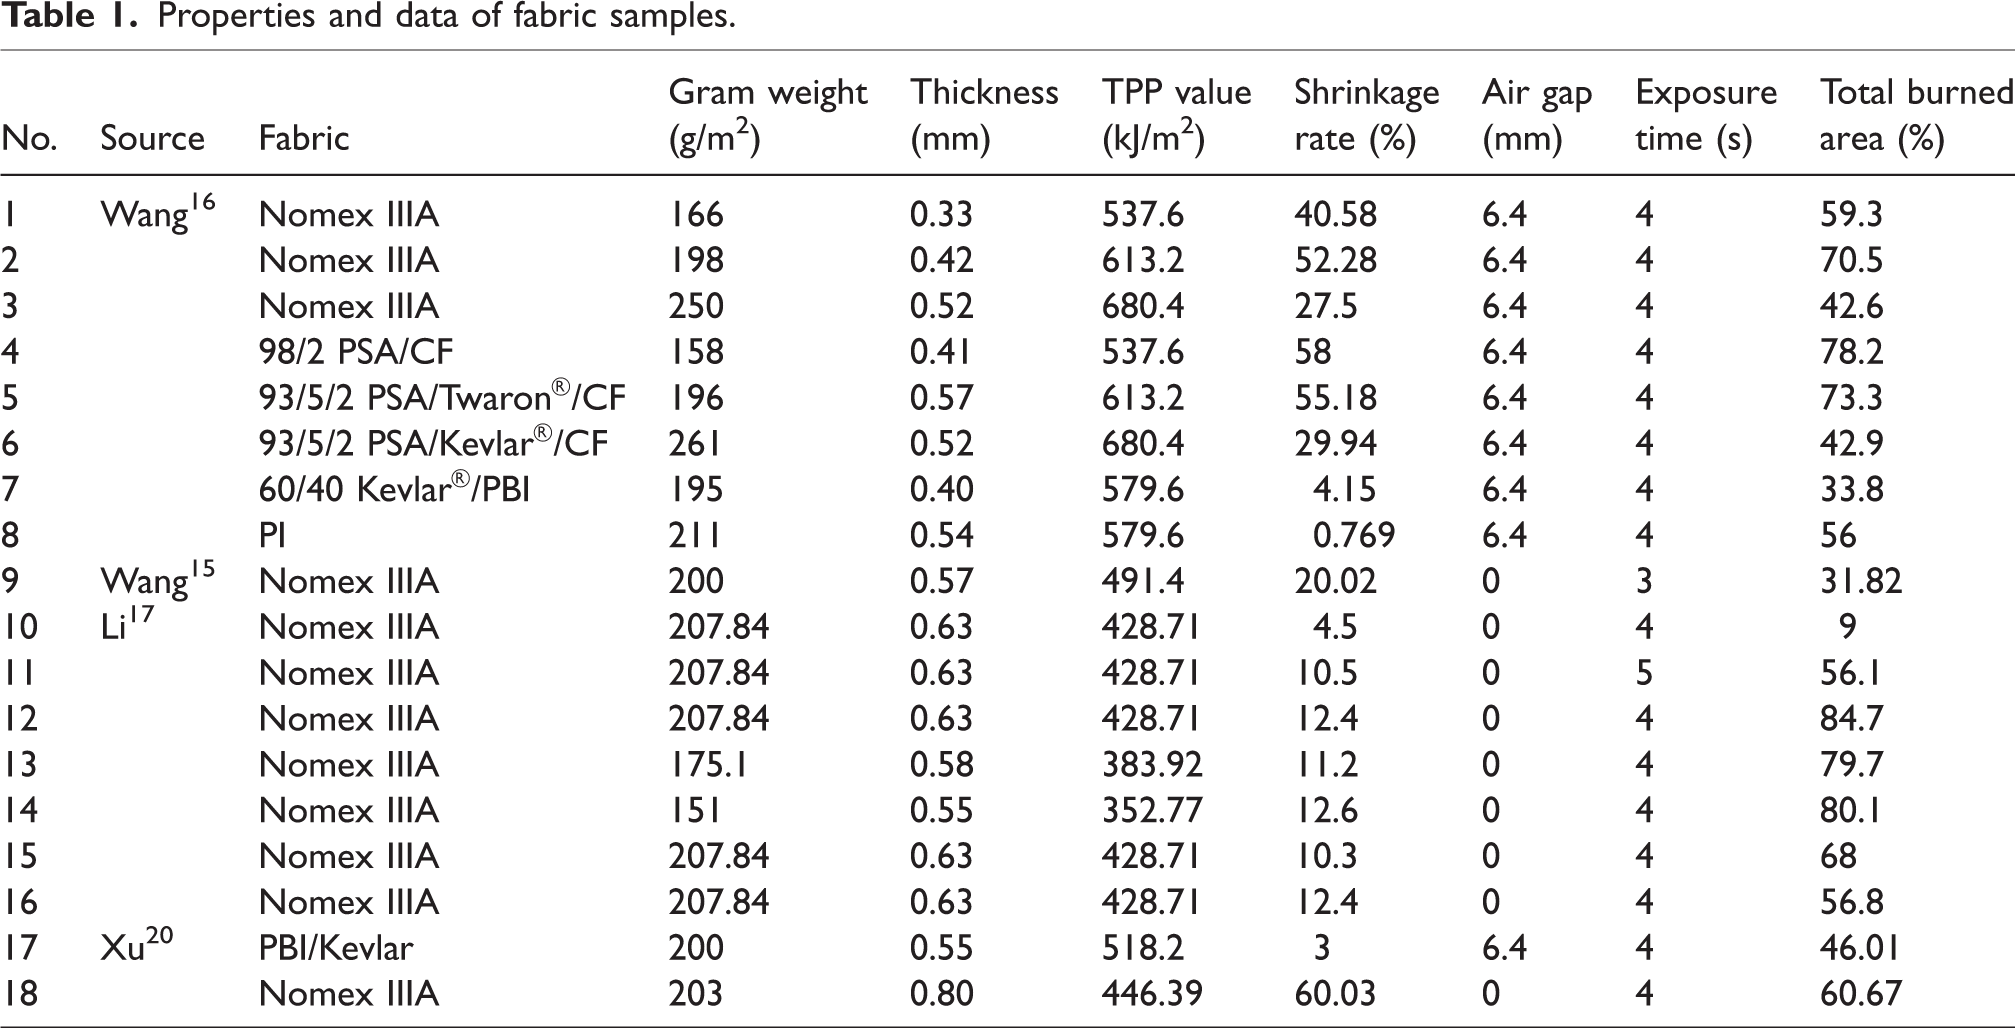
Detailed data of fabric samples are listed in Table 1.
Properties and data of fabric samples.
Results and discussion
Correlation analysis
Correlation analysis refers to the analysis of two or more variable elements with correlation, so as to measure the degree of correlation between two variable factors. A Pearson correlation analysis method was used to analyze the correlation between the gram weight, thickness, TPP, shrinkage rate, flash fire exposure time, and total burn area. The calculation formula for the correlation coefficient r is as follows
28
:
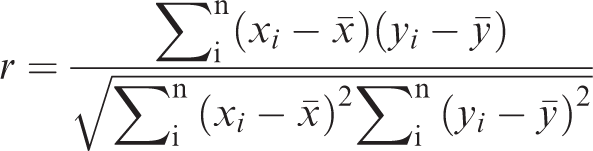
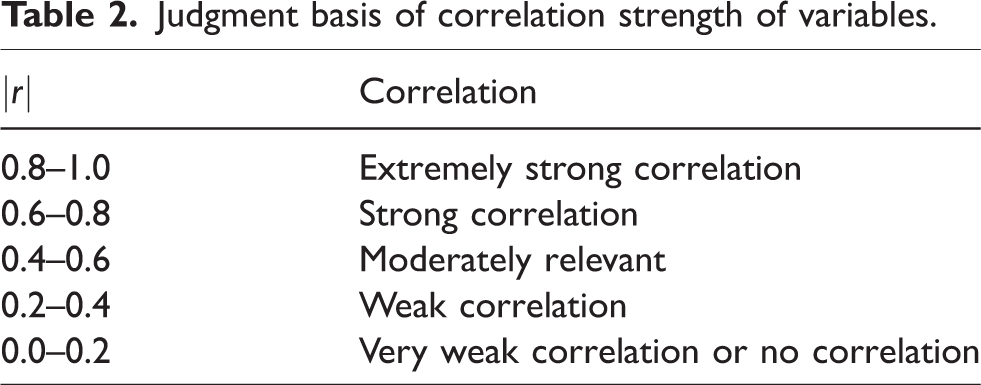
The closer the value of the correlation coefficient r is to 1 or –1, the stronger the correlation, and the closer the correlation coefficient is to 0, the weaker the correlation. When r is greater than 0 and less than 1, it is a positive correlation; when r is greater than –1 and less than 0, it is a negative correlation; when r is 1, it is a full positive correlation; when r is –1, it is a full negative correlation; and when r is 0, it is no correlation. 29 The basis for judging the correlation strength of variables is presented in Table 2.
Judgment basis of correlation strength of variables.
The thermal map of total burn area and variables is shown in Figure 7. The correlation coefficient between fabric thickness and total burn area is 0.013, indicating that the correlation between fabric thickness and total burn area is very weak. The correlation coefficients between shrinkage rate, flash fire exposure time and total burn area are 0.324 and 0.674, indicating that shrinkage rate and flash fire exposure time are positively correlated with total burn area, which indicates that with the increase of shrinkage rate and flash fire exposure time, the total burn area also increases. The correlation coefficients between gram weight of fabric, TPP value, and total burn area are –0.483 and –0.276, indicating that gram weight of fabric, TPP value, and total burn area are negatively correlated, which indicates that total burn area decreases with the increase of gram weight of fabric and TPP value.
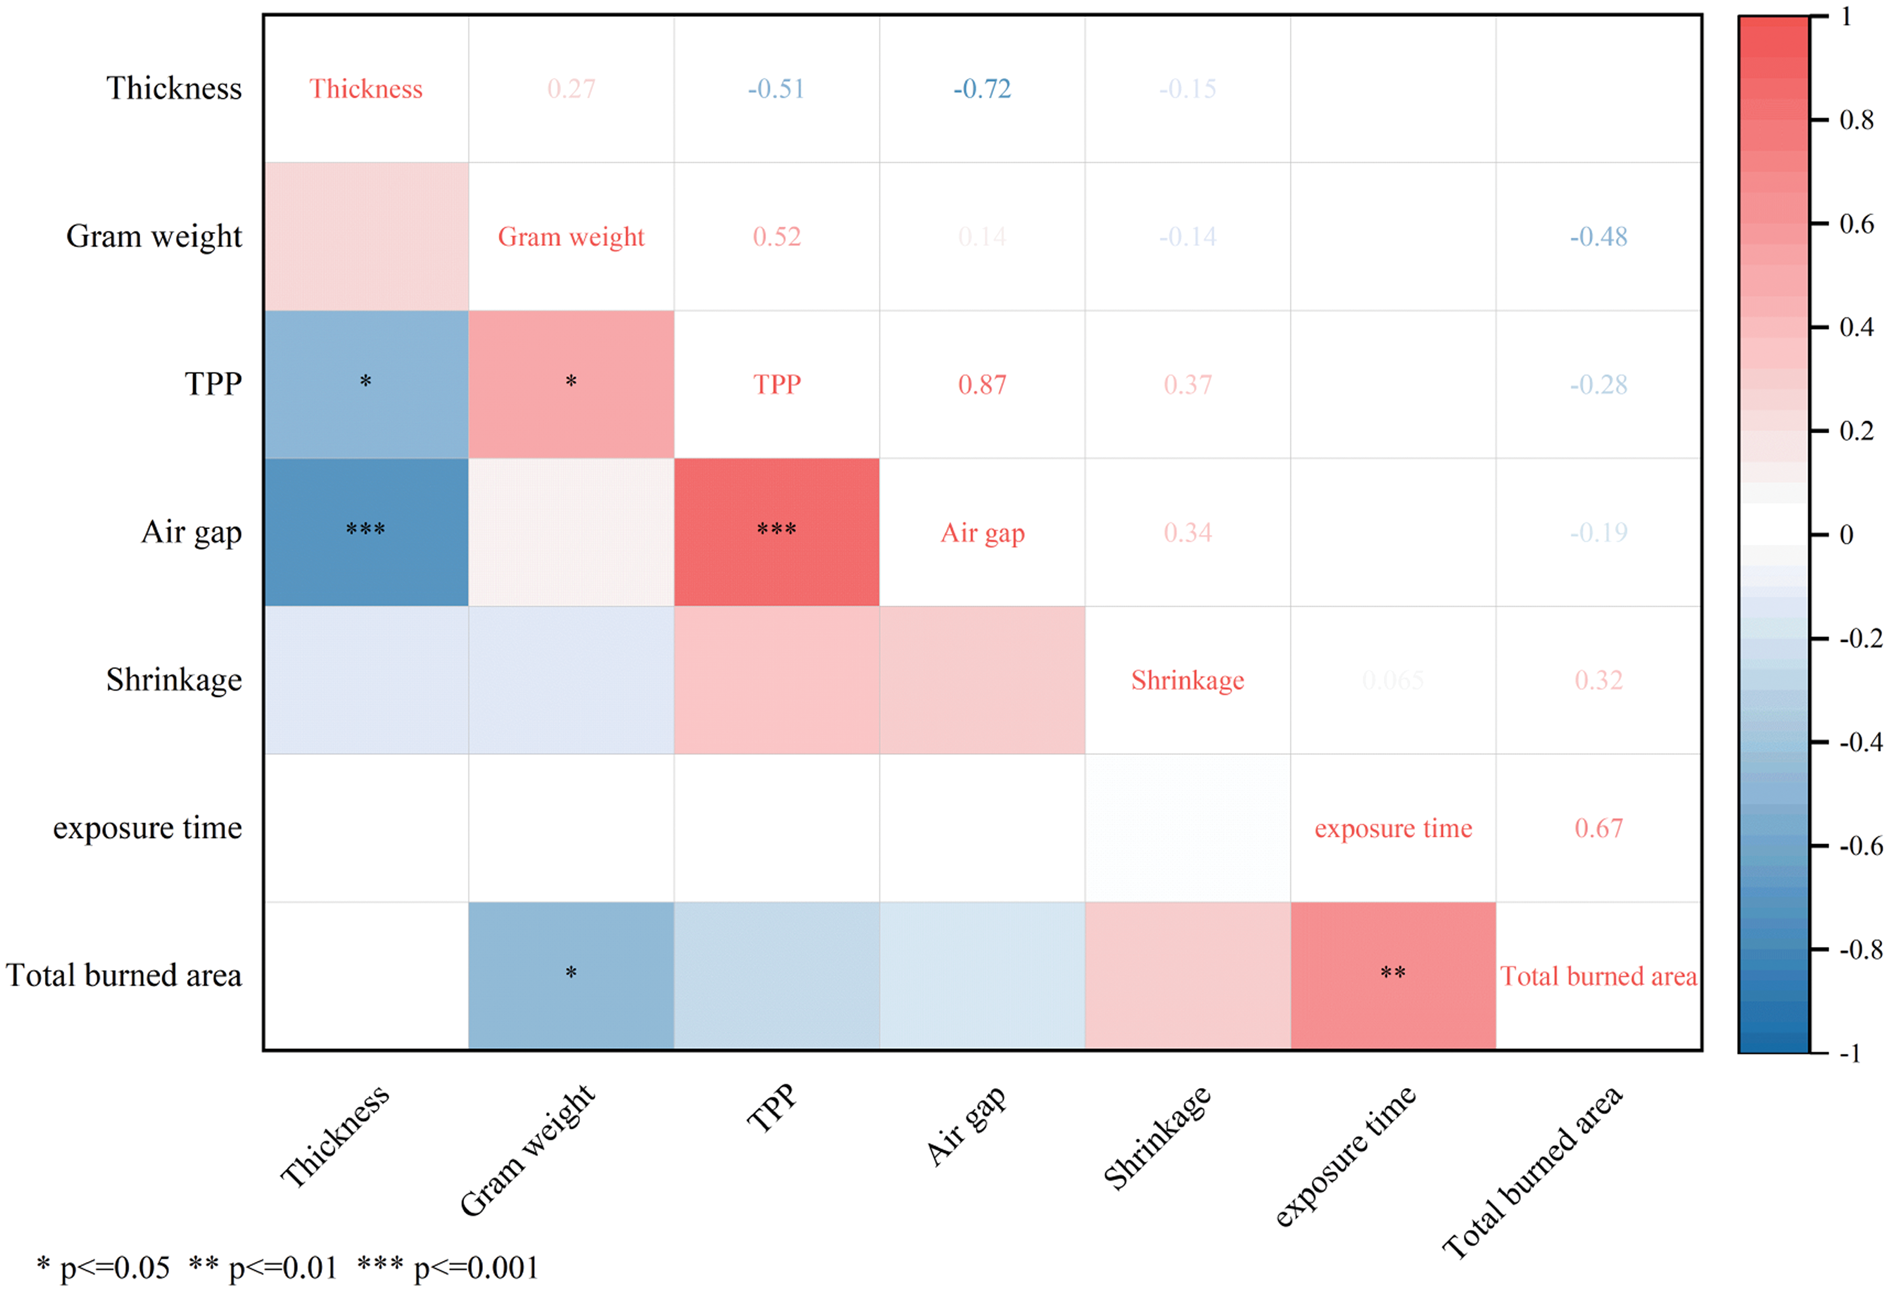
Thermal map of total burn area and variables.
AHP–CRITIC combination weighting method
The method of AHP deeply considers the dependency between the upper index and the lower index, showing its advantages of systematicity, hierarchy, orderliness, and simplicity, while the method of CRITIC focuses on the evaluation of the volatility and correlation between indicators, with a wide range of applications and a high degree of flexibility and adaptability. The AHP–CRITIC combination weighting method not only considers the subjective experience and judgment of decision makers, but also makes full use of the attributes of data itself, which can avoid the one-sidedness and limitations that may exist in a single weighting method. Thus, the decision result is more comprehensive, accurate, and reliable. 30 This study uses the subjective and objective method to assign weight to the influencing factors that affect the total area of the dummy burn, and finally obtain the weight of each influencing factor.
Analytic hierarchy process
The AHP divides the decision-making problem into levels, from the general objective to the specific scheme, calculates the relative weights of the elements of each level through the judgement matrix, and finally determines the comprehensive weight of each scheme on the general objective, and that with the largest weight is the optimal scheme. 31 The basic process of this method in performing weight analysis is as follows.
First, the influencing factors of the total burned area of the burning dummy were divided into three aspects, namely physical properties of the fabric, chemical properties of the fabric, and time, to form a hierarchical model of the total burned area, as shown in Figure 8.
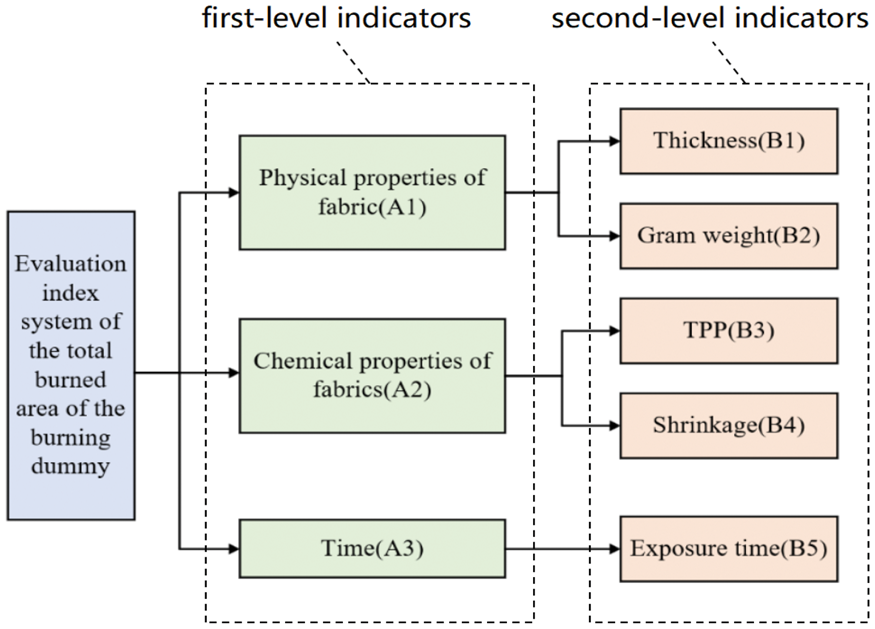
Evaluation index system of the total burned area of the burning dummy.
Second, according to the established hierarchical structure model and the importance of each parameter, a 1–9 scale table was used to compare the importance of each indicator.
30
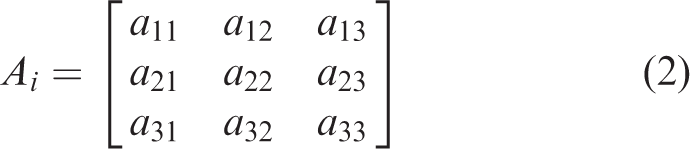
The judgment matrix was determined through expert scoring, and 10 experts were invited to conduct expert scoring in the form of a questionnaire survey to obtain the judgment matrices Ai and Bi corresponding to the first-level and second-level indicators:
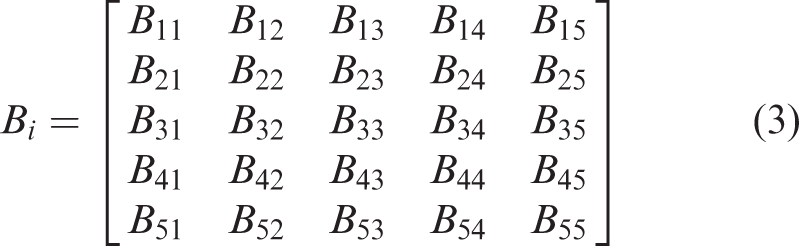
Then the root method is used to solve the weight vector of the judgment matrix Ai and Bi, represented by
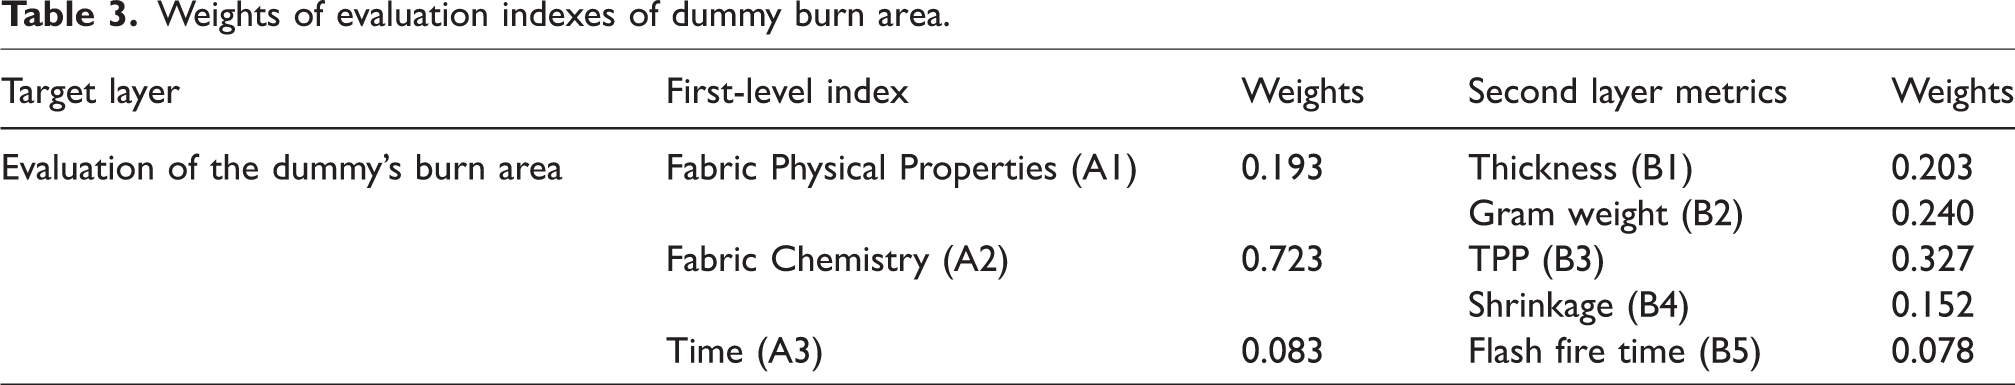
Weights of evaluation indexes of dummy burn area.
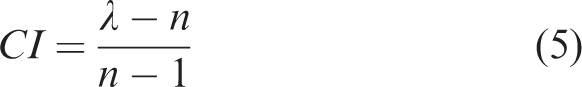
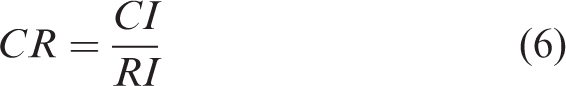
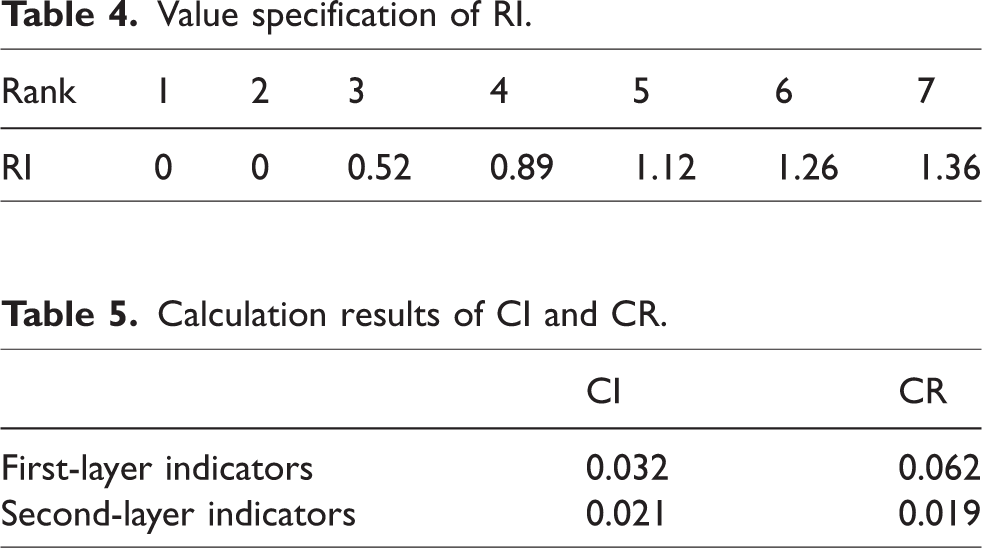
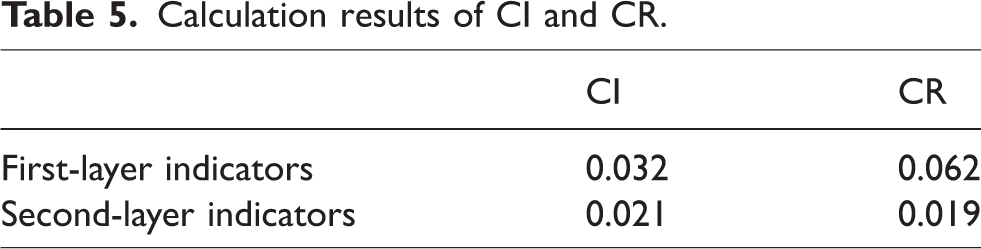
Then a consistency check is performed. In the AHP, the consistency test compares the difference between the judgment matrix and the consistency matrix. CR, CI, and RI are the core metrics. CI (consistency index) reflects the degree of deviation from consistency in the judgment matrix, calculated based on the maximum eigenvalue. RI (random index) serves as a benchmark value to correct for random errors in subjective judgments, with its values determined by lookup tables corresponding to different matrix orders. CR (consistency ratio), the ratio of CI to RI, measures the overall consistency level of the judgment matrix. When CR is less than 0.1, it is considered that the construction matrix is equivalent to the consistency matrix, and the characteristics of the consistency matrix can be used for the construction matrix. The value specification of RI is listed in Table 4. In the consistency test, it is necessary to calculate the maximum eigenvalue of the matrix 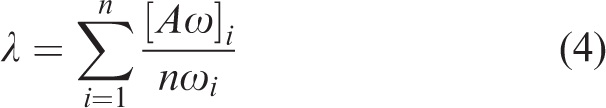
Value specification of RI.
After calculations, the maximum eigenvalue for the first-level indicator is
Calculation results of CI and CR.
Finally, the weights of each influencing factor are determined. The weight vector of the first layer index is
CRITIC objective weighting method
Compared with the entropy weight method, mean square error method, and coefficient of variation method, the CRITIC method is a more reasonable objective weighting method. It is realized by comprehensively evaluating the contradiction and contrast intensity between the evaluation indicators. 32 This method not only considers the difference between the evaluation indicators, but also takes into account the correlation between them, and makes full use of the objective attributes of the data to carry out scientific evaluation. The basic principle of this method is as follows.
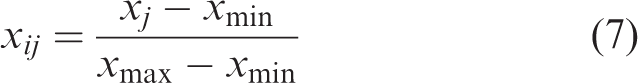
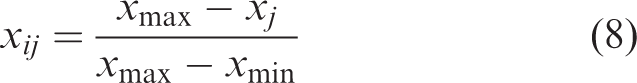
First, calculate the data standardization. According to the correlation analysis, thickness, shrinkage rate, and flash fire exposure time are positively correlated with the total burn area, whereas gram weight and TPP are negatively correlated with the total burn area. Therefore, the thickness, shrinkage rate, and flash fire exposure time are defined as positive indicators, and gram weight and TPP are defined as reverse indicators for calculation. Formula (8) is the inverse index standardization calculation method, obtaining the standardized matrix X = [xij]m × n:
Since there are different samples of values for the same indicator, these values are evaluated in terms of the magnitude of variability measured by volatility and conflict indicators. According to the standardized matrix X, the volatility indicators 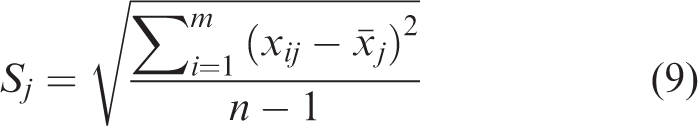
To calculate the conflict indicators, the correlation matrix of the indicators should be used. The formula is as follows:
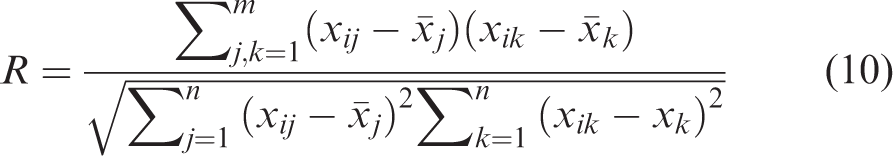
Then the conflict formula is
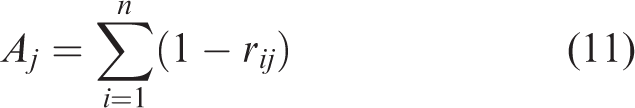
The greater the amount of information 
In the CRITIC objective weighting method, the indicator volatility is standard deviation: the greater the standard deviation is, the greater the weight is. The conflict is the correlation coefficient: the stronger the correlation between indicators is, the lower the conflict is, the smaller the weight is. 32 The information volume is the indicator variability multiplied by the conflict index, and the weight is the normalization of the information volume. The weight results of each indicator are obtained through calculation, as presented in Table 6.
Weight calculation results.
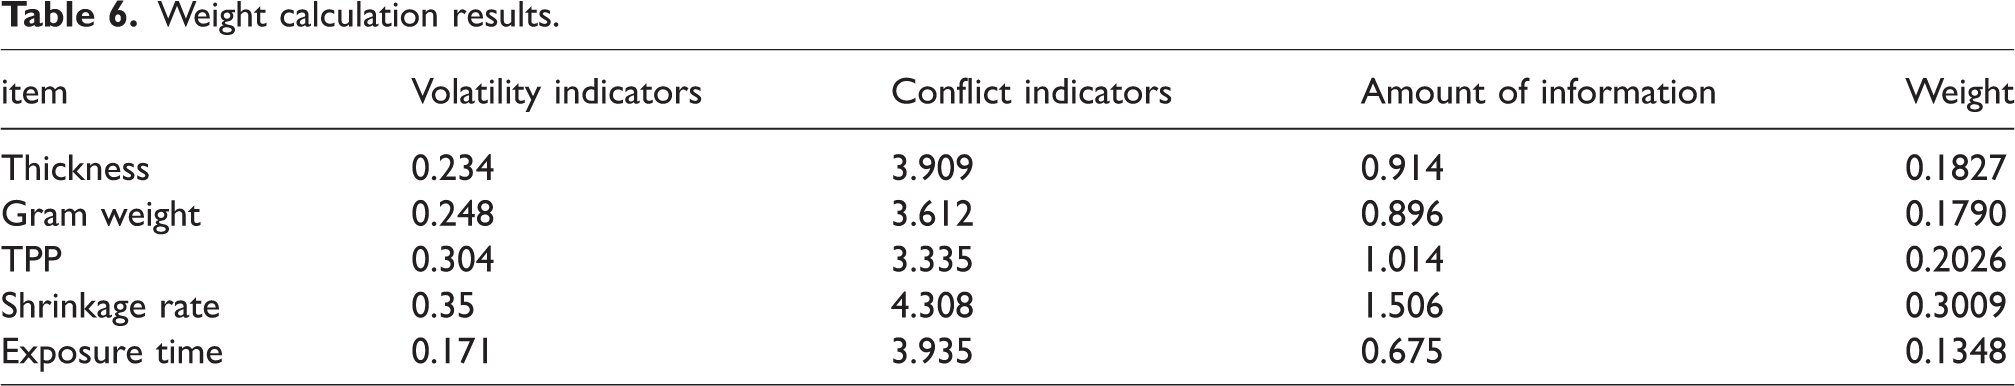
Through calculation, the weight of thickness is 0.1827, the weight of gram weight is 0.1790, the weight of TPP is 0.2026, the weight of shrinkage is 0.3009, and the weight of flash time is 0.1348, where the maximum value of indicator weight is shrinkage rate, and the minimum value is flash time. The weight vector is
Comprehensive weight
This study employs a combined weighting approach that integrates both subjective and objective factors to determine the indicator weights.
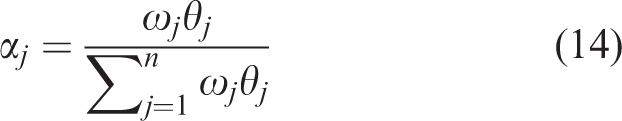
The weight vectors of each influencing factor
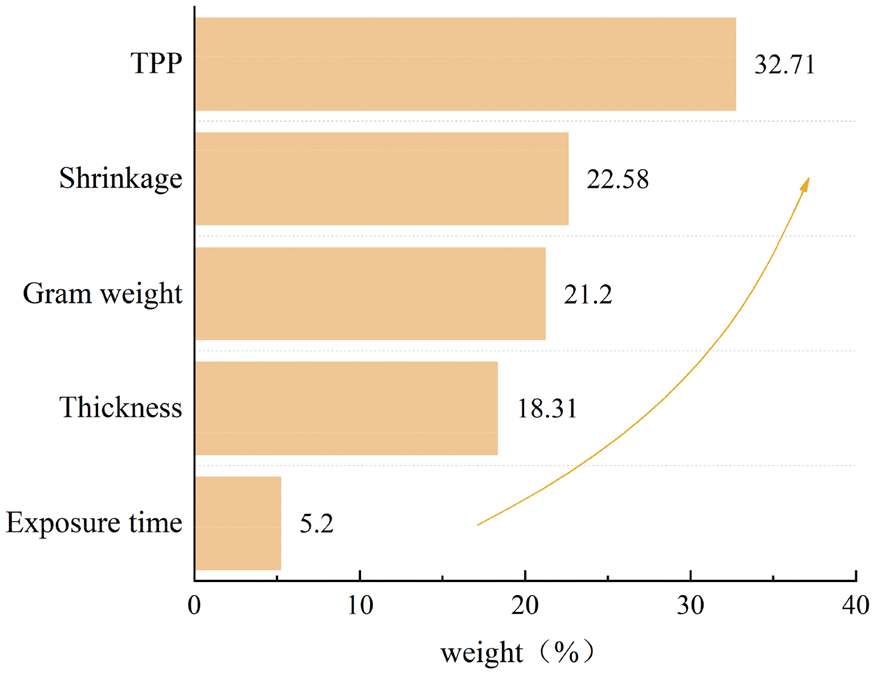
Weight histogram.
Establish a prediction model
In this study, the predictive analyses of TPP values are carried out first through the physical properties of fabrics and air gaps, and then the predicted TPP values are used for the prediction of the total burned area together with the shrinkage and flash fire time of the garments.
TPP value and influencing factors analysis
The correlation analysis shows that the correlation coefficients between TPP and thickness, gram weight, and air gap are –0.511, 0.522, and 0.873, respectively, so there is a certain correlation between TPP and its variables. However, correlation analysis can only judge the qualitative relationship between TPP value, thickness, gram weight, and air gap, so further research is needed to determine the quantitative relationship. In this study, a multiple nonlinear regression (MNLR) fitting method was adopted for the above data, assuming that the relationship between the TPP values and the thickness, grammage, and air gap conforms to the following equations:

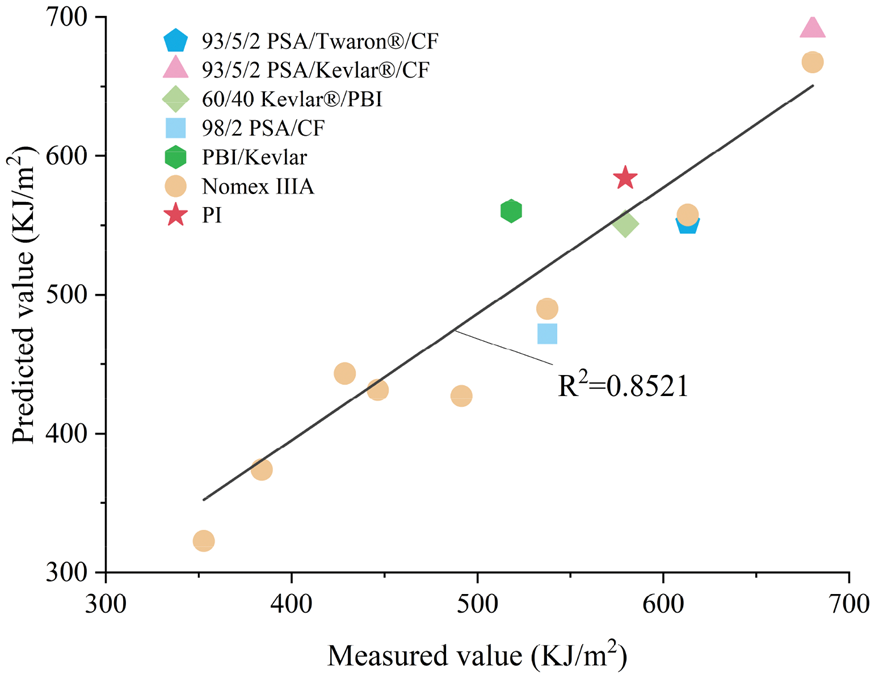
Comparison of measured TPP values and predicted TPP values.
From Figure 10, it can be seen that the multivariate nonlinear fitting R2 value is 0.8521, and the fitting result is reasonably accurate, therefore, the following equation is used to predict the value of TPP:
Establish the prediction model of total burn area
The reason why the dummy burning experiment has not been widely used is because of its high cost and complexity. 20 If the burn area can be predicted through the fabric TPP experiment, the cost and complexity will be greatly reduced, and it will be more efficient and save time. Therefore, this study establishes the prediction model of the total burn area and thickness, gram weight, TPP, shrinkage rate, and flash fire exposure time.
The establishment of this prediction model uses the method of multiple linear regression fitting. First, it is known from previous studies that the gram weight, thickness, TPP of fabrics, and shrinkage of garments have a certain effect on the burn area of burning dummies, 33 so the prediction equations of gram weight, thickness of fabrics, predicted TPP, shrinkage of garments and the total burn area are established. The prediction results are shown in Figure 11(a).
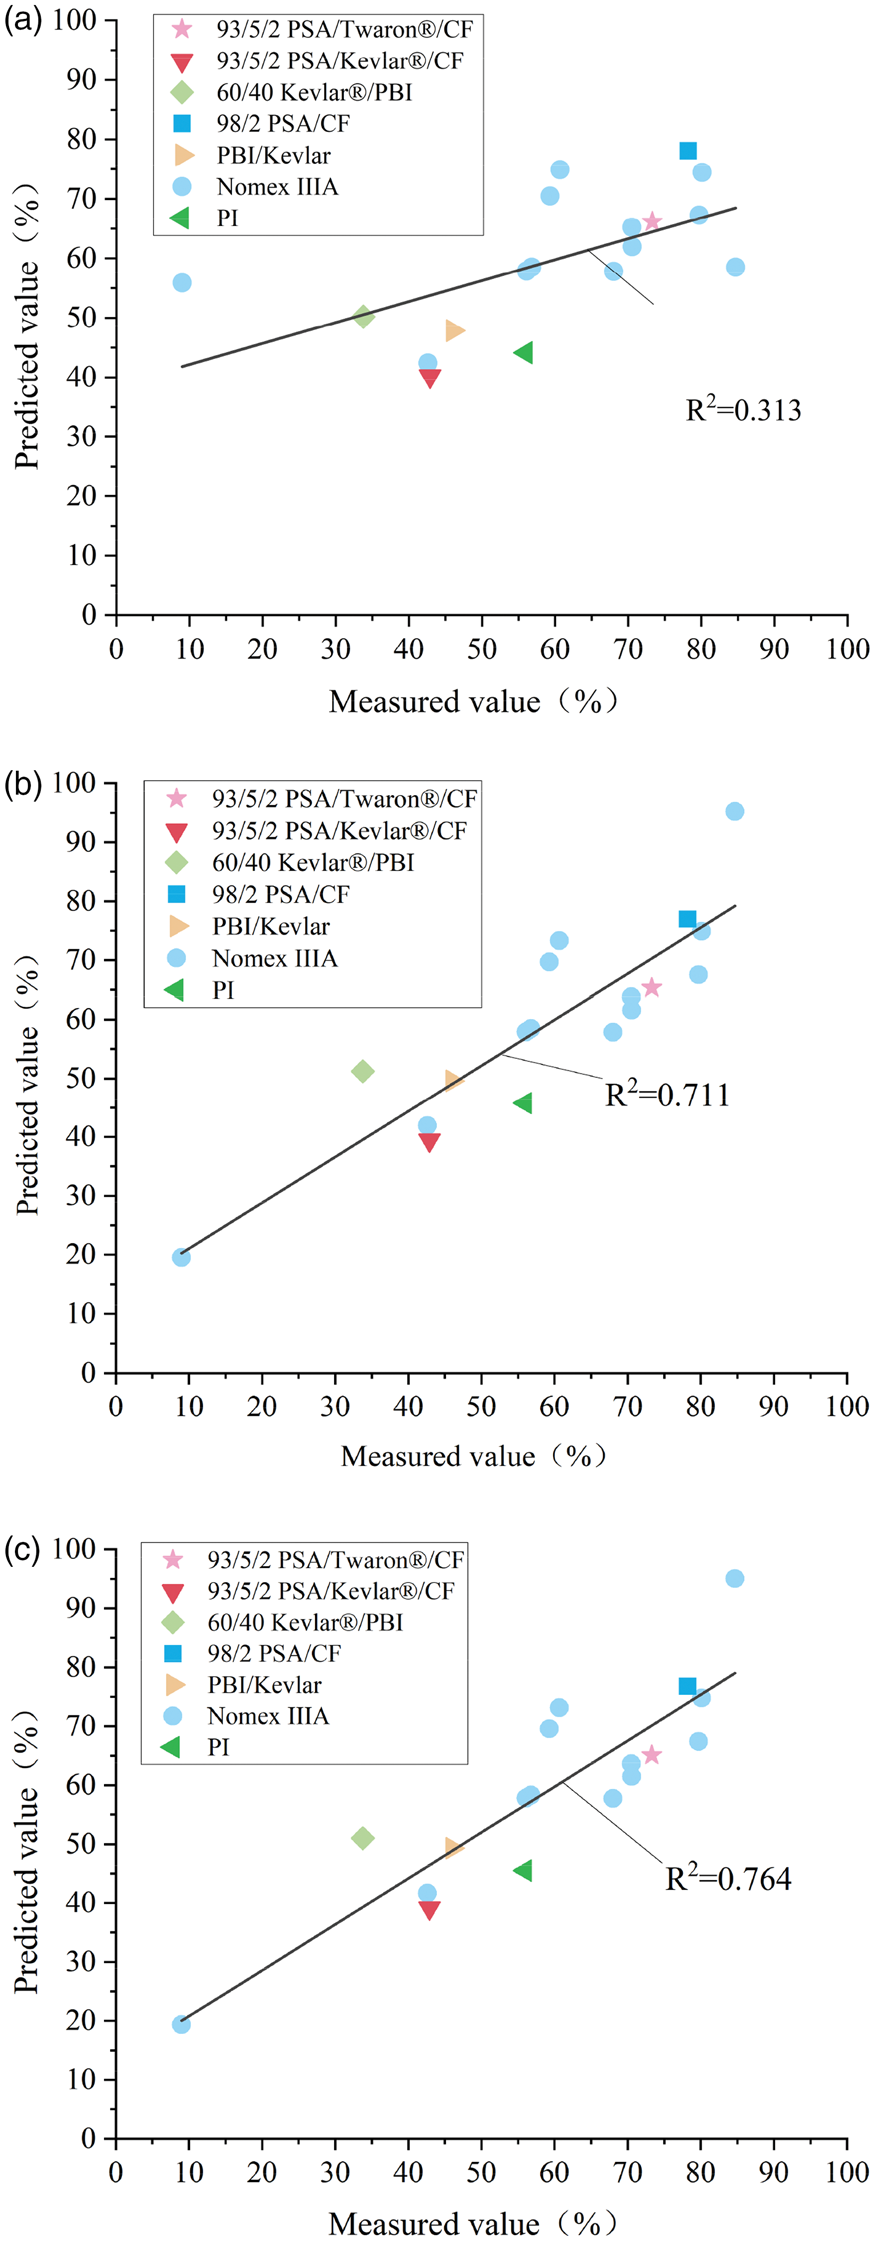
Comparison of burn area model predictions for burn dummies: (a) predicted results without considering flash fire exposure time; (b) predicted results taking all factors into account; (c) predictions without considering thickness.
Second, according to the previous research, it is known that the flash fire exposure time has a certain effect on the shrinkage of the garment, which in turn affects the burned area of the burning dummy, 18 so the influence factor of the flash fire time is added to carry out the prediction model for the burned area of the burning dummy. The prediction results are shown in Figure 11(b).
Finally, according to the weighting method of AHP–CRITIC combination above, the weight of thickness and flash fire exposure time can be obtained as 0.1831 and 0.0520, respectively. The weight of the two is relatively low, and the influence on the total burn area of the dummy is relatively small. According to the results of correlation analysis, the correlation coefficient between thickness and total burn area is 0.013, and the correlation between them is extremely weak. However, the correlation coefficient between flash fire exposure time and total burn area is 0.674, showing a strong correlation. Therefore, after comprehensive consideration, it is decided not to take thickness as an independent variable, and the burn area prediction model is established according to gram weight, TPP, shrinkage rate, and flash fire exposure time. The results of the fit are shown in Figure 11(c).
According to the comparative analysis of the fitting results in Figure 11, it can be seen that the fitting results without considering the flash fire time are relatively poor, and there is not much difference between the fitting results after considering all the factors and excluding the thickness, so in order to reduce the repetition of the influencing factors, the gram weight is used to replace the physical properties of the fabric for the prediction of the burned area.
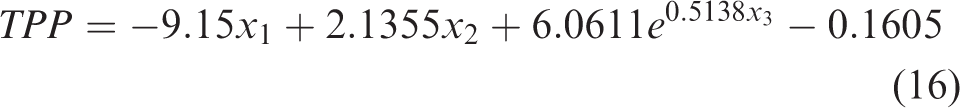
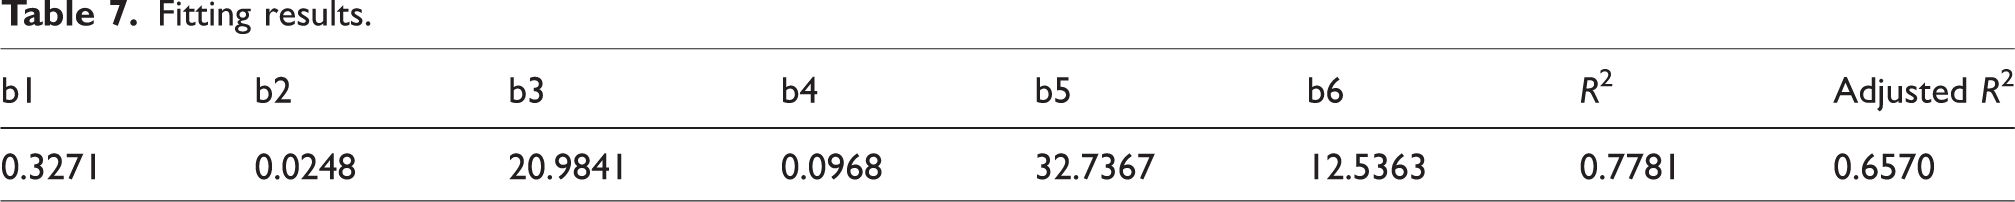
Therefore, in this study, the gram weight of the fabric, the predicted TPP, the shrinkage of the garment, and the flash fire exposure time are used to establish the prediction equation for the total burn area of the burning dummy, assuming that the relationship is in accordance with the following equation by using linear fitting:

Fitting results.
Model validation
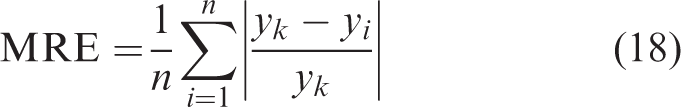
In this analysis, the MRE was used to verify the accuracy of the prediction model. Its calculation formula is
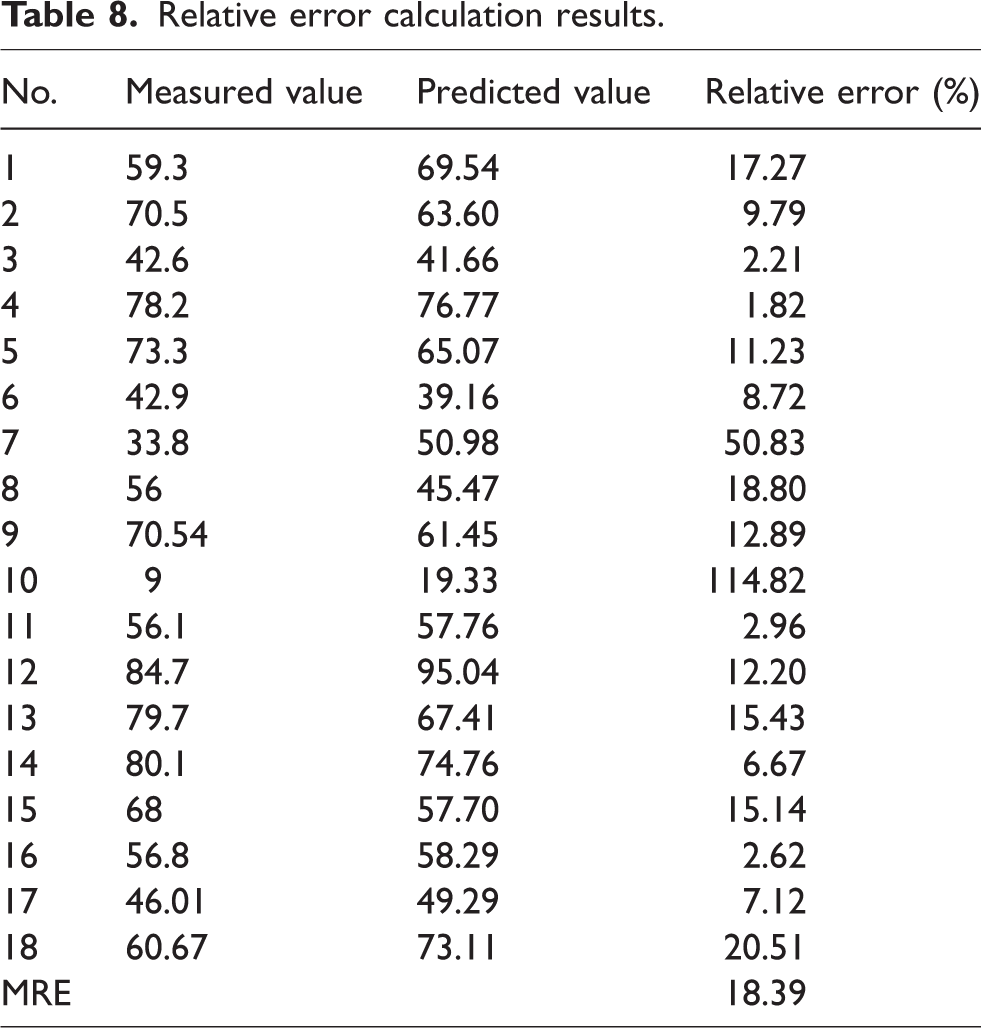
Relative errors were calculated for all the data and the results are presented in Table 8. From Table 8, it can be concluded that the average relative error was 18.39%, and although the relative error of the percentage of burned area was relatively large, the result was acceptable due to the fact that the burn dummy test is significantly less reproducible in practice compared with the fabric test. 34 According to a related study, the burning dummy test has a great variability of results in assessing the percentage of skin burns with a wide range of standard deviations between 5.4% and 37.1%. 34 Although the deviation between the measured and model-predicted values in this study reached 18.39%, this level of deviation actually indicates that the developed model maintains a relatively high prediction accuracy in a complex and variable testing environment, considering the aforementioned high variability background. Therefore, the model can be considered to have a high level of reliability and accuracy in predicting the percentage of burned area.
Relative error calculation results.
Conclusions
This study has calculated the weights of various factors affecting the total area of burns of dummies through the method of AHP–CRITIC combination weighting, and combined the results of correlation analysis to judge the effect of various factors on the total area of burns, then established the TPP prediction model and the burn area prediction model of burning dummies, and we can draw the following conclusions.
This paper has conducted correlation analysis on gram weight, thickness, TPP, shrinkage rate, flash fire exposure time, and total burn area of the burning dummy, and concluded that the correlation between fabric thickness and total burn area was very weak, shrinkage rate and flash fire exposure time were positively correlated with total burn area, while fabric gram weight and TPP value were negatively correlated with total burn area. In this study, the weights of parameters affecting the total burn area of burning dummies were calculated through AHP–CRITIC combination weighting method, and the weights of each influencing factor are obtained. After comparative analysis, it is concluded that the weight value of TPP is the highest, while the weight value of thickness and flash fire exposure time is relatively low. Combined with correlation analysis, the influence of each factor on the total burn area of burning dummies has been determined. At the same time, the AHP–CRITIC combination weighting method can fully leverage the advantages of both, improve the accuracy and reliability of weight allocation, and provide more scientific, reasonable, and effective support for evaluating the TPP of garments. In this study, in the process of exploring the construction of the burn area prediction model for combustion dummies, the key parameter “flash fire exposure time” has been innovatively introduced, which significantly improves the comprehensiveness and accuracy of the prediction. The average relative error has been used to validate the model, and the result is within the acceptable range, which further illustrates the accuracy of the prediction model. Through systematic application of correlation analysis and AHP–CRITIC combination weighting method, this study has identified the dominant factors governing TPP, while minimizing experimental reliance on manikin flame exposure tests, thereby providing actionable guidance for strategic optimization of firefighter protective garment design at the material engineering level. In future research, we will employ 3D scanning and conduct burn experiments across varied parameters to analyze thermal shrinkage,
35
then establish models linking fabric shrinkage to burn areas, ultimately developing enhanced protective solutions for firefighters and special operatives.
Footnotes
Authors’ contributions
L.L.: methodology, data curation, and writing—original draft preparation; X.L.: methodology, formal analysis, and writing—original draft preparation; K.M.: conceptualization, investigation, and resources; L.W.: project administration, resources, and funding acquisition; X.Y.: Validation, resources, and investigation; J.Z.: Validation, and funding acquisition; H.L.: conceptualization, supervision, formal analysis, writing—review and editing. All authors have read and agreed to the published version of the manuscript.
Data availability statement
All data, results, and models used or generated during the study appear in the submitted article.
Declaration of conflicting interests
The authors have no conflicts of interest to declare.
Ethics approval and consent to participate
Not applicable.
Funding
The author(s) disclosed receipt of the following financial support for the research, authorship, and/or publication of this article: This work was supported by the Basic Scientific Research Fund of Zhejiang Province (grant number 2022YW18), Eyas Program Incubation Project of Zhejiang Provincial Administration for Market Regulation (grant number CY2022003), and Research Project of Wenzhou Science and Technology Bureau (grant number ZZG2023006).