
Abstract
Medical-device-related pressure injuries resulting from mismatched human–harness interfaces during body weight support (BWS) training represent a persistent challenge in clinical rehabilitation. This study investigates a multidisciplinary cosimulation framework integrating finite-element analysis (FEA) and optimization algorithms to enhance the biomechanical compatibility of harness systems. An automated multisoftware optimization workflow was developed to minimize stress and strain induced by the harness, with the objective function targeting optimal pressure distribution across the body–harness interface. Subsequently, inverse parameter identification was performed to derive the optimal material properties of the harness. Simulation results revealed that the optimized harness configuration significantly reduced peak von Mises stress by 15.47% ± 1.2% and maximum shear strain by 19.58% ± 0.9% compared with conventional designs. Furthermore, a region-specific material optimization strategy was implemented: stiffer, warp-dominant materials were employed in the lumbar region to enhance load-bearing performance, while softer materials with lower warp and weft stiffness were applied to the shoulders and legs to redistribute mechanical loads and reduce localized tissue deformation. These findings provide a biomechanically informed design strategy that effectively mitigates the risk of pressure injuries during BWS training, contributing to safer and more comfortable rehabilitation harness systems.
Keywords
The body weight support (BWS) system is a widely utilized lower-limb rehabilitation robot employed in gait training for neurologically impaired patients, including those with stroke, spinal cord injury, and Parkinson’s disease. 1 During BWS training, the patient walks on a treadmill while wearing a textile-based harness attached to an overhead suspension system to relieve a portion of body weight, 2 and an electric lifting motor on the support frame that uses a slip gear and gearbox is responsible for lifting. The primary load-bearing regions of the rehabilitation harness precisely correspond to its anatomical coverage areas, specifically the shoulders, waist, abdomen, and leg, which collectively constitute the human–machine flexible interface that represents a key focus of this investigation.
Compared with the conventional rigid countermeasures, an intrinsically flexible and extensible harness is tightened around the patient’s body segments during the BWS training, forming a soft human–harness interface. 3 The relative motion between biological tissues and interface materials generates pressure and shear forces, straining skin and soft tissues. Insufficient force risks displacement, while excessive and prolonged force induces discomfort, reduces compliance, and impedes rehabilitation robotics adoption. Severe cases may occlude capillaries, causing ischemia or pressure injuries. 4 According to a recent survey, adverse events associated with robotic-assisted therapy can be as high as 17%, with soft tissue pressure injury ranking highest. Borggraefe et al. reported that all soft tissue pressure injuries were caused by straps or cuffs in rehabilitation equipment. 5 Pressure injuries associated with such medical devices represent a significant challenge in healthcare settings. 6
The interface between patient and BWS system is one of the key factors influencing how force is distributed on the interface and transmitted from the robot to the body. 7 As the sole human–robot contact component, the rehabilitation harness sustains up to 80% of the patient’s body weight. Extensive research has demonstrated that the anisotropic properties and dynamic tensile mechanics of fabrics are closely associated with wear pressure comfort.8–10 The ergonomic design of the harness, such as fabric structure and material properties, is crucial for the patient’s well-being and rehabilitation performance. Integrating inherent safety principles or safety-by-design strategies can mitigate these risks early in the design process. However, existing knowledge regarding the optimal structural and material characteristics of the human–harness interface remains limited.
Advancements in textile engineering now integrate 3D virtual fitting systems with comprehensive simulation platforms, enabling accurate prediction of fabric mechanics and real-time visualization of human–harness interaction dynamics. 11 Tian et al. demonstrated CLO3D feasibility for wear comfort and interface pressure simulation, 11 whereas Hu and Song confirmed its scientific reliability. 12 Though Youn et al. noted CLO3D tends to overestimate localized pressures, the data remain valuable for wearability assessment. 13
While conventional approaches employing isolated textile modeling or finite-element analysis (FEA) demonstrate fundamental efficacy, their singular implementation fails to address the multidimensional challenges of biomechanical optimization. iSIGHT algorithmic framework is a powerful computational platform for optimizing complex engineering and scientific processes. 14 It integrates multidisciplinary design optimization, process automation, and data-driven decision-making, enabling seamless workflow management and robust design analysis. This computational synthesis facilitates precision optimization of key human factors, such as thermal and moisture comfort, as well as interface pressure management, thereby establishing a novel paradigm for automated textile engineering solutions. Therefore, an innovative digital twin methodology is required: one that integrates textile modeling, FEA, and the iSIGHT algorithmic framework for automated parameter optimization.
To assess human–harness interface compatibility and pressure injury risk, interface pressure is a critical and easily measurable parameter that serves as an efficient indicator of discomfort. 15 Excessive interface pressure is a well-documented risk factor for localized discomfort, restricted blood perfusion, and pressure-related injury. Literature has reported region-specific tolerances for interface pressure in seated and loaded postures. Ciaccia and Sznelwar have suggested specific pressure thresholds, such as 4.25 and 7.8 kPa, beyond which capillaries could become obstructed and tissue oxygenation could be compromised. 16 Mitsuno and Kai found that pressure thresholds could vary depending on the body region (5.8 kPa under the ischia; 2.9 kPa under the thighs), 17 consistent with Kermavnar et al. who showed that discomfort was triggered at mean inflation pressures of 4 kPa at the thighs, 2.46 kPa at the waist, and 1.67 kPa at the shoulders. 18
However, interface pressure cannot reveal mechanical sub-dermal tissue conditions. The predominant theory of pressure injury development involves compression-induced ischemia and excessive shear strain. Studies suggest that the combined effects of cyclic and sustained stress, along with shear strain exceeding a critical threshold, significantly contribute to soft tissue damage. 19 It is therefore essential to assess both the interface pressure as well as internal stress and strain of soft tissue layers. 20 Regarding the physiological safety thresholds for the soft tissue stress/strain, an animal study suggested that principal shear strain exceeding 50% for approximately 10 minutes pose an immediate risk of mechanical pressure injury. 21
This study aims to develop an automated computational framework for optimizing human–harness interface parameters by integrating 3D modeling, FEA, and iSIGHT optimization tools. The framework is designed to systematically reduce interface pressure and mitigate soft tissue stress and strain, addressing biomechanical risks associated with prolonged human–harness interaction. Specifically, this research focuses on two key aspects: (1) establishing a robust numerical framework that enables simultaneous multiobjective optimization of interface pressure and subcutaneous tissue stresses through coupled workflows; and (2) quantitatively analyzing the relationship between critical harness design parameters and their biomechanical performance. The proposed methodology offers a generalized paradigm for optimizing wearable robotic systems through computational mechanics and data-driven parameter exploration.
Description of methodology
The overall research framework diagram is shown in Figure 1. This study systematically investigates two critical parameters influencing the harness system, structural configurations and material properties, aiming to optimize human–harness interface pressure distribution and enhance biomechanical compatibility.
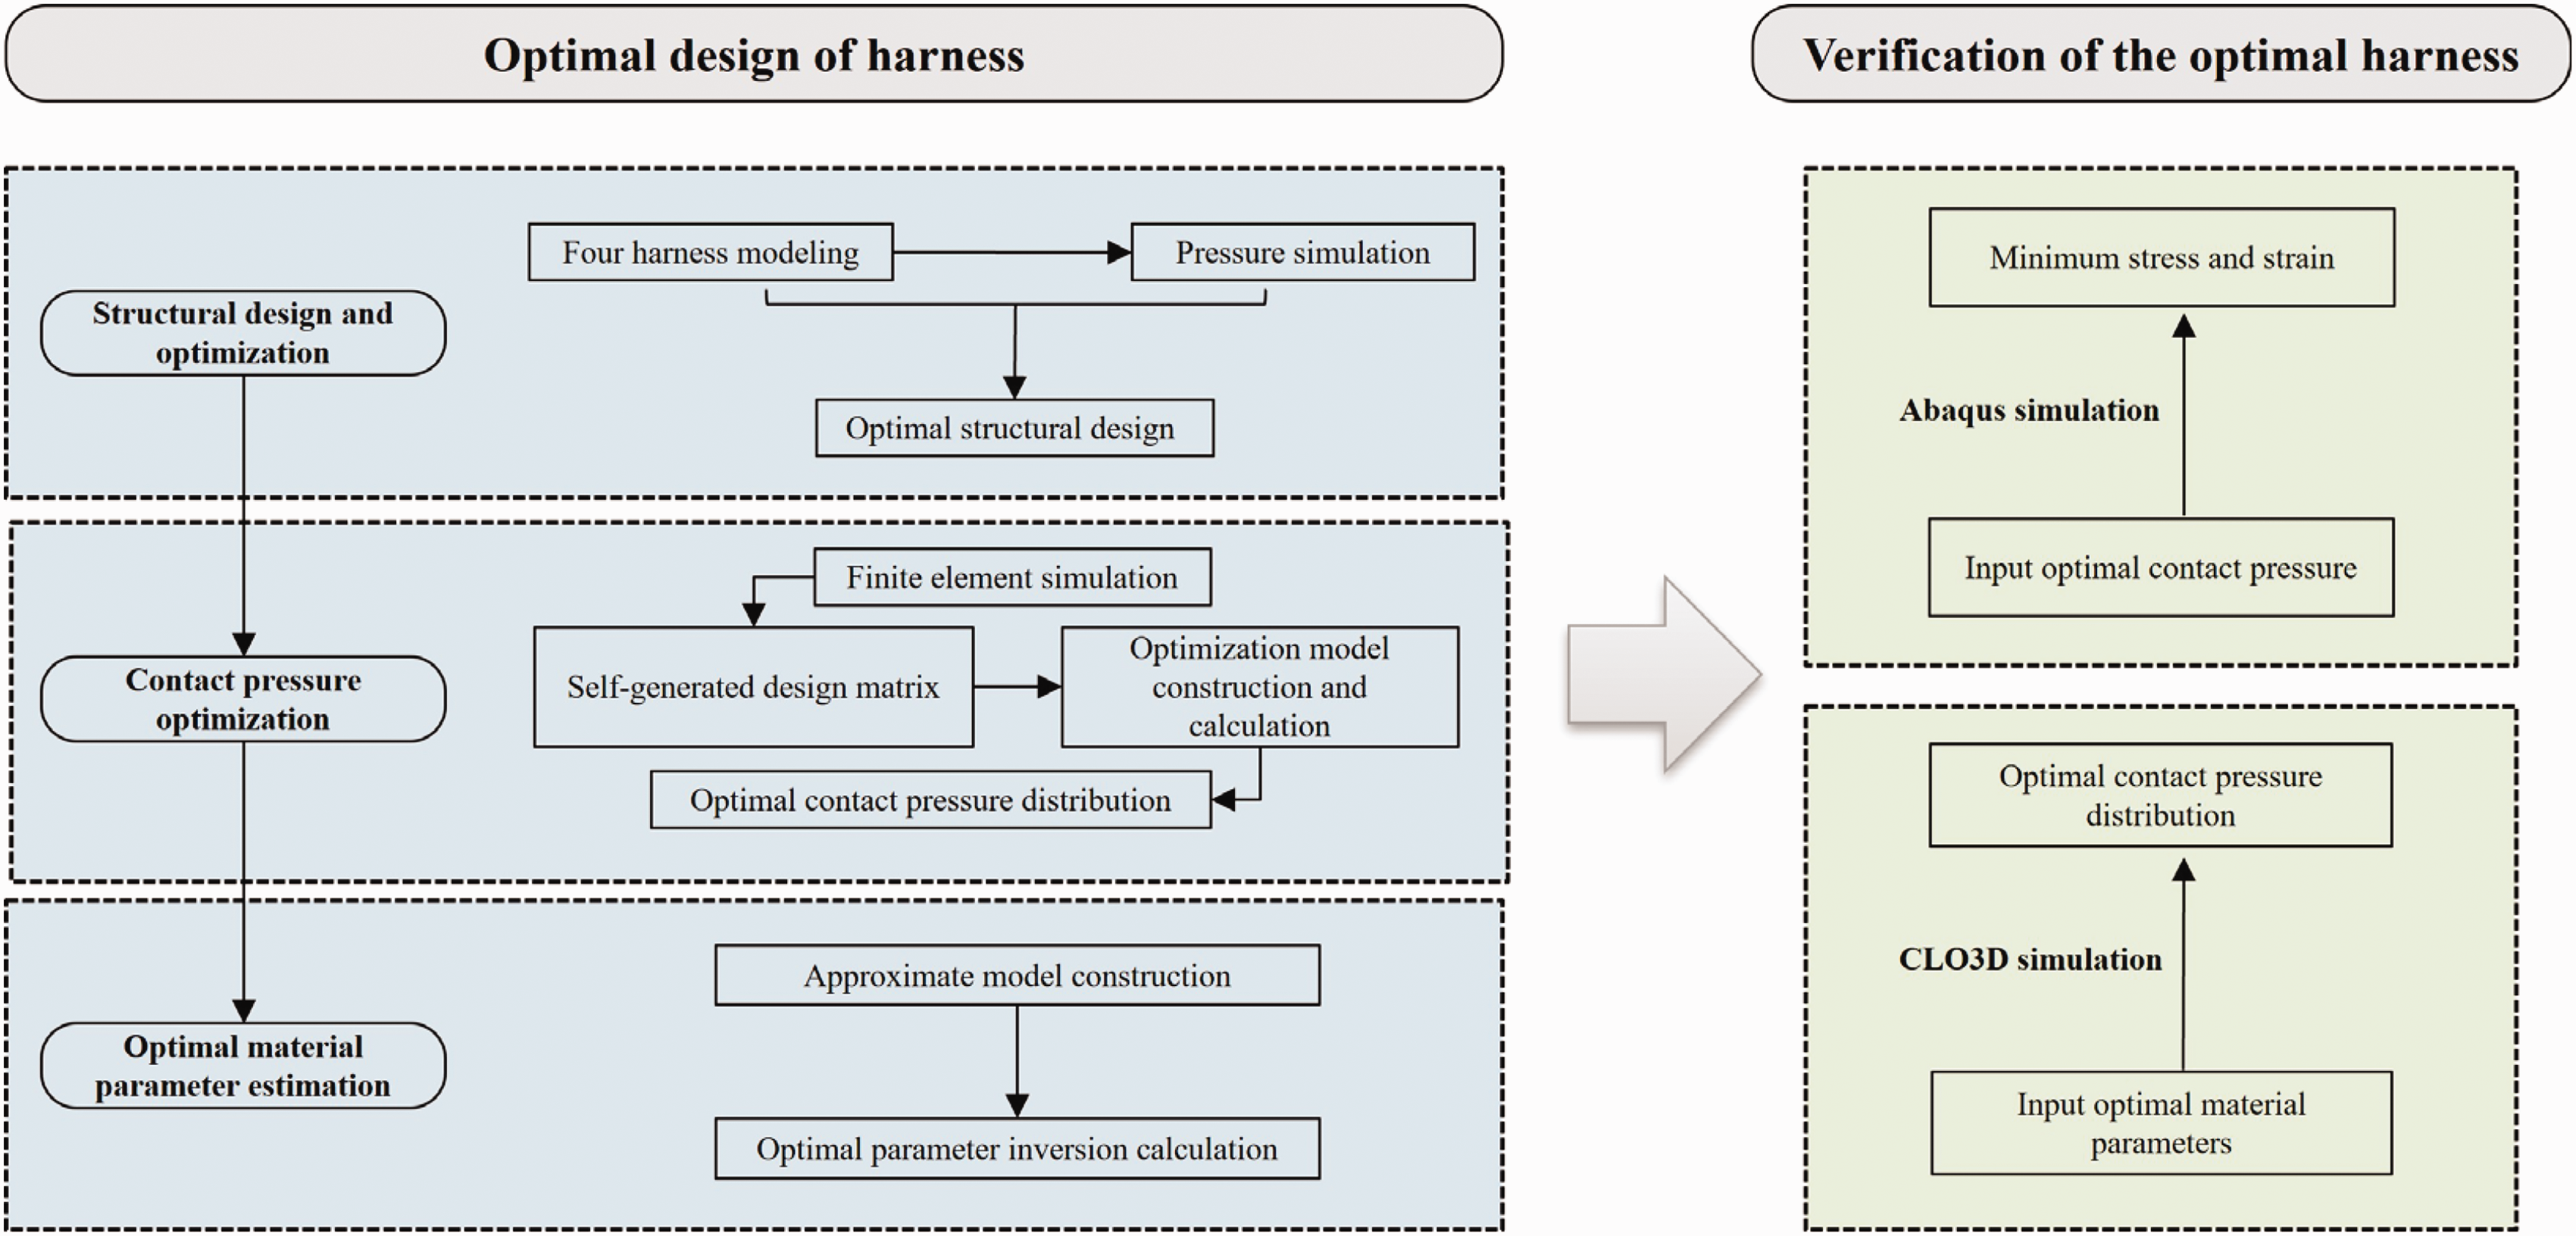
The framework.
Harness digital design and structural optimization
Digital design
The CLO3D garment modeling platform (CLO Virtual Fashion, Seoul, South Korea) was utilized to conduct physics-based simulations of textile mechanics and real-time dynamic fitting visualization.12,22 By integrating a digital twin framework, the system facilitates predictive biomechanical modeling of human–harness interactions. The pressure analysis module quantifies interface pressure magnitude and distribution under both static and dynamic loading conditions, enabling precise evaluation of harness fit and mechanical behavior.
Although the human–harness interface plays a crucial role in gait biomechanics during BWS training, it has been underexplored in prior research. 23 The harness, functioning as a human–robot interface, consists of three primary components: shoulder straps, waist straps, and leg straps. As illustrated in Figure 2, four harness designs with distinct structural characteristics were assessed, representing the most used and commercially available harness types.
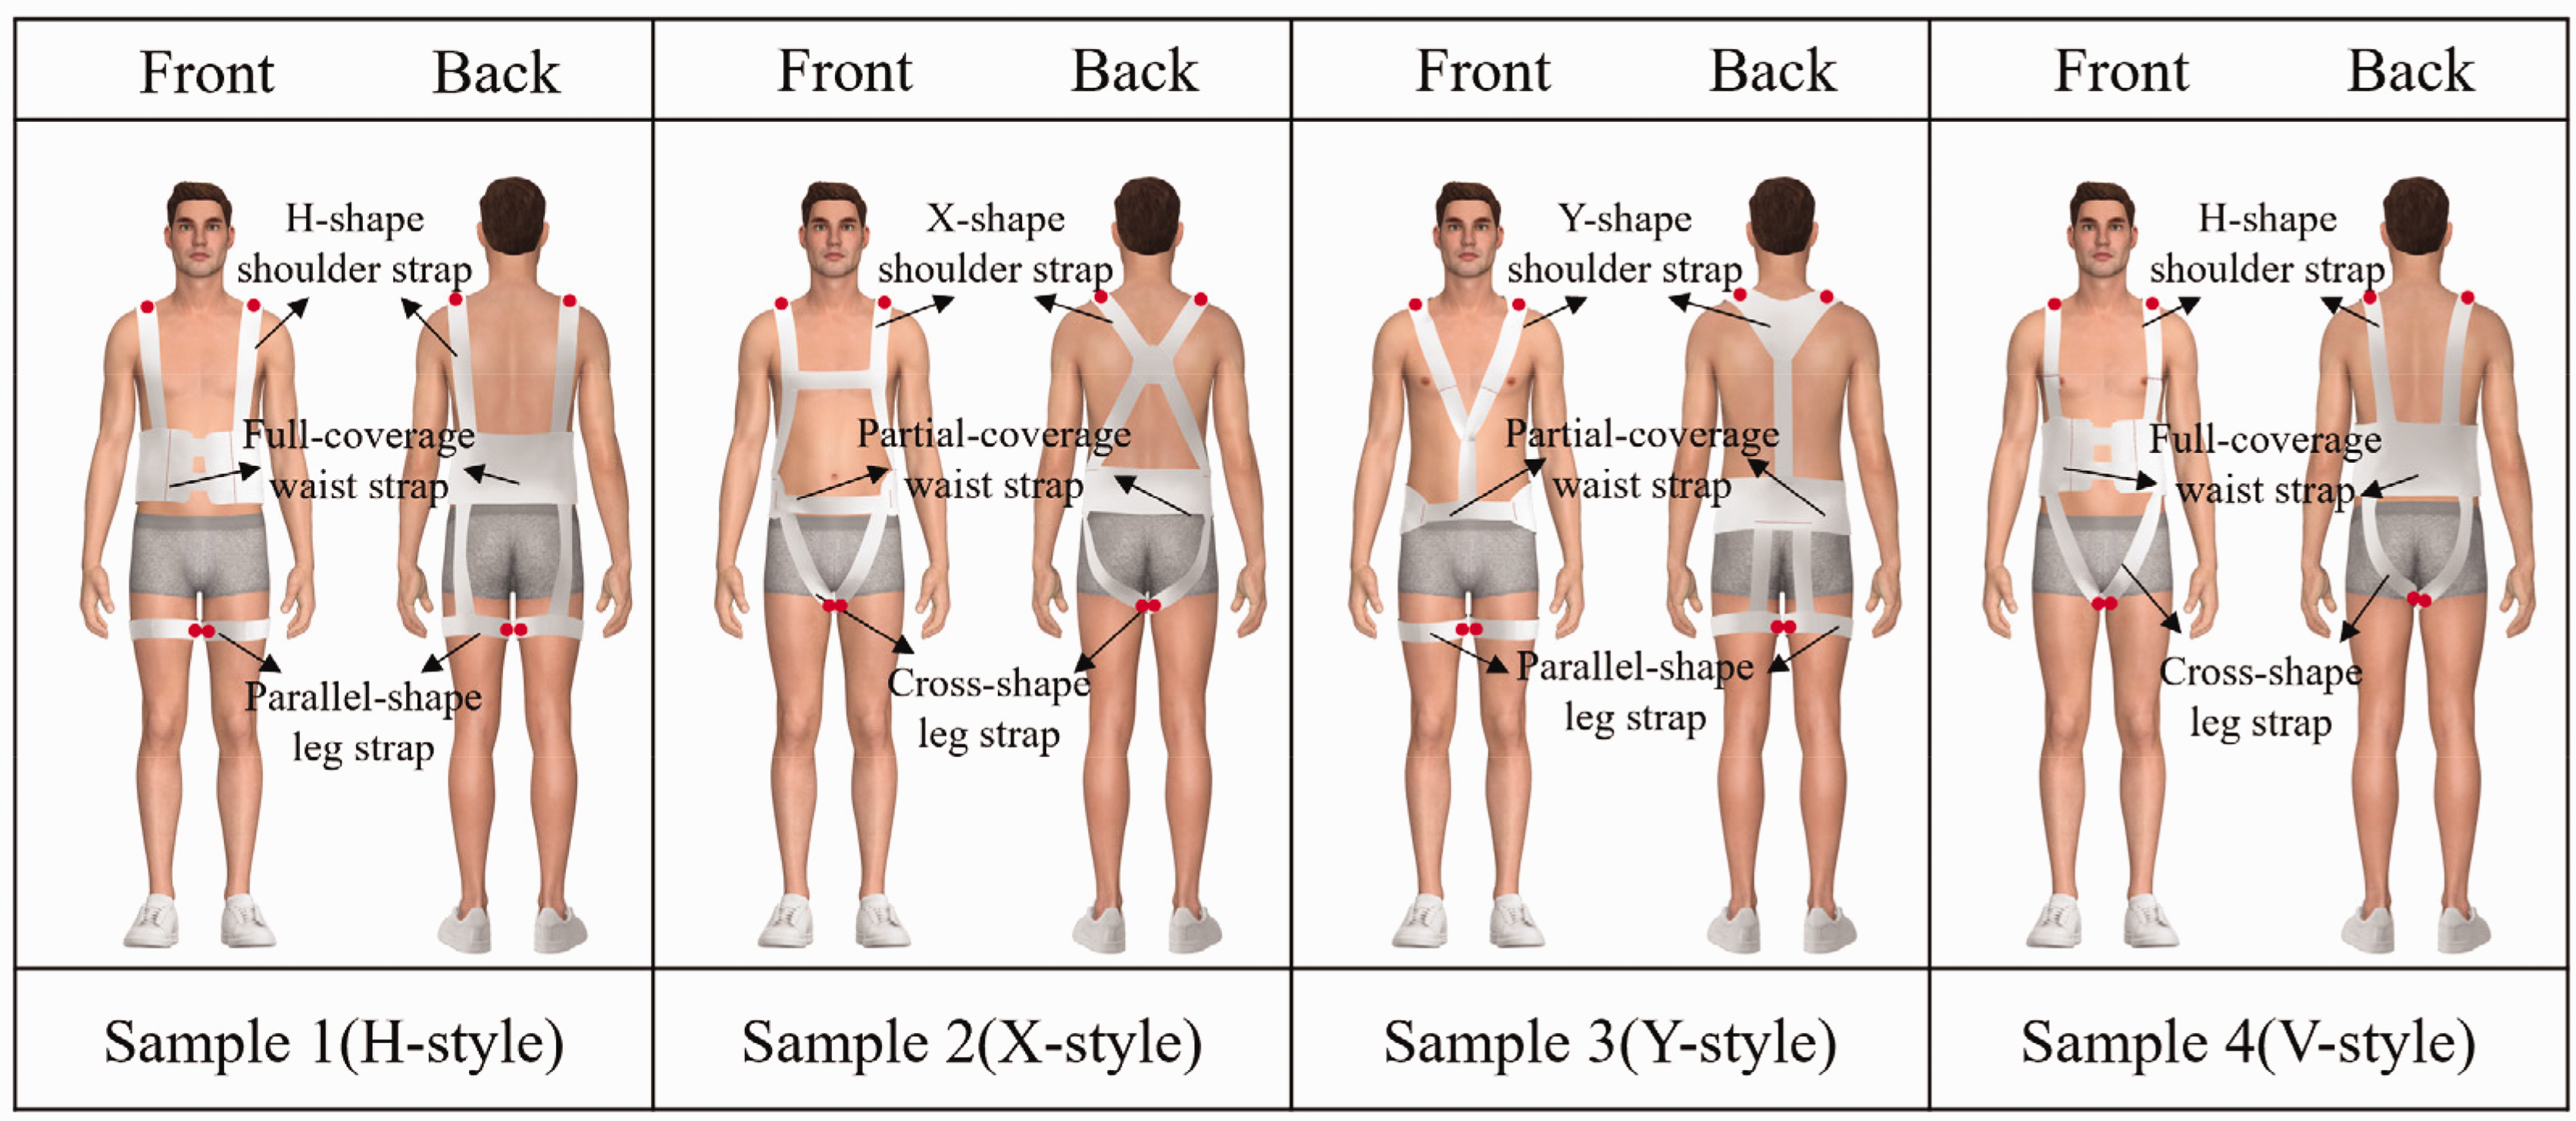
Four kinds of harness samples.
On the one hand, these configurations reflect variations commonly observed in existing rehabilitation harnesses, enabling us to evaluate and compare their mechanical performance systematically. On the other hand, each design provides a distinct pattern of load distribution and contact area coverage on the body, influencing how forces are transmitted through the harness.
Based on structural characteristics, four kinds of harness samples were named H-style (H-shape shoulder strap, full-coverage waist strap and parallel-shape leg strap), X-style (X-shape shoulder strap, partial-coverage waist strap, and cross-shape leg strap), Y-style (Y-shape shoulder strap, partial-coverage waist strap, and parallel-shape leg strap), and V-style (H-shape shoulder strap, full-coverage waist strap, and cross-shape leg strap).
Pressure simulation
The CLO3D pressure simulation module was employed to collect biomechanical data from eight anatomical landmarks, covering bilateral shoulders, lumbar regions, and femoral segments. These points were chosen to represent the primary load-bearing and high-contact regions between the harness and the human body.
For the upper body, landmarks were selected along the shoulders and waist where strap loads are concentrated. For the lower body, measurement points were positioned at the thighs, which are the major support and constraint zones across harness.
The measurement points and their corresponding pressure value identifiers included shoulder left (S_L), shoulder right (S_R), waist front (W_F), waist back (W_B), waist left (W_L), waist right (W_R), leg left (L_L), and leg right (L_R).
To standardize shoulder and leg measurement locations (indicated by red markers in Figure 2), shoulder measurements were positioned along the midline of the trapezius region, approximately aligned with the acromioclavicular joint bilaterally. Leg pressure points were defined approximately 3–5 cm below the perineum, targeting the upper medial thigh where the leg straps made direct and stable contact across all harness configurations.
To ensure both safety and comfort, two optimization objectives were established: preventing interface pressures from exceeding critical physiological thresholds (safety constraint), and ensuring uniform interface pressure distribution within physiologically optimal ranges (comfort requirement). Three quantitative pressure metrics were analyzed: peak pressure magnitude (evaluating localized excessive force risks), mean pressure values (assessing overall pressure levels), and pressure distribution variability (standard deviation, quantifying uniformity).
Specifically, peak pressure reflects localized mechanical loading and has been associated with tissue injury risk in pressure ulcer and rehabilitation studies. 24 Mean pressure quantifies the average load across the contact surface, serving as a general indicator of overall interface pressure.25,26 Pressure distribution variability, expressed as the standard deviation of local pressures, reveals the degree of uniformity in load transmission and is used to assess pressure redistribution performance and perceived comfort.27,28
It should be emphasized that during repeated simulations with the identical harness, interface pressure discrepancies may occur at the same anatomical locations due to harness slippage. Therefore, to accurately represent the overall loading characteristics, the reported pressure data were derived from the averaged values of 10 repeated donning simulations.
Figure 3 presents a comparative heatmap manually generated based on statistical averages of pressure data from multiple wearing simulations in CLO3D. This visualization effectively demonstrates the pressure distribution patterns across the body surface, identifies localized high-pressure concentration zones, and enables systematic inter-harness comparisons within specific anatomical regions.
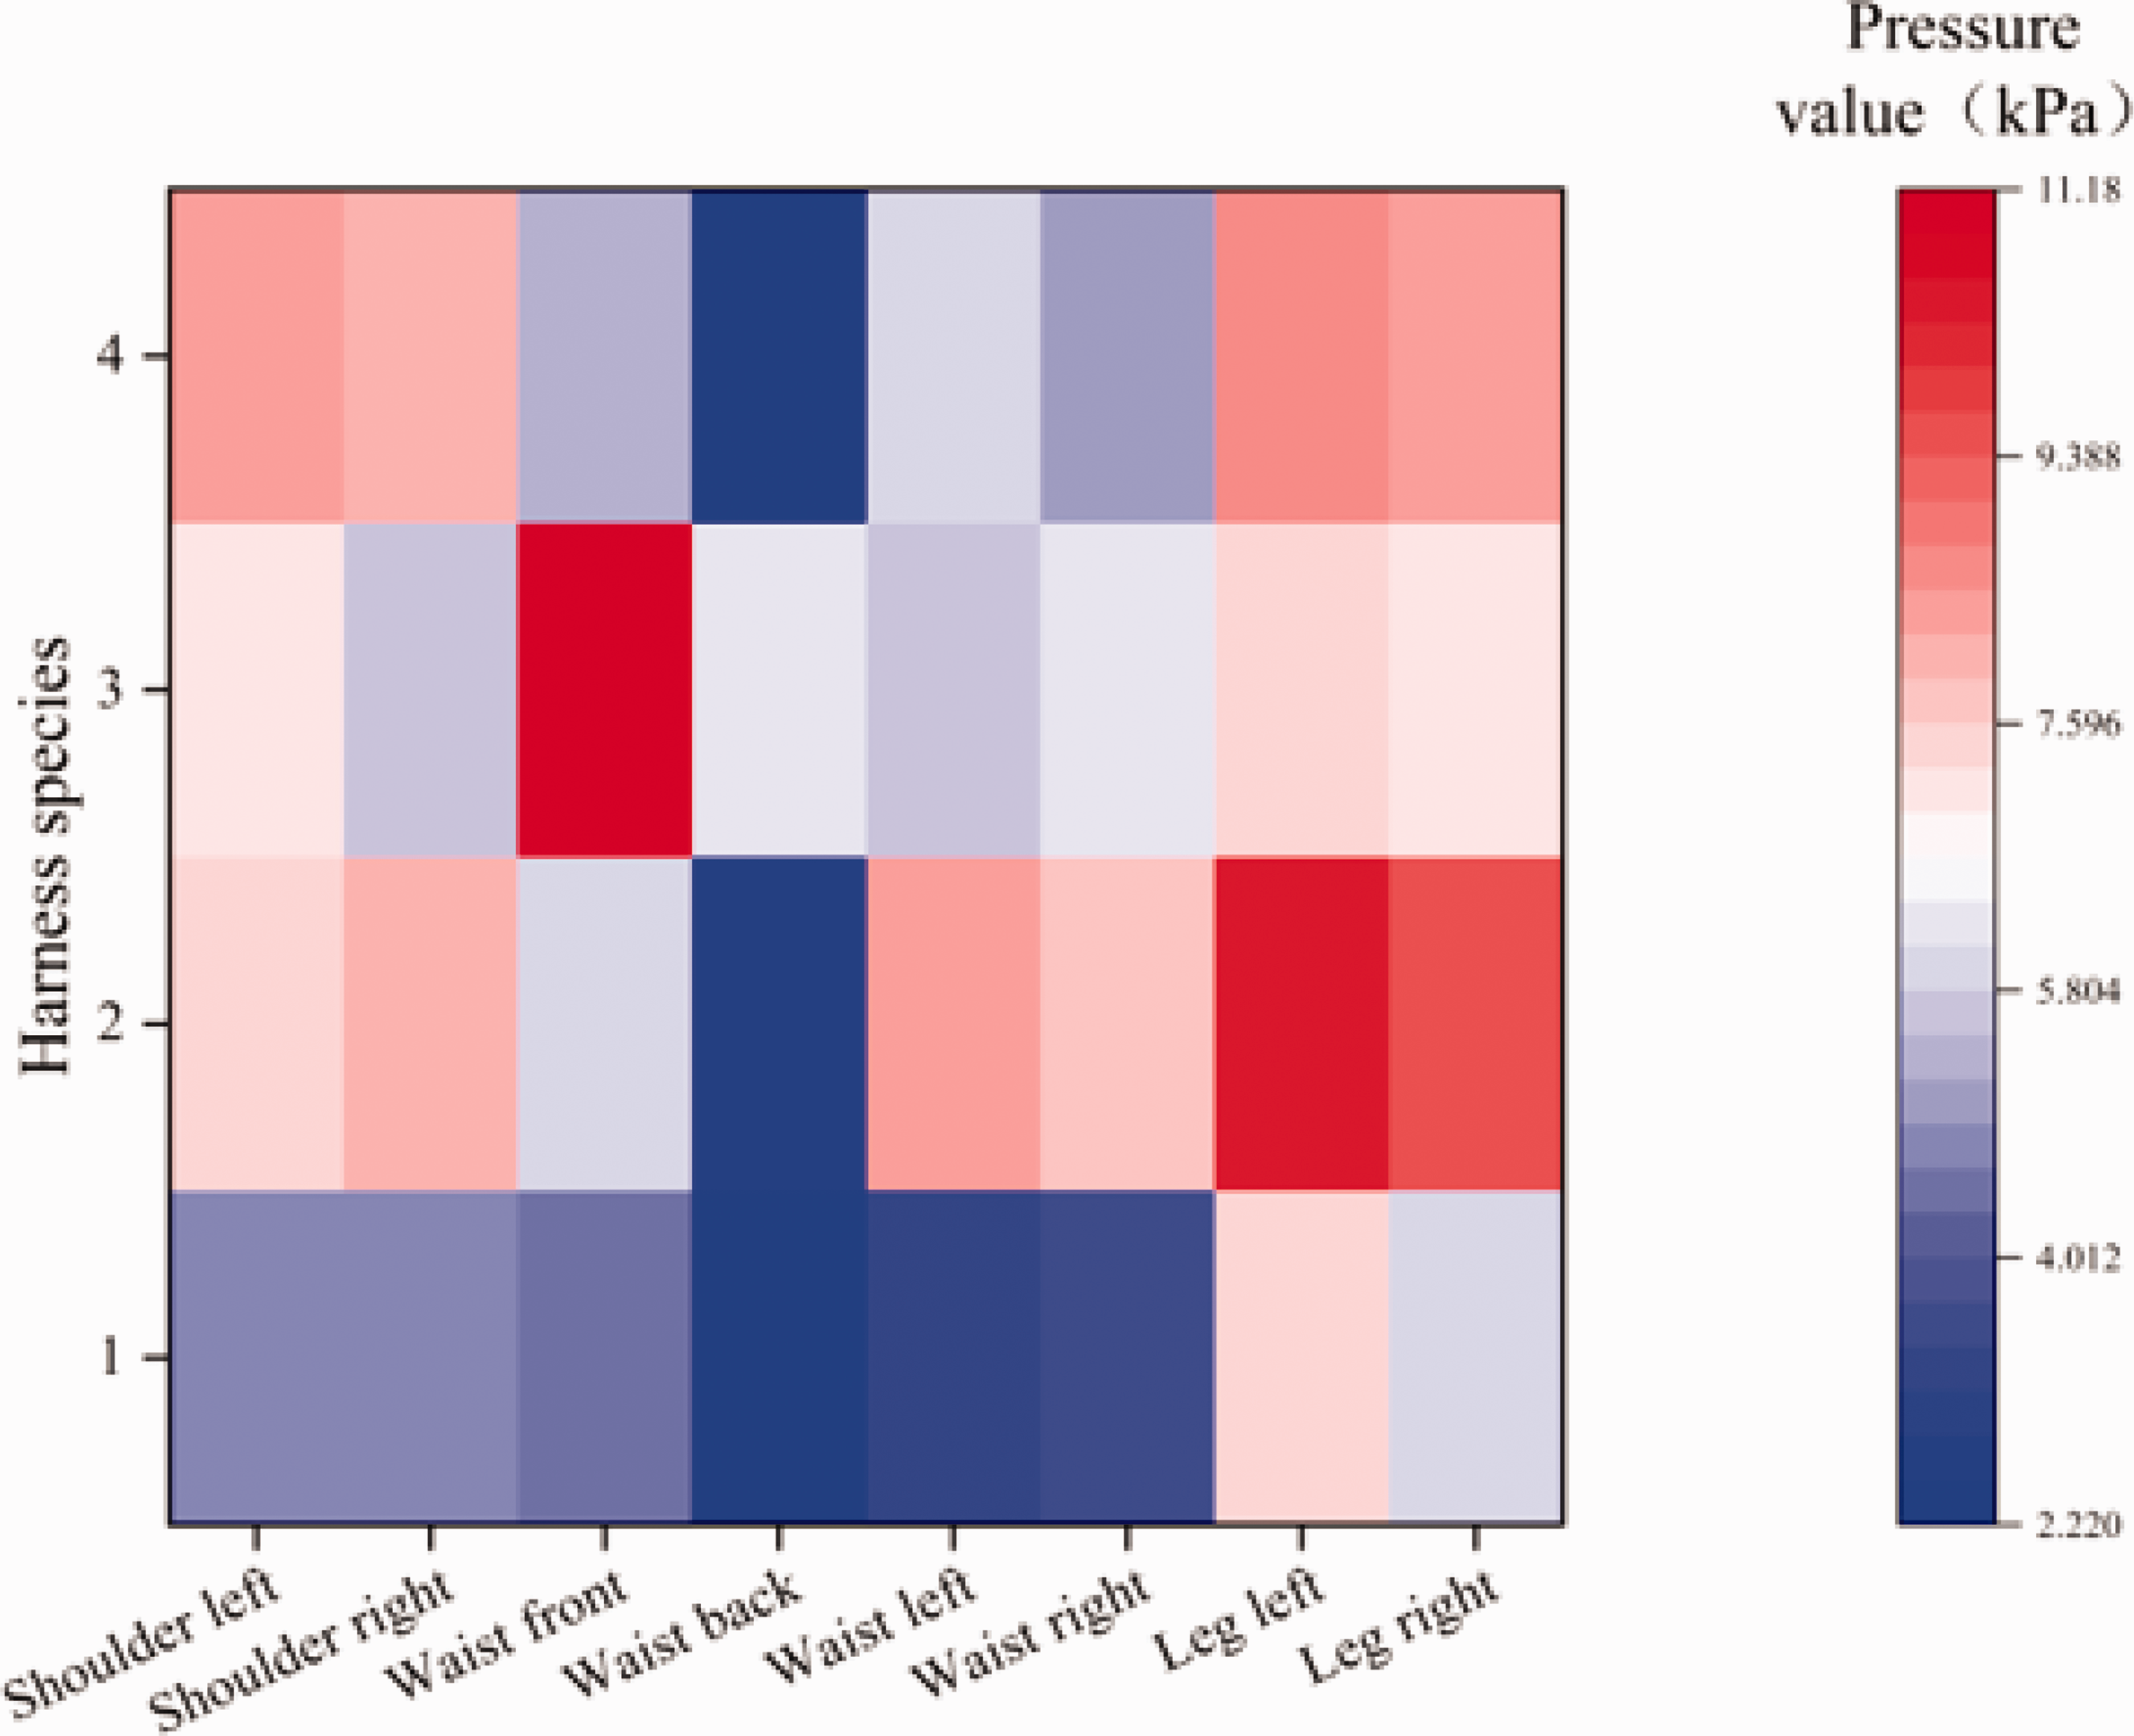
Pressure heat maps of the four groups of weight-support harness.
Weight analysis and comprehensive evaluation
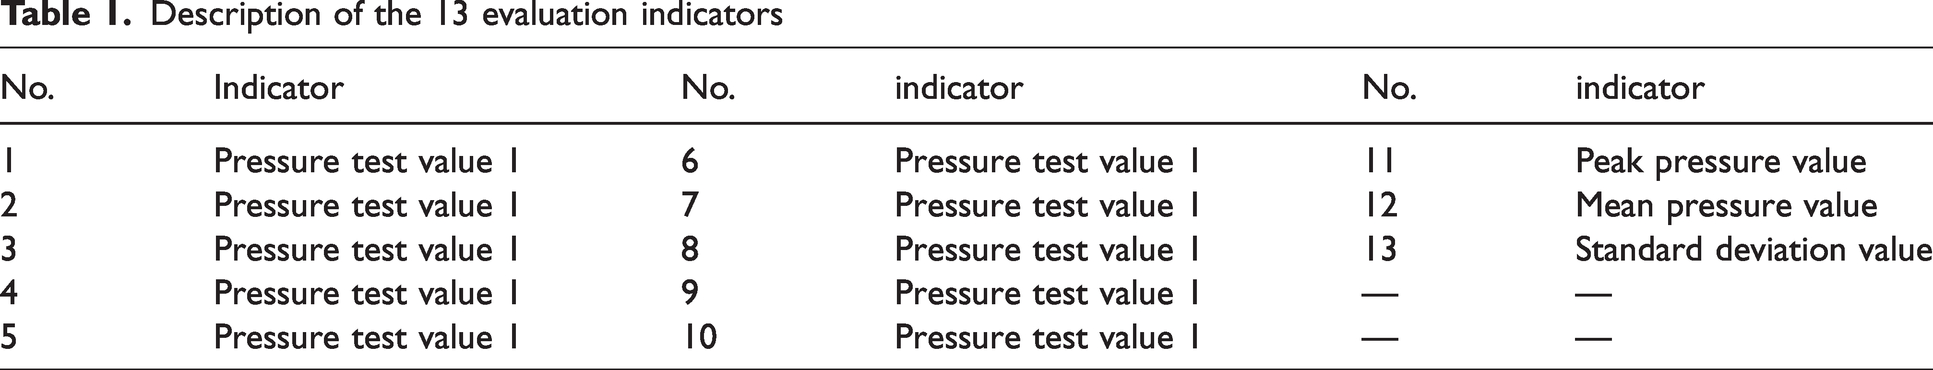
To ensure an objective and robust evaluation of harness pressure performance across multiple anatomical regions, this study adopted the Criteria Importance Through Intercriteria Correlation (CRITIC) method to assign weights to 13 evaluation indicators (as listed in Table 1). To comprehensively evaluate the mechanical performance of different harness configurations, in line with the pressure measurement section presented earlier, three key pressure metrics were adopted: peak pressure, mean pressure, and pressure distribution variability. These indicators have been widely recognized in prior biomechanical and ergonomic research for their relevance to comfort, safety, and soft tissue protection.
Description of the 13 evaluation indicators
Compared to subjective weighting approaches such as expert scoring or the analytic hierarchy process (AHP), CRITIC provides a data-driven framework that simultaneously considers the amount of information each indicator carries (via standard deviation) and the degree of redundancy between indicators (via intercriterion correlation coefficients). 29
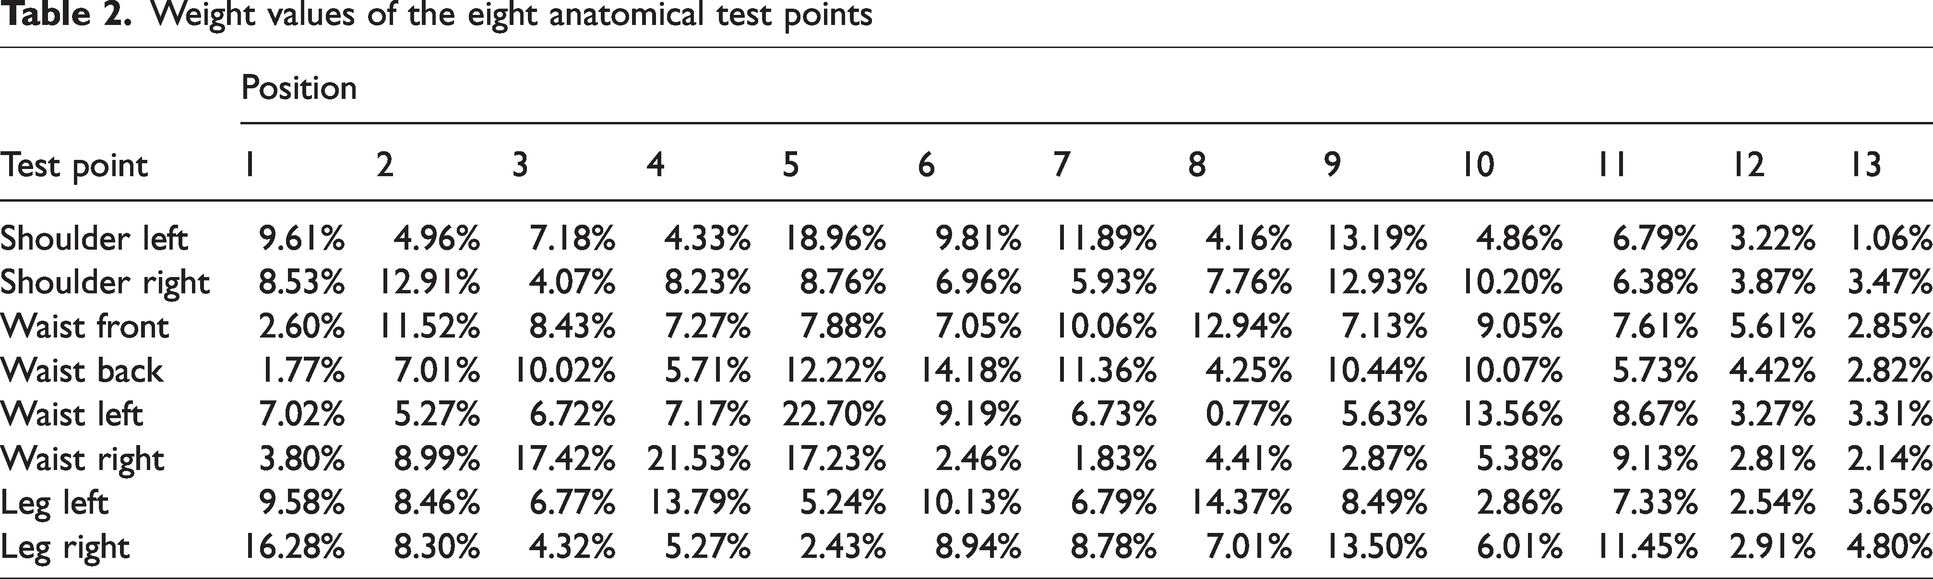
The computational workflow for weight determination proceeds through three sequential steps, and the weight values are listed in Table 2.
Weight values of the eight anatomical test points
Construct the initial evaluation matrix X, where n samples and m evaluation indicators are systematically organized as specified in
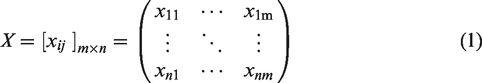
For each standardized criterion j, the standard deviation (δj) is computed to quantify data dispersion, while the correlation coefficient (rij, where i, j = 1, 2, …, n) between criteria is calculated.
2. Compute the information content Cj for each evaluation index using
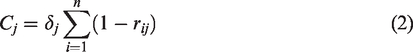
where higher Cj values indicate greater informational significance of the jth indicator within the evaluation framework.
30
3. Determine the final weight Wj for each evaluation index through normalization of information content
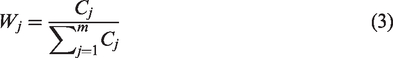
where higher Wj values correspond to greater decision-making significance of the jth indicator.
Using the computed weights, the technique for order preference by similarity to ideal solution (TOPSIS) method was applied to compute the composite performance scores for each harness configuration across bilateral shoulder regions, anterior/posterior waist segments, and left/right thigh sections.
The TOPSIS method was selected as the core decision-making tool to evaluate harness configurations. Unlike qualitative ranking or subjective scoring systems, TOPSIS quantitatively measures the relative closeness of each design to an ideal solution across multiple performance indicators. This feature is suitable for our study, where trade-offs between safety (minimizing peak values) and comfort (achieving distribution uniformity) must be balanced. In addition, TOPSIS complements the CRITIC weighting system, which assigns weights based on data dispersion and intercriterion correlation, ensuring an unbiased and data-driven evaluation process.
Employing the standardized pressure sample matrix collected in this study, the weighted matrix (vij =Wj × rij) was calculated using the CRITIC-derived weights. The ideal solution A+ (minimum pressure) and the negative ideal solution A− (maximum pressure) were determined by taking the column-wise minima and maxima of the weighted matrix, respectively
31
:

The Euclidean distances to these reference points were computed as
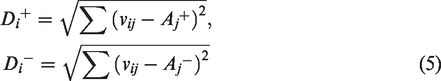
The relative closeness coefficient Ci, serving as the ranking criterion, was then derived:
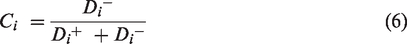
The optimal design configuration, based on these weighted rankings, is summarized in Table 3.
Optimal design scheme
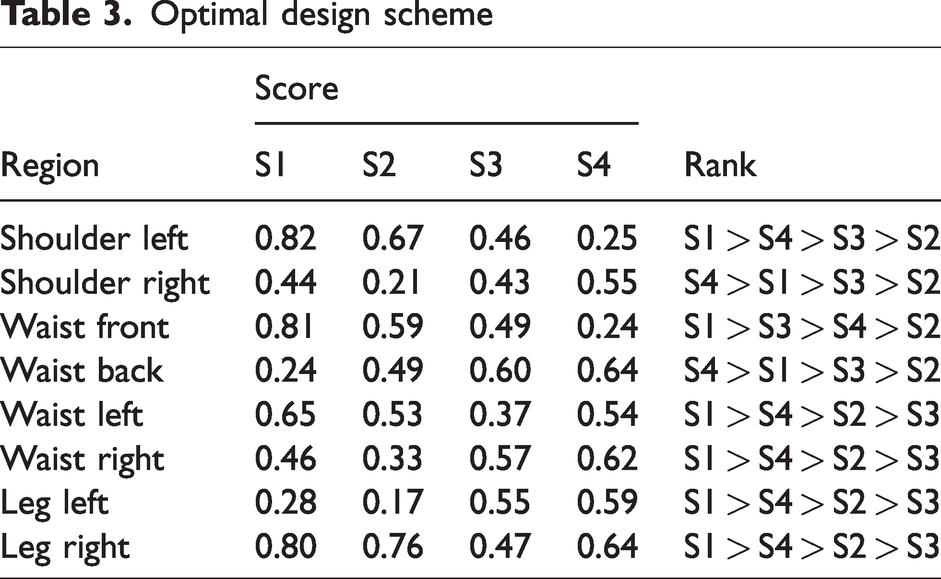
The final optimal design configuration was subsequently implemented in CLO3D, with the refined virtual prototype and its performance characteristics illustrated in Figure 4.
Optimal solution model: (a) planar view; (b) structural view; (c) wearing view.
Specifically, for the shoulder region, the H-shaped strap was selected, as it demonstrated the lowest average and peak pressures compared with the X-, Y-, and V-shaped alternatives. For the waist region, a full-coverage waist strap was adopted due to its broader contact area and better pressure distribution. For the leg region, the parallel-shaped leg strap was chosen over the cross-shaped strap, which exhibited higher peak pressure values and less uniform pressure profiles.
Numerical simulation
To evaluate the mechanical behavior of the harness under realistic wearing conditions, a FEA simulation framework was developed.
Model establishment
The computed tomography (CT) scan images of a healthy male subject (age 23 years, height 178 cm, mass 74 kg, body mass index 23.8 kg/m2) were imported into Mimics18.0 software (Materialise Inc., Leuven, Belgium) for 3D reconstruction. Subsequently, the models were imported into Geomagic Studio 11 software (Geomagic, Inc., Research Triangle Park, NC, USA) for polygon processing and reconstruction into NURBS smooth surface models, thereby establishing personalized geometric models.
Furthermore, by importing anthropometric data derived from CT scans into the CLO3D wear simulation model and subsequently performing CT-based calibration of geometric modeling parameters and joint positions within the software, we ensured anatomical consistency of the resultant models. This methodological harmonization guarantees cross-platform simulation-result comparability.
The research was approved by the Shanghai Yangzhi Rehabilitation Hospital (SBKT-2022-008). Before the CT scan, informed consent has been obtained from the subject.
Simulation process
The human–harness pressure data simulated through CLO3D’s virtual fitting pressure mapping were imported into Abaqus/Standard version 6.14 (Simulia Inc., Providence, RI, USA) to simulate the interactive biomechanical process and assess the soft tissue stress–strain distribution in response to external loading conditions. As indicated by Table 4, the pressure values from eight critical measurement points were extracted.
Input pressure values
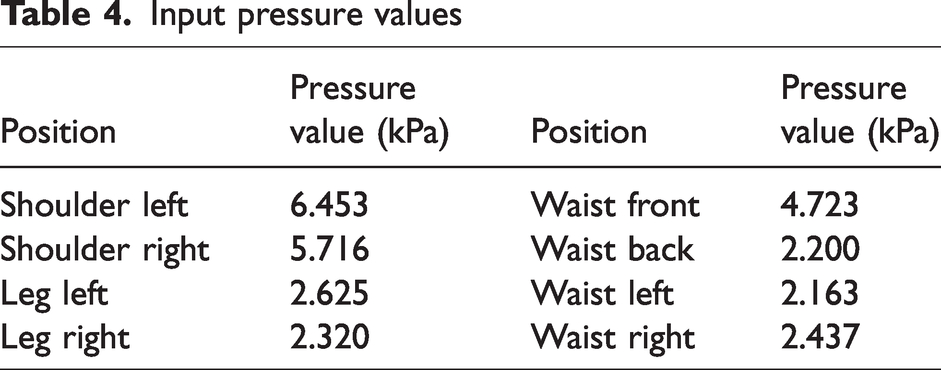
In the pressure simulation, the model analyzes pressure distribution and mechanical stresses under static loading conditions. While the simulation does not fully capture the dynamic complexity of forces during active movement, it effectively represents the major force application zones and their interactions with soft tissues. This approach allows us to identify potential high-pressure areas that may cause discomfort or soft tissue injury, providing valuable insights into harness design improvements.
FEA
The personalized 3D human model was analyzed in Abaqus using a structured FEA framework. Mesh discretization was performed in HyperMesh (version 11.0, Altair Engineering, Inc., Executive Park, CA, USA), generating a grid of 927,000 linear tetrahedral elements, with convergence studies confirming an optimal balance between computational efficiency and simulation accuracy.
The material properties of skin, fat, muscle, and bone tissues were defined based on validated constitutive laws derived from the literature. Skin was modeled as a linear elastic material, whereas both fat and muscle tissues were modeled as hyperelastic, nearly incompressible soft tissues using the first-order Ogden model. These parameters were derived from in vivo and ex vivo experimental studies reported by Hedrich et ak., 32 Hadid et al., 20 and Fallahnezhad et al. 33 Bone was treated as a rigid body, given its minimal deformation under harness-related loading conditions (detailed parameters are given in Table 5). 34
Detailed material properties of our model
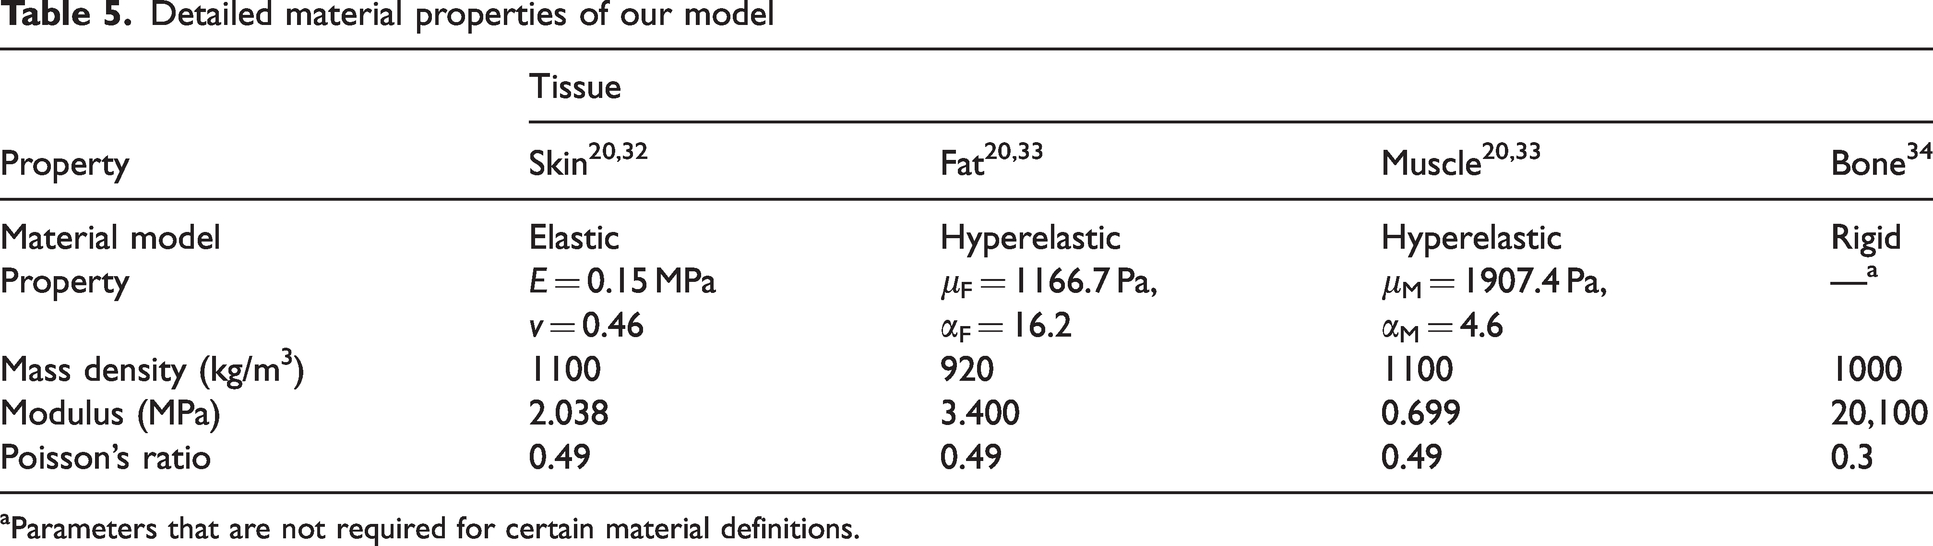
Parameters that are not required for certain material definitions.
Boundary conditions constrained lower extremities to simulate weight-bearing, whereas external loads were applied according to CLO3D-derived pressure distributions.
For each simulation, peak von Mises stress and principal shear strain values in the skin at eight critical anatomical measurement points were computationally extracted using MATLAB R2020a (The MathWorks Inc., Natick, Massachusetts, USA).
In addition, we explicitly acknowledge the limitations inherent in single-subject modeling and emphasize the necessity for future investigations to incorporate a broader spectrum of body morphologies, including but not limited to elderly individuals, pediatric populations, and patients with musculoskeletal conditions.
Harness pressure optimization
Wearer comfort during use remains underexplored, and harness designs seldom integrate biomechanical factors of the user.35,36 To improve comfort and biomechanical performance, an optimization framework was developed to enhance pressure distribution. Given its advanced simulation automation and design optimization capabilities, iSIGHT (Dassault Systèmes Deutschland, Hamburg, Germany) was employed to execute the optimization process.
Problem definition
The optimization of human–harness interface pressure is formulated as a multiobjective problem integrating FEA with iSIGHT optimization techniques. This methodology iteratively adjusts input pressures at designated anatomical measurement points to minimize global stress–strain responses in the human body model. Eight critical anatomical regions were systematically evaluated: Shoulder Left Stress (S_L_S), Shoulder Right Stress (S_R_S), Shoulder Left Strain (S_L_E), Shoulder Right Strain (S_R_E), Waist Front Stress (W_F_S), Waist Back Stress (W_B_S), Waist Left Stress (W_L_S), Waist Right Stress (W_R_S), Waist Front Strain (W_F_E), Waist Back Strain (W_B_E), Waist Left Strain (W_L_E), Waist Right Strain (W_R_E), Leg Left Stress (L_L_S), Leg Right Stress (L_R_S), Leg Left Strain (L_L_E), and Leg Right Strain (L_R_E). Initial pressure parameters are derived from CLO3D simulation of the optimized harness configuration, whereas baseline stress–strain data were obtained through Abaqus computational modeling. The optimization objective focuses on determining the optimal pressure distribution across all measurement points to concurrently minimize biomechanical stress–strain responses and maintain biological tolerability thresholds.
iSIGHT model configuration
The Abaqus-based human body model was integrated into iSIGHT for automated optimization. Figure 5 illustrates the workflow implemented in iSIGHT.
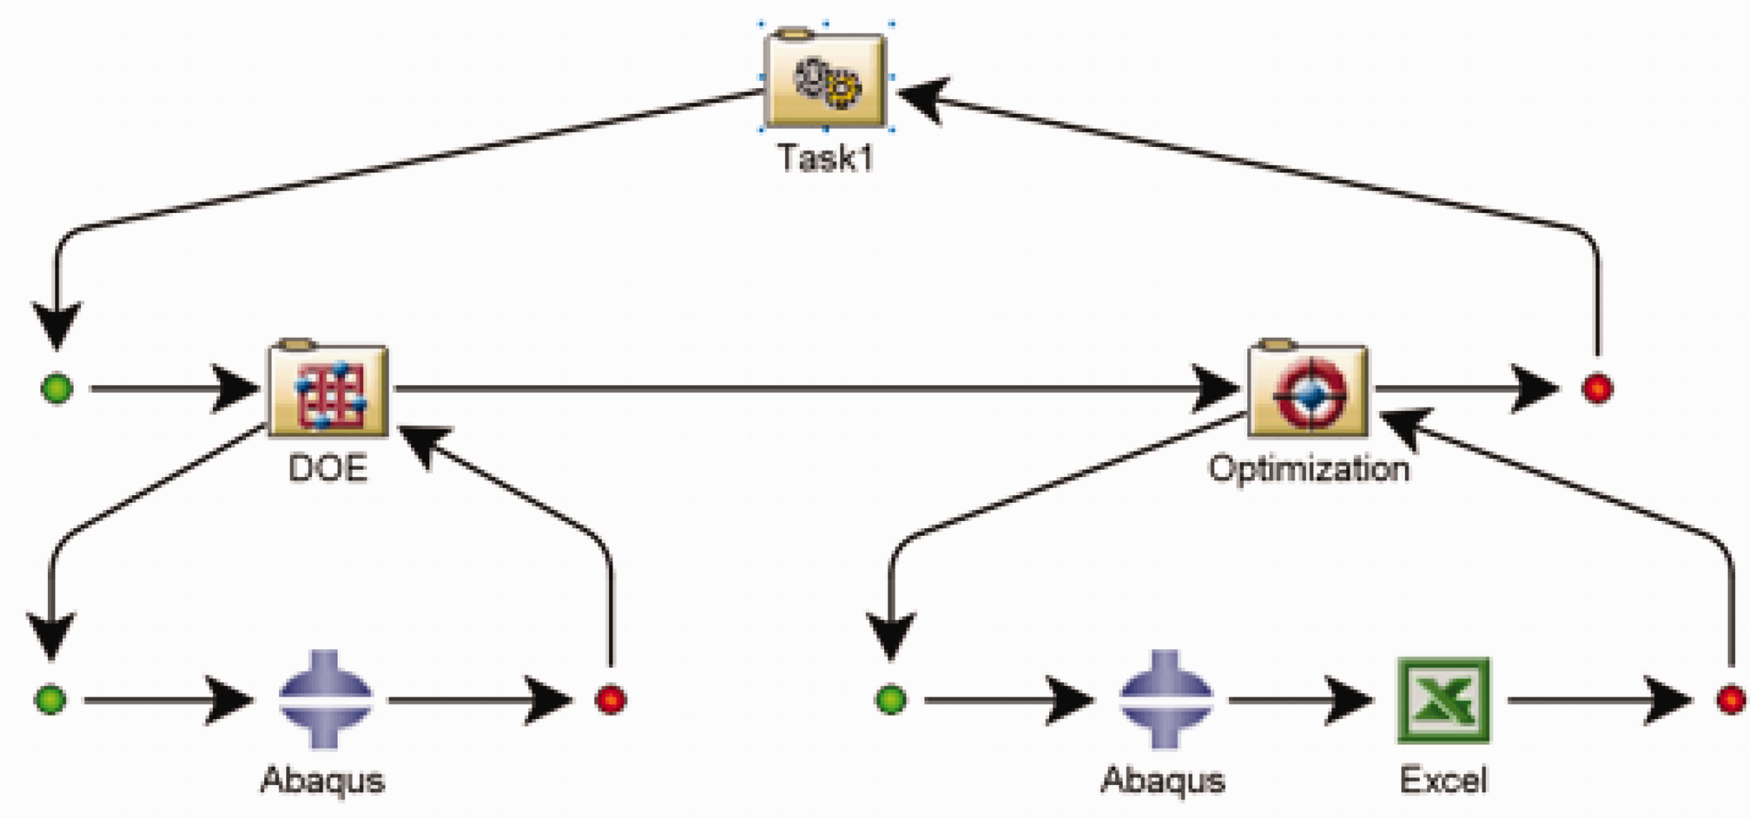
Workflow Task 1 in iSIGHT.
The optimization workflow adopted a two-stage strategy comprising design of experiments (DOE) and optimization algorithm implementation. 37 In the DOE phase, variable matrices were systematically sampled across predefined ranges to identify influential parameters, whereas preliminary analysis screened the design space and provided estimated optimal parameter sets. Subsequently, the optimization phase utilized DOE results as initial design references, followed by iterative refinement through global search algorithms. 38 During each iteration, FEA models were automatically executed, with iSIGHT algorithmic adjustments progressively refining the solution to enhance convergence efficiency.
Parameter input
To ensure the global exploration capability of the algorithm, a global exploration method from the iSIGHT platform was selected. 39 Specifically, adaptive simulated annealing (ASA) was chosen due to its robust global search capability and proven efficiency in navigating high-dimensional and nonlinear optimization problems for the multiobjective optimization phase. Compared with other algorithms (e.g., genetic algorithms and particle swarm optimization), ASA demonstrated superior convergence performance in our preliminary trials within the iSIGHT environment, especially in problems involving complex biomechanical constraints and pressure response feedback loops. 40
During mathematical model formulation, both rehabilitation harness comfort requirements and necessary support forces were holistically evaluated, with model optimization constrained within biologically tolerable pressure thresholds. 41
The mathematical formulation is defined as
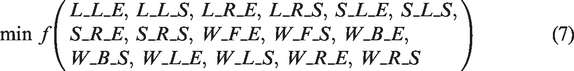
Equation (7) represents the objective function of the optimization process, which aims to minimize the overall stress and strain experienced across all relevant anatomical regions. This objective is central to improving harness comfort and reducing the risk of stress-related injuries.
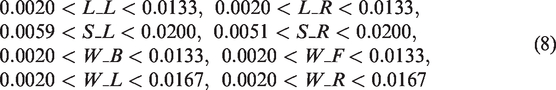
To ensure both the clinical safety and comfort of the rehabilitation harness design, our optimization model incorporated multiobjective constraints based on physiologically validated thresholds for interface pressure and internal soft tissue deformation.16–18,21 The constraints in the mathematical model are defined as follows:
The algorithm configuration established design variable optimization ranges equivalent to the initial pressure values extracted from CLO3D simulations. The ASA algorithm was implemented with explicitly defined parameters, while retaining default values for unspecified variables. Key parameter configurations included the number of designs for convergence check set to 5 and the maximum number of generated designs limited to 1000, ensuring systematic exploration of the design space.
Inverse calculation of optimal harness material parameters
Based on the optimal pressure values obtained through algorithmic optimization at various body locations, this study aims to inversely derive the optimal material parameters for the harness.
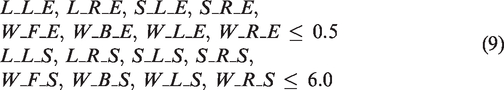
The workflow in iSIGHT for this task follows a process similar to that of the previous section, as depicted in Figure 6. Before applying the optimization algorithm for inverse calculation, a mathematical mapping model was first established to link the material parameters of the harness with the corresponding contact pressures.
Workflow Task 2 in iSIGHT.
Construction of approximate contact pressure model and error analysis
Preliminary investigations integrating textile mechanical testing and experimental trials, 42 identified fabric material as a critical determinant of wearing comfort, consequently establishing material parameters of the harness as pivotal considerations in human–harness interface design.
Based on their fundamental roles in governing human–device interface mechanics, this study selects warp strength (σT), weft strength (σW), density (ρ), and thickness (T) as core material parameters for optimization. Specifically, warp and weft strengths modulate stress distribution under biomechanical loading, directly influencing pressure concentration effects at the interface.9,43 Density regulates interface friction, compressive resistance, and porosity-mediated mechanisms, with optimal ranges effectively mitigating shear-induced tissue damage.44–48 Thickness governs mechanical compliance and contact area, critically determining load-spreading efficiency.44,49 Through synergistic optimization of these material parameters in framework, clinically significant pressure distribution modulation has been achieved.
This study employed the optimal Latin hypercube design methodology to guide DOE, generating a sample matrix comprising 120 experimental points. This configuration ensures the constructed design matrix simultaneously satisfies the fundamental requirements for mathematical model fitting while achieving comprehensive coverage of the design space.50,51 Pressure analysis was systematically performed using CLO3D software for each material parameter combination.
Based on systematic analysis of harness–body contact areas and the distribution characteristics of eight pressure measurement points, while considering anatomical symmetry to ensure balanced representation, adjacent measurement regions with similar pressure distribution characteristics and optimization objectives were consolidated. The original eight pressure measurement points were thus merged into four key regions: shoulder pressure (S), lumbar pressure (W1), anterior abdominal pressure (W2), and leg pressure (L).
Pressure measurements were recorded for each test group across the four anatomical regions. Mean pressure values were computed for each parameter combination, followed by comprehensive error analysis through multiple sampling iterations.
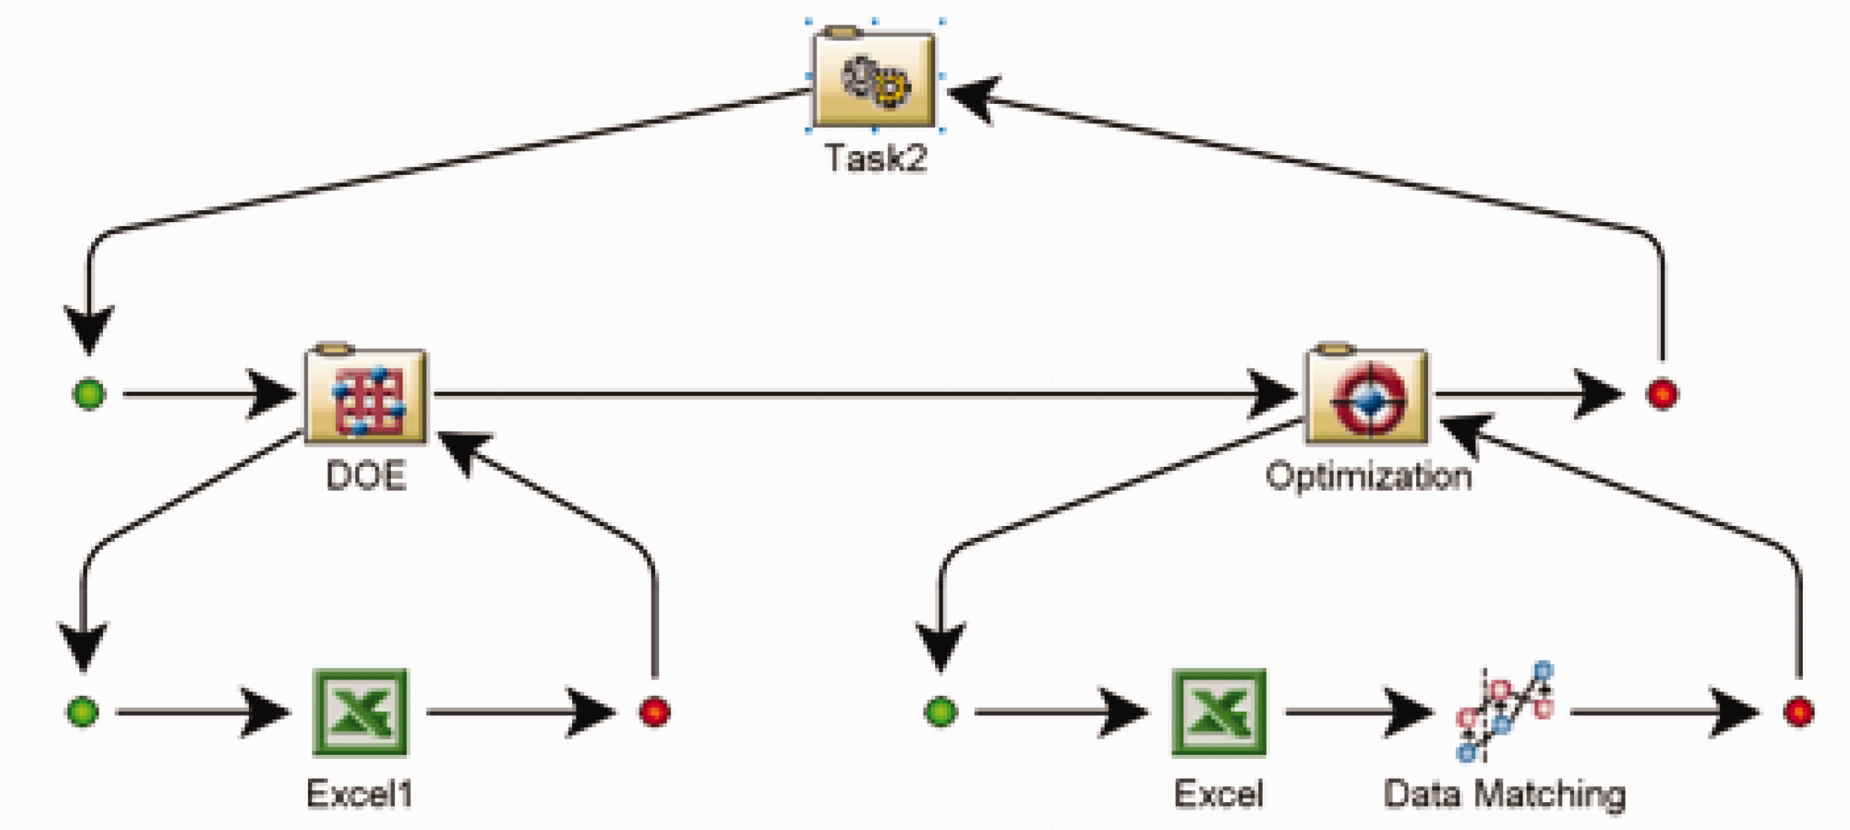
The linear regression, ridge regression, hierarchical regression, least absolute shrinkage and selection operator (LASSO) regression, and partial least squares regression (PLSR) were evaluated in MATLAB R2020a. Models were selected based on optimal R2 values approaching unity, with linear regression demonstrating superior performance across all regions. The comparative fitting results are presented in Figure 7.
Comparison between the real value and the predicted value.
Variance inflation factor (VIF) values remained below 10, confirming the absence of multicollinearity issues and validating model integrity. In addition, while the regional consolidation during function fitting may obscure individual pressure peaks, the robustness of our dataset ensures the validity of the fitted equations. The high R2 values and acceptable VIF levels confirm that the derived formulas meet the accuracy requirements for simulation purposes.
The derived formulas for the four regions (shoulder, lumbar, abdomen, and leg) were derived as follows (units for S, L, W1, and W2 are kPa):


Inversion algorithm selection
The optimization framework in iSIGHT was employed to solve for the material parameters using the derived regression models. In this approach, material parameters (σT, σW, ρ, T) were configured as variables, and regional pressures (S, L, W1, W2) were treated as targets based on the approximation models.
The ASA algorithm was selected due to its efficiency in global search and optimization, with parameter configurations consistent with those described in the preceding section. The objective function was defined based on the optimal contact pressures obtained from the previous optimization step, with target values as follows:

Results and discussion
Human–harness interface pressure optimization
The optimal pressure distribution, derived from minimizing the stress–strain values across each body part through systematic optimization, is presented in Figure 8.
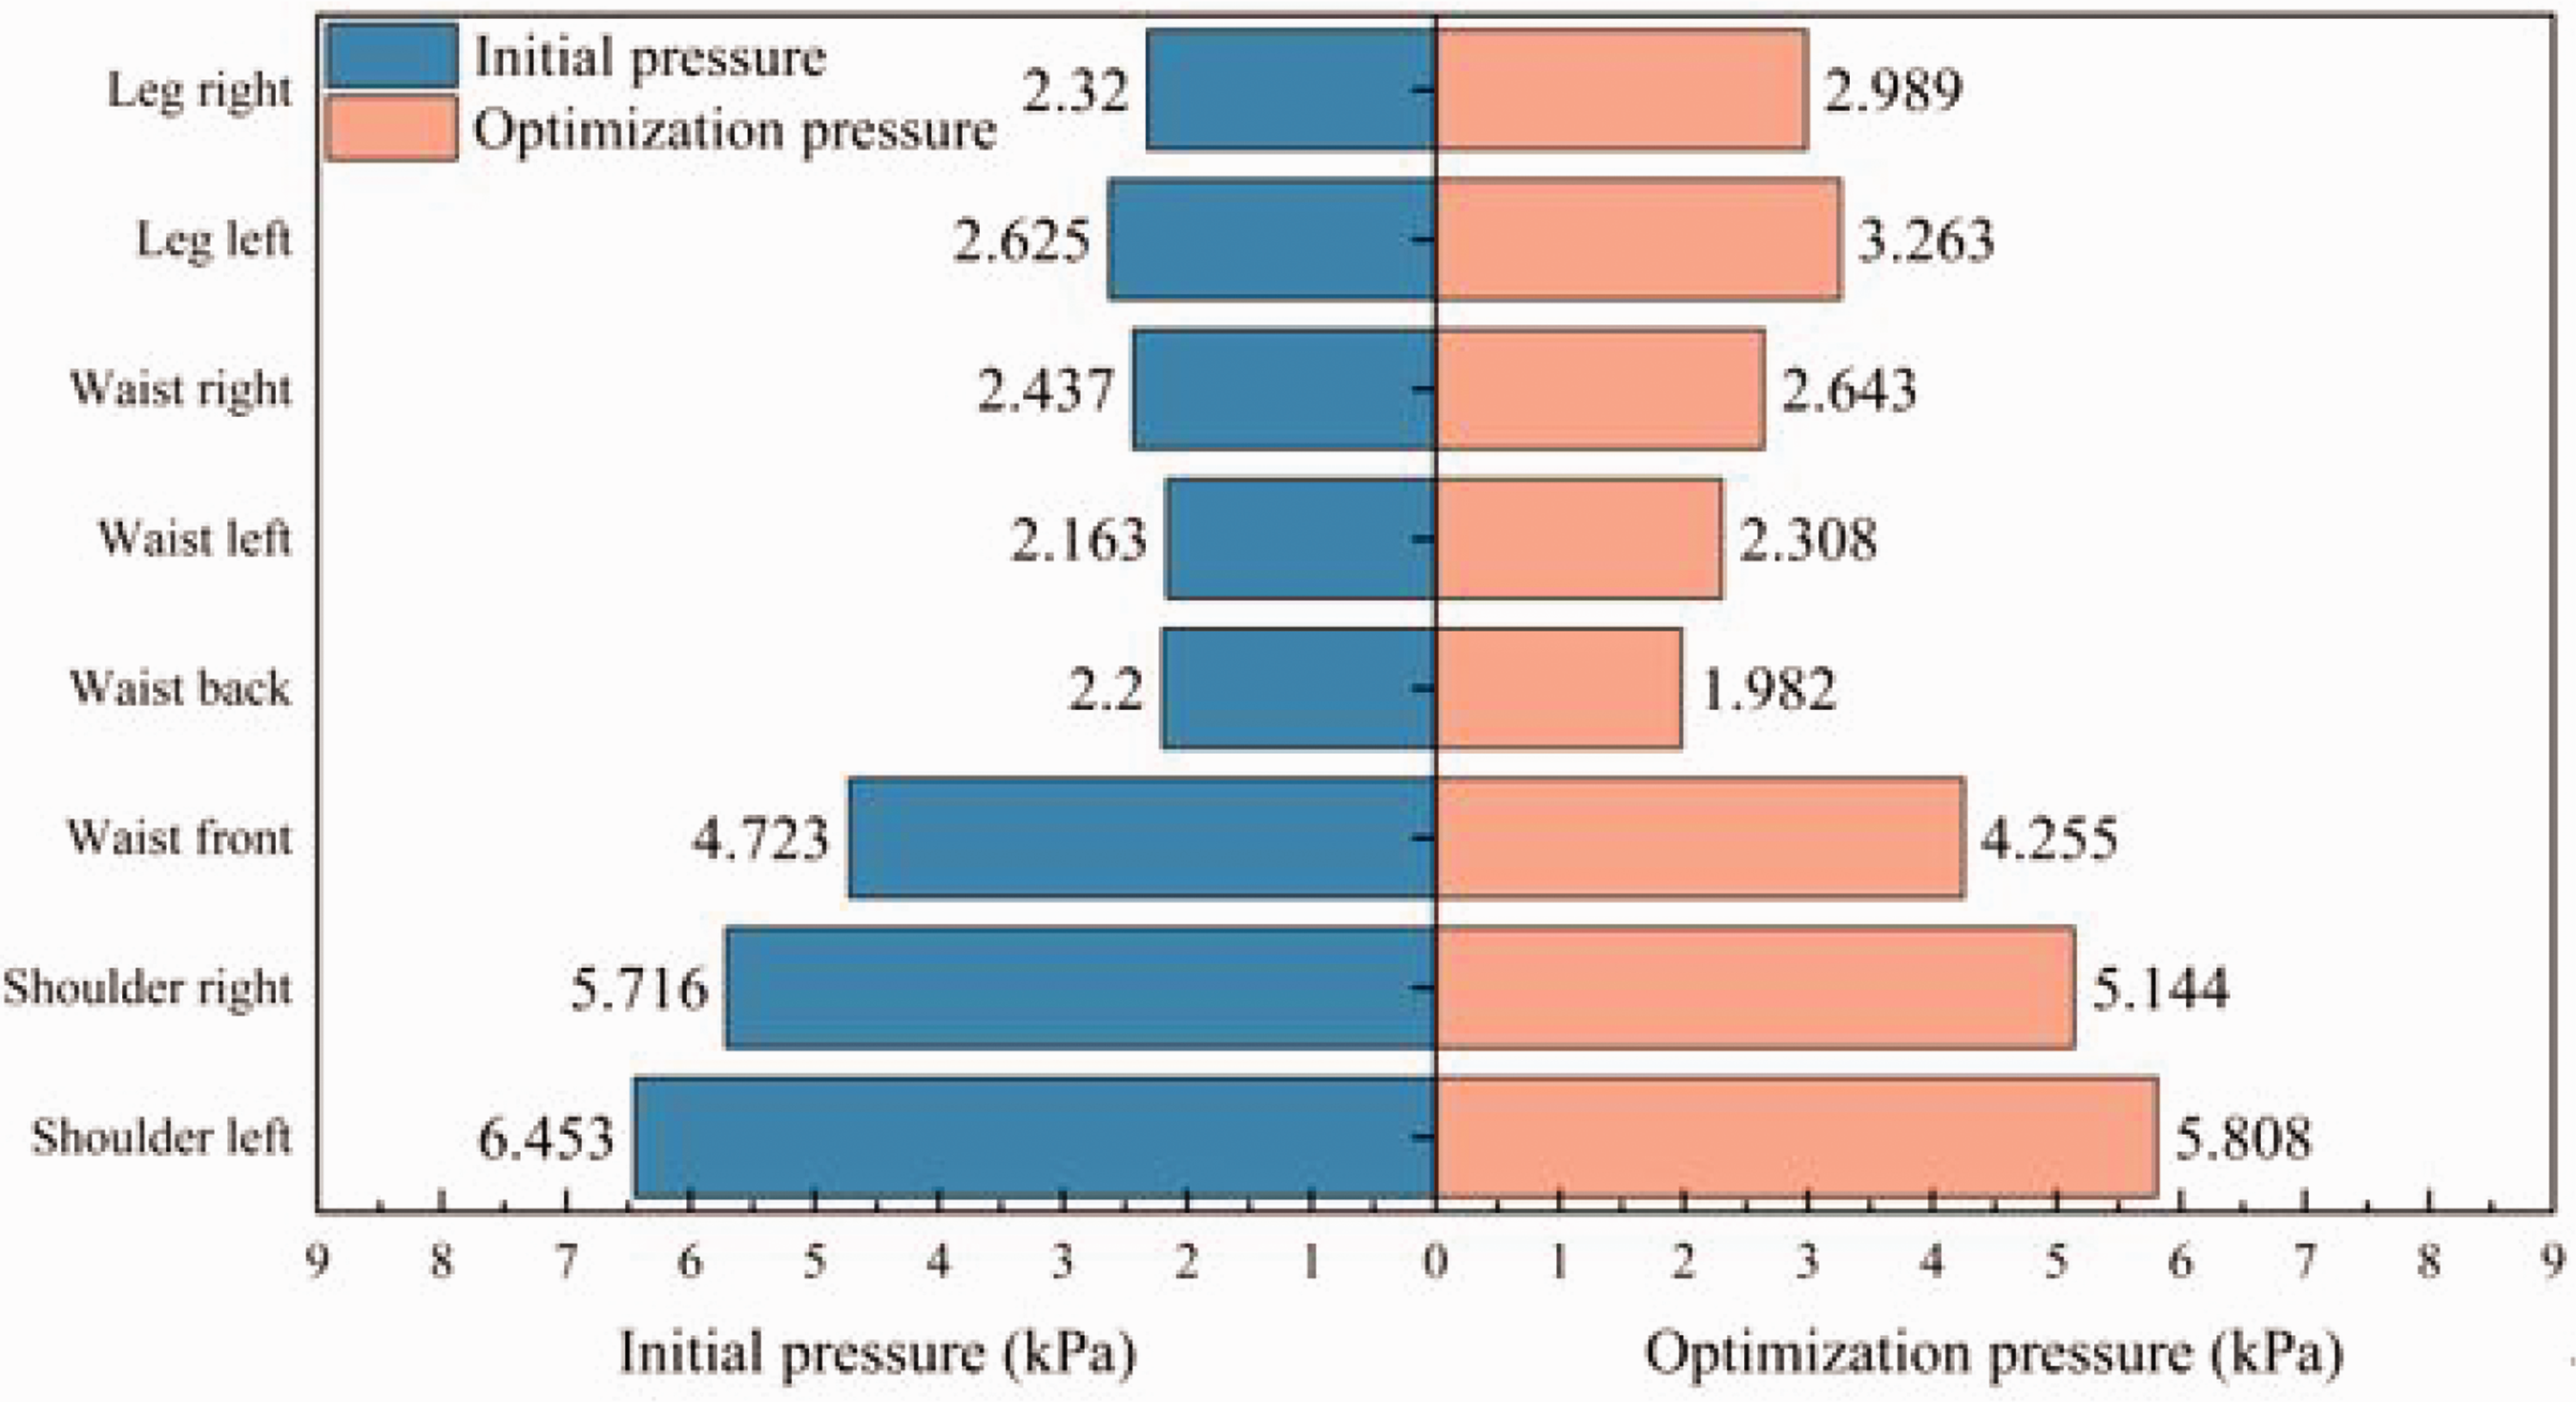
Optimal pressure distribution.
To validate the optimization efficacy, the verification protocol involved reimporting the optimized interface pressure parameters into Abaqus for comparative analysis of stress–strain characteristics at eight anatomical landmarks before and after optimization. The results demonstrated an approximate 15% reduction in stress–strain values at critical body regions. The verification results are shown in Figure 9.
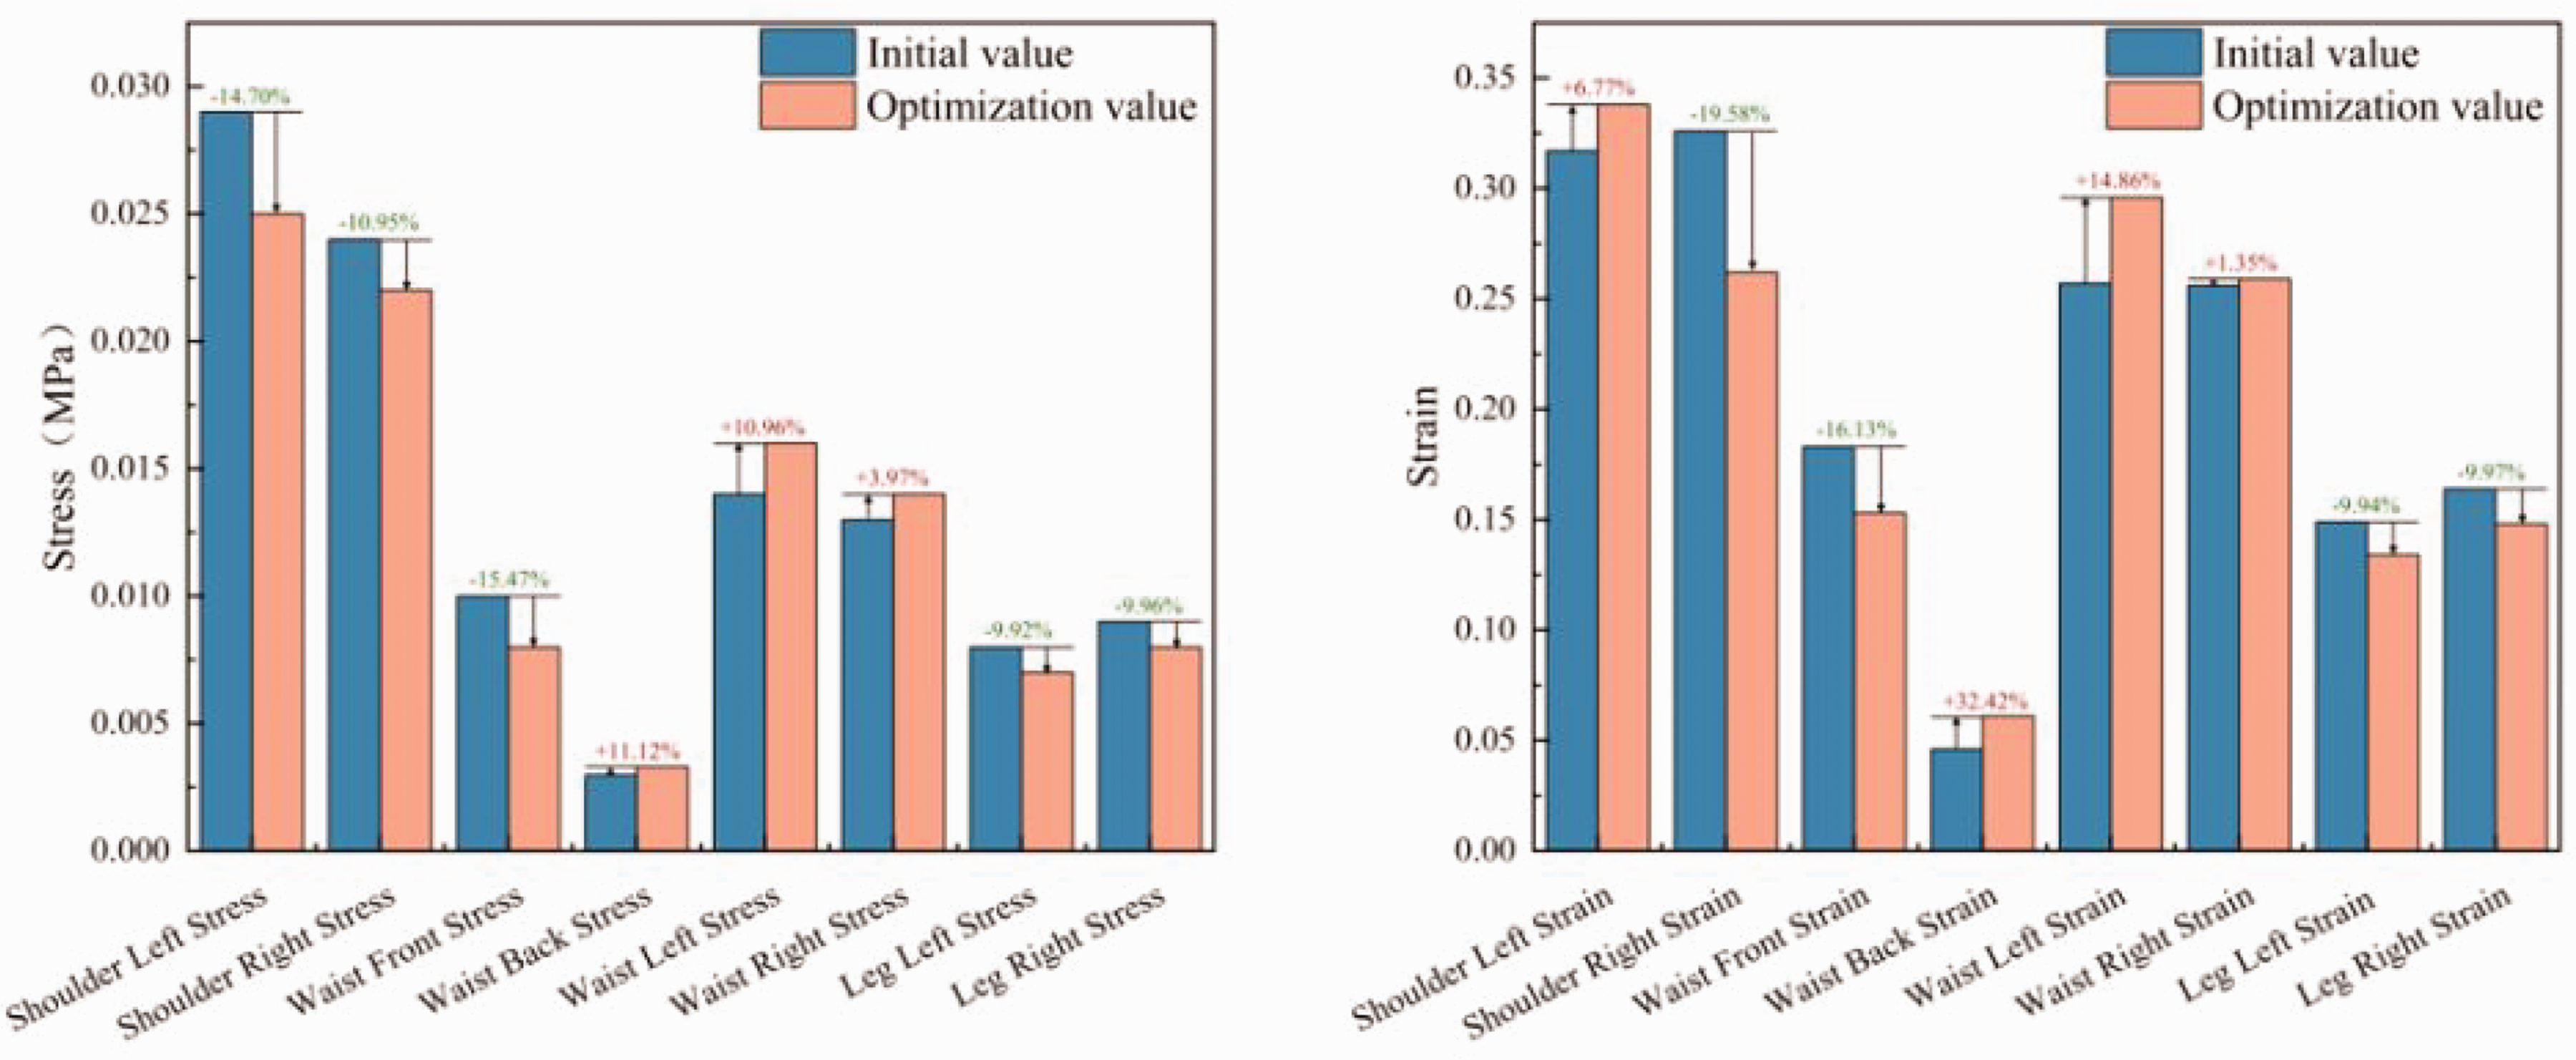
Verification of interface pressure.
As illustrated in Figure 9, the optimized pressure distribution achieved a 15.47% reduction in maximum stress (W_F_S: from 25.3 to 21.4 kPa) and 19.58% strain reduction (S_R_E: from 0.12 to 0.096), respectively, compared with the baseline harness design. Notably, stress and strain in critical regions such as the shoulders (S_L_S: decrease 14.70%; S_R_S: decrease 10.95%) and legs (L_L_S: decrease 9.92%; L_R_S: decrease 9.96%) exhibited reductions of approximately 10%, consistent with clinical reports highlighting these areas as high-risk zones for stress injuries.36,52,53
It is important to note that while the optimized pressure distributions led to reductions in peak von Mises stress and shear strain within simulated soft tissues, the damage thresholds referenced are based on computational modeling studies, not on direct in vivo measurements. As such, the physiological implications of these findings should be interpreted with caution and warrant further experimental validation.
To achieve the predefined objective function of minimizing localized stress–strain distributions, the pressure of the harness was strategically redistributed during the optimization process. This approach of redistributing pressure is a common methodology for improving wearer comfort and optimizing harness design. 53 Specifically, pressure on the left and right waist regions was increased, whereas reductions were implemented for the shoulders, legs, and front/back waist regions. These reductions are clinically significant, as they bring stress and strain values below established thresholds for tissue damage. Furthermore, according to multiple studies, the reduction in these values has been shown to effectively mitigate wearer injuries and enhance wearing comfort.54–56
These findings underscore the necessity of reinforcing support in the lumbar regions while alleviating pressure loads on the shoulders and legs. For instance, strain in the left leg harness was carefully balanced against overall load reduction, ensuring localized reinforcement without compromising global comfort. This design strategy not only optimizes the stress–strain distribution across the body during rehabilitation but also reduces injury risks by 15–20% in high-incidence areas. Consequently, the proposed adjustments enhance both biomechanical safety and user comfort, addressing key challenges in clinical rehabilitation protocols.
However, the biomechanical tolerance is not uniform across populations and loading conditions. For instance, elderly individuals typically exhibit lower tissue elasticity, thinner subcutaneous fat layers, and reduced musculoskeletal compensation capacity, which makes them more vulnerable to stress-related injuries.57,58 Dynamic loading associated with gait cycles, particularly in body-weight-supported rehabilitation scenarios, could introduce additional stress peaks and cyclic fatigue effects. While our simulations are based on the anthropometric and tissue parameters of an average healthy adult male under static loading conditions, the modeling framework can be extended in future studies by incorporating population-specific parametric human models and including dynamic loading profiles.
Harness material parameter optimization
A comparison of the optimal pressure distribution reveals significant differences in stress variations across the shoulders, waist, and legs. Under the condition of modifying only the material parameters while maintaining the harness tightness during use, the harness materials for different regions were optimized based on the structural design illustrated in Figure 4. The corresponding optimization results are presented in Table 6.
Optimization values of material parameters
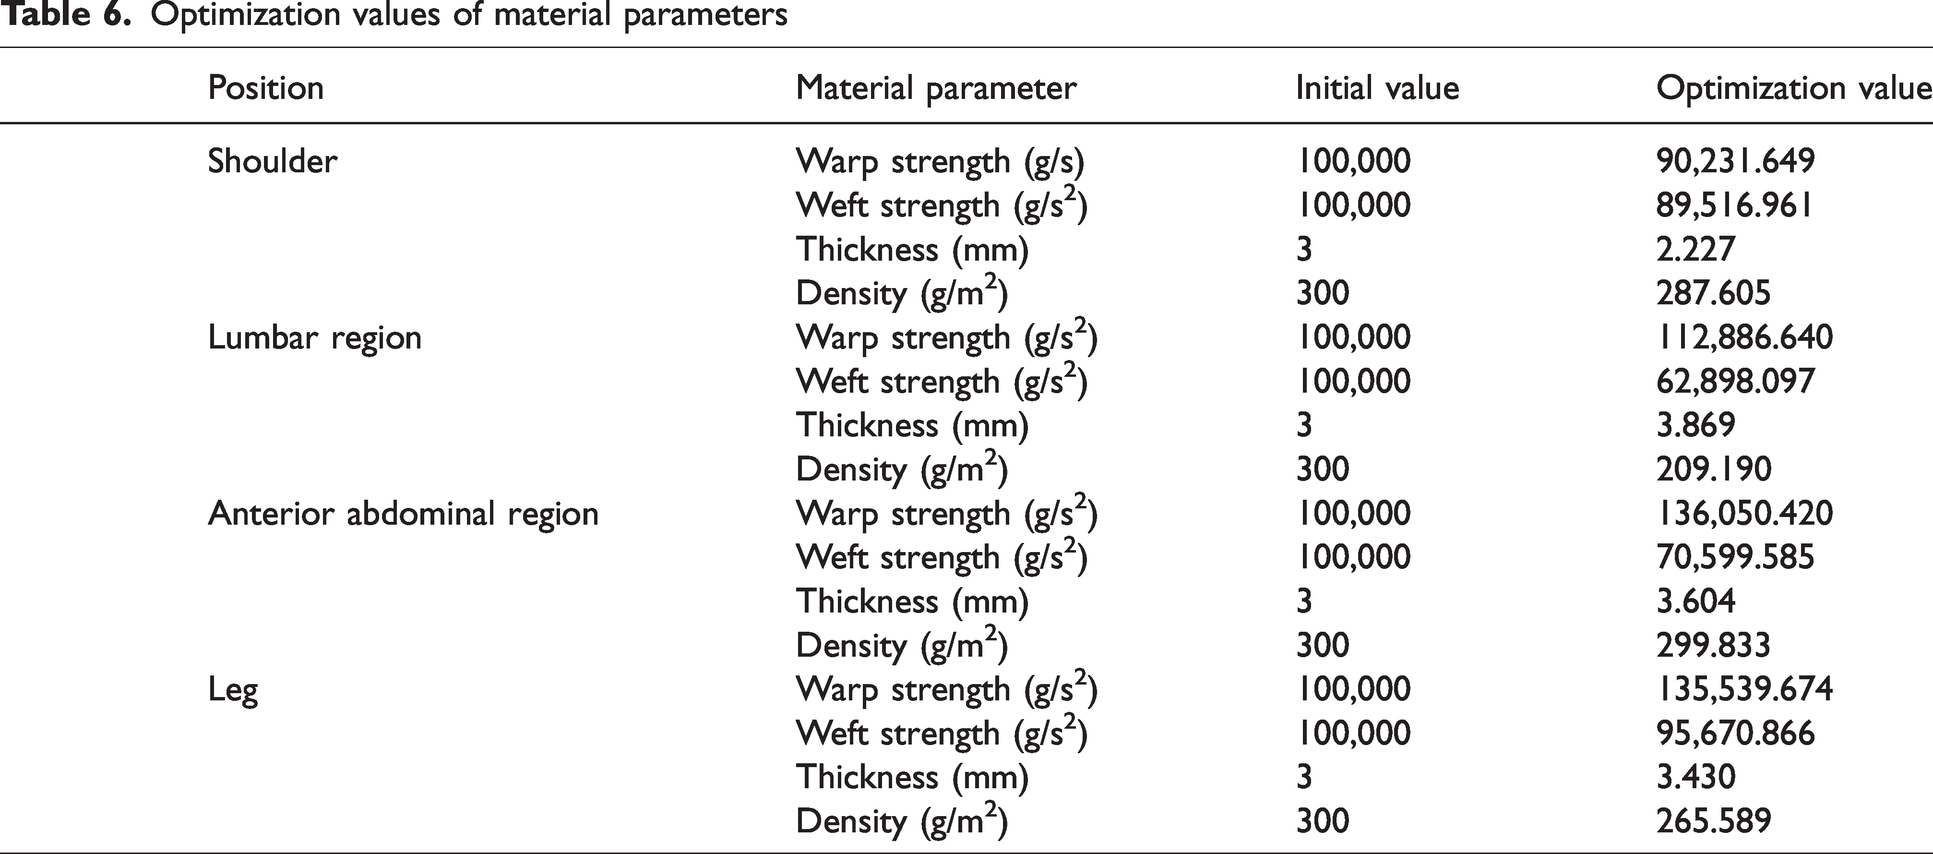
Figure 10 illustrates the correlations among optimization parameters, delineating the interactions between input variables, σT, σW, ρ, and T, and output pressure parameters, including shoulder pressure (S), leg pressure (L), lumbar region pressure (W1), and anterior abdominal region pressure (W2). The analysis further quantifies the influence of each input parameter on the pressure distribution. The results demonstrate that weft strength exerts the most significant impact on pressure magnitudes across all regions, with shoulder, leg, lumbar, and anterior abdominal pressures exhibiting pronounced sensitivity to σW variations. 59 In contrast, material thickness demonstrates a comparatively marginal contribution to pressure modulation. These findings underscore the necessity of prioritizing weft strength control in the design and optimization of material parameter to achieve targeted mechanical performance, a principle extensively documented in textile research for diverse fabric systems.60,61
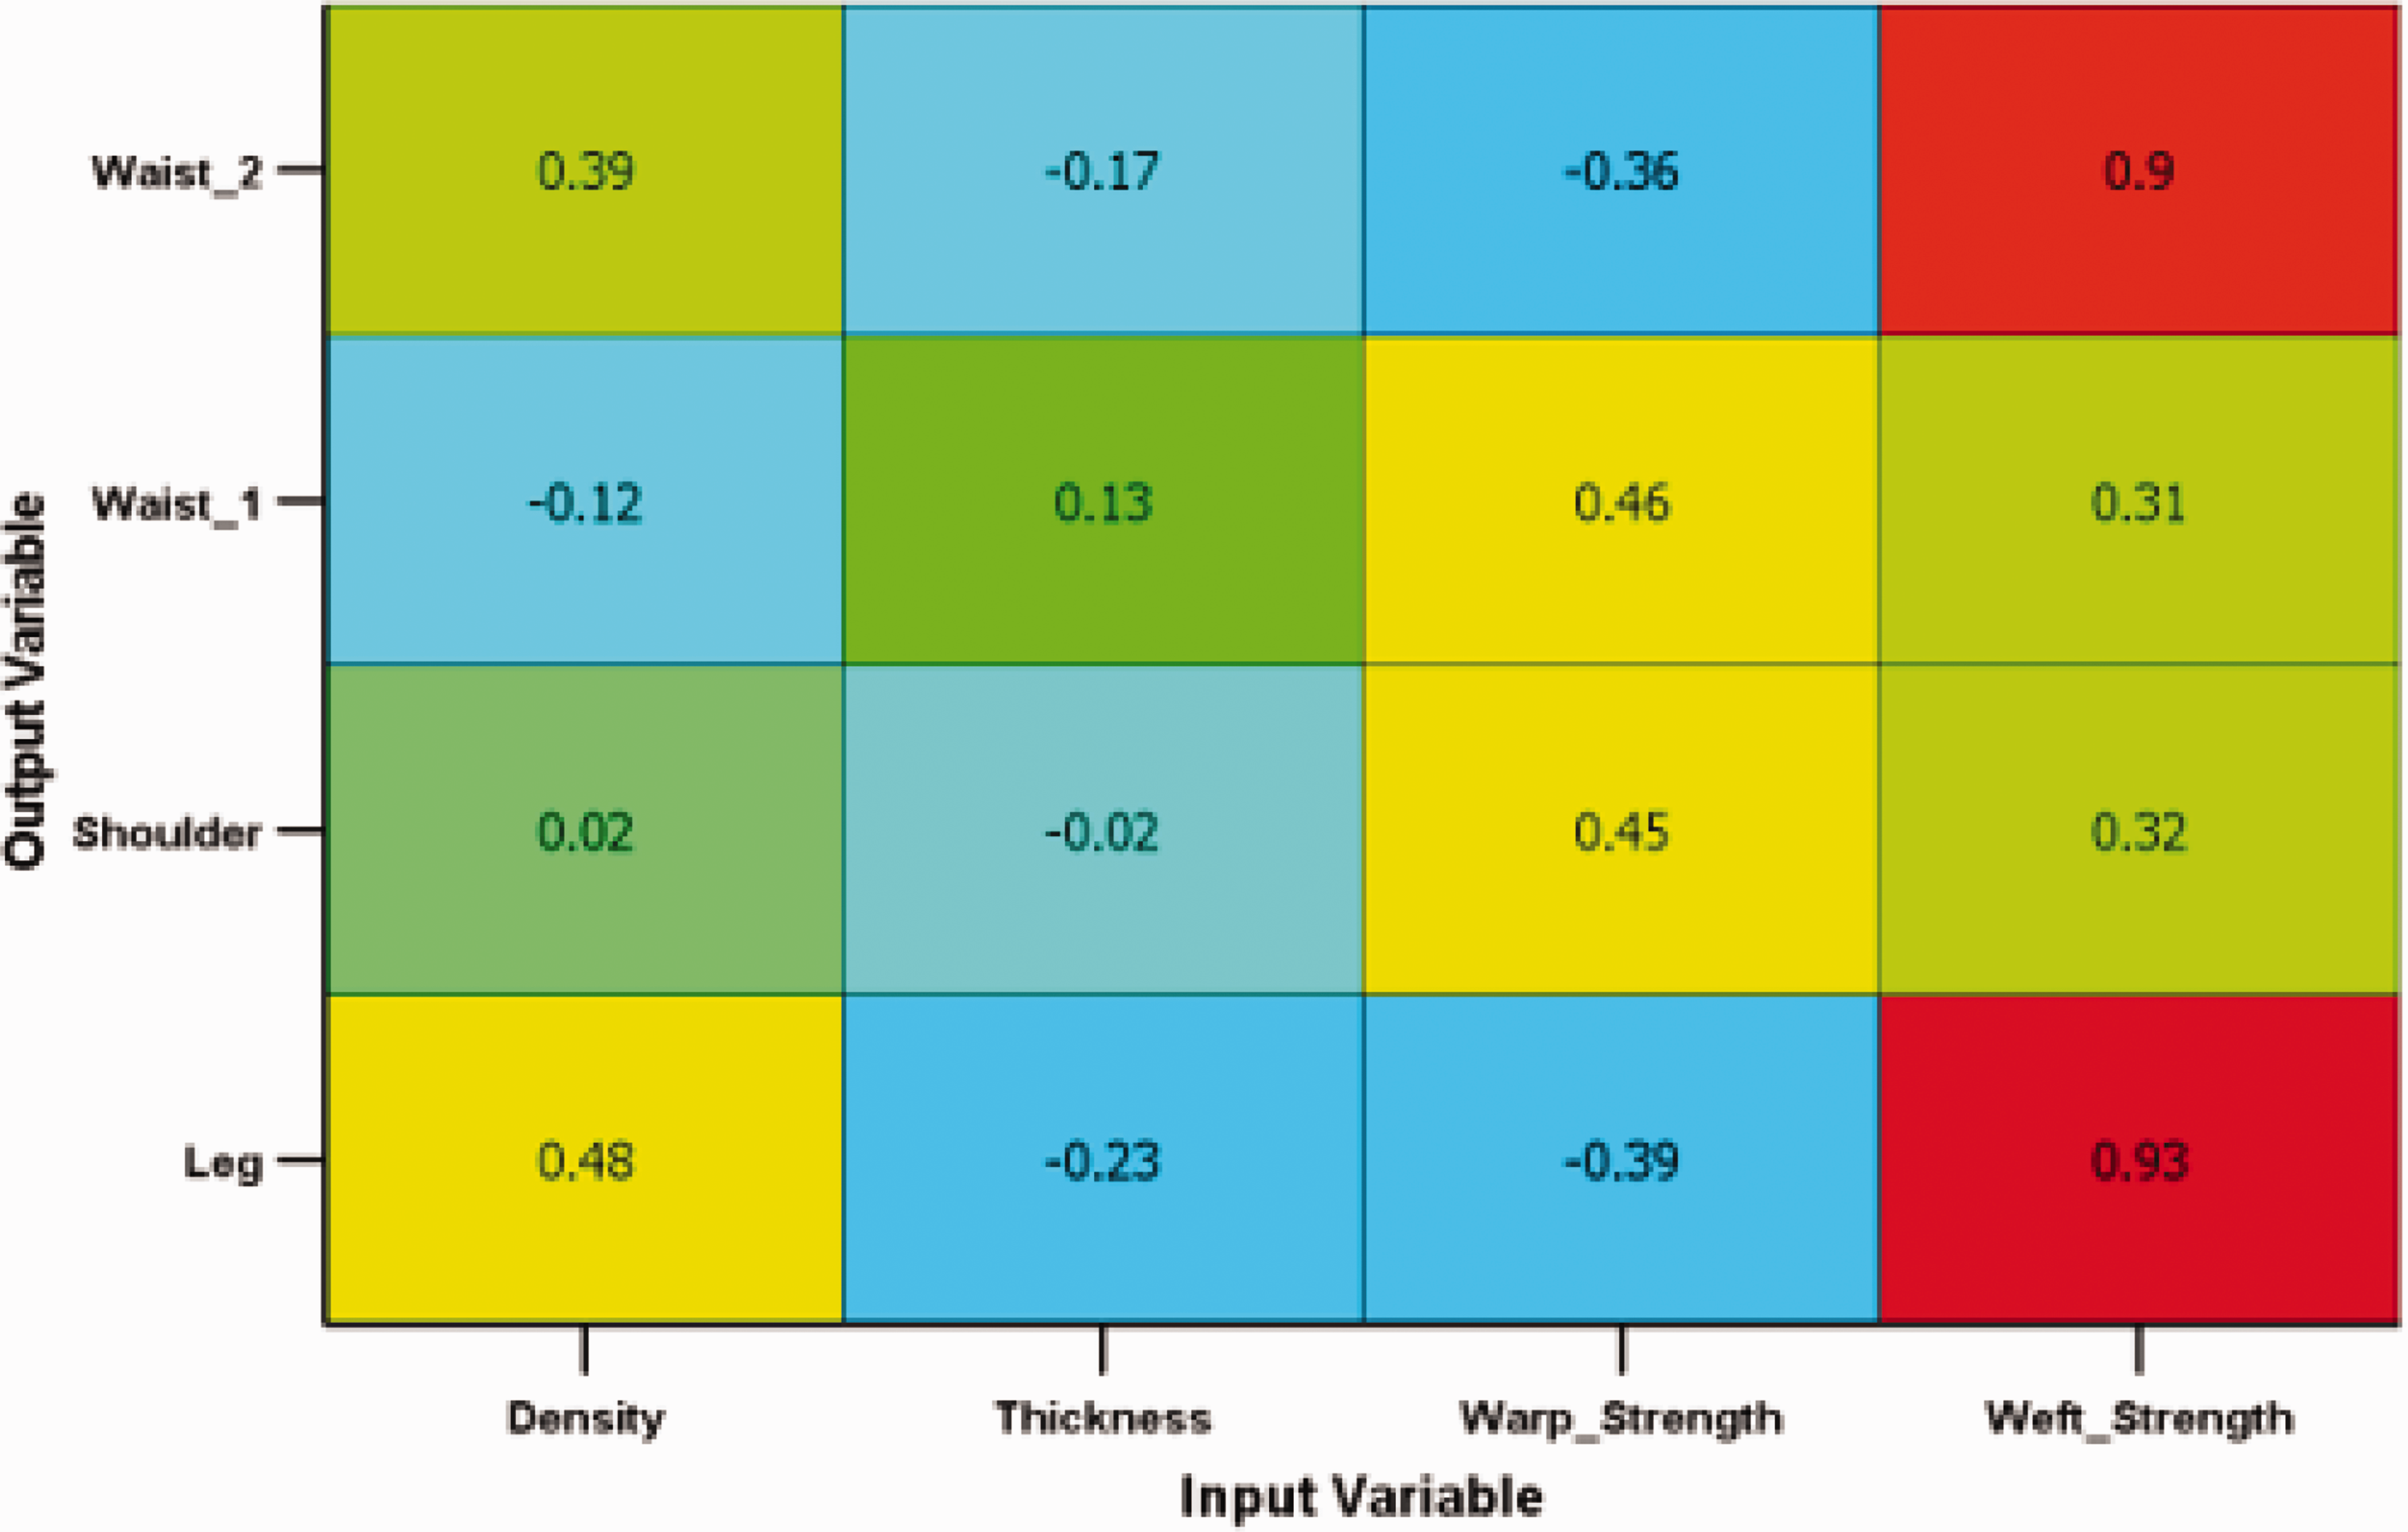
Correlation table.
The optimized parameters for each anatomical region, as detailed in Table 6, reveal distinct trends. For the lumbar region, the warp strength increased by 12.89%, whereas the weft strength decreased by 37.10%. This inverse relationship highlights the critical role of enhanced warp and weft strength in improving stiffness, which effectively redistributes stress concentrations and augments mechanical support in the lumbar area.35,61,62 Conversely, the anterior abdominal region exhibited a 36.05% increase in warp strength alongside a 29.40% reduction in weft strength, suggesting a design strategy that balances localized rigidity with flexibility.
Nonetheless, it is essential to emphasize that the observed biomechanical advantages of increased lumbar support do not imply a one-size-fits-all recommendation. These findings should be regarded as a theoretical guideline for calibrated lumbar stiffness enhancement, rather than a directive for aggressive structural reinforcement. Such modifications should be implemented with individualized fitting strategies, material flexibility considerations, and clinical oversight.
The shoulder region exhibited concurrent reductions in both warp and weft strengths, with quantitatively measured decreases of 9.77% in warp strength and 10.48% in weft strength. Meanwhile, in the leg harness design, the warp strength was enhanced to reinforce structural support along the principal loading direction of gait motion, thereby improving tensile integrity and preventing material elongation or displacement during use, while the weft strength governing skin-contact compliance was strategically reduced by 4.33% to enhance surface conformability and interface comfort. This differential adjustment strategy enables the harness to maintain mechanical stability under tension while preserving soft tissue interface properties, achieving an optimal balance between biomechanical support and wearable comfort through direction-specific material optimization. 19
Regarding the feasibility of the optimized material parameters, significant improvements in tensile strength can be achieved through multiple strategies: (i) densifying warp yarn density by increasing ends per inch (EPI); (ii) employing high-denier continuous filaments (e.g., 1680D–2000D); (iii) hybridizing yarns with high-tenacity fibers (e.g., PET/nylon or aramid blends); and (iv) incorporating finishing techniques such as resin coating or calendaring.
Material density and thickness further contribute to this differentiated design approach. For instance, the lumbar region’s density decreased by 30.27%, whereas its thickness increased by 28.97% (to 3.869 mm), enhancing compliance without compromising structural integrity. Similarly, the anterior abdominal region’s near-optimal density retention and moderate thickness reduction (3.604 mm) reflect a balance between flexibility and load-bearing capacity, aligning with wearer comfort requirements for such harness systems. 36
To validate the optimization effectiveness, the optimized material parameters were imported into CLO3D software for computational validation of pressure values. A comparative visualization of the optimized pressure distribution versus the simulated validation results is presented in Figure 11. The results demonstrate a consistent pressure reduction trend in major load-bearing regions (e.g., shoulders and lateral waist), with pressure decreases exceeding 25% in several structural configurations, achieving the anticipated pressure distribution profile.
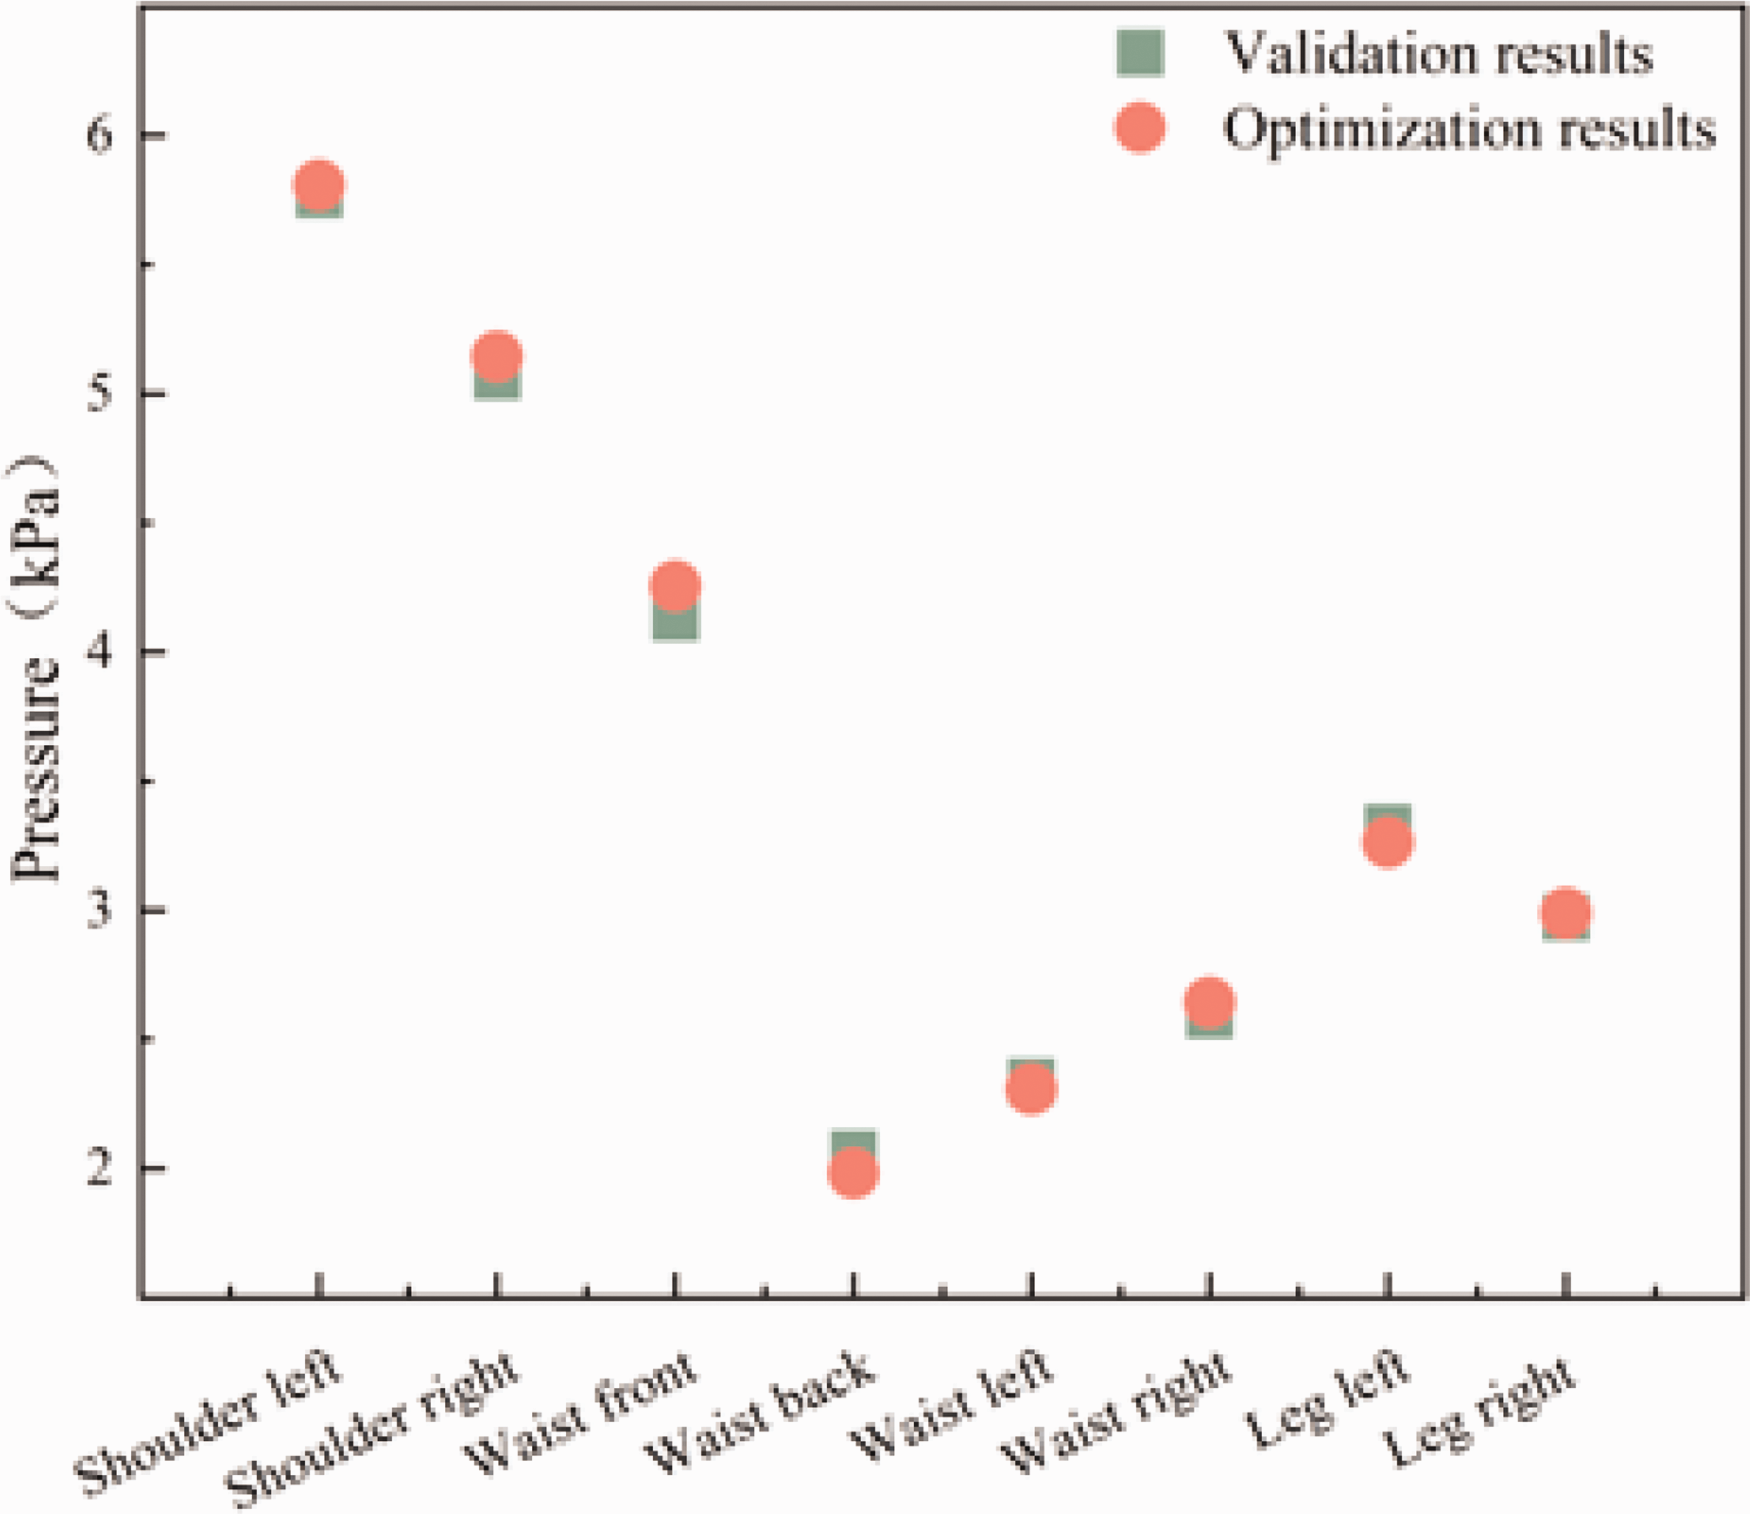
Verification of material parameters.
In summary, the data-driven optimization framework advocates for region-specific material strategies: prioritizing high-stiffness, warp-dominant configurations for the lumbar region to dissipate stress, and adopting reduced-strength, softer materials for the shoulder and leg regions to alleviate pressure. Such tailored approaches harmonize mechanical distribution at the human–harness interface, advancing both safety and comfort in rehabilitation applications.
Conclusion
This study developed a digital design framework by integrating cross-domain modeling and simulation tools to optimize harness structure and material parameters. The framework enabled systematic optimization of contact pressure and material properties (warp strength, weft strength, density, and thickness), resulting in a 15.47% reduction in von Mises stress and a 19.58% reduction in shear strain compared with conventional designs. These reductions are significant, as they bring stress and strain values below thresholds associated with tissue damage. The optimized design emphasizes region-specific material strategies: stiffer, high-warp-strength materials for the lumbar region to enhance load redistribution and softer materials with reduced warp and weft strength for the shoulders and legs to minimize pressure concentrations.
The evaluation of harness mechanical performance was conducted under static conditions using a FEA framework. Although this method offers precise control over boundary conditions, material parameters, and anatomical modeling, it does not fully replicate the complex, dynamic biomechanical interactions occurring during real-world rehabilitation activities such as gait, balance recovery, or postural transitions. Future work should incorporate experimental validation through human-subject testing.
Meanwhile, the study has limitations, including the exclusion of advanced fabric characteristics (e.g., weave patterns, anisotropic behaviors) and dynamic biomechanical interactions during movement. In addition, physiological comfort metrics (e.g., skin microclimate, user-reported comfort) were not validated. Future work should focus on investigating multiparameter coupling effects, conducting experimental validations through in vivo trials, and integrating machine-learning-driven surrogate models to improve predictive capabilities and extend the framework to applications in wearable robotics and rehabilitation devices.
To effectively support technology translation, this study outlines two key future research directions: (1) user trials involving controlled experiments with both healthy and rehabilitation subjects to systematically evaluate harness comfort, usability, and biomechanical responses during assisted gait; (2) machine learning integration to develop adaptive pressure adjustment strategies utilizing real-time feedback mechanisms, enabling personalized pressure distribution optimization based on individual anatomical characteristics and activity patterns.
Footnotes
Ethics approval
All procedures performed in studies involving human participants were in accordance with the ethical standards of the institutional research committee and with the 1964 Helsinki Declaration. The research was approved by the Shanghai Yangzhi Rehabilitation Hospital Department of Ethics Committee (SBKT-2022-008). Informed consent was obtained from all individual participants included in the study. Additional informed consent was obtained from all individual participants for whom identifying information is included in this article.
Data availability
The data generated or analyzed during this study are available from the corresponding author upon reasonable request. The code generated or used during the study is also available from the corresponding author upon reasonable request.
Declaration of conflicting of interests
The authors have no competing interests to declare that are relevant to the content of this article.
Funding
The author(s) disclosed receipt of the following financial support for the research, authorship, and/or publication of this article: This study was funded by the National Natural Science Foundation of China (grant number 12302423), the Shanghai Yangzhi Rehabilitation Hospital (Shanghai Sunshine Rehabilitation Centre) Sunshine Clinical Research Incubation Project (grant number 2024CRZH009), and the Wuhan Textile and Apparel Digital Engineering Technology Research Center Foundation (grant number SZH202401).