
Abstract
The high color fastness of reactive dyes in waste cotton textiles impedes effective decolorization and recycling. This study employs an eco-friendly enzymatic approach utilizing a fungal laccase (extracted from Aspergillus oryzae) to decolorize monochlorotriazine-type reactive dyes (C.I. Reactive Blue 5, C.I. Reactive Yellow 3, and C.I. Reactive Red 24) on cotton fabrics. Key process parameters were optimized via standard orthogonal experimental and Box–Behnken design response surface modeling. Optimal decolorization conditions were identified as 0.5% HBT (1-hydroxybenzotriazole), pH 7, 50°C, 0.5 U/ml laccase, 1:20 bath ratio, and 1 h treatment. Under these conditions, decolorization efficiencies reached 62%, 30%, and 27% for blue, yellow, and red dyed cotton fabrics, respectively, with fiber strength retention exceeding 95%. Fourier-transform infrared (FTIR) spectroscopy and X-ray diffraction (XRD) analyses confirmed no significant changes in the chemical structures of Blue 5, Yellow 3, and Red 24 dyed cotton fabrics, whereas their crystallinity values increased by 10.24%, 8.87%, and 21.97%, respectively. X-ray photoelectron spectroscopy revealed partial cleavage of N=N bonds in Red 24 and Yellow 3, and C=O bonds in Blue 5, indicating that laccase disrupts the conjugated chromophore structures under optimized conditions. Unlike conventional chemical treatments, which often degrade fiber integrity, this study achieves effective decolorization of cotton fabrics with high color fastness under neutral, mild conditions, while maintaining the physical properties of fibers. It provides an environmentally friendly solution for textile recycling, significantly enhances the economic and environmental benefits associated with their recycling, and thus exhibits promising industrial application potential.
In the textile industry, substantial quantities of cotton textile waste are discarded and incinerated, resulting in resource wastage and environmental pollution. 1 A significant challenge within this context is the presence of reactive dyes in colored waste cotton. The molecular structure of reactive dyes consists of chromophoric groups and reactive groups. Active chemicals, including chlorotriazine and vinyl sulfone groups, can initiate a durable chemical reaction with fibers in an alkaline environment, imparting enhanced color fastness to dyed cotton fabrics. 2 During the chemical recycling of dyed cotton fabrics, residual dyes further impede solvent-mediated cellulose dissolution. For instance, when applying the NaOH/urea dissolution system (Lyocell process) to waste cotton treatment, the stability of dye molecules disrupts cellulose chain scission, thereby increasing dissolution resistance. Therefore, it is crucial to identify an effective dye degradation method. Current technological approaches for dye decolorization encompass physical, chemical, and biodegradation methods, including photocatalysis,3,4 chemical precipitation, 5 membrane filtration, 6 electrochemical treatment, 7 biodegradation, 8 and multiprocess combinations.9,10 Enzymatic decolorization has emerged as a promising alternative to traditional chemical methods due to its cost-effectiveness, minimal environmental impact, and ability to operate under mild conditions.
Laccase (EC 1.10.3.2, dihydroxyphenyl: dioxygenase) is an enzyme with a copper atom at its active site, capable of catalyzing the oxidation of various substrates, including phenols and aromatic molecules 11 (such as catechol, para-coumaric acid, aminophenol, methoxyphenol, and polyphenols), aliphatic amines, and inorganic cations, yielding water and carbon dioxide as reaction products. Laccase is capable of degrading some dyes.12,13 Wakade et al. 14 employed cp-laccase (0.5% plant enzyme powder) to decolorize samples containing indigo dye (100 mg/l) with a decolorization rate as high as 86%. The decolorization mechanism of laccase involves two stages: first, laccase oxidizes phenolic or similar structures in dye molecules, generating unstable free radicals 15 ; second, these radicals undergo nonenzymatic reactions, disrupting the dye structure and causing decolorization. This process effectively removes dye color and reduces environmental impact. 16 Nyanhongo et al. 17 studied factors affecting laccase production from Trametes, including carbon and nitrogen sources, pH, and temperature, optimizing conditions to enhance laccase activity fourfold. Rana and Chakraborty 18 further optimized decolorization parameters for various dyes, showing that efficacy depends on laccase and dye concentrations, temperature, pH, and duration of treatment. Laccase’s efficacy on textile dyes is constrained by its specificity for phenolic compounds; however, the incorporation of mediators can broaden its substrate range to include non-phenolic substances. As a commonly utilized redox mediator, HBT (1-hydroxybenzotriazole) exhibits a lower redox potential than laccase substrates, thereby establishing an alternative electron transfer pathway that enables laccase to efficiently accept electrons, accelerate electron transfer from the enzyme to molecular oxygen, enhance reaction kinetics, and furthermore expand the substrate scope of enzymatic oxidation. 19 LP et al. 20 used laccase from white-rot fungi with redox mediators to achieve up to 93% decolorization of Reactive Black 5. In conclusion, laccase has demonstrated effective degradation of various phenolic compounds and achieved remarkable efficacy in dye wastewater treatment according to existing research. Currently, research on laccase-mediated decolorization mostly focuses on the degradation of dye effluent, whereas systematic investigations into colored cotton textiles remain scarce. Dye wastewater has a high concentration of dissolved oxygen, a high concentration of dye molecules, and effective dispersion. These circumstances facilitate the physical adsorption of dye molecules by enzymes. 21 Conversely, challenges exist in the decolorization of cotton fabrics, including the robust covalent interactions between fibers and dyes, as well as the steric hindrance imposed by the macromolecular structure of enzymes. These factors impede the elucidation of dyes and complicate the decolorization process.
Chemical decolorization technology serves as the primary method for decolorizing cotton fabrics. 22 Conventional chemical stripping methods for cotton textiles predominantly rely on potent reducing/oxidizing agents coupled with extreme pH conditions or elevated temperatures, which inevitably induce cellulose hydrolysis or oxidation. A representative case is the sodium dithionite (Na2S2O4)-based decolorization system requiring thermal activation at 80°C. The vigorous redox reactions characteristic of such processes disrupt the crystalline domains of cotton fibers, leading to 10–15% breaking strength deterioration and compromised tactile properties in treated cotton fabrics. 23 Furthermore, these methodologies concomitantly generate substantial effluent containing hypersaline solutions and biorefractory organic compounds, posing substantial environmental burdens through both aquatic contamination and textile performance degradation. Conversely, the application of laccase in the decolorization of dyed textiles may facilitate environmentally friendly dye removal while reducing fiber strength loss, thereby enhancing the recovery and circular utilization of waste cotton for sustainable textile production.
Various types of reactive dyes exist, with commonly utilized examples including monochlorotriazine, dichlorotriazine, vinyl sulfone, and bifunctional types. Monochlorotriazine dyes exhibit moderate reactivity, enabling fixation under medium-temperature conditions (60–80°C) with high hydrolytic stability, moderate energy consumption, and favorable fabric fastness properties, making them suitable for conventional dyeing processes. This study examined the decolorization of C.I. Reactive Blue 5, a monochlorotriazine reactive dye structurally analogous to laccase substrates, using statistical methods to evaluate laccase’s decolorization efficiency (DE) for this dye. To explore the influence of dye color on laccase DE and its capacity to decolorize fabric-bound dyes, response surface methodology was employed to systematically analyze laccase decolorization of cotton fabrics dyed with three monochlorotriazine reactive dyes, C.I. Reactive Red 24, C.I. Reactive Yellow 3, and C.I. Reactive Blue 5, while also evaluating alterations in the physicochemical properties of the decolorized cotton fabrics. This optimization of the laccase decolorization process on cotton fabrics with reactive dyes provides a data foundation for the decolorization of reactive dye-colored cotton fabrics by laccase. This study aims to elucidate the enzymatic decolorization mechanism of cotton fabrics, 24 offering theoretical insights for the recycling and reuse of waste cotton fabrics with complex origins and diverse colors. The application of this technology for the decolorization of colored cotton fibers could greatly enhance resource recycling rates and reduce environmental pollution caused by traditional treatment methods.
Materials and methods
Materials
C.I. Reactive Red 24, C.I. Reactive Yellow 3, and C.I. Reactive Blue 5 (RR-24, RY-3, and RB-5) were purchased from Jianglai Biotech Company. The pure cotton white–gray cloth was acquired from a market in China. We acquired 10,000 enzymes active laccase (10 U/ml) from Xiasheng Biotechnology Co., Ltd. 1-Hydroxybenzotriazole (HBT, 97%), sodium hydroxide (NaOH, 98% purity), hydrochloric acid (HCl), sodium sulfate (Na2SO4), sodium chloride (NaCl), and soap flakes for textile experiments were obtained from Macklin. All reagents were of analytical grade and used without further purification.
Orthogonal experiments to optimize the decolorization of RB-5 dye
An orthogonal experimental design was implemented to determine the optimal decolorization parameters for RB-5 dye solutions.
25
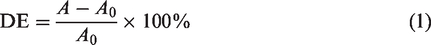
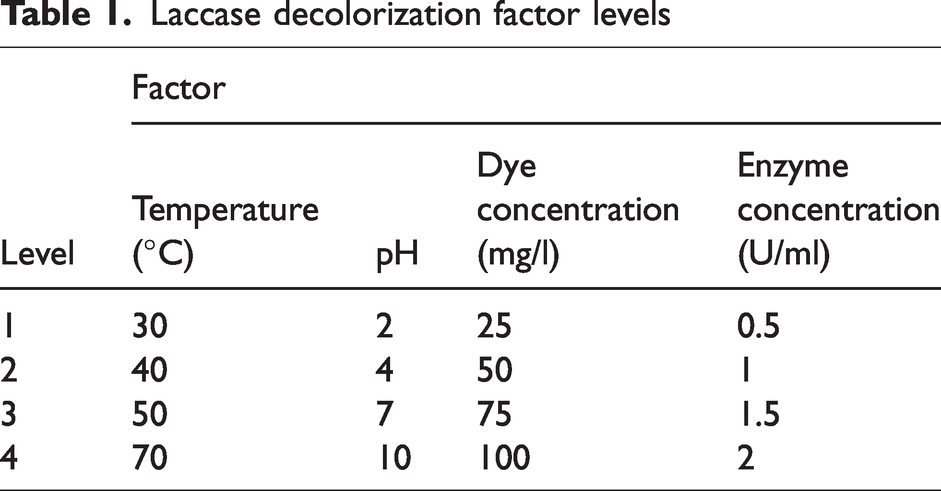
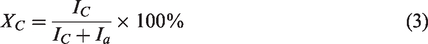
This systematic approach aimed to quantitatively elucidate the individual and interactive effects of four critical process parameters, temperature, pH, dye concentration, and enzyme (laccase) concentration, on enzymatic DE. To optimize experimental workload and data representativeness, each parameter was assigned four distinct levels (Table 1). Reactive dye solutions were prepared at specified concentrations according to the factorial combinations outlined in Table 1. The pH of the solution was adjusted to predetermined values using HCl or NaOH, followed by precise addition of laccase at designated concentrations. The mixtures were subjected to enzymatic degradation in a thermostatic oscillating water bath (1 h) under controlled temperature conditions. Following the reaction, samples were cooled to room temperature and filtered through a 0.22 μm PTFE membrane filter to remove residual particulates. To mitigate random experimental errors, all trials were conducted in triplicate with a blank control group subjected to identical treatment procedures but without laccase addition. A preliminary assessment of DE was performed through visual inspection, followed by quantitative determination of DE via UV–vis spectrophotometry. Absorption spectra of filtrates were recorded across the 300–700 nm wavelength range, with peak absorbance values measured at the characteristic λmax of each dye. DE values were calculated according to
Laccase decolorization factor levels
Single-factor experiment on decolorization of cotton fabrics
A single-factor experimental approach was systematically employed to investigate the individual effects of key operational parameters on the enzymatic DE of RB-5 dyed cotton fabric.
26
The pure cotton base fabric is initially dyed,
27
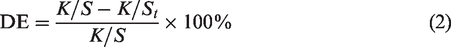
followed by cutting the fabric into dimensions of 5 cm × 10 cm. Subsequently, they were immersed in reaction solutions with varying liquor-to-fabric ratios, spanning from 1:20 to 1:50. The pH of each solution was adjusted to predetermined values (2–12) using HCl or NaOH, followed by the introduction of laccase (0.5–2.0 U/ml) and HBT as redox mediators. The enzymatic decolorization process was conducted in a thermostatic oscillating water bath under controlled temperature conditions (30–70°C) for reaction durations of 15–60 minutes. Post-treatment, fabric samples were thoroughly rinsed with deionized water to remove residual reagents. The colorimetric properties of treated and untreated cotton fabrics were analyzed using a Color-Eye 7000A spectrophotometer under D65 standard illumination. To ensure statistical robustness, all experimental conditions were tested in triplicate, with mean values derived to minimize random variability. The color strength (K/S values) was measured at the maximum absorption wavelength (λmax) of RB5, and DE(%)
28
was calculated according to
Optimization of decolorization using response surface methodology
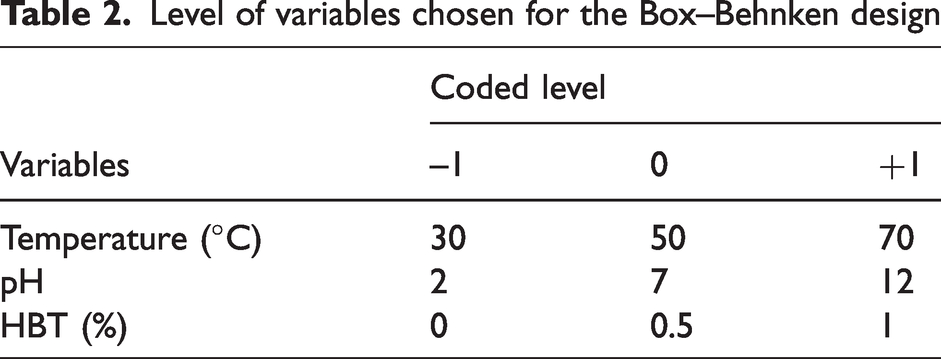
Single-factor experiments indicated that temperature, enzyme concentration, and HBT concentration significantly affected the decolorization rate of cotton fabrics. This study employed the Box–Behnken experimental design to optimize the decolorization process of dyed cotton fabrics, identifying the optimal combination of the three fundamental parameters: temperature, pH, and HBT concentration. Table 2 lists the variables under examination along with their corresponding values. A total of 17 independent experiments were conducted, each repeated three times, to determine the decolorization rate of dyed cotton fabric under various conditions. The response surface methodology (RSM) was utilized to analyze the experimental results, leading to the establishment of a functional relationship model between the experimental parameters and the response variables. 29 The data were analyzed using Design-Expert 6.0 software, which includes an analysis of variance (ANOVA) to identify any interactions between variables and responses. The results were evaluated through multiple regression analysis, and the significance of the regression values was determined using an F-test. The coefficient of determination (R2) served to assess the quality of the model fit.
Level of variables chosen for the Box–Behnken design
Characterization
Scanning electron microscopy (SEM) analyzed fabric surface morphology pre- and post-decolorization. Color depth (K/S) was measured using a Color-Eye 7000A spectrophotometer under D65/10° conditions. The tensile strength of cotton fabrics was assessed before and after decolorization in accordance with ASTM D5035 (strip method) to evaluate the effect of laccase decolorization on fabric strength.
30
Fourier-transform infrared (FTIR) spectroscopy in attenuated total reflectance (ATR) mode was employed to acquire infrared spectra of cotton fabrics before and after laccase treatment.
30
XRD measurement was carried out on a diffraction meter (D8-Advance, Bruker) at a scan speed of 5°/min in the region of 2θ from 10° to 80°.
31
The crystallinity XC (%) of the cellulose fibers was calculated and estimated according to
Results and discussion
Enzymatic decolorization analysis of RB-5 dye
This study involved 16 orthogonal experiments to investigate the impact of temperature, pH, dye concentration, and enzyme concentration on the decolorization process of RB-5 by enzymes. Table 3 presents the DEs for each circumstance.
Orthogonal design table for decolorization of RB-5 dye
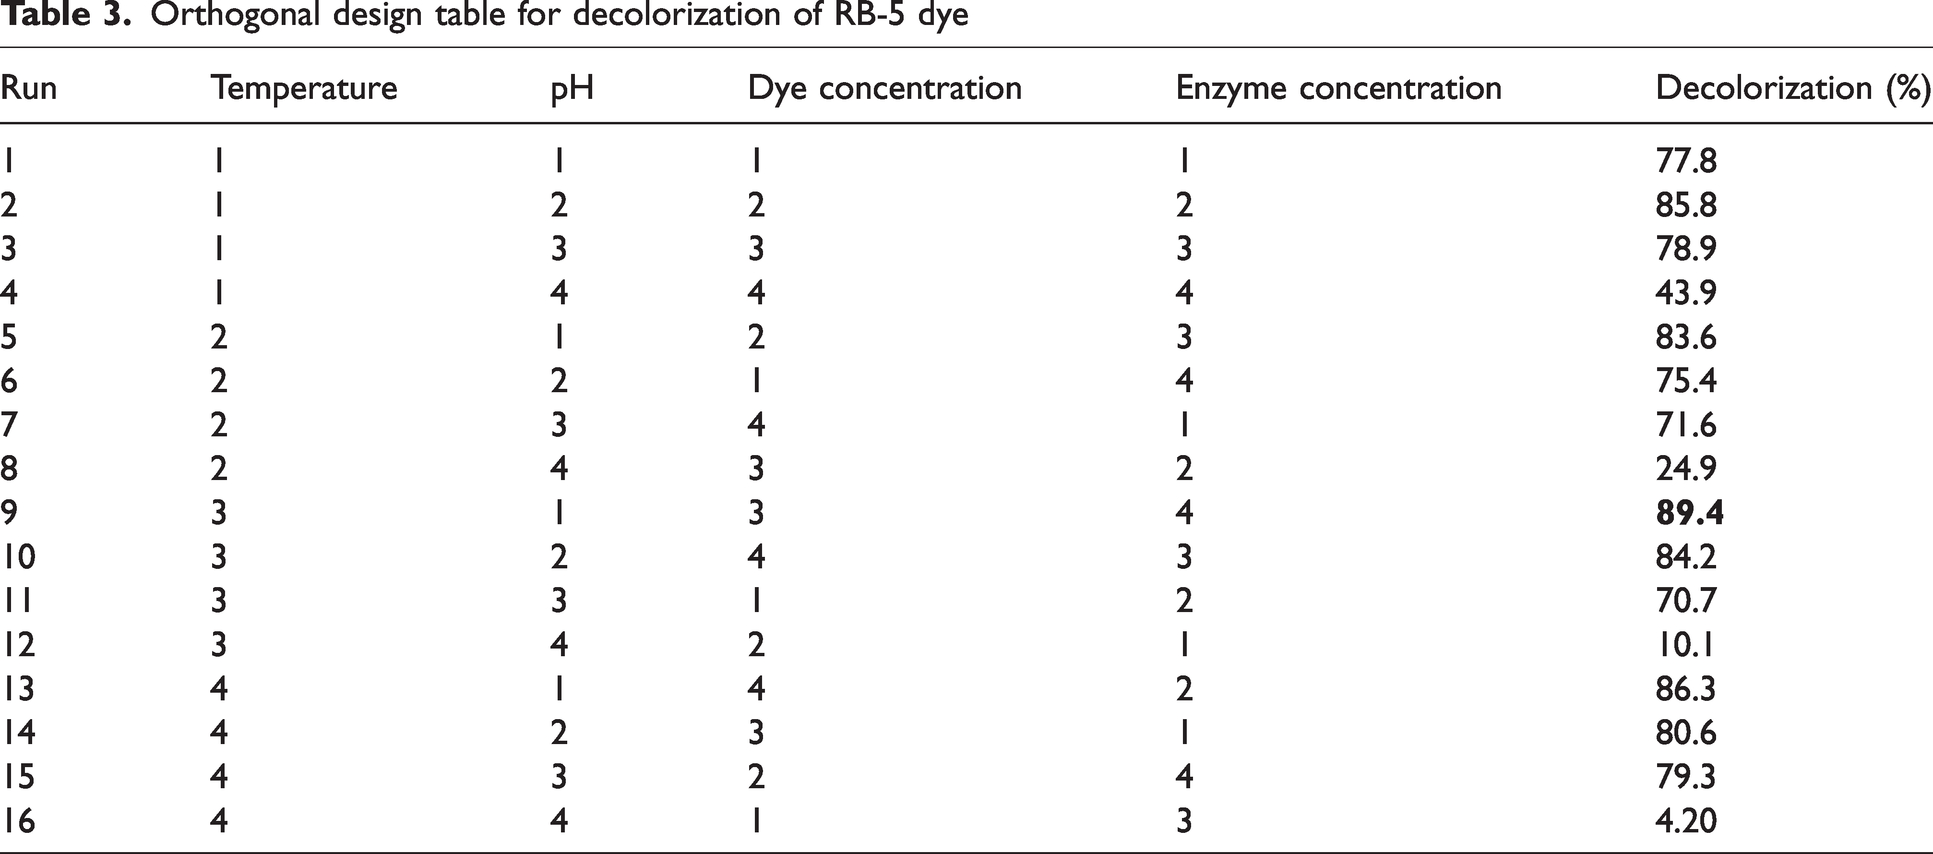
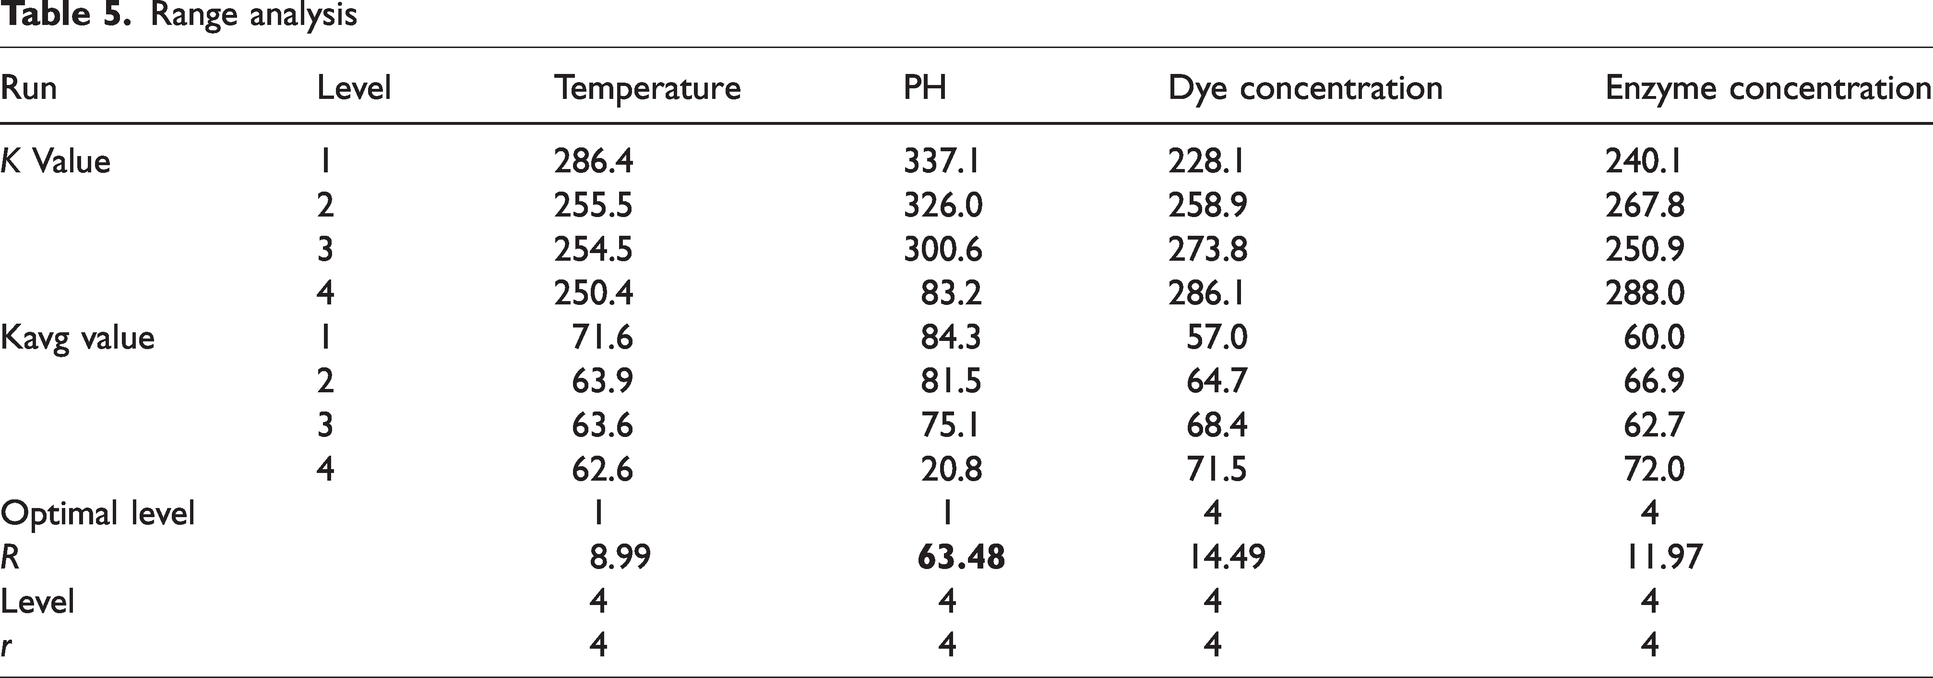
Multivariate ANOVA and range analysis were employed to examine the effects of temperature, pH, dye concentration, and enzyme concentration on decolorization (Tables 4 and 5). According to statistical principles, the R2 value serves as a metric to evaluate the extent to which a model or factors explain the variation in experimental results. An R2 value approaching 1 indicates superior model fitness to the data. The p-value represents the probability of observing current experimental results (or more extreme outcomes) under the null hypothesis that the factor or interaction effect has no effect on the results. Typically, a p-value <0.05 is considered statistically significant, indicating a measurable effect of the factor. Table 4 indicates an R2 value of 0.988, confirming the validity and precision of the experimental design. The experimental data indicated that pH value exhibited a significant effect on DE (p < 0.05), whereas temperature, dye concentration, and enzyme concentration showed no significant effects (p > 0.05). Range analysis ranked the factors affecting DE as follows: pH > dye concentration >temperature > enzyme concentration. The optimal decolorization conditions were identified as pH 2, 100 mg/l dye concentration, 30°C, and 2 U/ml enzyme concentration.
Multiple factors variance analysis
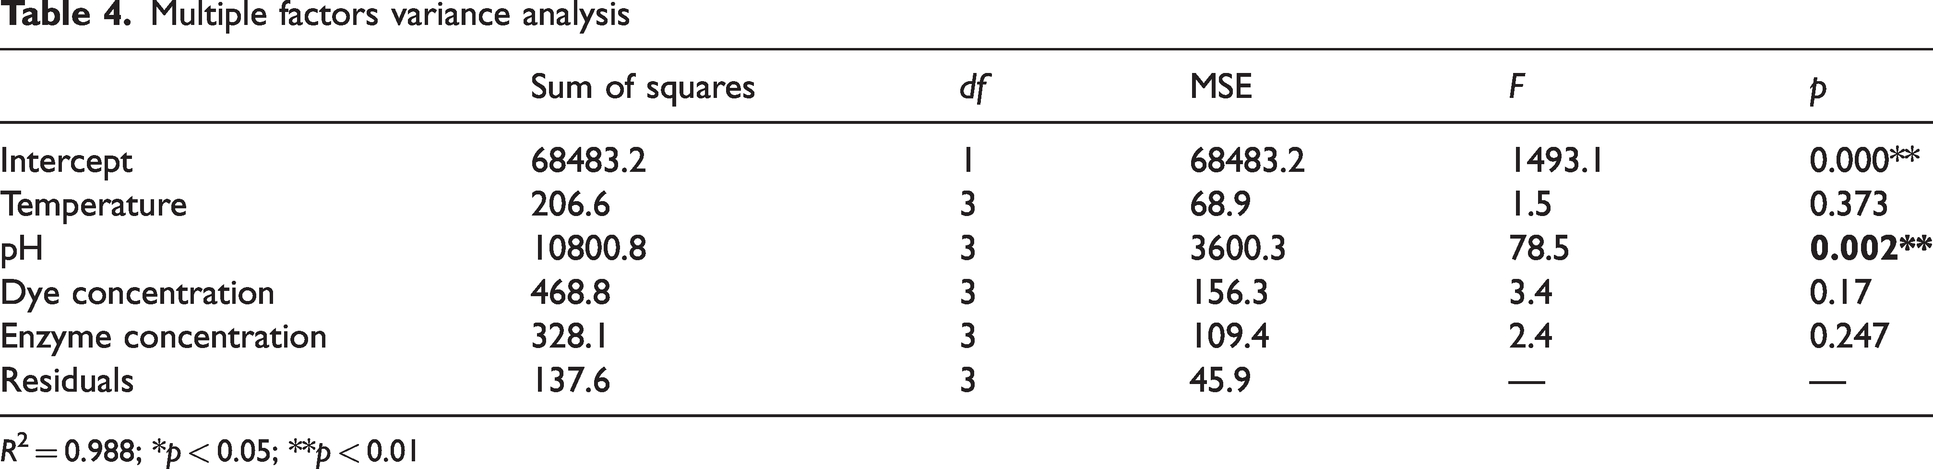
R2 = 0.988; *p < 0.05; **p < 0.01
Range analysis
Dye solution absorbance before and after decolorization
Enzymatic decolorization was carried out for RR-24, RY-3, and RB-5 according to the optimal process obtained previously. Figure 1 illustrates that the ultraviolet (UV) spectra of the dye solutions before and after decolorization revealed significant changes32–34: the greatest absorption peak for RR-24 at 485 nm diminished, whereas the absorption peaks for RY-3 and RB-5 nearly vanished. These results indicate that laccase effectively degraded these three reactive dyes. The degradation was most pronounced for the blue and yellow reactive dyes, with a slightly lesser effect on the red dye. Figure 1(d) shows the visual characteristics of the dyes before and after treatment.
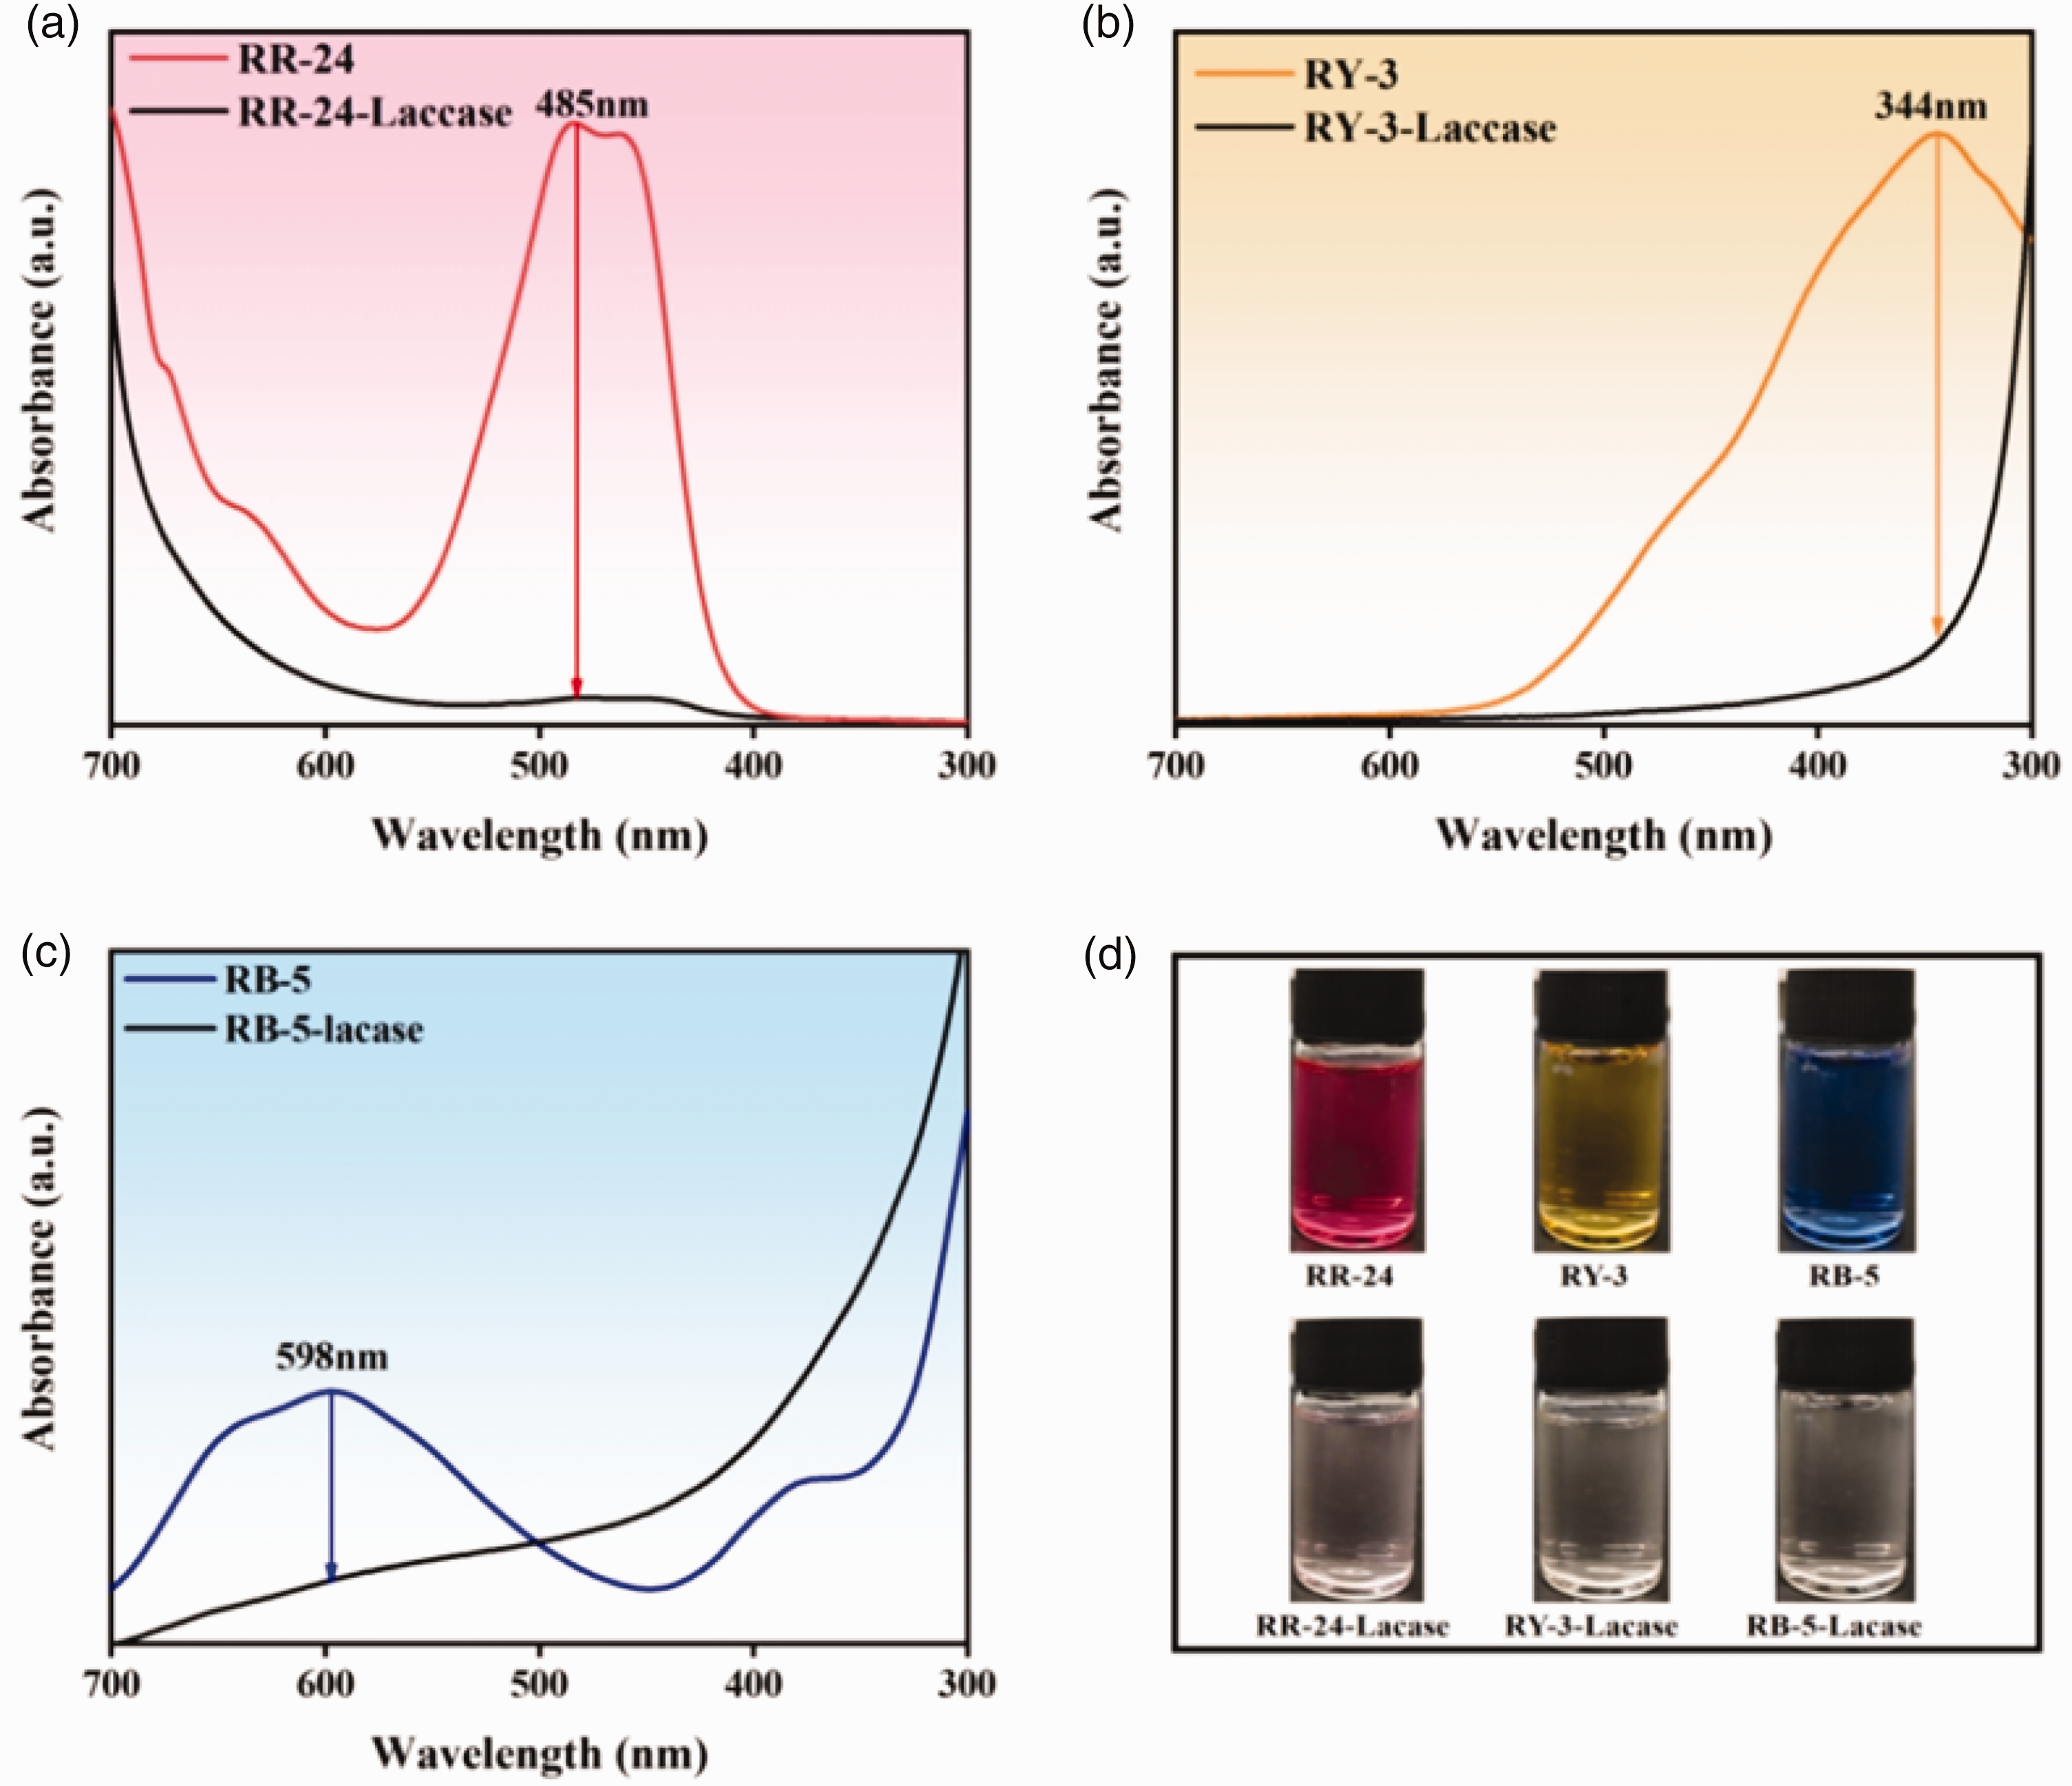
Ultraviolet spectrum of RR-24 (a), RY-3 (b), and RB-5 (c) solution and digital photo (d) before and after decolorization.
Single-factor experiment results on cotton fabric decolorization
Figure 2 illustrates the effect of duration, enzyme concentration, liquid ratio, temperature, HBT addition, and pH value on the DE of dyed fabrics. It is evident that as the time reaches 45 min, the DE reaches a stable value, and the influence of liquor ratio and enzyme concentration on the DE is not significant, while the influence of temperature, pH, and HBT concentration on the DE is more pronounced. This study will examine the reciprocal effects of temperature, pH, and HBT concentration on the decolorization rate of laccase by response surface studies and identify the optimal combination conditions. The actual conditions for liquor ratio, enzyme concentration, and time were set to be 1:20, 0.5 U/ml, and 60 min, respectively, to explore the optimal combination conditions.
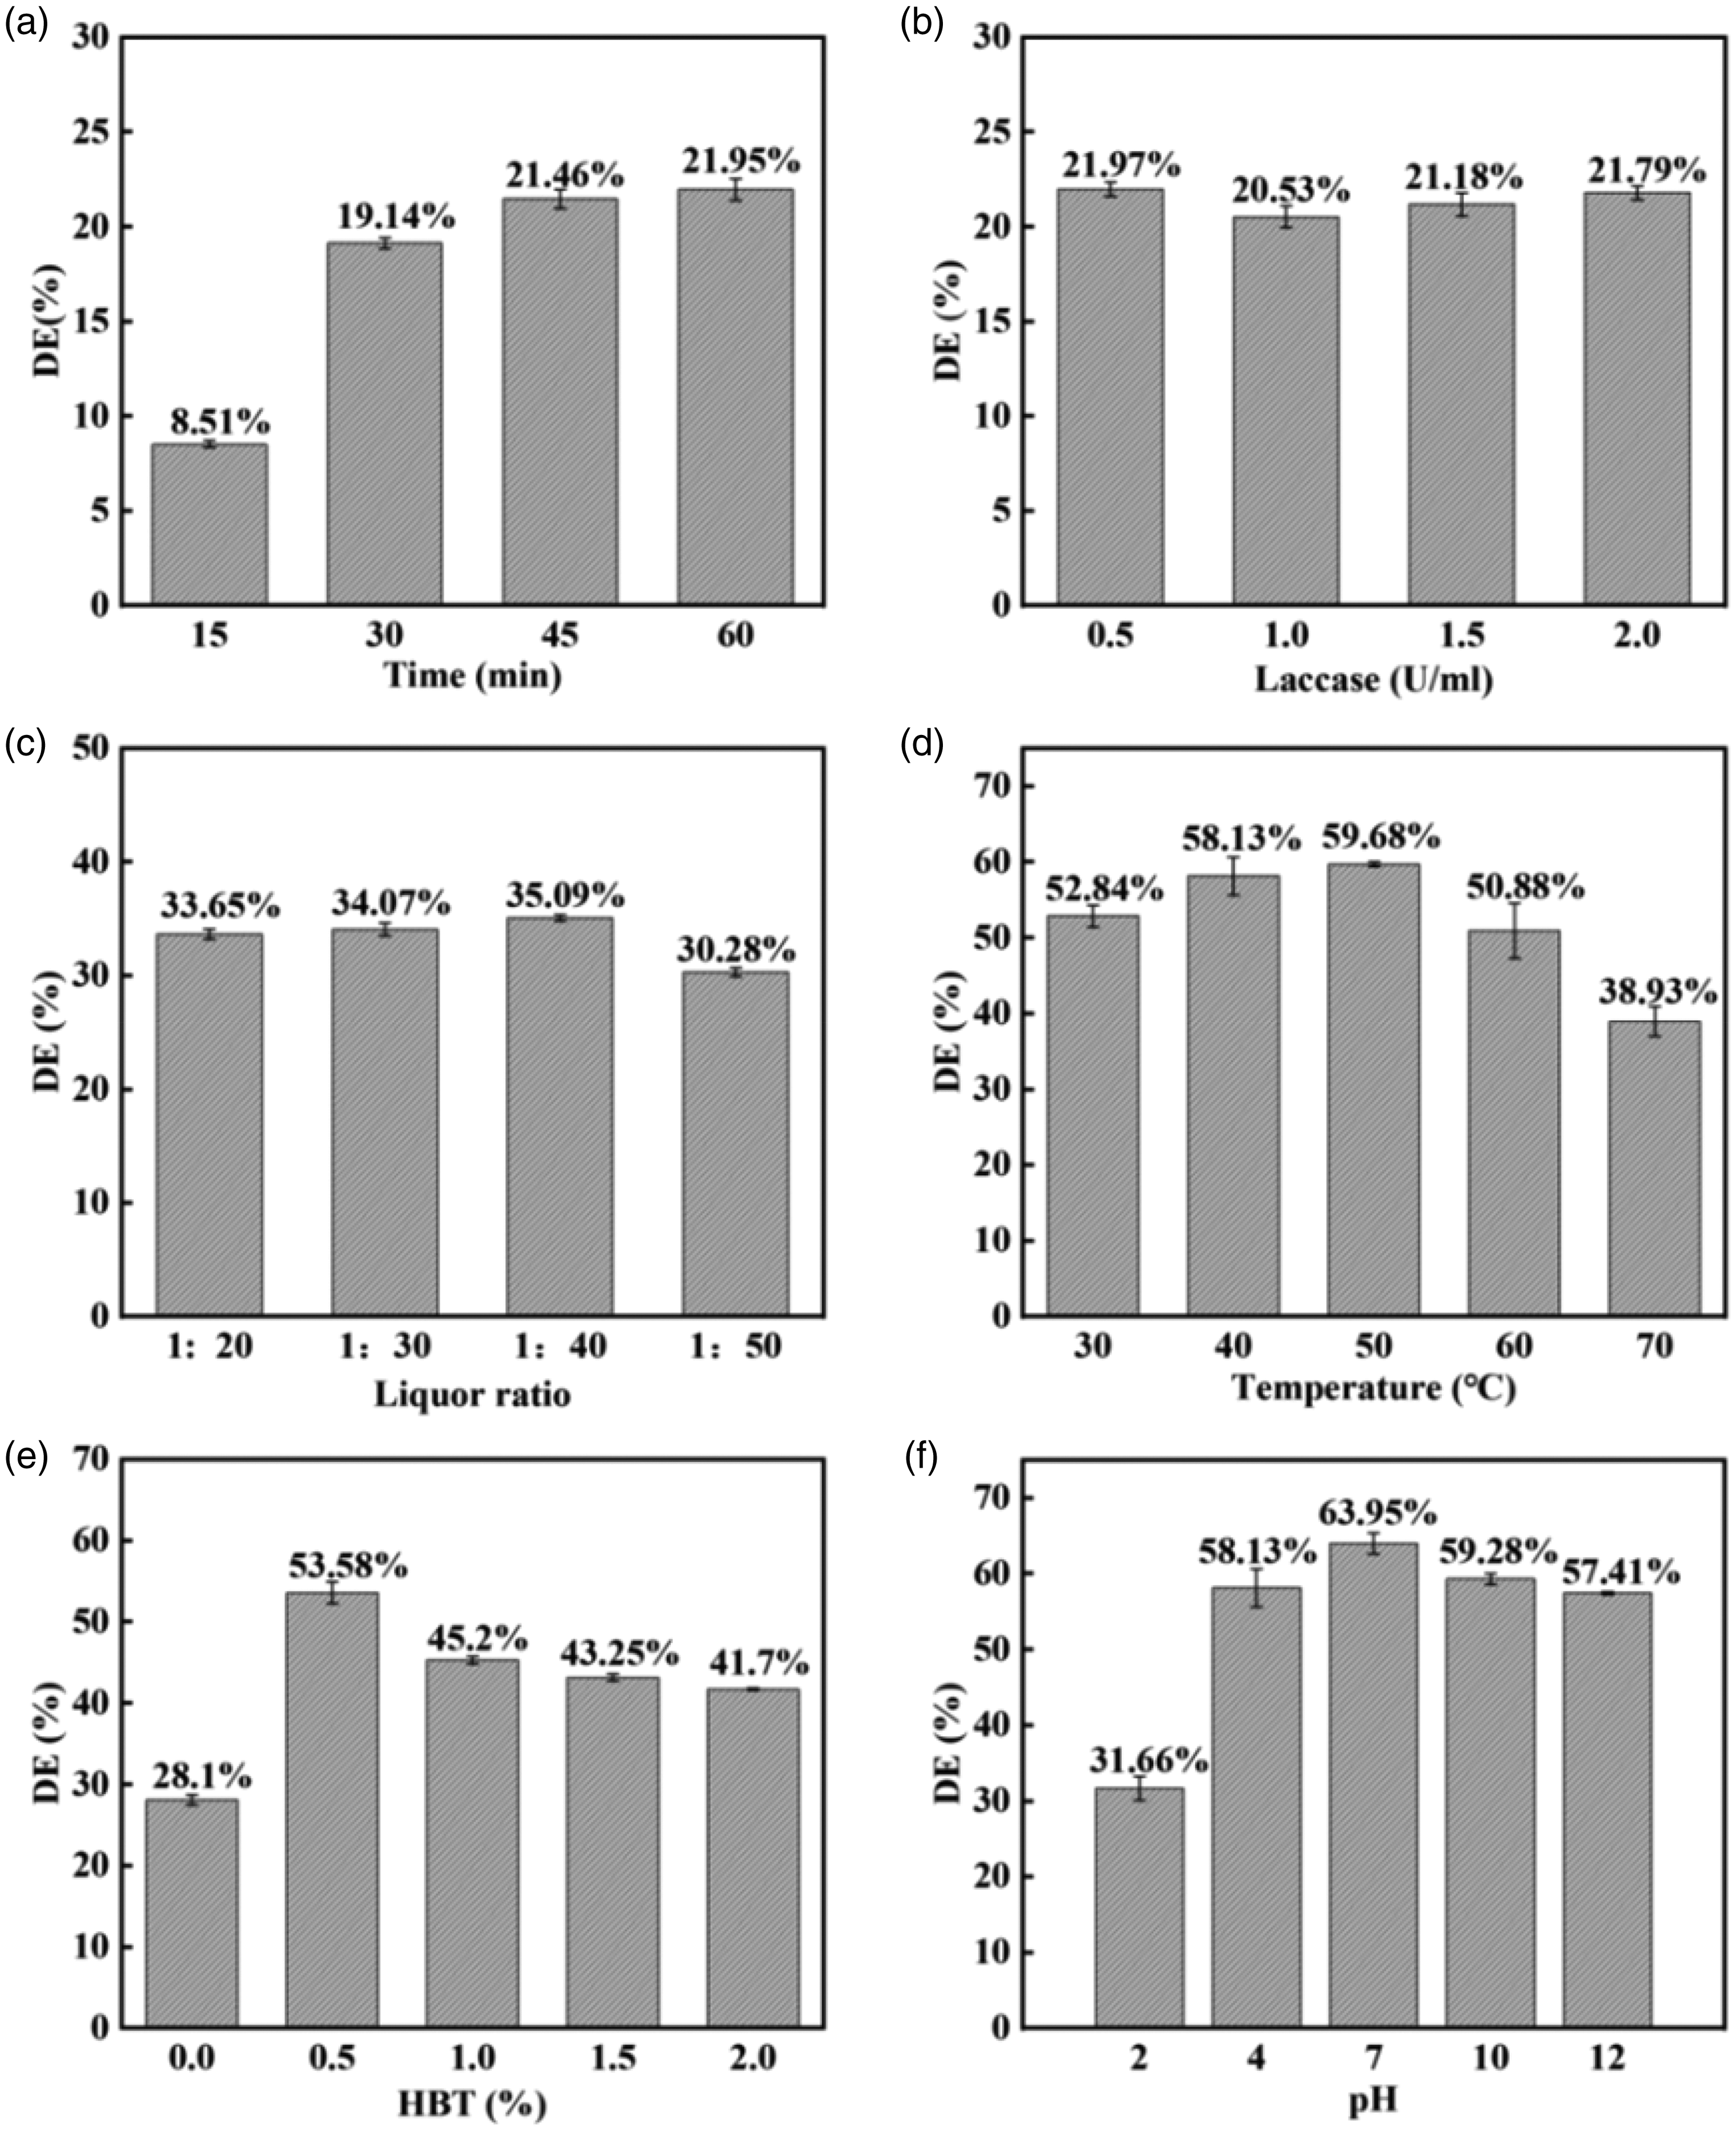
Effects of different decolorization conditions on RB-5 dyed cotton fabric: (a) time, (b) laccase concentration, (c) liquor ratio, (d) temperature, (e) HBT concentration, and (f) pH.
RSM experimental results of three dyed cotton fabrics
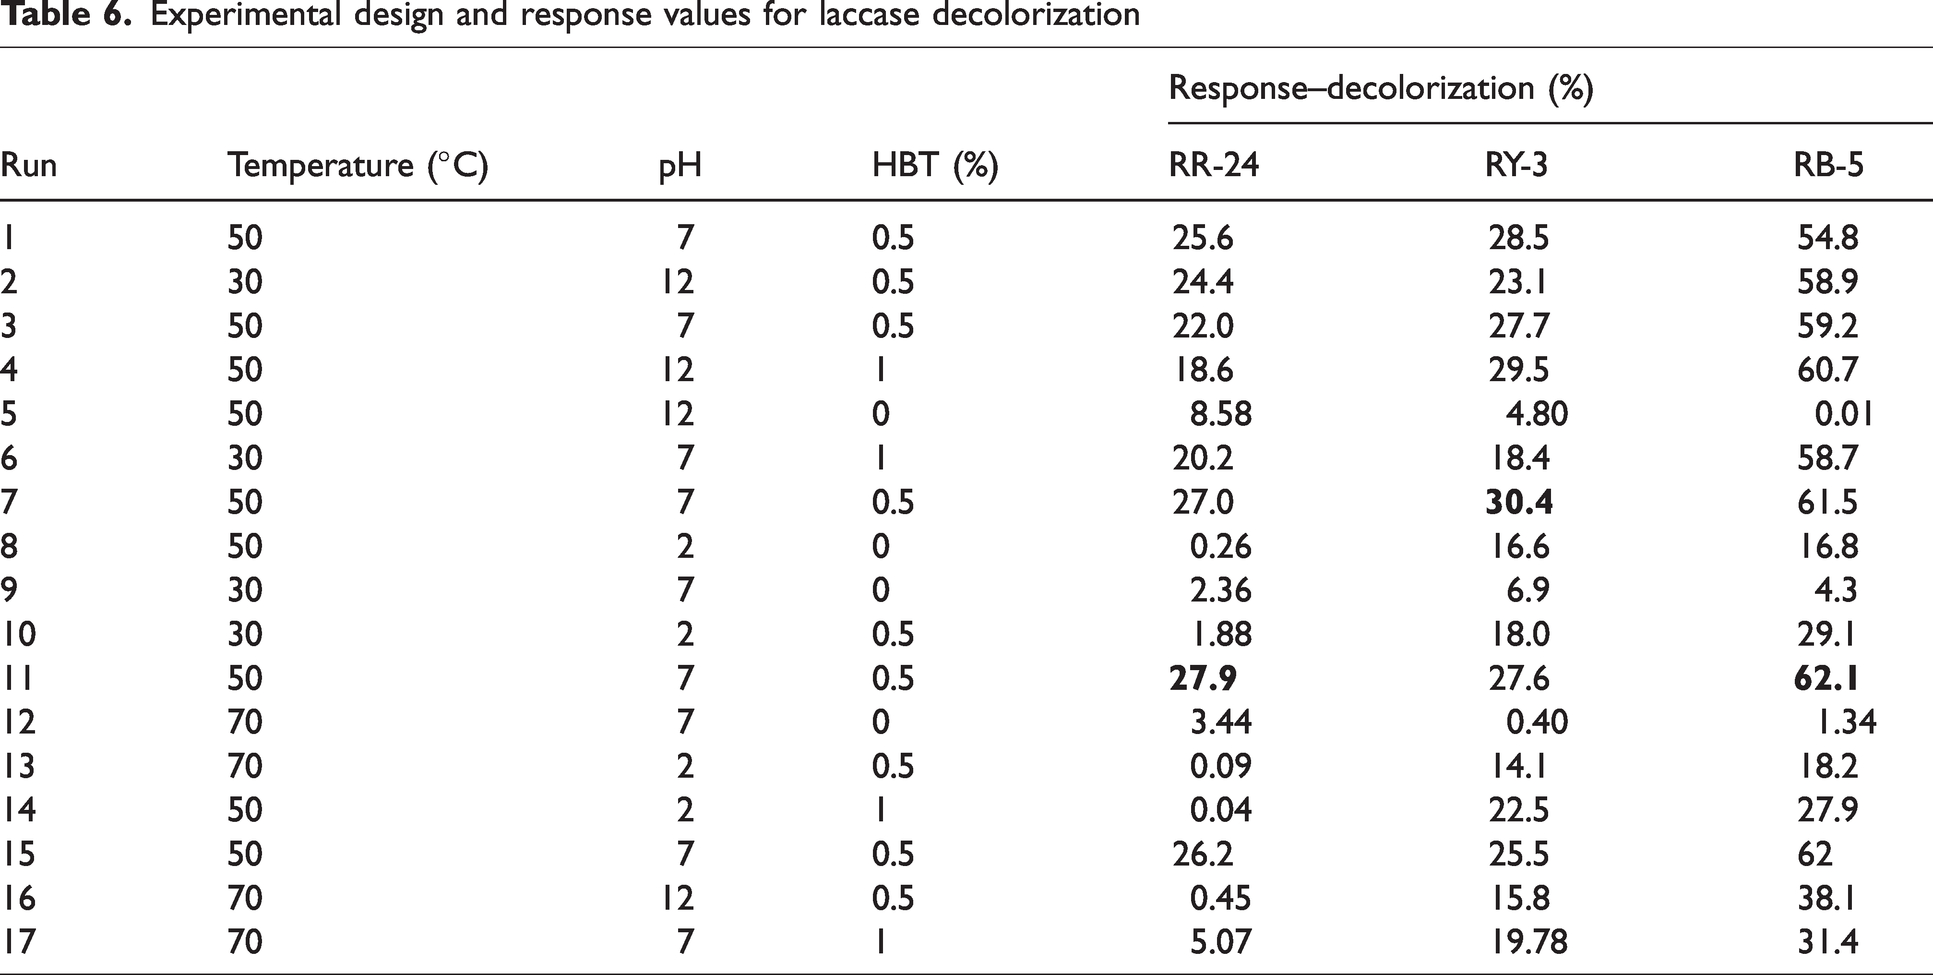
A RSM experimental design 35 was employed to perform enzymatic decolorization on three types of dyed cotton fabrics: RR-24, RY-3, and RB-5. Each fabric underwent 17 experimental runs, with the experimental conditions and corresponding results for each group presented in Table 6.
Experimental design and response values for laccase decolorization
Analysis of enzymatic decolorization of RR-24 dyed cotton fabric
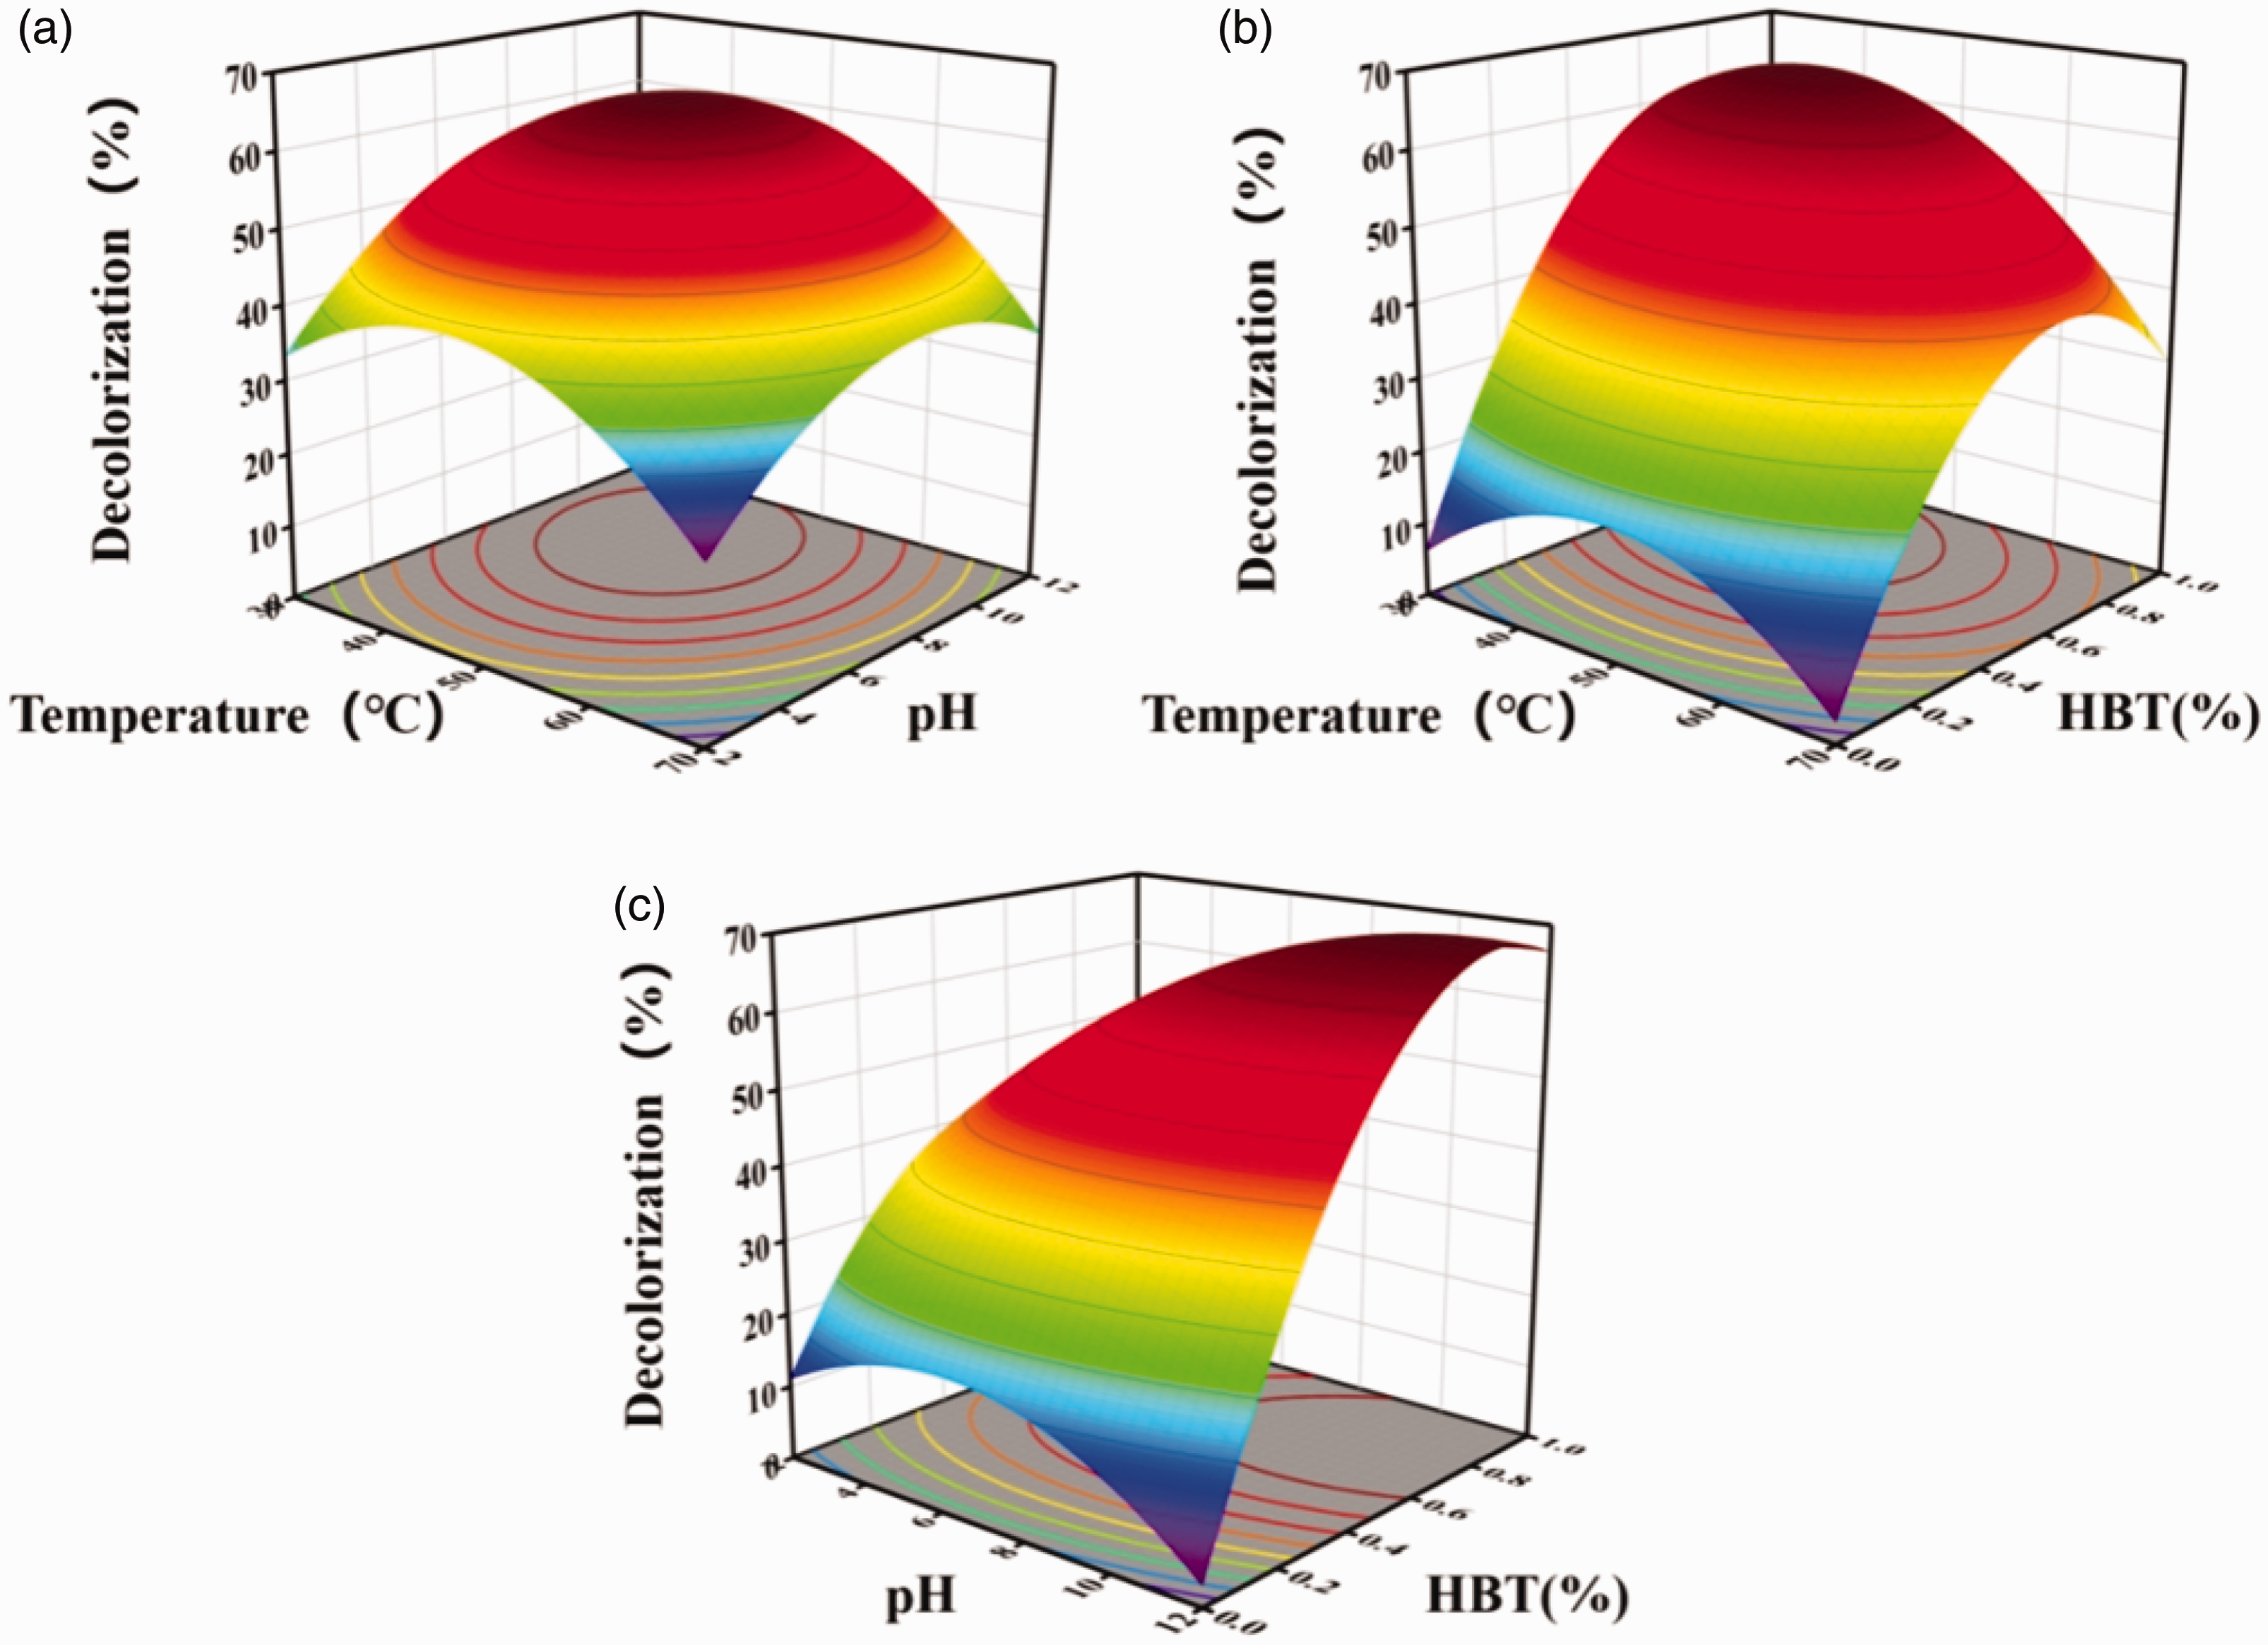
As indicated in Table 6, run 11 had the highest decolorization (27.9%) under the experimental conditions with a temperature of 50°C, pH 7, and HBT concentration of 0.5%. Conversely, there is almost no decolorization at pH 2. The second-order polynomial (according to the coding factor) is obtained by BBD:
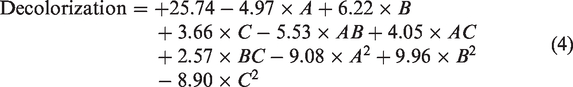
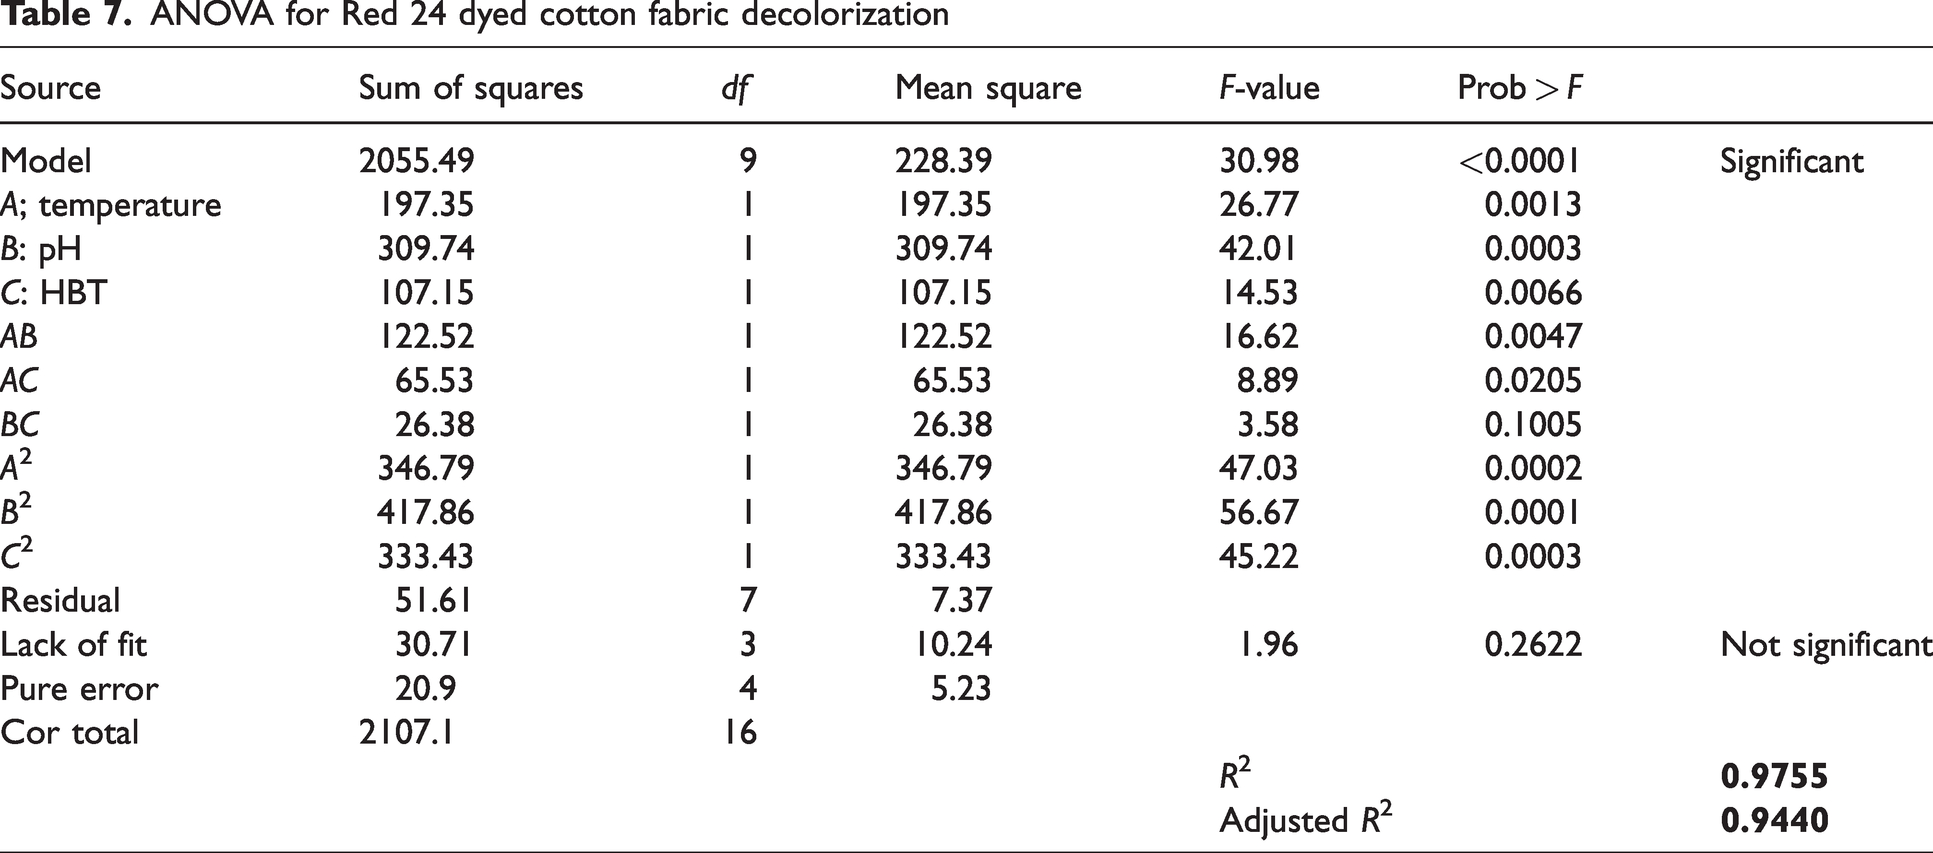
Table 7 presents the results of the analysis of variance. The data indicate that the model is highly significant (F = 30.98, p < 0.0001). The main effects (A, B, C), interaction terms (AB, AC), and quadratic terms are all significant (p < 0.05). The model has excellent predictive ability (predicted R2 = 0.97, adjusted R2 = 0.94), the lack of fit has an F-value of 1.96, suggesting it is not significant compared to pure error, with only a 26.22% chance that such a large F-value could occur due to noise. A three-dimensional response surface plot was drawn, as shown in Figure 3. The independent variables, namely temperature, pH, and HBT concentration, each have their respective extreme points. Parabolic relationships were observed between these test factors and the response variable (DE). Figure 3(a) shows that DE peaked at approximately 50°C and pH 7. Figure 3(b) reveals maximum efficiency at a 0.5% HBT concentration and around 50°C. Figure 3(c) further demonstrated that optimal decolorization occurred at pH 7 and 0.5% HBT concentration, indicating that even minimal additions of HBT significantly enhanced laccase-mediated fabric decolorization, whereas overly high HBT levels suppressed the effect. Among all tested factors, the parabolic curve for HBT concentration was the steepest. Comparative analysis confirmed that HBT concentration exerted a more pronounced influence on DE than temperature and pH. Under optimized conditions of HBT concentration at 0.5%, pH 7, and a temperature of 50°C, the DE achieved a maximum of 27.9%.
ANOVA for Red 24 dyed cotton fabric decolorization
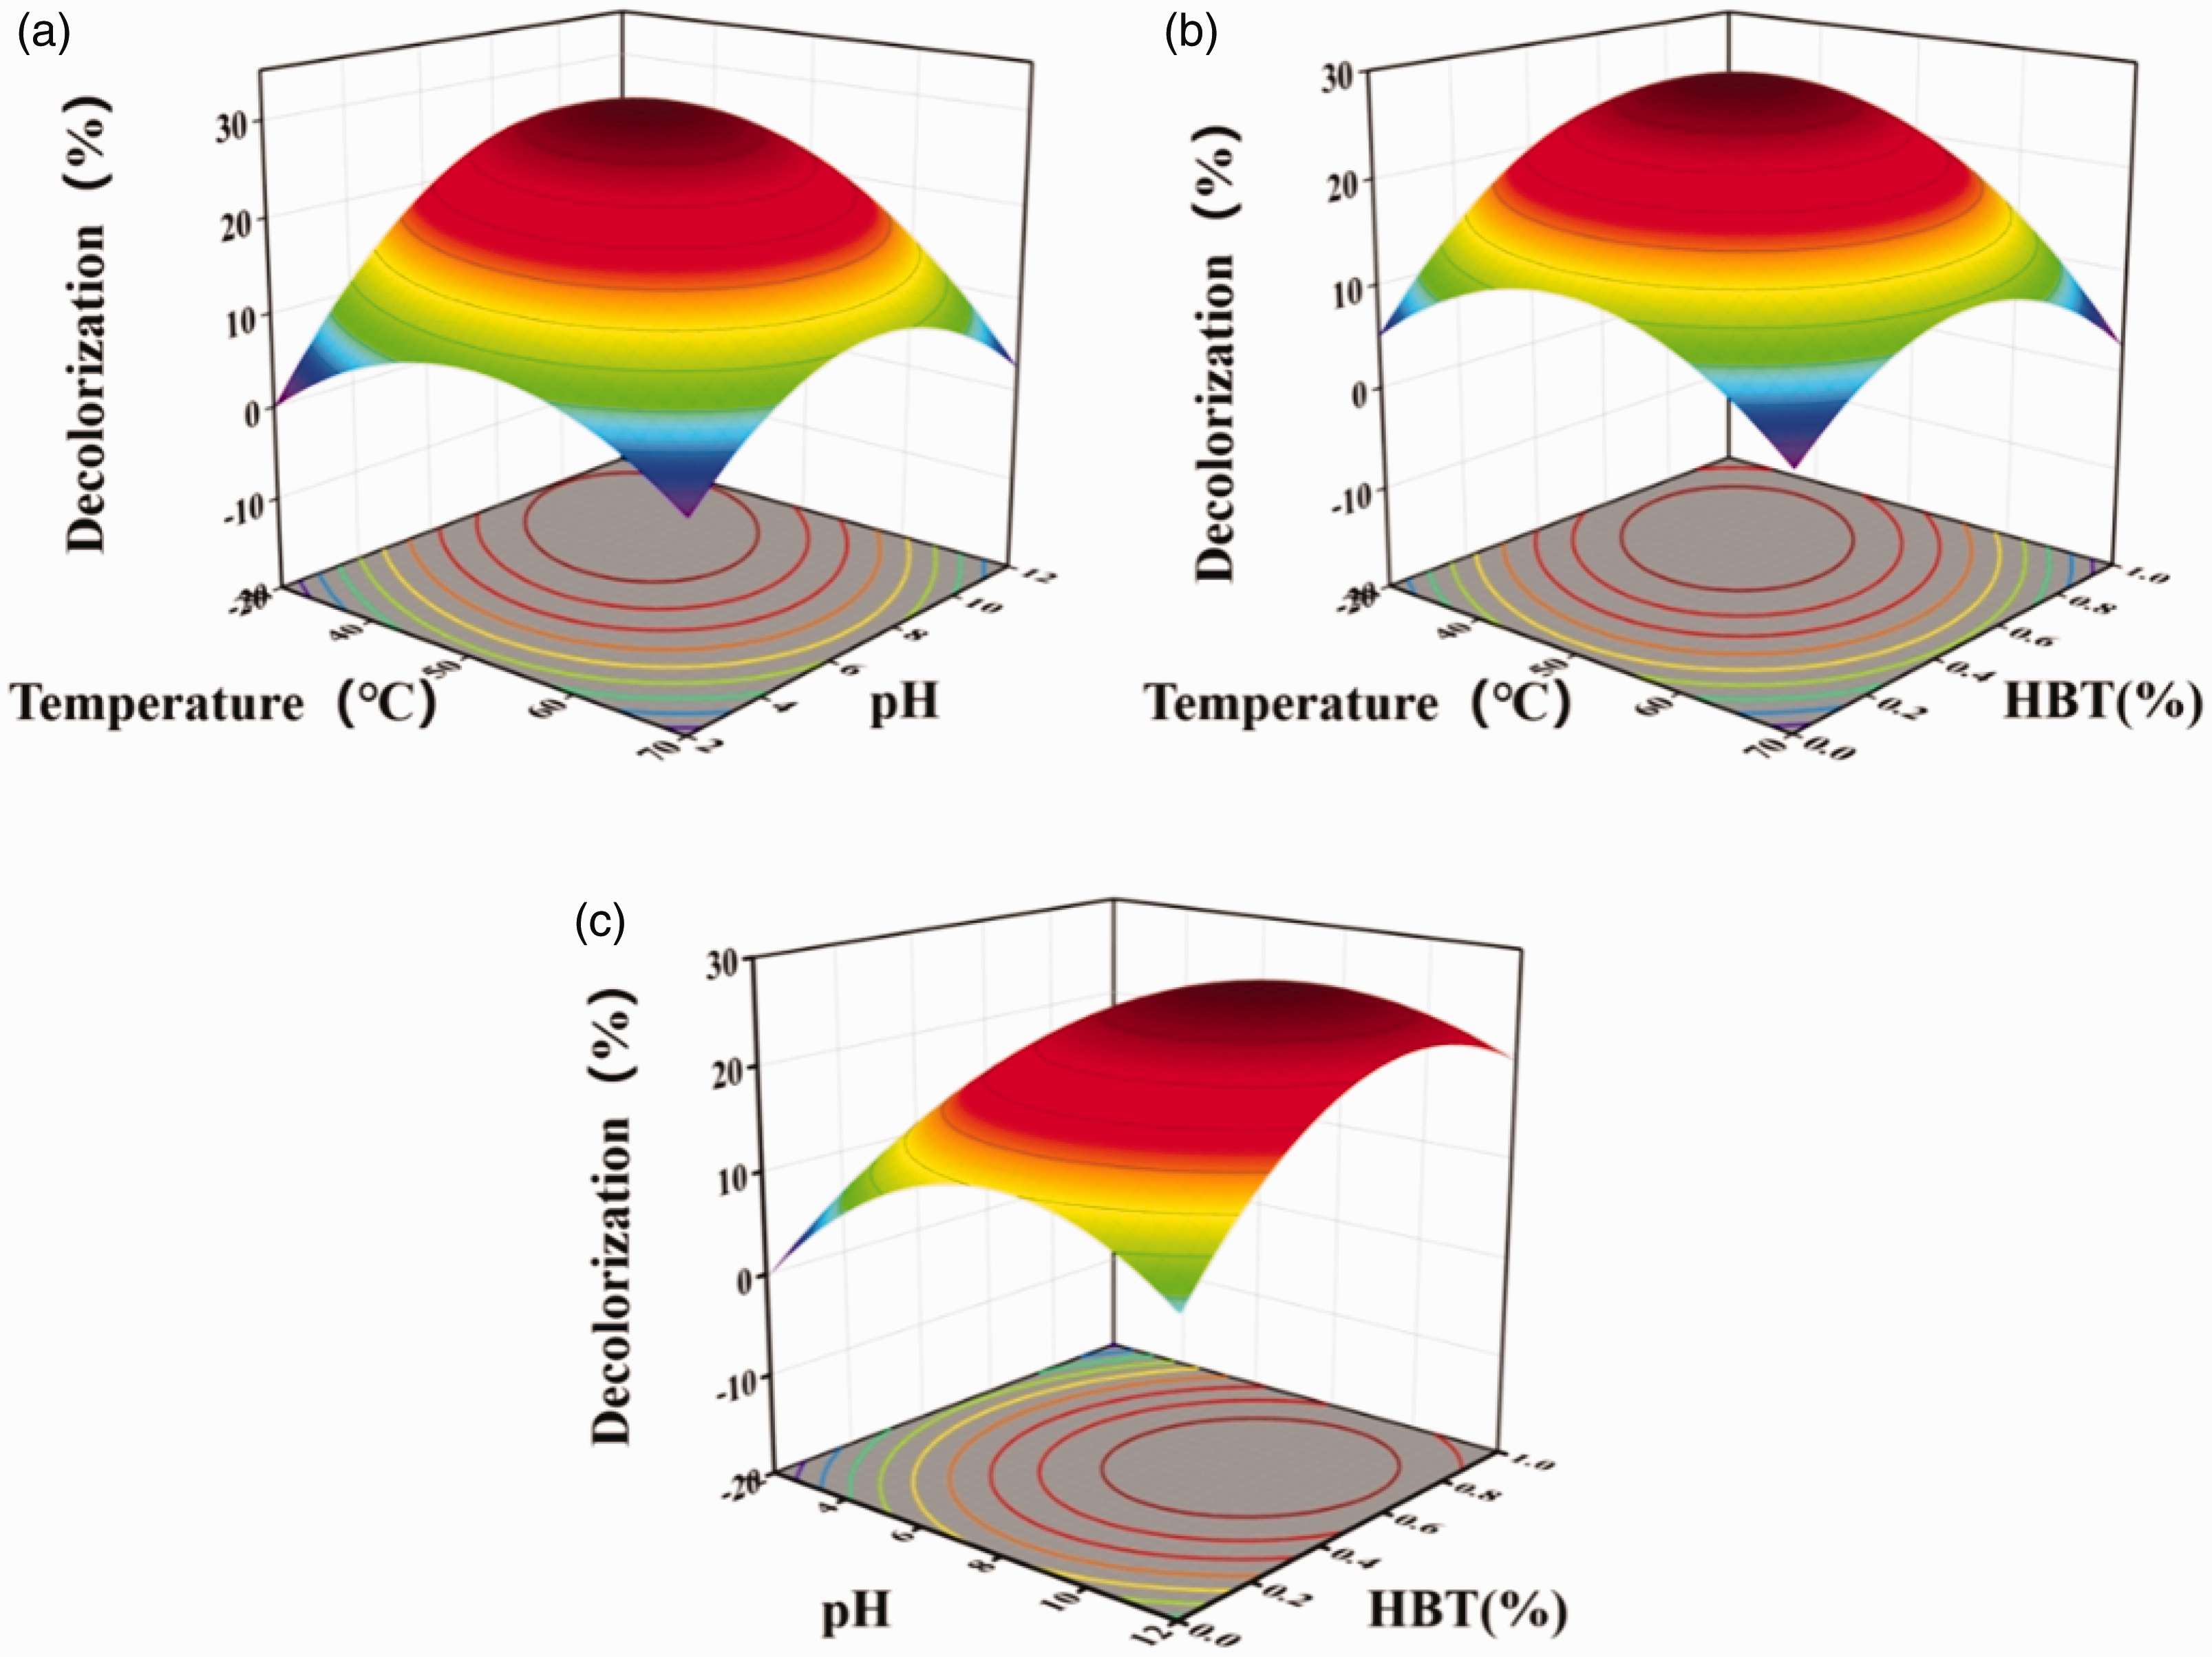
Three-dimensional response surface plots of laccase-mediated reactive red 24 dyed fabric decolorization.
Analysis of enzymatic decolorization of RY-3 dyed cotton fabric
Table 6 showed that the highest decolorization (30.4%) was observed in run 7 under the experimental conditions of temperature 50°C, pH 7, and HBT concentration of 0.5%. Conversely, the lowest decolorization (0.4%) was observed in run 12 with a pH of 12, temperature of 50°C, and without HBT. By BBD we can obtain the second-order polynomial (in terms of coded factors):
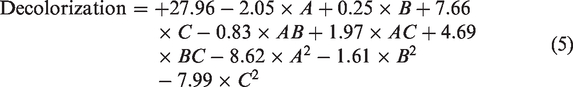
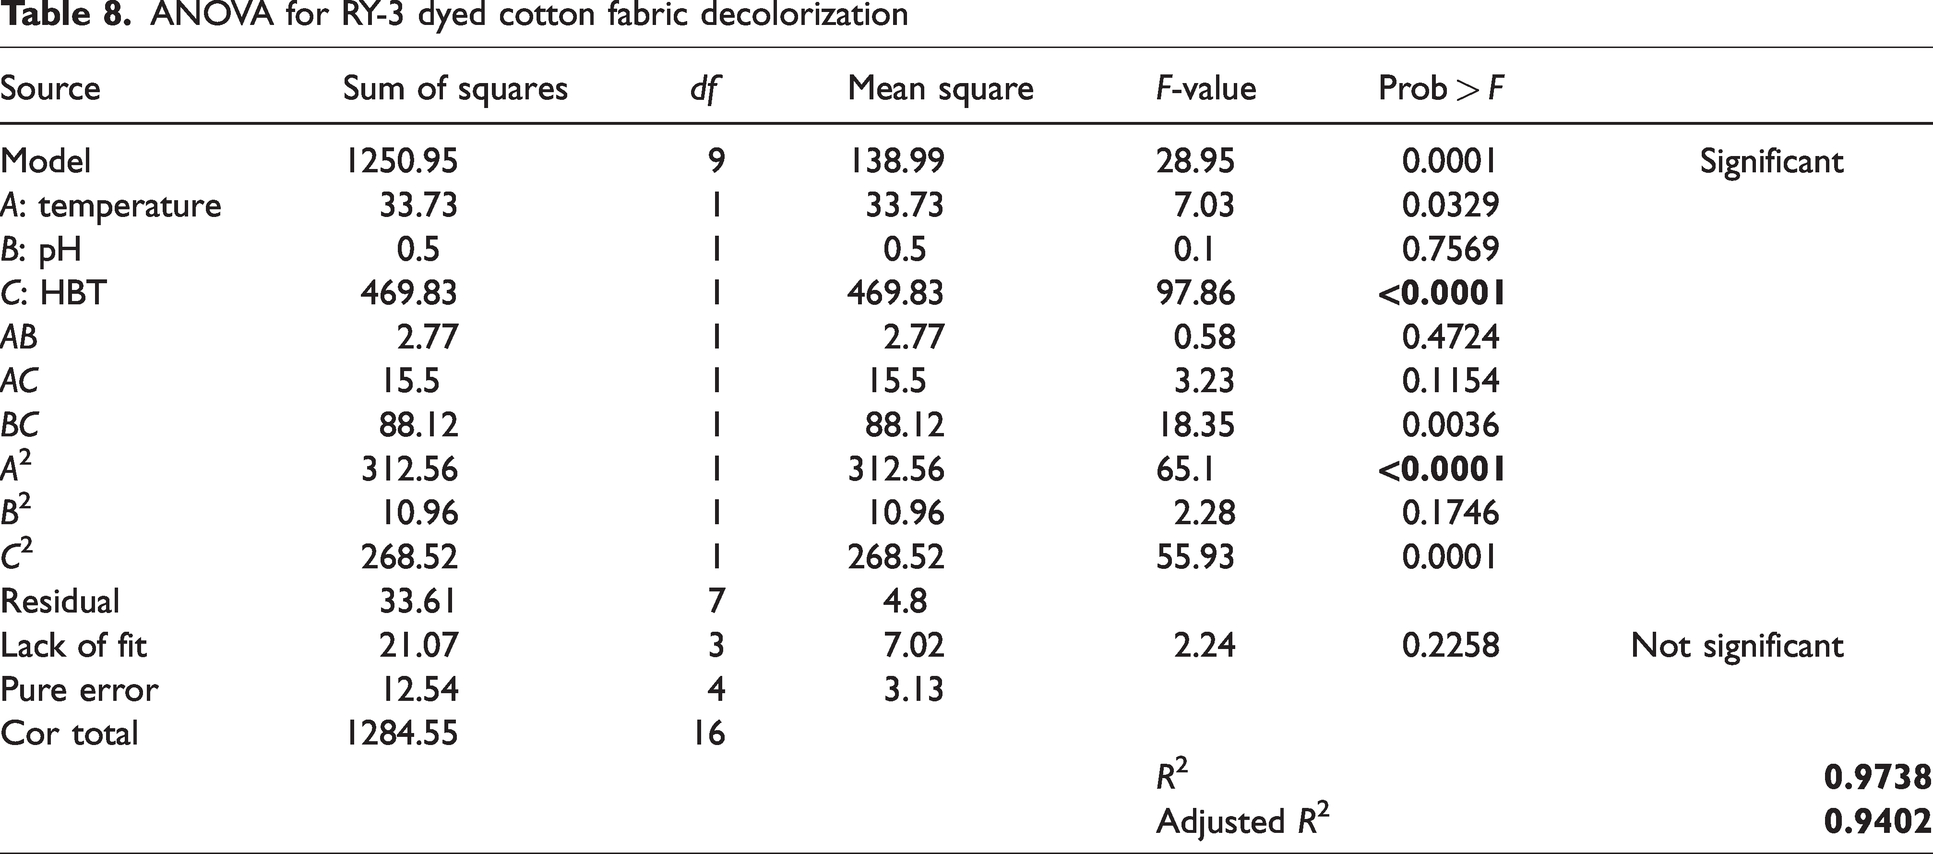
Table 8 lists the results of the ANOVA. The data indicate that the model is highly significant (F = 28.95, p < 0.001). The main effects (A, C), interaction terms (BC), and quadratic terms (A2, C2) are all significant (p < 0.05). The model has excellent predictive ability (predicted R2 = 0.97, adjusted R2 = 0.94), and there is no significant lack of fit (F = 2.24, p = 0.2258). A three-dimensional response surface plot is presented in Figure 4. Figure 4(a) illustrates that with HBT concentration fixed, parabolic relationships exist between temperature/pH and the response variable (DE). DE peaked at approximately 50°C and pH 7, with temperature exerting a stronger influence on DE than pH. Figure 4(b) illustrates that, with pH maintained constant, the highest DE was achieved at a 0.5% HBT concentration and approximately 50°C. The steeper parabolic curve for HBT concentration indicated its more pronounced effect on DE compared with temperature. Figure 4(c) further reveals that with temperature fixed, DE gradually decreased as pH increased, whereas it rose with elevating HBT concentration, reaching a plateau at 1% HBT. The slope of the HBT curve exceeded that of the pH curve, highlighting its greater effect. Comparative analysis confirmed that HBT concentration had a more significant effect on DE than temperature or pH. Based on these findings, the optimal decolorization conditions were determined to be 0.5% HBT concentration, pH 7, and 50°C, under which the DE reached 30.4%.
ANOVA for RY-3 dyed cotton fabric decolorization
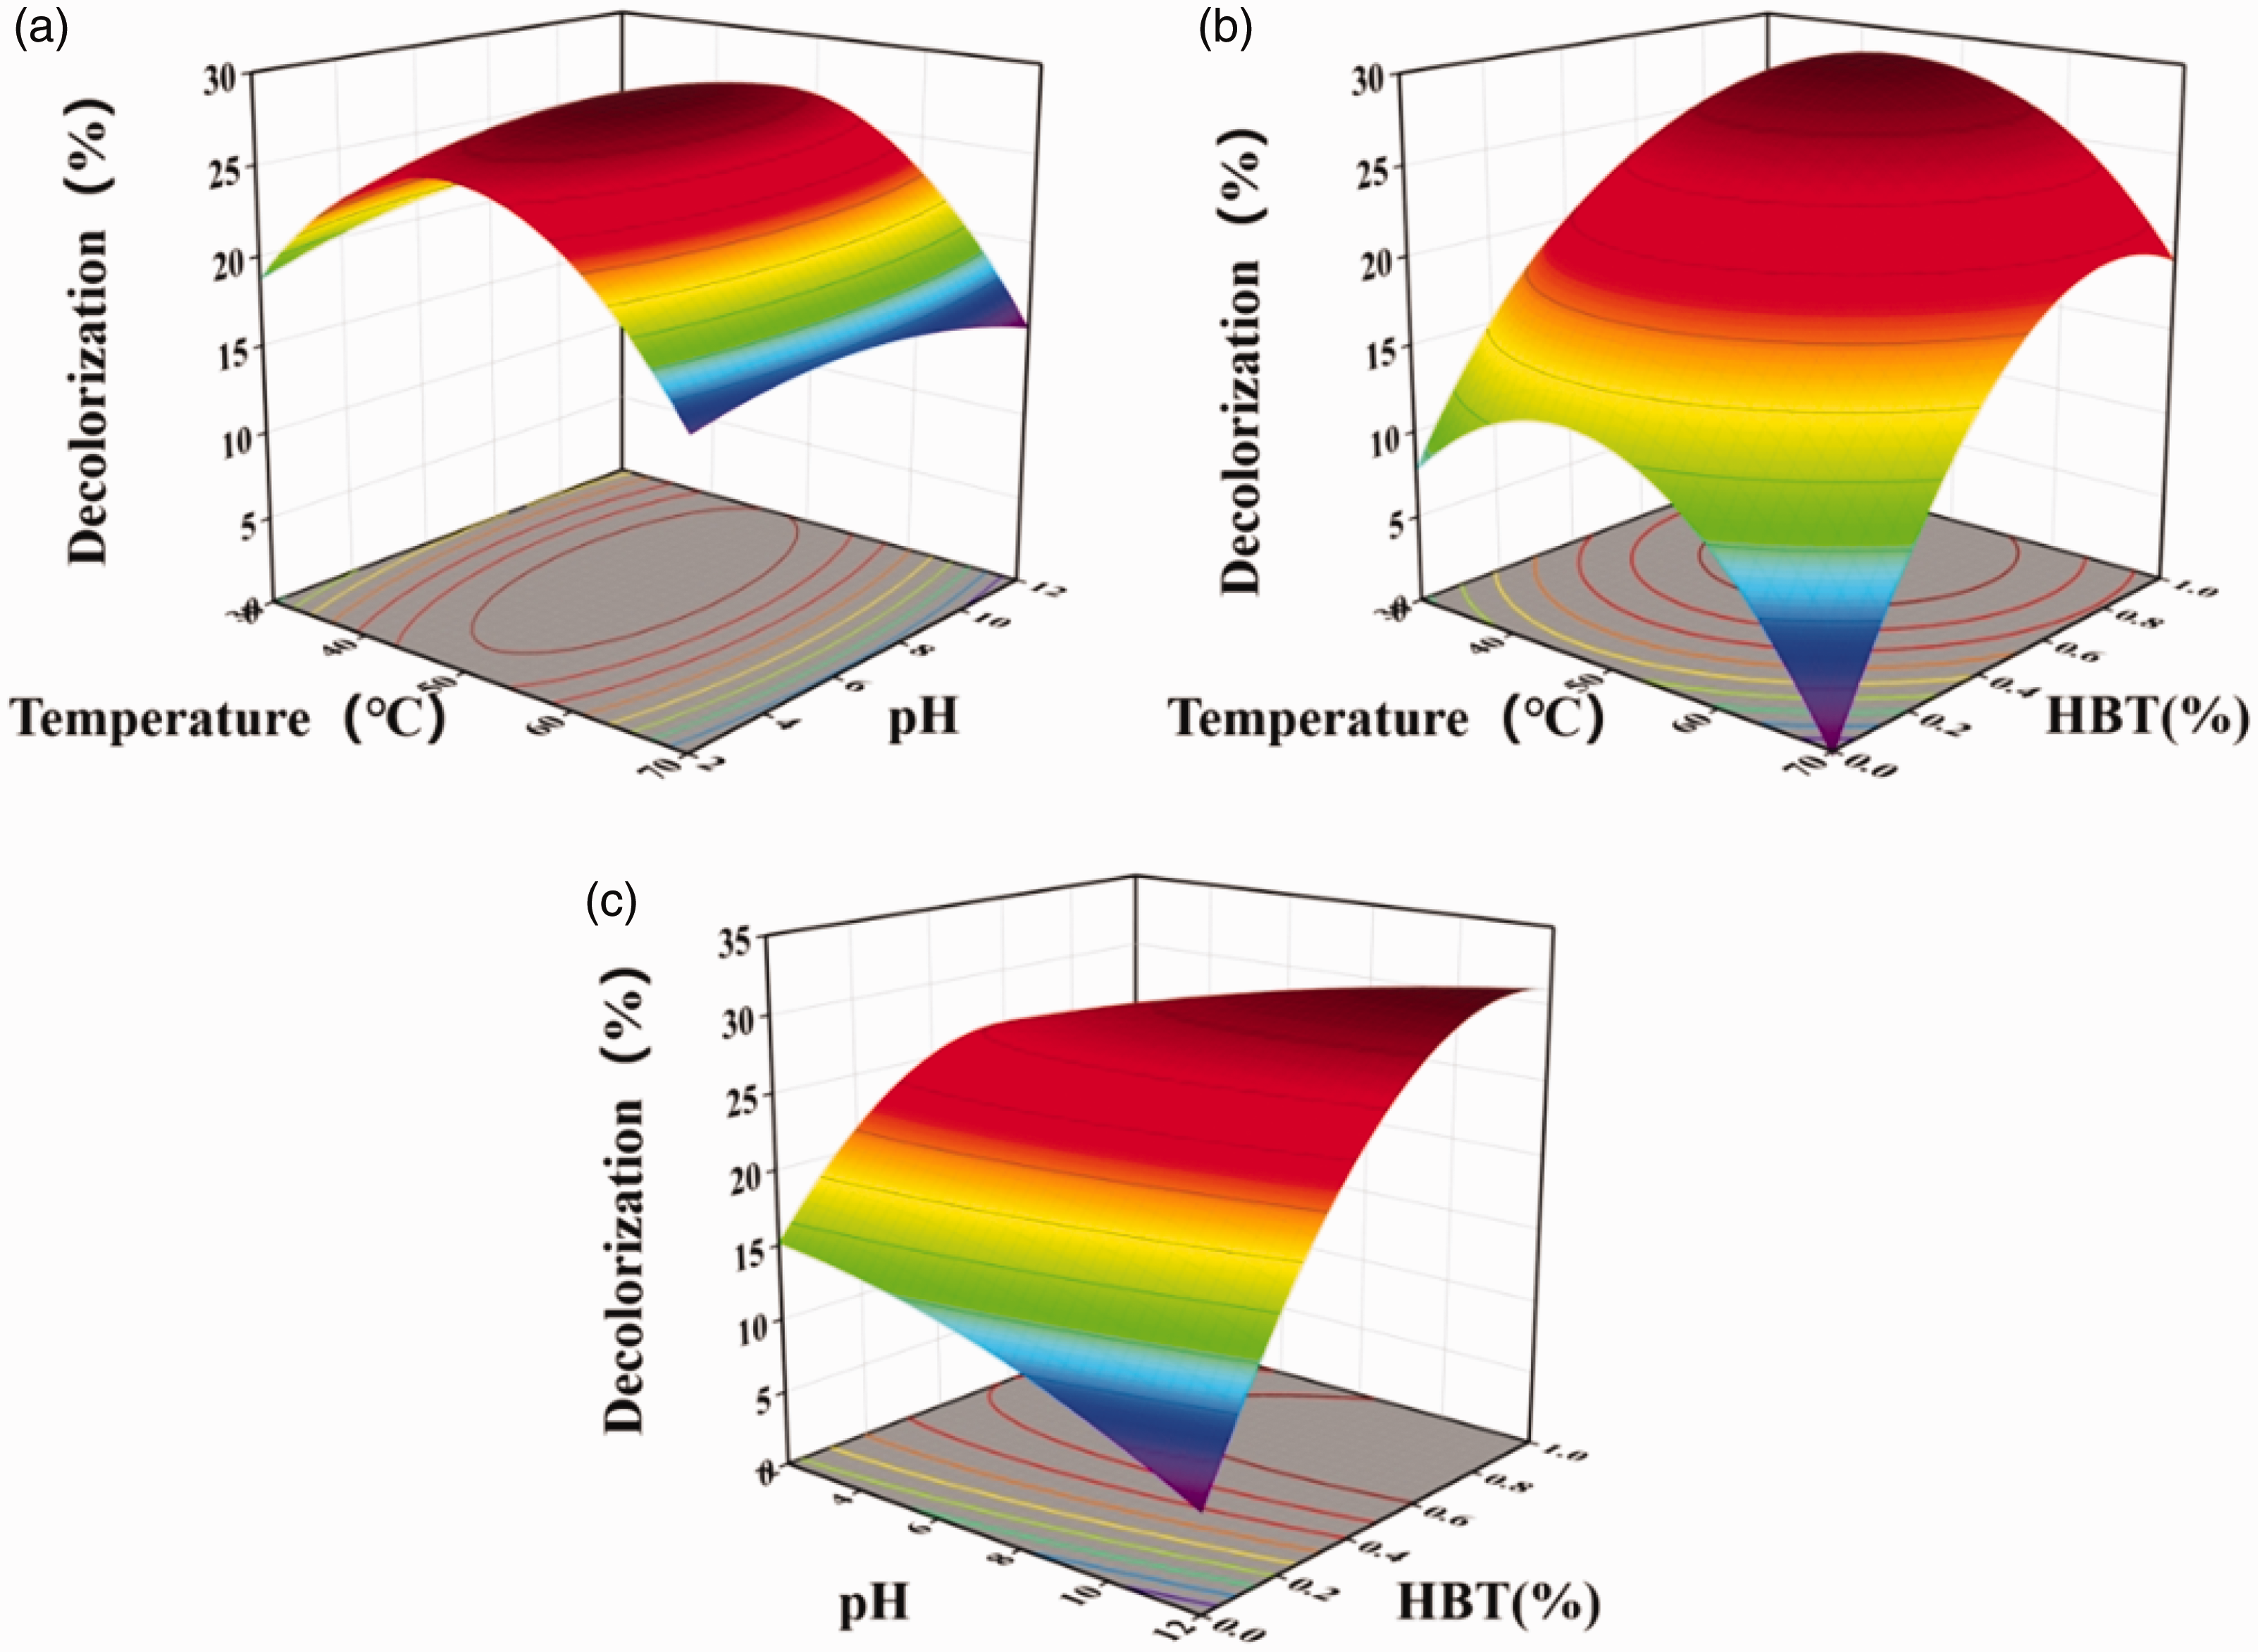
Three-dimensional response surface plots of laccase-mediated RY-3 dyed fabric decolorization.
Analysis of enzymatic decolorization of RB-5 dyed cotton fabrics
As can be seen from Table 6, the highest decolorization (62.1%) was observed in run at the experimental circumstances of 50°C, pH 7, and HBT condition of 0.5%, whereas the minimum decolorization (0.006%) was observed in run 5 at 50°C, pH 12, and without HBT. The following second-order polynomial (in terms of coded factors) was obtained by BBD:
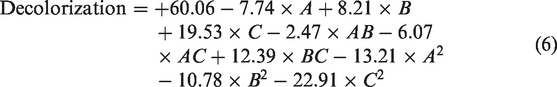
The results of the analysis of variance are presented in Table 9. The data indicate that the model is highly significant (F = 33.08, p < 0.001). The main effects (A, B, C), interaction terms (BC, AC), and quadratic terms are all significant (p < 0.05). The model has excellent predictive ability (predicted R2 = 0.97, adjusted R2 = 0.94), and there is no significant lack of fit (F = 5.25, p = 0.0716). A three-dimensional response is presented in Figure 5. The independent variables, namely temperature, pH, and HBT concentration, each have their respective extreme points. A parabolic relationship was observed between the test factors and the response value. As shown in Figure 5(a), when the HBT concentration was 0.5%, the DE peaked at approximately 50°C and pH 7. Figure 5(b) demonstrates that, with pH fixed at 7, the highest DE occurred at an HBT concentration of 0.5% and around 50°C. Similarly, Figure 5(c) reveals that, when the temperature was maintained at 50°C, the optimal DE was achieved at pH 7 and an HBT concentration of 0.5%. The slope of the HBT concentration curve was significantly steeper than that of the pH curve. Comprehensive analysis indicated that among all tested factors, the parabolic curve for HBT concentration was the steepest, suggesting that HBT concentration had a more pronounced effect on DE than temperature and pH. The findings indicate that the ideal conditions for decolorization are an HBT concentration of 0.5%, a pH of 7, and a temperature of 50°C, resulting in a decolorization rate of 62.1%.
ANOVA for RB-5 dyed fabric decolorization
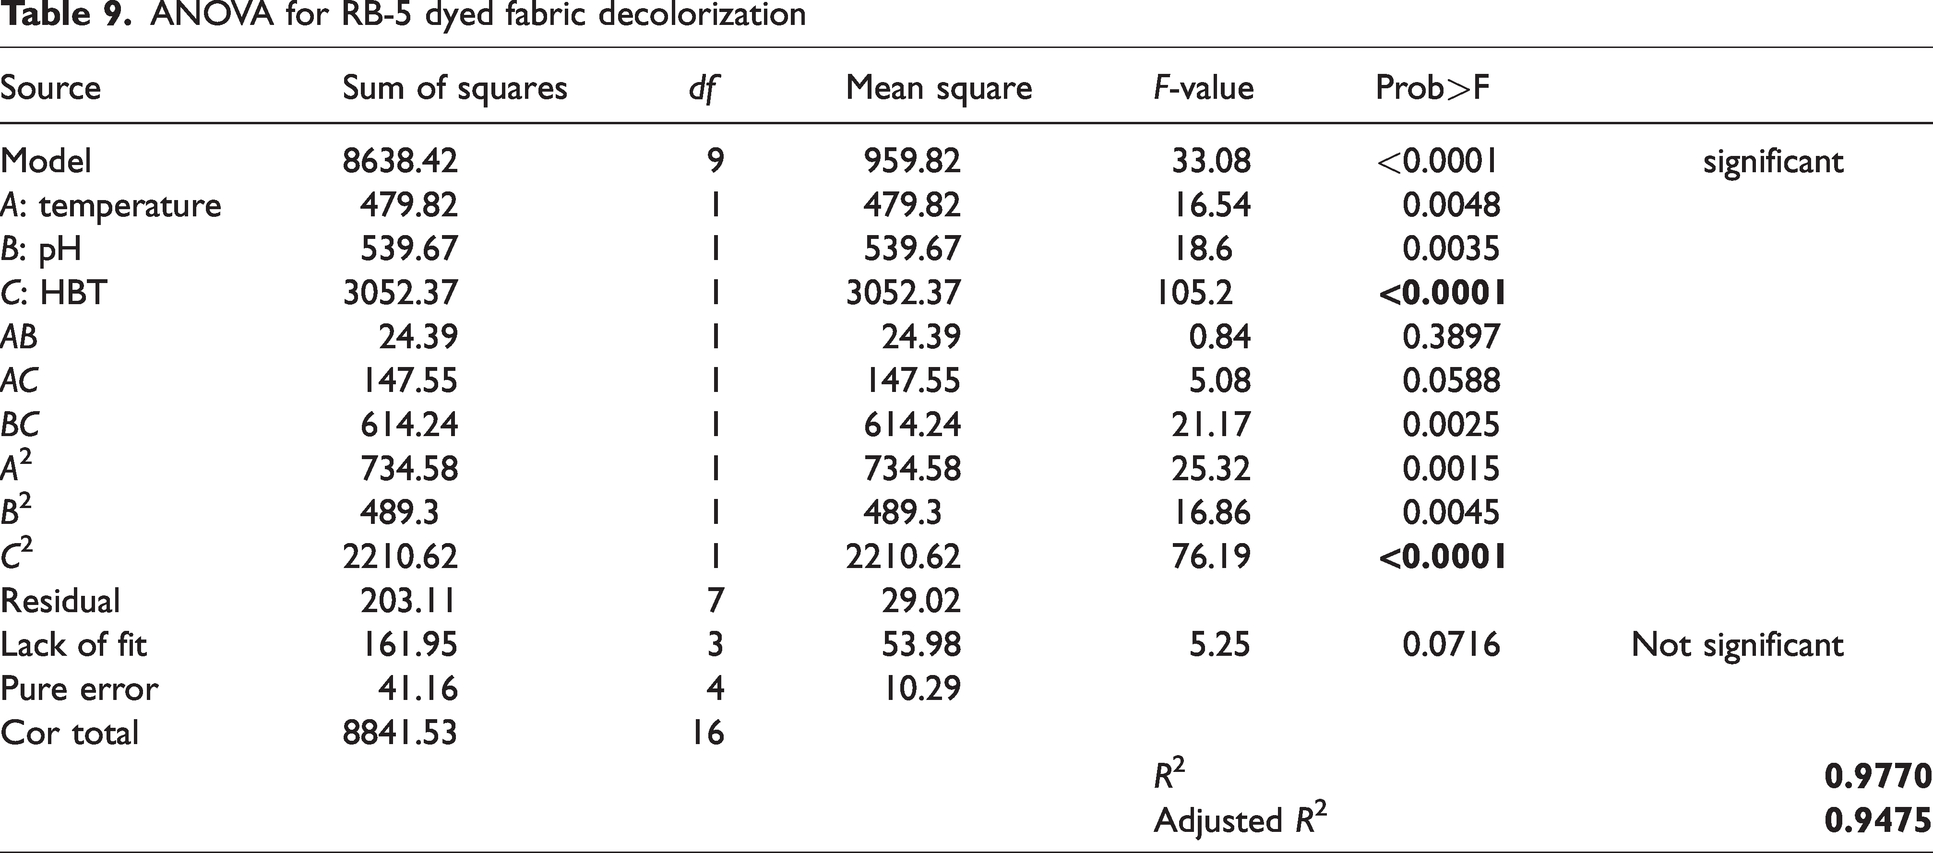
Three-dimensional response surface plots of laccase-mediated RB-5 dyed fabric decolorization.
Characterization of the decolorization effect of cotton fabric
The three dyed cotton fabrics were treated with laccase under optimal conditions and subsequently analyzed using a color-matching instrument. The results showed a significant reduction in the K/S absorption peak of the laccase-treated cotton sample, as illustrated in Figure 6. This substantial decrease in the K/S absorption peak signifies a reduction in dye penetration depth.36–38 The figure indicates that the blue dye exhibits the most significant reduction in absorption peak compared with its original state before decolorization, whereas the red and yellow dyes show relatively smaller decreases. Calculations reveal that RB-5 achieves a DE of 62%, whereas RR-24 and RY-3 achieve 28% and 30%, respectively. Visual inspection further confirms that the treated fabric samples display uniform and stable coloration without noticeable color differences. These findings suggest that laccase possesses decolorizing capabilities towards reactive dyes on textiles. The heightened decolorization effect observed in blue cotton fabrics can be attributed to two primary factors: RB-5 exhibits a low affinity for cotton, resulting in a smaller K/S value compared with the red and yellow dyed cotton, and the anthraquinone structure of RB-5 aligns with the substrate specificity of laccase, thereby enhancing laccase’s oxidative potential.
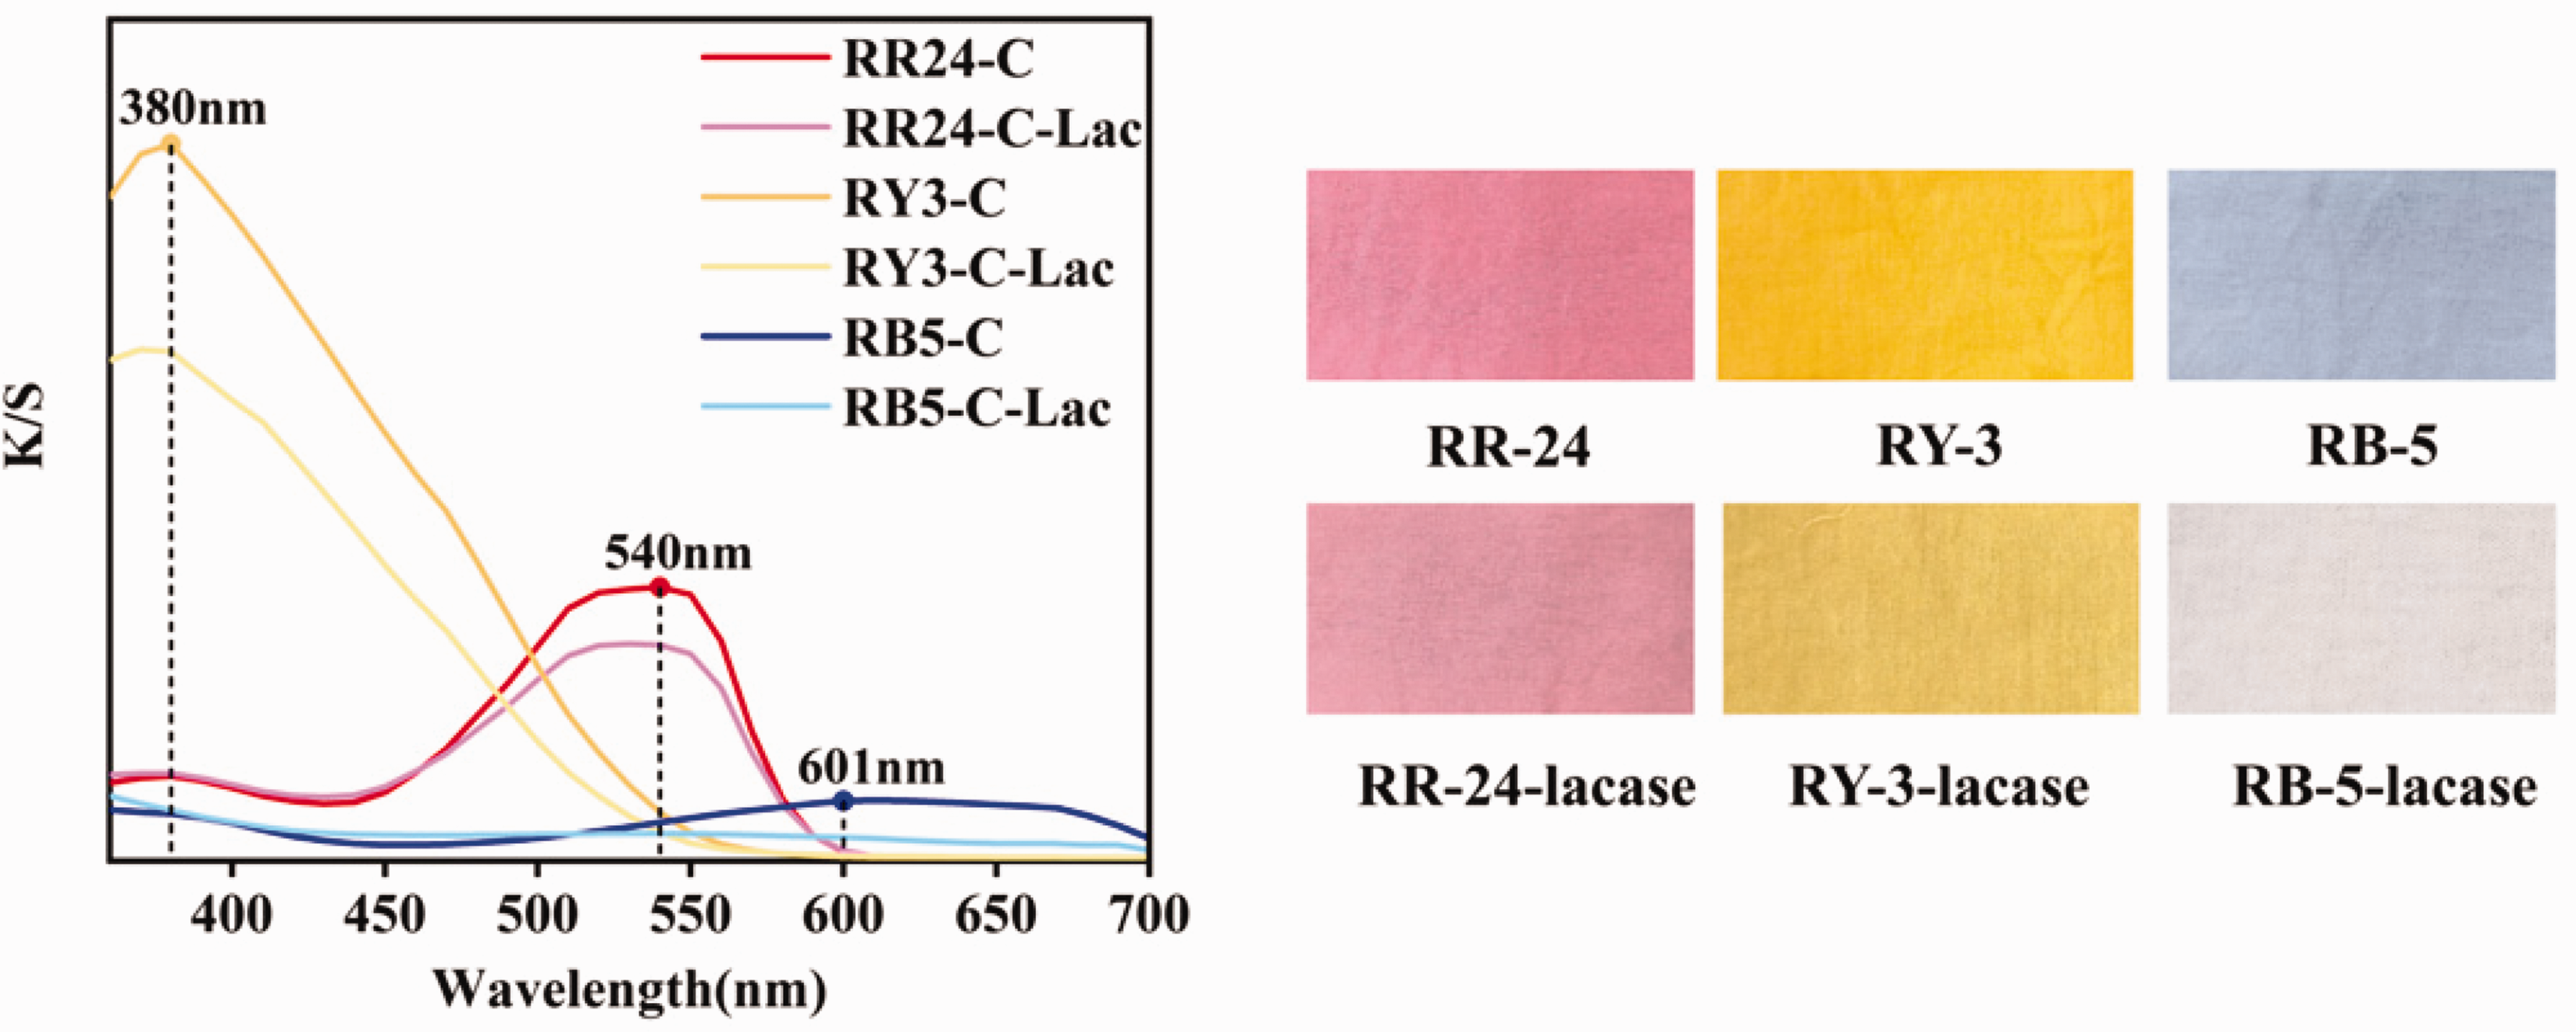
The K/S value spectrum and photographs of cotton fabrics after enzyme treatment.
Observation of the surface and morphology of the cotton fabric
Figure 7 presents SEM images of the three dyed cotton fabrics after enzymatic decolorization. Post-laccase treatment, a slight peeling of the fiber surface is evident. After decolorization, the surface roughness of red and yellow dyed fabric fibers increases. This may result from laccase disrupting the binding between dye molecules and fibers. 39 The surface of blue fabric fibers retains cleanliness and smoothness post-decolorization, likely attributable to the relatively low affinity of blue dye for the fibers and its ease of removal.

SEM images of fabric samples before and after decolorization: (R1) RR-24 dyed cotton fabric, (R2) Laccase-treated RR-24 dyed cotton fabric, (Y1) RY-3 dyed cotton fabric, (Y2) Laccase-treated RY-3 dyed cotton fabric, (B1) RB-5 dyed cotton fabric, and (B2) Laccase-treated RB-5 dyed cotton fabric.
Mechanical properties of the fabric
Figure 8 presents the stress–strain curves for three fabrics (red, yellow, and blue dyed cotton fabrics) prior to and following decolorization. The trends in the curve before and after decolorization are nearly identical, exhibiting only a minor reduction in fracture strength. The tensile strengths of cotton fabric in the warp directions decreased from 401 (RR-24), 397 (RY-3), and 389 MPa (RB-5) to 382, 384, and 371 MPa, respectively. The retention rates of the red, yellow, and blue dyed cotton fabrics were calculated to be 96.3%, 96.7%, and 95.4%. These results indicate that the laccase-mediated decolorization process is relatively gentle and has minimal effect on the mechanical properties of the fibers.
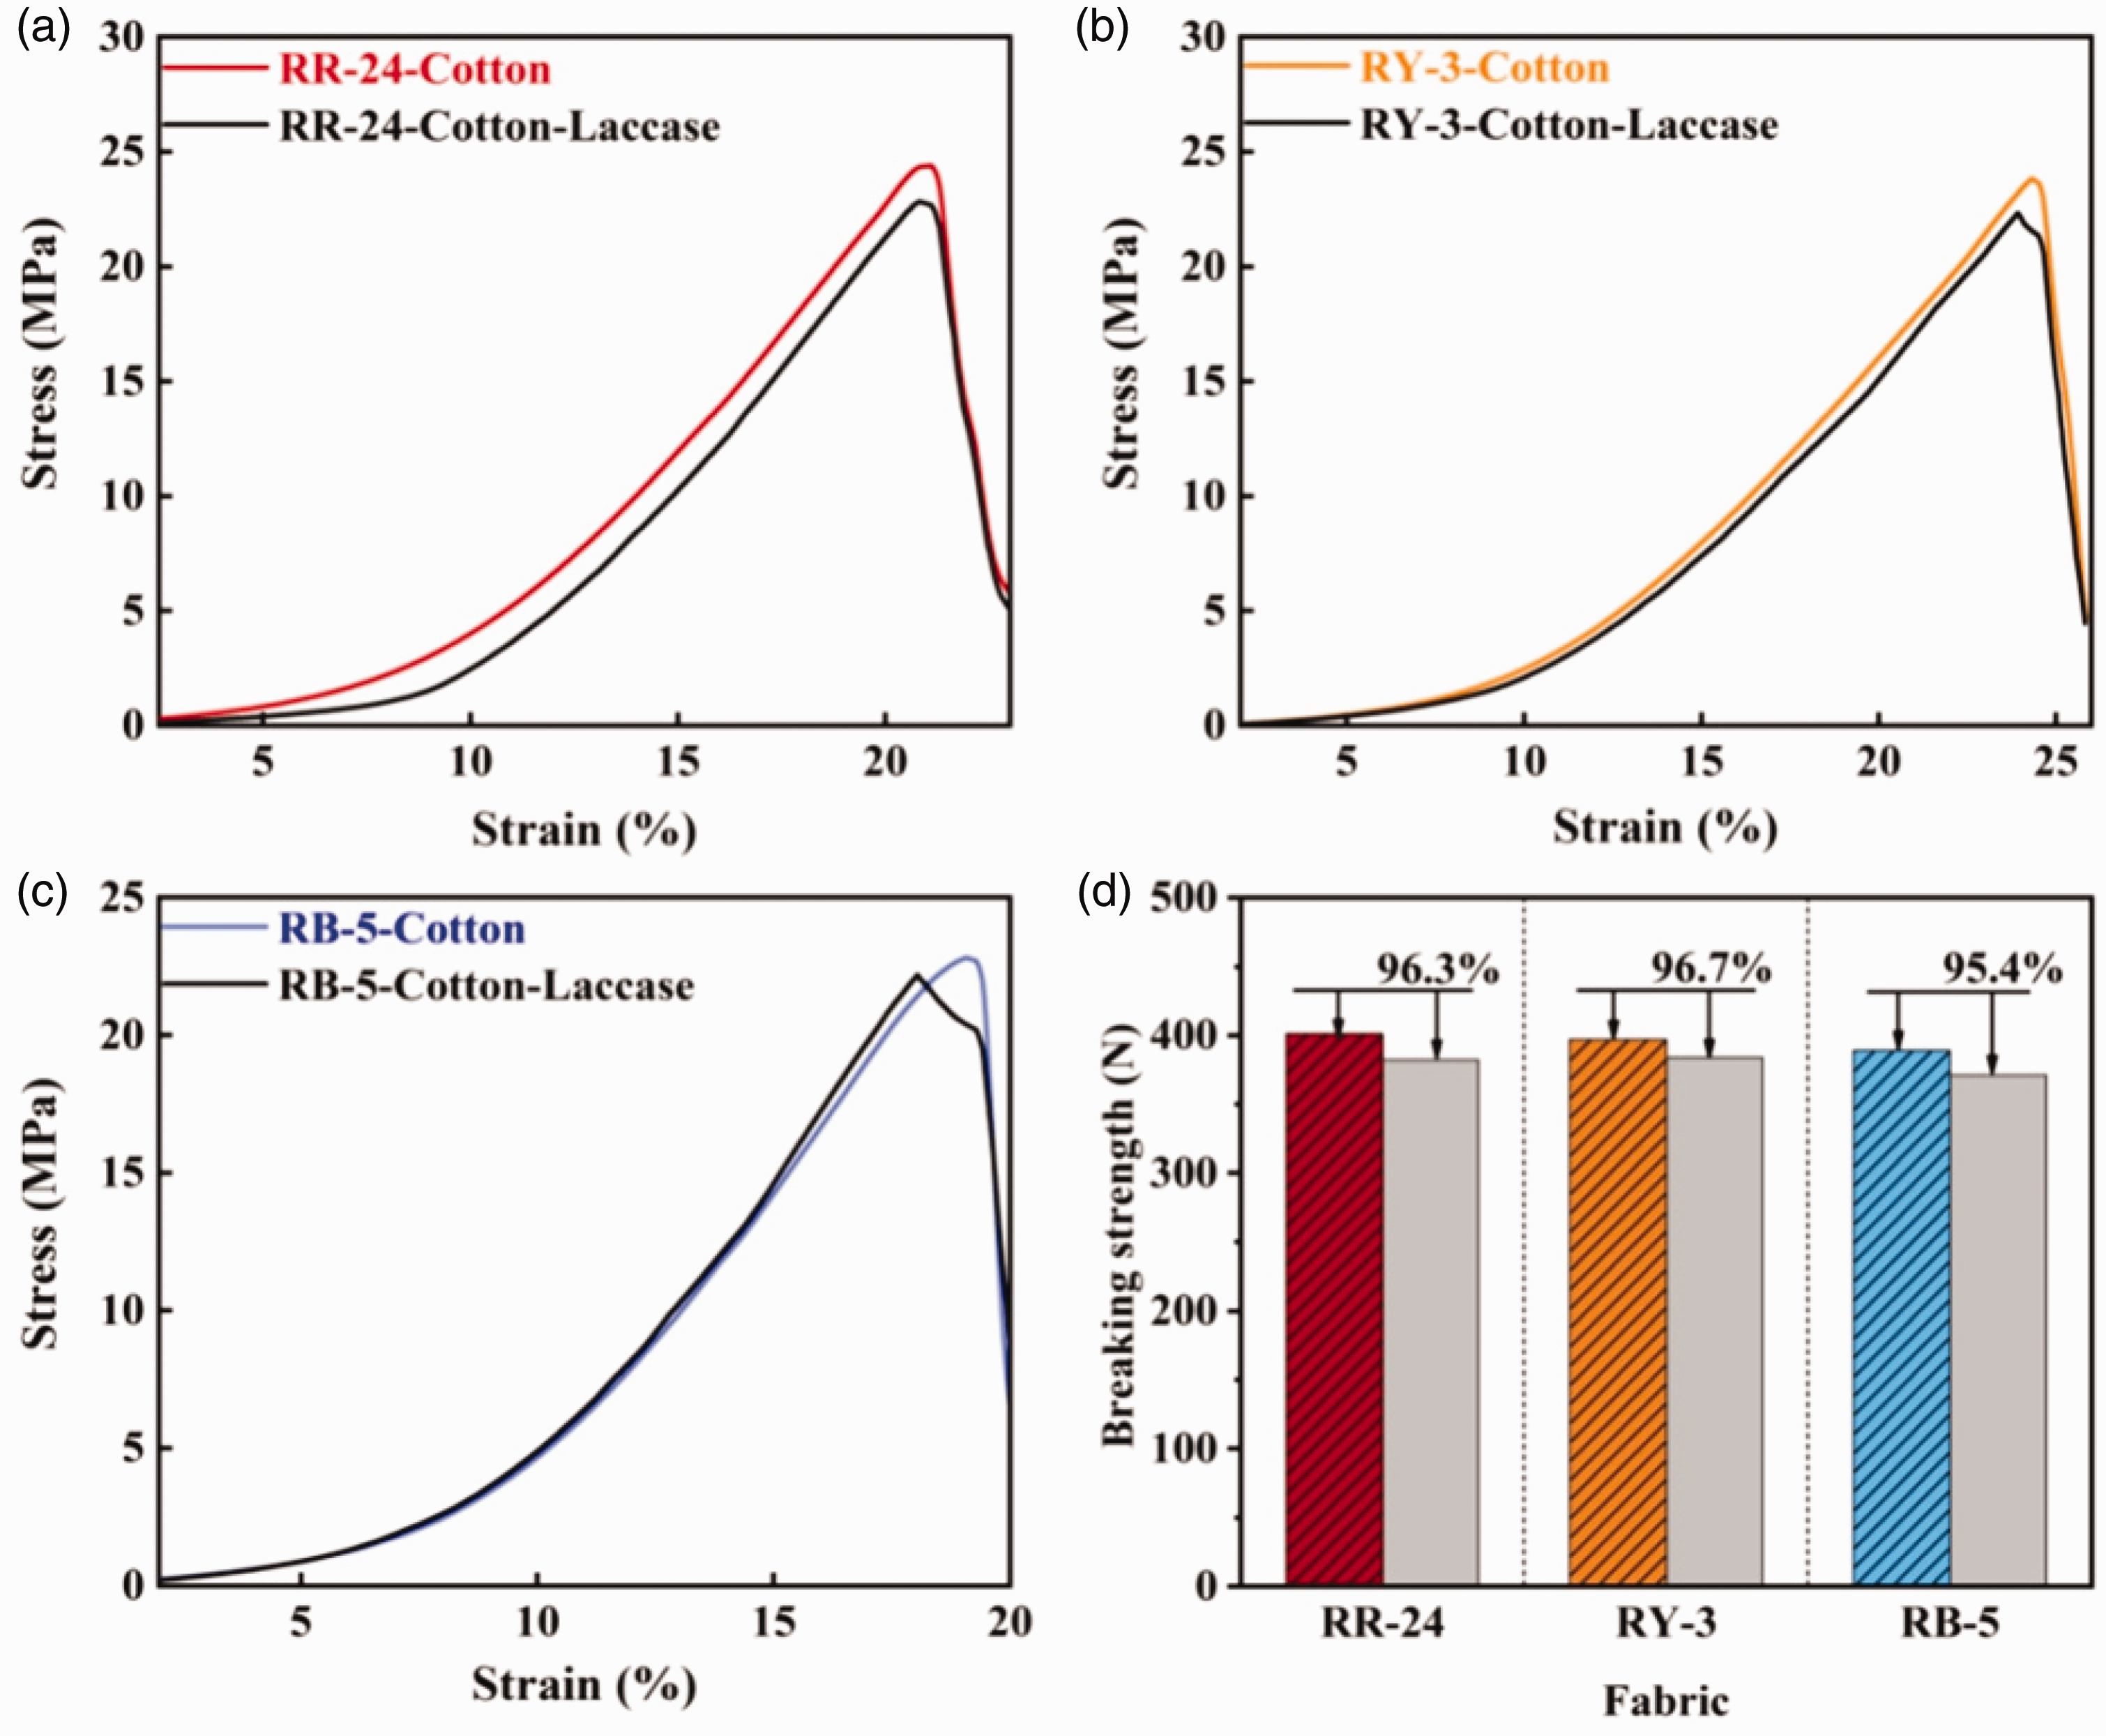
Stretching curves and corresponding tensile strengths of enzyme-treated cotton fabrics (d) and dyed with RR-24 (a), RY-3 (b), and RB-5 (c).
Crystallinity changes of the fibers after enzymatic treatment
The comparative XRD analysis of decolorized versus untreated fabric specimens is presented in Figure 9. The cotton substrate exhibited retention of characteristic diffraction peak positions following decolorization, indicating that the crystalline region of cotton fiber remains largely intact during the decolorization process of reactive dye. Quantitative analysis through JADE 6.0 peak deconvolution revealed distinct crystallinity enhancements: RR-24-treated samples showed 10.24% crystallinity elevation (55.84%→66.08%) accompanied by peak broadening and intensity augmentation at (101) and (002) planes. 40 Parallel observations were recorded for RY-3-treated specimens with an 8.87% crystallinity improvement (53.2%→62.07%). Most significantly, RB-5 decolorized fabric manifested two emergent high-intensity (101) peaks at 110 orientation and intensified (002) diffraction, achieving a remarkable 21.97% crystallinity increase (56.47%→78.44%). This systematic enhancement pattern substantiates that enzymatic decolorization through laccase catalysis effectively detaches dye macromolecules from fiber surfaces while optimizing crystalline alignment. 41 Analysis of the infrared spectra of dyed cotton fabrics before and after enzymatic decolorization revealed significant consistency in cellulose characteristic vibrational modes. 42 The broad absorption peak at 3340 cm−1 attributed to O–H stretching vibrations exhibited nearly unchanged peak shape and integrated area, indicating no significant dissociation of the cellulose hydroxyl network. The relative intensity ratios of the C–H stretching vibration at 2890 cm−1 and CH2 bending vibration at 1429 cm−1 remained constant, further confirming preservation of cellulose polysaccharide chain conformation. Notably, the characteristic doublet peaks at 1163 cm−1 (C–O–C asymmetric stretching) and 897 cm−1 (β-glycosidic bond vibration) were fully retained, demonstrating maintenance of cellulose crystalline structure stability during enzymatic treatment. These findings collectively confirm that the laccase treatment process effectively ensures the structural integrity of fibers in dyed cotton fabrics.
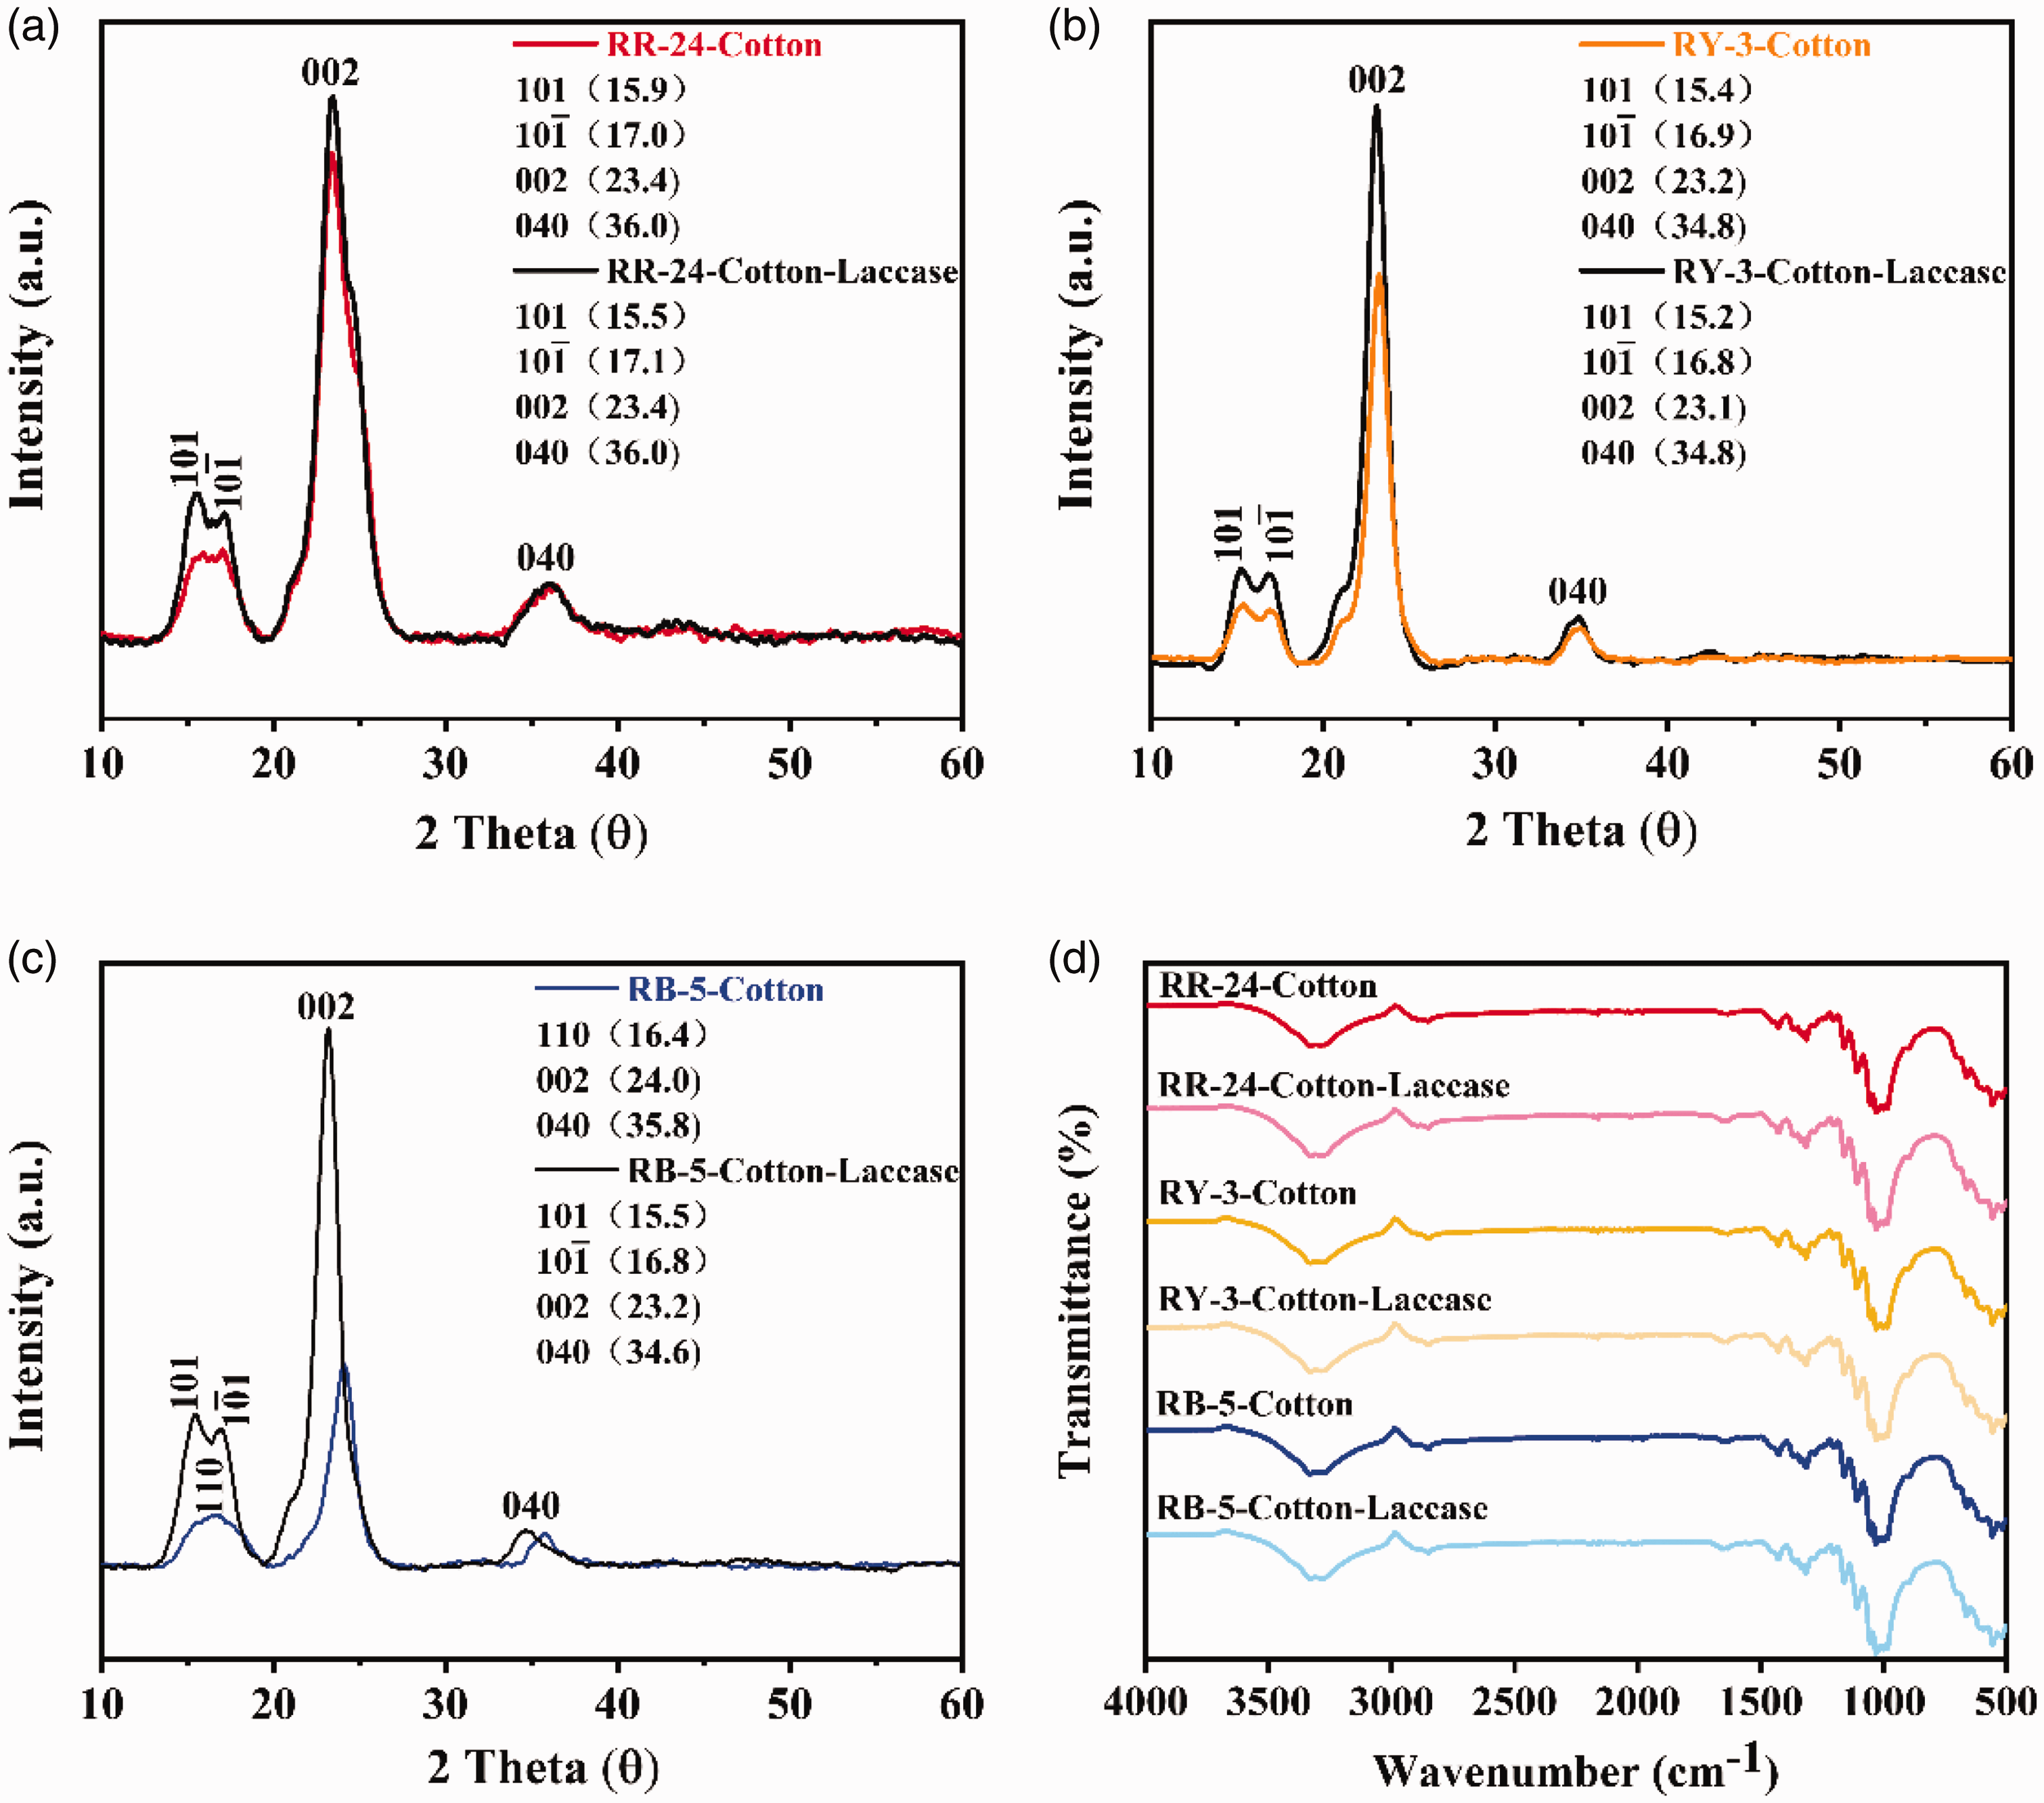
XRD image of enzymatically treated fabric, dyed with RR-224 (a), dyed with RY-3 (b), dyed with RB-5 (c), and infrared spectra of cotton fabrics dyed with three reactive dyes before and after decolorization (d).
Decolorization mechanism
To investigate the decolorization mechanism of laccase on cotton fabrics dyed with reactive dyes, this study conducted XPS measurements before and after fabric decolorization (Figure 10). This measurement further confirmed whether the dye chromophore was destroyed during the treatment process and the elemental changes on the dyed fabric after enzymatic treatment. RR-24 and RY-3 are both azo structure reactive dyes, so their N1s spectra were analyzed. In Figure 10(a), the N1s spectrum was deconvoluted into two peaks at 399.9 and 402.2 eV, corresponding to N–C/N–H and azobenzene N=N.43–45 After laccase treatment, the N1s spectrum showed a slight shift (Figure 10(b)), where the N=N component decreased from 22.58% to 19.05%, while the N–C/N–H component increased from 77.42% to 80.95%. For RY-3 dyed cotton fabrics, similar changes were observed after laccase treatment (Figure 10(c) and (d)), with the N=N component decreasing from 12.65% to 11.66%, and the N–C/N–H component increasing from 87.35% to 88.34%. For RB-5, its chromophore is the C=O double bond in the anthraquinone structure, 46 so its O1s spectrum was analyzed, as shown in Figure 10(e) and (f). The O1s spectrum was deconvoluted into three peaks at 284.8, 286.46, and 288 eV, corresponding to C–C, C–O, and C=O, respectively. After laccase treatment, the C=O component decreased from 18.15% to 15.12%, the C–O content decreased from 47.26% to 40.42%, and the C–C content increased from 34.59% to 44.46%. This indicates that laccase has a certain ability to destroy the anthraquinone and azo structures in the dye, with a weaker ability to degrade N=N and a stronger ability to degrade C=O, which is consistent with the decolorization effects of the three colored cotton fabrics in the experiment.
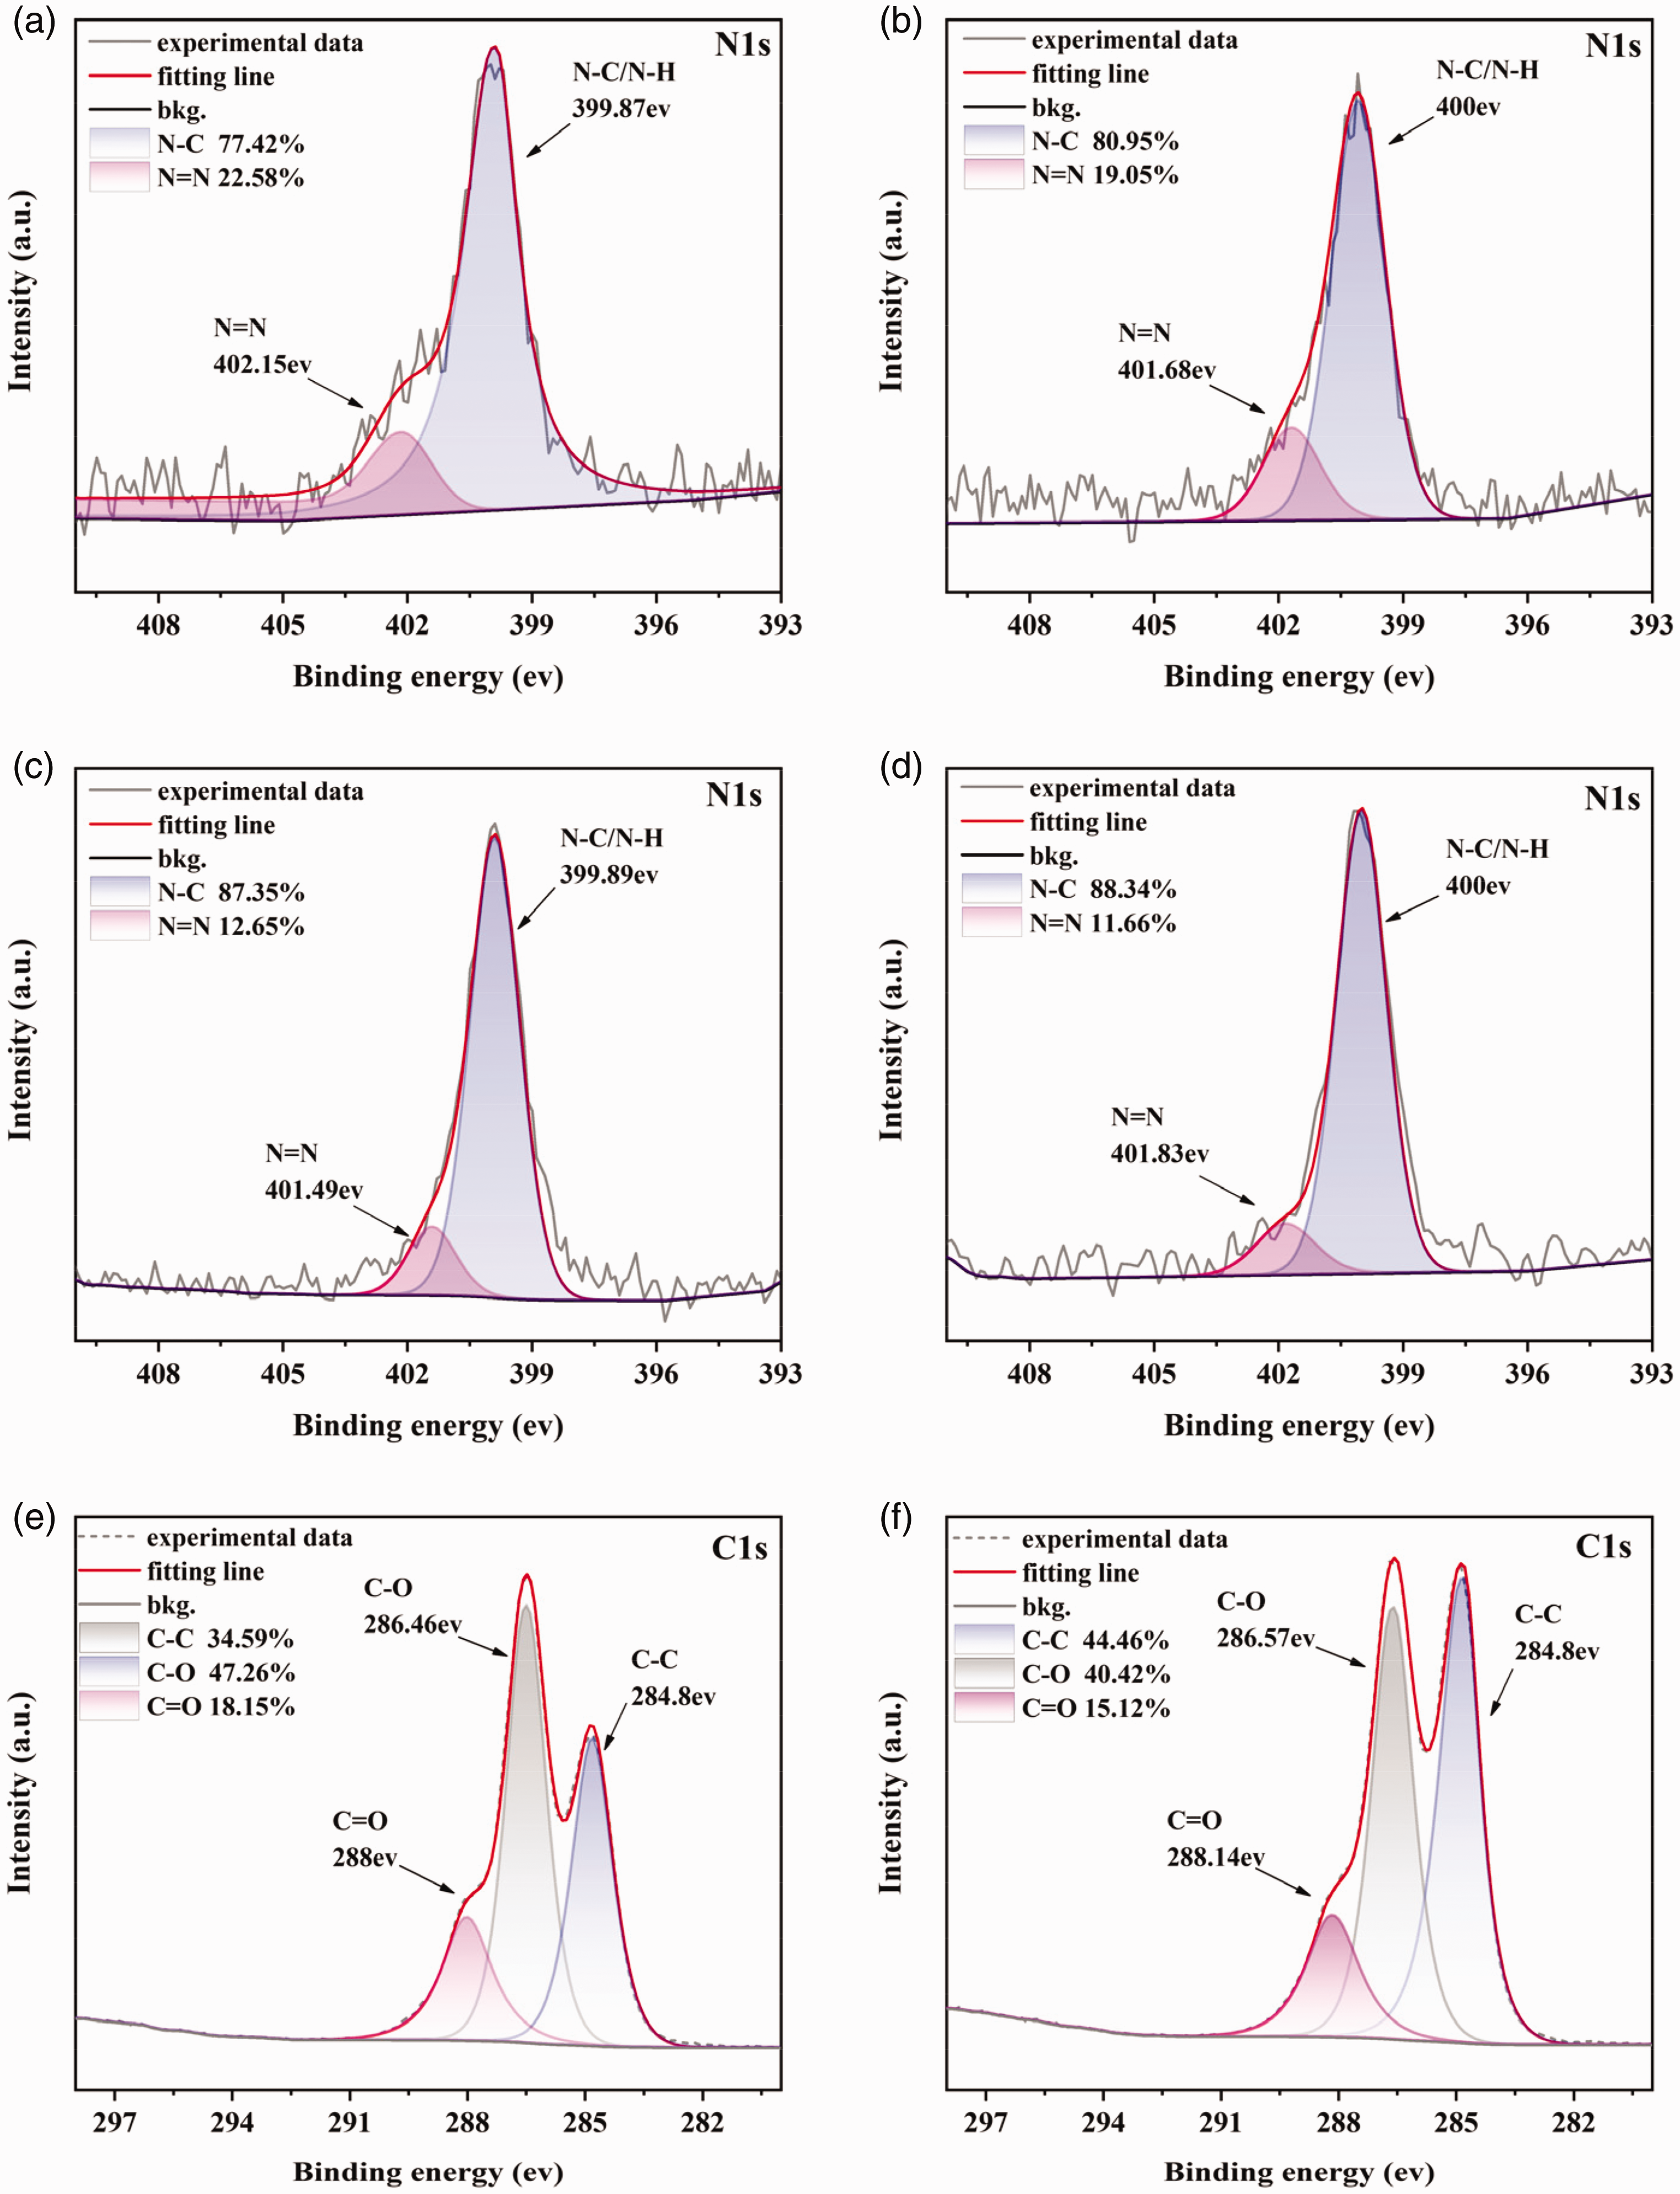
XPS spectra of dyed cotton fabrics: (a) RR-24, (b) laccase-treated RR-24, (c) RY-3, (d) laccase-treated RY-3, (e) RB-5, and (f) laccase-treated RB-5.
Conclusions
Orthogonal and response surface tests have been used to determine the optimal decolorization process for monochlorotriazine reactive dye cotton fabrics. The conditions were as follows: the HBT concentration was 0.5%, the pH was 7, the temperature was 50°C, the laccase concentration was 0.5 U/ml, the liquid ratio was 1:20, and the decolorization duration was 60 min. Under these conditions, the decolorization rates of blue, yellow, and red dyed cotton fabrics were 62%, 30%, and 27%, respectively. During the decolorization process, the chemical and crystalline structure of the cotton fabric remained largely unaffected, with the fabric’s strength retention rate exceeding 95%. The N=N bonds in Active Red 24 and Active Yellow 3 dyes, as well as the C=O bond in RB-5, were partially broken. This indicates that laccase can effectively decolorize the dye by destroying the conjugated structure of the dye under certain conditions. Laccase exhibits superior DE for anthraquinone dyes compared to azo dyes, with its decolorization capacity significantly augmented in the presence of HBT. Laccase exhibits significant potential for industrial applications in the decolorization of reactive dyes on cotton fabrics. This biocatalytic method significantly lowers pollutant emissions in the dye decolorization process compared with traditional methods, thus aligning with global environmental standards in the textile industry. This technology is anticipated to serve as a fundamental technical cornerstone for the green transformation of the textile industry by optimizing enzyme engineering, facilitating multiprocess collaboration, and enabling large-scale production deployment.
Footnotes
Declaration of conflicting interests
The author(s) declared no potential conflicts of interest with respect to the research, authorship, and/or publication of this article.
Funding
The author(s) disclosed receipt of the following financial support for the research, authorship, and/or publication of this article: This work was supported by the Taishan Scholars Program (grant numbers tstp20231225 and 202312169), the National Key Research and Development Program of China (grant number 2021YFB3801901), and the Key R&D Program of Shandong Province, China (grant number 2024CXGC010409).