






Abstract
A critical challenge in virtual fabric development is the lack of sample-free methods to accurately determine physical particle system parameters of flexible textiles, which currently rely on costly trial-and-error prototyping. This limitation stems from the inherent difficulties in reconstructing and controlling deformable body models, where real-time reconstruction fidelity and model accuracy are paramount. While progress has been made in computational efficiency, achieving high precision without physical samples remains unresolved, especially in the fabric design and manufacturing phase. This study proposes a data-driven surrogate modeling framework that directly links structural design parameters to system model parameters, enabling virtual collaborative design optimization. First, we define fabric morphomechanical parameters that are tailored to match physical particle systems. Next, in the absence of physical prototypes, we leverage structural design parameters to construct a yarn-level finite-element (FE) model, employing a decoupled simulation strategy to derive morphomechanical properties, which are then equivalently mapped to system parameters. Finally, using weft-plain fabric development as a case study, we train a machine-learning (ML)-based surrogate model to accelerate FE simulations while preserving >91.45% prediction accuracy. This work bridges the critical gap between design parameters and physical particle systems, offering a digital and visual solution for smart fabric optimization. The framework is scalable to advanced functional textiles (e.g., strain-sensing fabrics and piezoelectric nanofiber assemblies), significantly reducing R&D cycles and prototyping costs. By integrating multiscale simulation, data-driven modeling, and intelligent manufacturing, this research advances the computational design paradigm for next-generation fiber-based materials.
Keywords
With the rapid advancement of intelligent and information technologies, their applications have become increasingly widespread across various fields, particularly in the garment and textile industry, where the reconstruction and control of flexible body models based on physical particle systems play a crucial role. 1 As a classical physical model, the physical particle system decomposes flexible bodies into networks of mass points and springs, enabling rapid and relatively accurate simulation of deformations, wrinkles, and dynamic behaviors of flexible bodies.2,3 This capability has been instrumental in creating realistic morphological effects in scenarios such as virtual reality and game development, enhancing the sense of realism and immersion. Although physical particle systems have found some applications in virtual reality technologies, a systematic solution has yet to be established for facilitating intelligent collaborative design and manufacturing in the context of fabric products. 4 The field of fabric development and design still relies heavily on traditional physical sample production and testing, leading to high costs, prolonged cycles, and resource wastage. The introduction of physical particle system technology holds the potential to achieve precise prediction and rapid iteration of fabric visualization animations, driving the digitization and intelligence of product design processes and bridging the technical gap in this domain. 5
Fabric, as a type of flexible body, has long been a subject of active research in the field of flexible body modeling. Since the 1980s, when Provot introduced the physical particle system based on the mass–spring model (MSM), researchers have been striving to develop efficient and accurate methods for its simulation.6,7 Given the complex physical and mechanical properties of flexible bodies, the combined use of measurement devices, 3D cameras, and machine learning (ML) technologies has emerged as a popular approach to enhance simulation accuracy. 8 Typically, the system model parameters (SMPs) represent the internal forces connecting mass points in a mass–spring system, which define the mechanical properties of fabrics in virtual environments. This necessitates the determination of an appropriate set of SMPs.9-11 To identify such a set, researchers have relied on experimental equipment to measure the conventional mechanical properties of fabric samples, followed by estimation or data optimization for practical use.12-14 For instance, Wang et al. 15 and Miguel et al. 16 developed new measurement devices, but these could only estimate values from a predefined set of ten parameters based on softness. Kargar et al. 17 measured the mechanical properties of 18 woven fabrics and optimized the SMPs using the imperialist competition algorithm (ICA) optimization algorithm and physical drape images. However, this process is labor intensive. This is because the conventional mechanical properties and multiple units defined for textile materials in the textile field do not align with the mechanisms of SMPs. Even with extensive measurement and image processing efforts, the realism of the models remains limited. 18 On the other hand, researchers have explored training and learning conventional mechanical properties from a large number of high-precision images and videos of fabrics, approximating these properties for application to SMPs. For example, Ju and Choi 19 and Feng et al. 20 employed neural network methods and multiview depth images to estimate a set of fabric mechanical properties from high-resolution drape images of fabric samples. Their approach essentially derives the geometric relationship between time and displacement, followed by inverse estimation of mechanical properties under multiple assumptions,21,22 achieving visually acceptable results. 23 However, this method relies heavily on the production of physical samples and the collection of extensive image data, making it less suitable for the fabric development and design phase. During the early stages of fabric development, where physical samples are not yet available, adopting such methods would inevitably require sample production, process design, and experimental testing, leading to time consumption, equipment wear, and prolonged cycles. This contradicts the future trends of intelligent manufacturing and sustainable design. Consequently, there is a pressing need to explore alternative methods to accurately obtain SMPs without physical samples, providing a more practical solution for the virtual collaborative design of fabric development systems.
Exploring methods to obtain SMPs without physical samples during the fabric development and design phase, we can focus on the structural design parameters (SDPs) of fabrics. SDPs, which can be determined during the fabric development stage without the need for production, includes fabric structure and yarn characteristics, both of which fundamentally determine the mechanical properties of fabrics. Kuijpers et al. 24 and Dai and Hong 25 conducted comprehensive evaluations of existing measurement techniques for acquiring model parameters used in virtual garment simulation. They analyzed in detail the various reasons why these techniques cannot be directly and systematically applied to the digital language of fabrics, including complex mechanical properties and multiple units. However, it is widely acknowledged that the digital model parameters of fabrics have a clear relationship with the fabrics themselves. Despite this, the aforementioned studies did not discuss the relationship between SDPs and the intrinsic principles of physical particle systems, resulting in an inability to move away from physical sample production and experimentation. This limitation hinders the realization of virtual collaborative design and intelligent manufacturing during the fabric development and manufacturing stages. For most computer science researchers, this issue, rooted in textile and mechanical engineering, appears complex and challenging, necessitating interdisciplinary efforts to overcome it. Therefore, it is essential to investigate the connection between fabric SDPs and SMPs to fully leverage the role of physical particle systems in fabric development, contribute to future sustainable design and intelligent manufacturing.
Investigating the relationship between fabric SDPs and SMPs in the absence of physical samples necessitates the integration of finite-element (FE) technology. FE techniques are highly capable of replicating real-world systems, enabling in-depth exploration of the effects of multiple parameters such as structure, material, temperature, and external forces on application scenarios. However, FE simulation of flexible bodies presents significant challenges, particularly due to the complex anisotropic behavior exhibited by macroscopic fabrics. This complex anisotropy, manifested in nonlinear stretching and compression properties at various angles, is not ideally suited for FE simulation. With the gradual advancement of computer technology and hardware capabilities, FE simulation at the yarn level has emerged as a promising trend.26-28 Compared with macroscopic fabrics, yarns primarily exhibit axial tensile properties and radial Poisson's ratios, which can enhance the accuracy of FE simulations for flexible bodies. It is noteworthy that yarns are interwoven or looped together, and when a certain number of yarn units are used as simulation models, the edges remain unsecured. Under the application of force, phenomena such as unraveling or loop detachment can occur, adversely affecting simulation results. Therefore, controlling the edge sections to prevent unraveling while ensuring that force constraints do not compromise simulation accuracy is a challenge that must be addressed on a case-by-case basis.
FE simulation of flexible bodies requires substantial computational resources and time to ensure high fidelity, which significantly compromises its real-time applicability in intelligent manufacturing and virtual collaborative design. To balance efficiency and a reasonable level of fidelity, the development of surrogate models (SMods) based on ML has emerged as a trend in recent years.29,30 SMods are approximate mapping models that connect inputs and outputs, effectively improving response speed while maintaining relatively high fidelity. Leveraging the advantages of Industry 4.0, data-driven SMods have already achieved successful applications in various manufacturing fields, such as additive manufacturing 31 and oilfield exploration. 32 Nevertheless, training an SMod requires a substantial amount of FE simulation data, emphasizing the importance of both data volume and accuracy. During the FE simulation process, it is crucial to appropriately set parameters such as mesh density in key regions, structure, and yarn material properties to ensure the accuracy of the output results. Although generating large-scale FE simulation data incurs time costs, the application value of developing ML-based SMods makes this effort worthwhile.
Figure 1 illustrates the schematic workflow of our proposed data-driven SMods linking SDPs and SMPs for achieving virtual collaborative design of flexible bodies during the fabric development phase. On the fabric development side, designers input SDPs into the SMods, which rapidly outputs SMPs for the physical particle system. This system simulates and displays the natural drape morphology and drape parameters of the fabric, allowing designers to adjust design parameters until the desired morphological effects are achieved. This approach eliminates the need for repeated sample production and drape experiments, thereby saving resources and time costs. With this research objective in mind, this paper makes the following key contributions.
1. We define fabric morphomechanical parameters (MMPs) specifically tailored to match SMPs, including the fabric's crimp coefficient KQ, diagonal coefficient KD, tensile coefficient KL, and damping coefficient U.
2. We propose a method to obtain fabric MMPs by starting from fabric SDPs and incorporating yarn-level FE-based decoupled flexible body simulation.
3. Using weft-plain fabrics as an application case, we introduce ML-based SMods to construct a relationship model between fabric SDPs and SMPs, enabling the implementation of virtual collaborative design for flexible bodies during the fabric development phase.
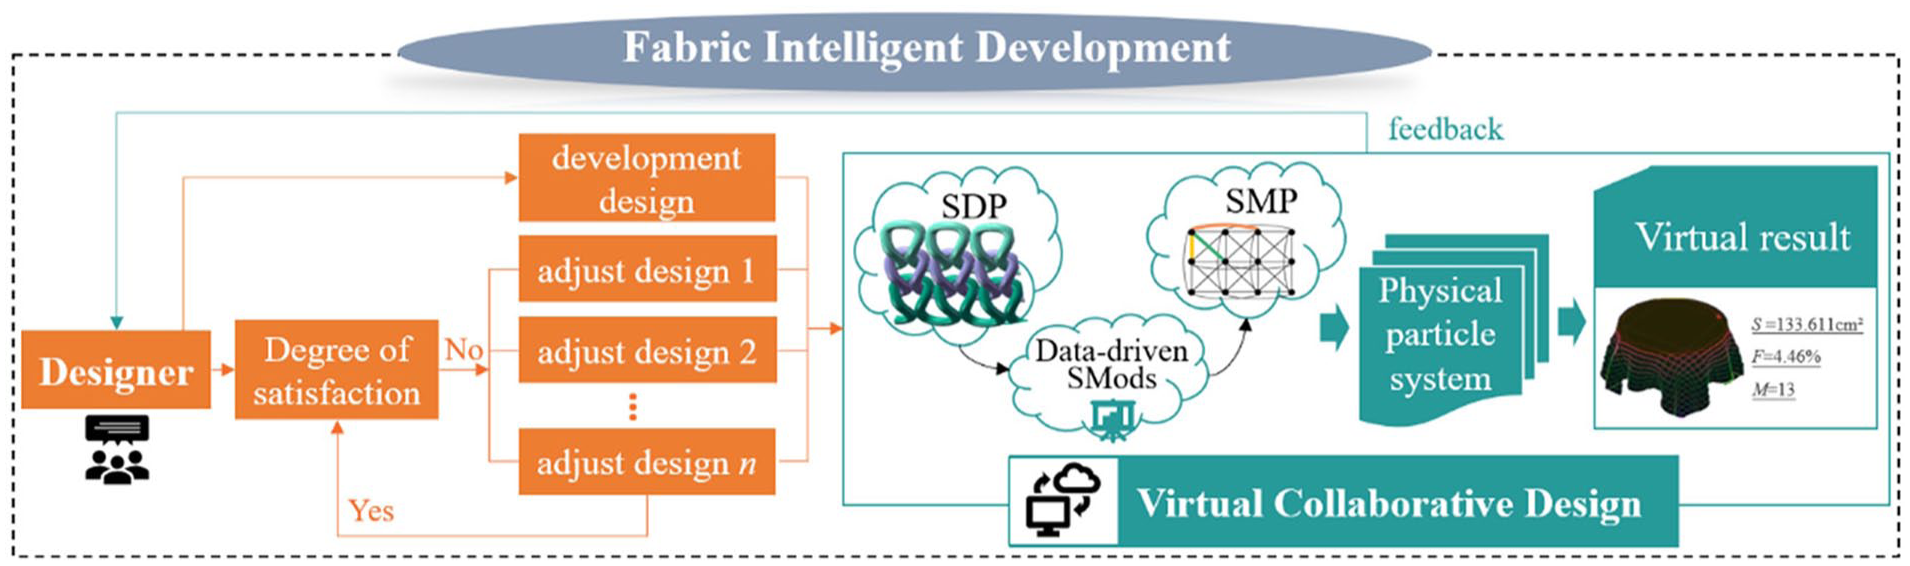
Schematic diagram of the workflow for virtual collaborative design using the data-driven SMod in the fabric development phase.
This paper is organized into six sections, with the first section being the current introduction. The second section defines the fabric MMPs through an analysis of the intrinsic mechanisms of the physical particle system. The third section establishes a yarn-level FE model for decoupled flexible bodies based on fabric SDPs and presents a method for obtaining fabric morphological mechanical values. The fourth section uses weft-plain fabrics as an application case to develop a data-driven SMods linking SDPs and SMPs. The fifth section provides a detailed description of the experimental validation and error analysis process. The sixth section summarizes the main contributions of the paper and outlines future directions.
Definition of fabric MMPs
In this section, we delve into the intrinsic mechanisms and control behaviors of the physical particle system. By comparing these with the principles underlying current fabric measurement devices, we elucidate why the measurement results from these devices cannot be applied directly to SMPs. Subsequently, we provide a detailed description of the fabric MMPs specifically defined in this study to match SMPs.
Intrinsic mechanisms of the physical particle system
The digital modeling of flexible bodies has been a research topic for over a decade, with the MSM proposed by Provot gaining widespread recognition. The MSM describes fabric as a quadrilateral mesh structure composed of mass points interconnected by massless springs, which include bending, shearing, and structural springs. By performing mechanical analysis on the mass points and calculating their velocities and displacements using the laws of motion, the model achieves the representation of virtual fabric morphology, enhancing the realism of virtual environments. 33 As illustrated in Figure 2, the three types of springs are defined as follows. 34
(1) Bending springs: These connect pairs of mass points in the same row or column with an index difference of 2, preventing excessive local bending of the fabric.
(2) Shear springs: These connect diagonally adjacent pairs of mass points in the mesh, preventing excessive shear deformation along the diagonal direction of the fabric.
(3) Structural springs: These connect adjacent pairs of mass points in the same row or column, maintaining the basic shape of the fabric.
The calculation of spring forces is as follows:

where k represents the spring index, t denotes the time interval, Fk,t indicates the spring force at each time interval, Xk,0,t represents the position vector of the spring's starting or ending point, Lk is the rest length of the spring, and kp is the spring coefficient.35,36 For clarity in subsequent discussions, the three spring coefficients are denoted as k1, k2, and k3, respectively.
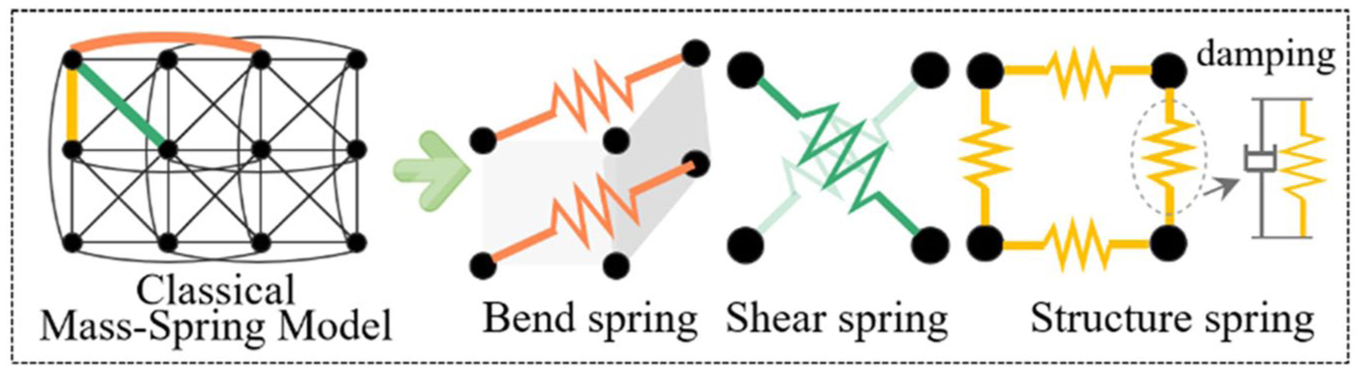
Principles of the classic MSM.
The damping force acts as an internal resistance within the spring, with the damping coefficient denoted as uzn. It is introduced to prevent oscillatory behavior in the spring, thereby simulating energy dissipation and enhancing the stability of the fabric. In practice, this force characterizes the internal resistance of the fabric. It can be expressed as


Here Vp,t represents the velocity of the mass point, uzn is the damping coefficient, and dpt is the dot product of the spring's expansion rate and the normalized force vector.
In addition to the internal forces represented by the springs, each mass point is also subjected to external forces, such as gravity and wind. For each mass point, the resultant force can be expressed as

Here p is the mass point index, Fk,i,t represents the internal force exerted by each spring i on p, and Fk,j,t denotes the external force j acting on p.
Subsequently, the position and other information of each mass point are updated using Verlet numerical integration. The position is calculated as

Here Xp,t+1 represents the position of the mass point at the next time interval, m is the mass of the point, and dt is the time step of the integration.
Through the theoretical process described previously, the program flow of the classic MSM, as illustrated in Figure 3, can be executed, ultimately achieving the visualization of fabric morphology. From the analysis, it is evident that the SMPs k1, k2, k3, and uzn, which represent the internal forces of the fabric, are the key parameters determining the realism of the simulation.
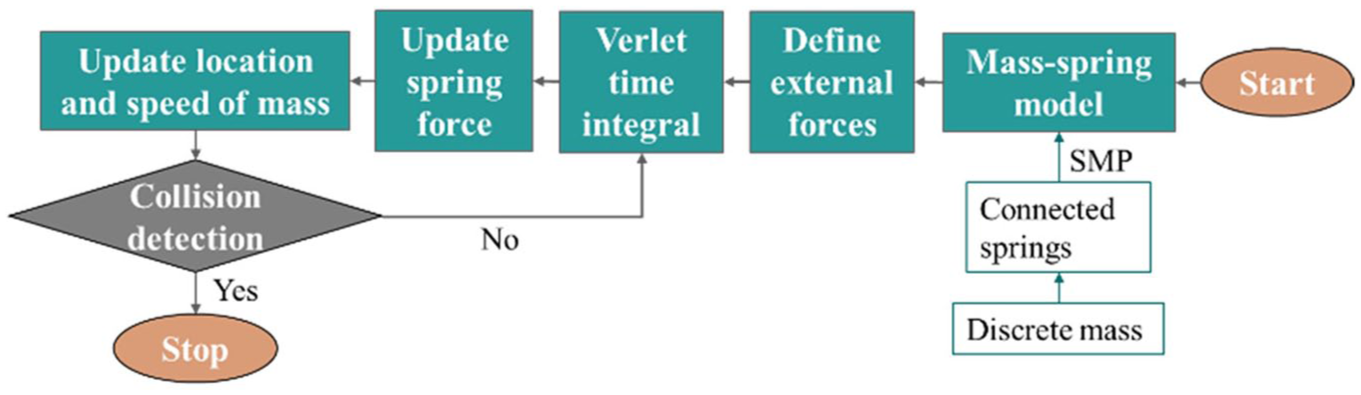
Schematic diagram of the classic MSM program flow.
Differences from equipment measurement principles
People often use experimental equipment, such as the Kawabata Evaluation System (KES) and Fabric Assurance by Simple Testing (FAST) devices, to measure the bend stiffness, shear stiffness, and tensile stiffness of fabrics. These measured values are then assigned to the corresponding spring coefficients in the SMP simulation, specifically the bending spring, shear spring, and structural spring coefficients. The measurement methods for these three types of stiffness are illustrated in Figure 4. The following differences are evident.
(1) The fabric's bend stiffness expresses the bending torque's ratio to the curvature, which differs from the spring force's ratio in the spring link's direction to the spring extension value required to bend the spring in SMPs.
(2) Shear stiffness of fabric expresses the ratio of tangential force to displacement, which differs from the ratio of the elastic force along the 45° diagonal to the spring extension value required to shear the spring in SMPs.
(3) Damping coefficients are difficult to measure and obtain from the equipment and still rely on empirical assignment, making it challenging to establish a supporting theoretical framework.
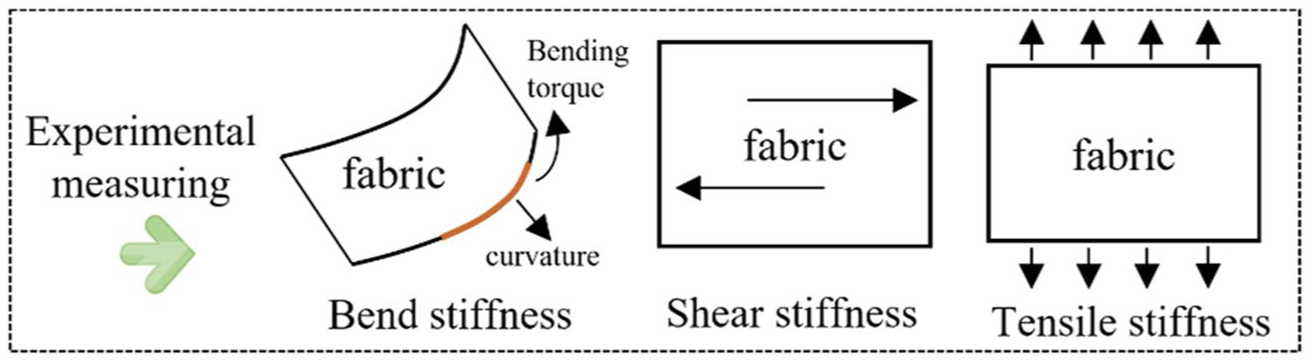
Conventional equipment measurement principles.
The similar nomenclature misleads people to use the measurements directly for SMPs. In addition, the fact that there are multiple units specializing in textile materials in the textile field makes the already very different measurement results from one device to another even less suitable for virtual simulation with SMPs.
For this reason, the goal is to identify fabric mechanical parameters that better align with the physical attributes of MSM to improve realism and reduce errors.
Definition MMPs of fabric
The following four mechanical parameters are defined for fabric to match the physical attributes of SMPs. They are termed fabric MMPs, reflecting the fabric's mechanical attributes to differentiate them from conventional mechanical parameters.
(1) The crimp coefficient, KQ, is defined to match the coefficient of the bending spring in the physical attributes of SMPs. It represents the ratio of the reaction force per unit width of the fabric at both ends to the amount of change in the distance when a uniform circumferential motion is applied to one end of the spread fabric, causing it to curve and fold slowly. The units for KQ are N·cm-2, as shown in Figure 5(a).
(2) The diagonal coefficient, KD, is determined to match the coefficient of the shear spring in the physical attributes of SMPs. It represents the ratio of the tensile force per unit width of the fabric at a 45° angle to the amount of change in the distance between the two ends when the spread fabric is stretched slowly in the diagonal direction. The units for KD are N·cm-2, as shown in Figure 5(b).
(3) The conventional fabric tensile stiffness measurements are applied to match the structure spring's coefficient in the SMP's physical attributes. During calculation, the result is also converted into the ratio of tensile force per unit width to the amount of change in distance. This tensile coefficient, denoted KL, is measured in units of N·cm-2, as shown in Figure 5(c).
(4) The damping coefficient, U, is defined to match the damping behavior in the physical attributes of SMPs. It represents the tangential contact force ratio per unit width to the amount of change in the distance between the two ends when the fabric is measured in tension, in units of N·cm-2, as shown in Figure 5(d). This behavior occurs because, as the fabric undergoes tensile deformation, the yarns encircling one another are stretched tightly, causing the normal contact force FNN between the yarns to increase progressively with greater tensile displacement. This increases the tangential contact force Ff = FNN·f, where f denotes the coefficient of friction between the yarns. It is approximated that a linear relationship exists between the amount of change in distance between the two ends and the tangential contact force during small deformations of the fabric.
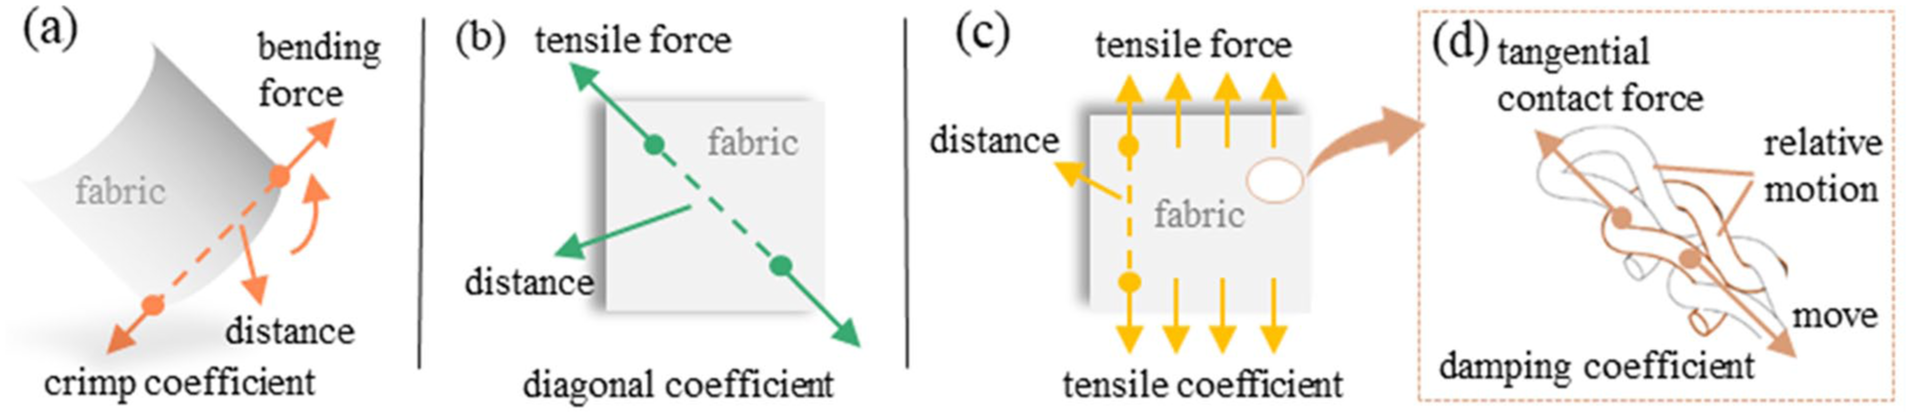
Fabric MMPs: (a) fabric crimp coefficient KQ; (b) fabric diagonal coefficient KD; (c) fabric tensile coefficient KL; (d) fabric damping coefficient U.
Up to this point, the above definitions were performed to ensure that the fabric MMPs better match the SMP physical attributes. Their mathematical expressions can be described as follows:

where Fint is the force at the ends and Δx is the amount of change in distance between the ends.
After establishing the above definitions, it becomes clear that obtaining these parameters is challenging due to their divergence from conventional equipment testing principles. This implies the need to explore methods for acquiring fabric MMPs starting from SDPs.
Yarn-level FE modeling of decoupled flexible bodies
Although the MMPs we defined are more aligned with SMPs in terms of mechanical principles, its acquisition cannot rely on physical prototypes or conventional equipment. Instead, it requires consideration starting from SDPs. At this point, our first thought is FE simulation. For fabrics, which are flexible bodies with anisotropy and nonlinearity, challenges often arise in material definition and boundary conditions, leading to significant errors. Recently, researchers have begun to make breakthroughs using yarn-level FE simulation.37-39 Yarns, also being flexible bodies, primarily exhibit axial nonlinearity, which can minimize errors. For this study, SDPs enable the modeling of dimensional information between yarns, allowing simulation of small-scale 5 × 5 (or 5 × 3) structural units to obtain MMPs. This section describes the critical process of performing decoupled unidirectional simulation of yarn-level FE for fabrics using Abaqus software, along with recommended parameter ranges. Since the three types of springs independently represent the mechanical properties of fabrics from different angles, it is essential to obtain independent analysis results for each angle without mutual influence to ensure high compatibility.
FE model for fabric crimp coefficient
Based on the definition of crimp coefficient, fixed and circumferential motion boundaries were established, whereas all other ends were set to free states. This ensures the independent representation of bending characteristics under decoupled conditions, as illustrated in Figure 6(a). Since the fabric still tends to remain in its original state and resists bending during crimping, a counterforce was generated to oppose the bending, as indicated by Fqint in Figure 6(b). The reaction force changes direction and magnitude with the circular motion of the moving end, making the process more complex. Therefore, the deformation energy method was proposed to obtain the crimp coefficient, as illustrated by Qqint in Figure 6(c).
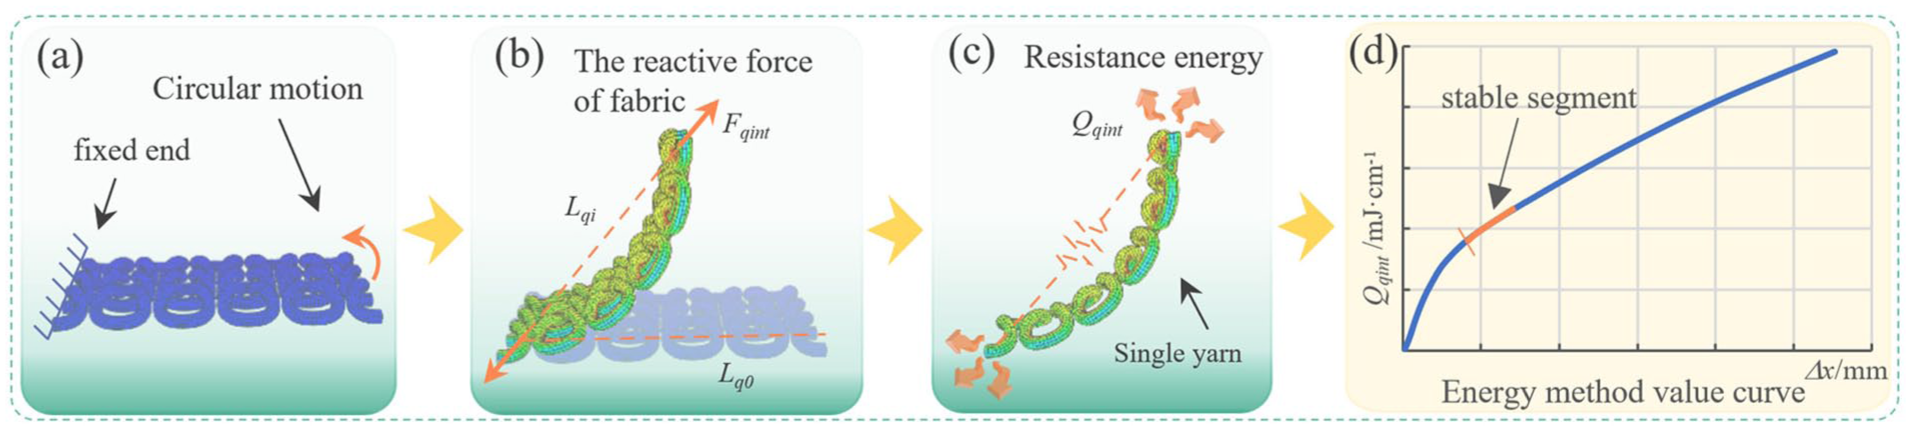
FE simulation and data extraction of the crimp coefficient.
When the fabric is bent and deformed for pure fabric bending, the energy generated to resist the bending deformation is converted into a hypothetical spring connecting the two ends of the yarn. The deformation energy of the fabric at this point can be expressed in terms of the elastic potential energy of the spring as follows:

where KQ is the assumed spring coefficient, which is also known from the meaning that it is the crimp coefficient,
From simulation results, the curve was established, as shown in Figure 6(d), to analyze the value of KQ. After an initial period of nonconstant growth, a stabilization region appears, which resembles the bend stiffness curve (bending torque–curvature) in the conventional mechanical attributes of fabrics. Therefore, the average value of KQ in the curve just entering the stabilization region was taken and used as the fabric crimp coefficient.
FE model for fabric diagonal coefficient
Based on the definition of diagonal coefficient, we established a three-dimensional model of fabric structure. To prevent the outermost loops from unraveling or loosening due to pulling, we constrained their Z-direction displacement. This ensures that the loops in the 3D model remain interlocked without affecting their motion in the XY plane, as shown in Figure 7(a). Under the pulling action of the moving loop in the 45° direction, the unconstrained outer loops naturally contract inward, ensuring the independent representation of diagonal stretching characteristics under decoupled conditions, as illustrated in Figure 7(b). the maximum value of the force on the moving coil, normal to the contact force at each moment in time, is obtained. The diagonal tensile force per unit width, denoted as Fdint, is determined. In the figure, L di is the real-time distance and Ld0 is the original distance.
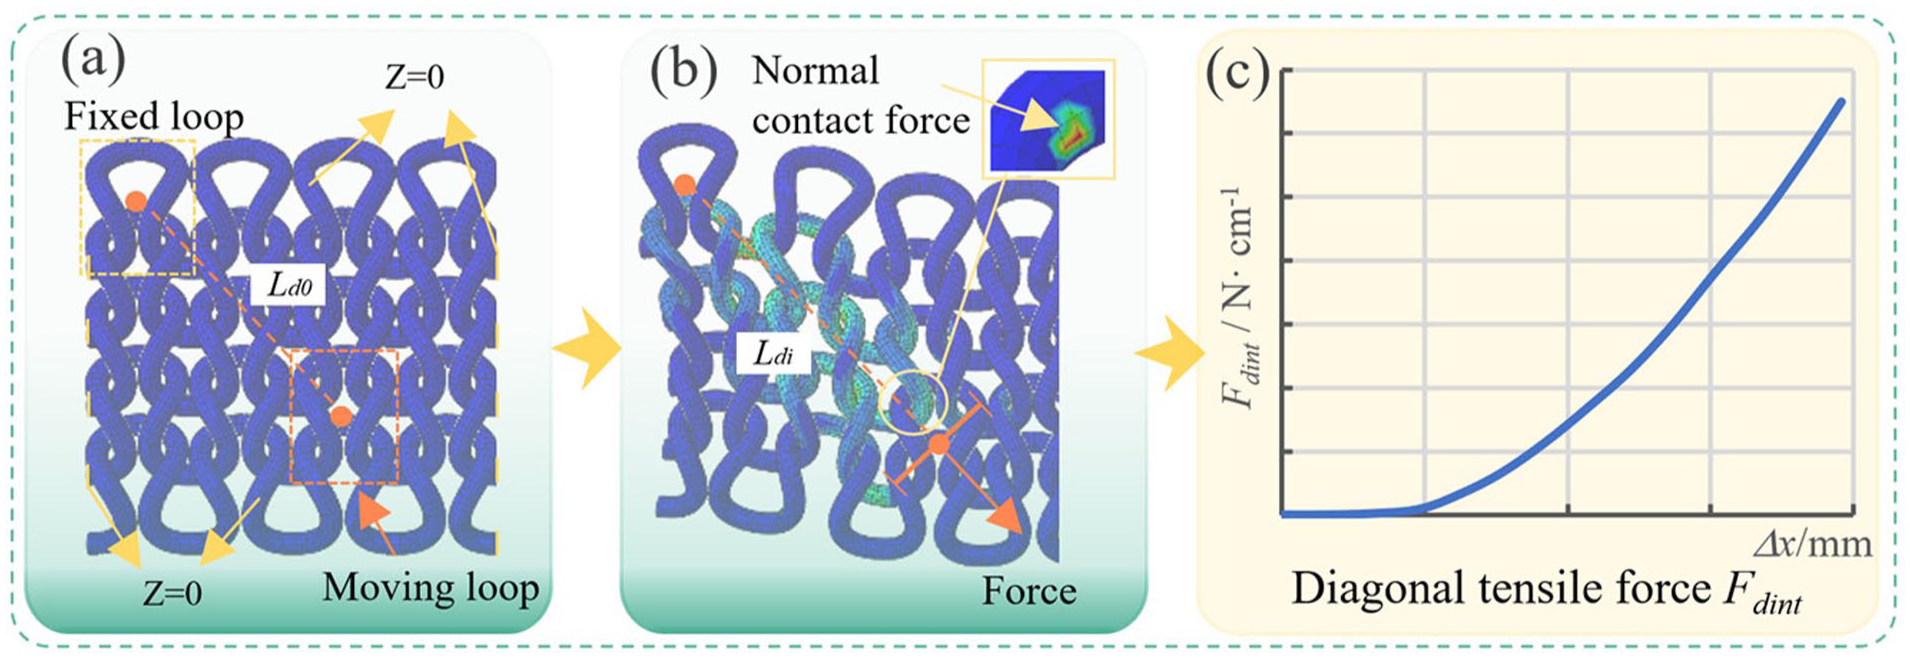
FE simulation and data extraction of diagonal coefficient.
From the results, the oblique stretching force Fdint per unit width was obtained versus the amount of variation of the distance, and the curves

FE model for fabric tensile and damping coefficient
During stretching, to prevent the loops on the left and right sides from unraveling or loosening due to pulling, we only constrained their Z-direction displacement, as shown in Figure 8(a). The loops on the left and right sides naturally contract inward, ensuring the independent representation of longitudinal stretching characteristics under decoupled conditions. As illustrated in Figure 8(b), we can obtain the force distribution on the end face of the lower loop, from which the stretching force per unit width, denoted as Flint, is derived. Here, L li represents the real-time distance between two loops and Ll0 is the original distance between them. In the small deformation stage of natural fabric draping, the longitudinal and transverse stretching behaviors are similar, so this study focuses on longitudinal stretching as an example.
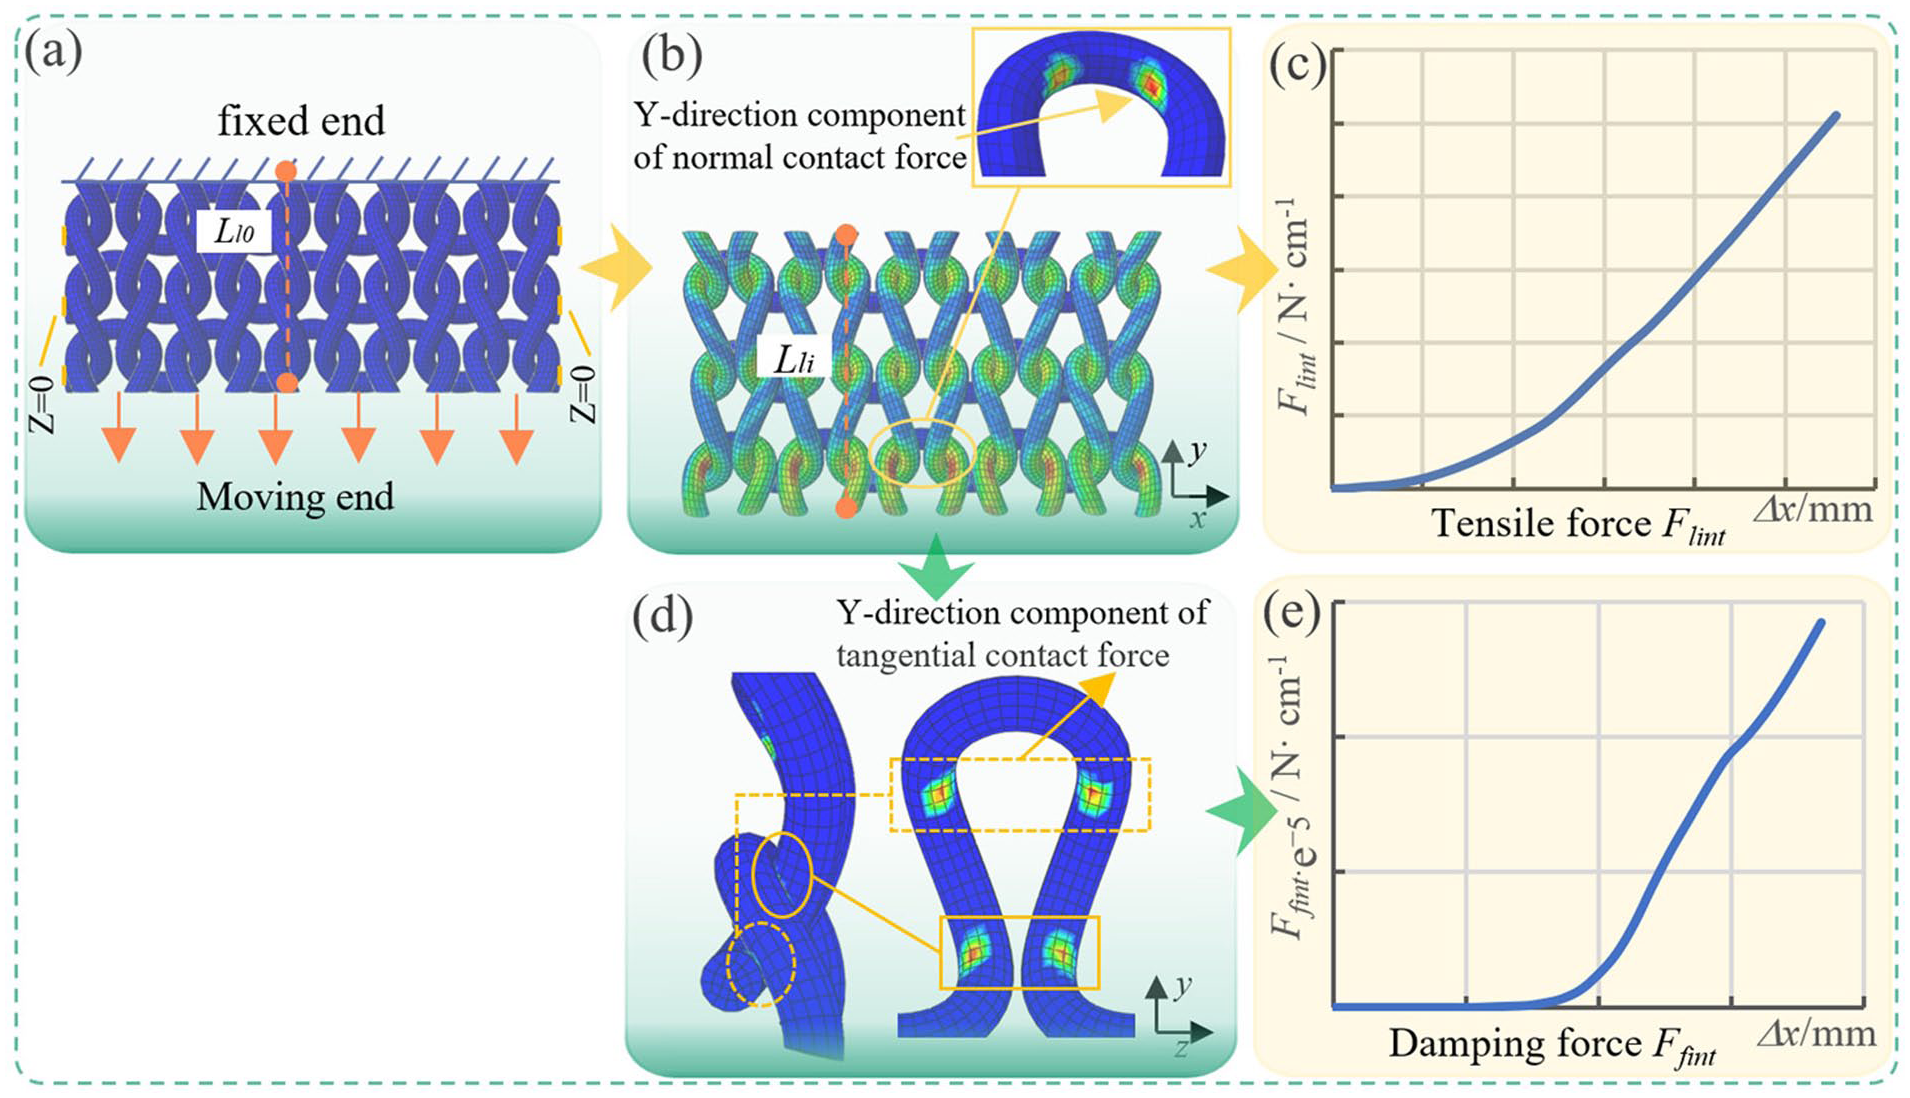
FE simulation and data extraction of tensile and damping coefficient.
From the simulation results, the stretching force Flint per unit width was obtained versus the amount of variation of the distance, and the curves

Based on the definition of the damping coefficient, as shown in Figure 8(d), as the fabric undergoes tensile deformation, the yarns circling each other are stretched tightly. This increases the tangential contact force Ff. The tangential contact force in the Y-direction per unit width, denoted as Ffint, is obtained, and the curve
After obtaining the MMPs through yarn-level FE simulation and equivalently matching them to the SMPs, we must further consider how to analyze the matching errors.
Discussion on matching error analysis methods
During the development and design of fabric products, designers often expect that fabrics produced based on SDPs will exhibit the desired drape morphology. Fabric drapeability, in this context, refers to the visual manifestation of fabric morphology, which is a comprehensive mechanical performance indicator that can be specifically measured and evaluated to assess the fabric's morphological style and aesthetic properties. Since there are only three spring forces and one damping force in a MSM, these four items in the natural drape state determine the simulation morphology results. Scholars often use fabric drapability to perform error analyses on realistic results of MSM simulations.18-20 For this reason, the national standard GB/T 23329-2009 “Textiles—Determination of drapability of fabrics” is referred to, and MSM is utilized to perform the virtual simulation of static draping in the natural state. The projected area S, the drape coefficient F, and the petal number m are obtained from the virtual simulation results and the static drape experiments, respectively. Finally, an error analysis is performed to determine the accuracy of the fabric MMPs described in this study.
As shown in Figure 9., the area of the fabric sample is denoted as AR, the area of the measuring platform is Ar, and the projected area of the umbrellalike drape is S. From these parameters, the drape coefficient
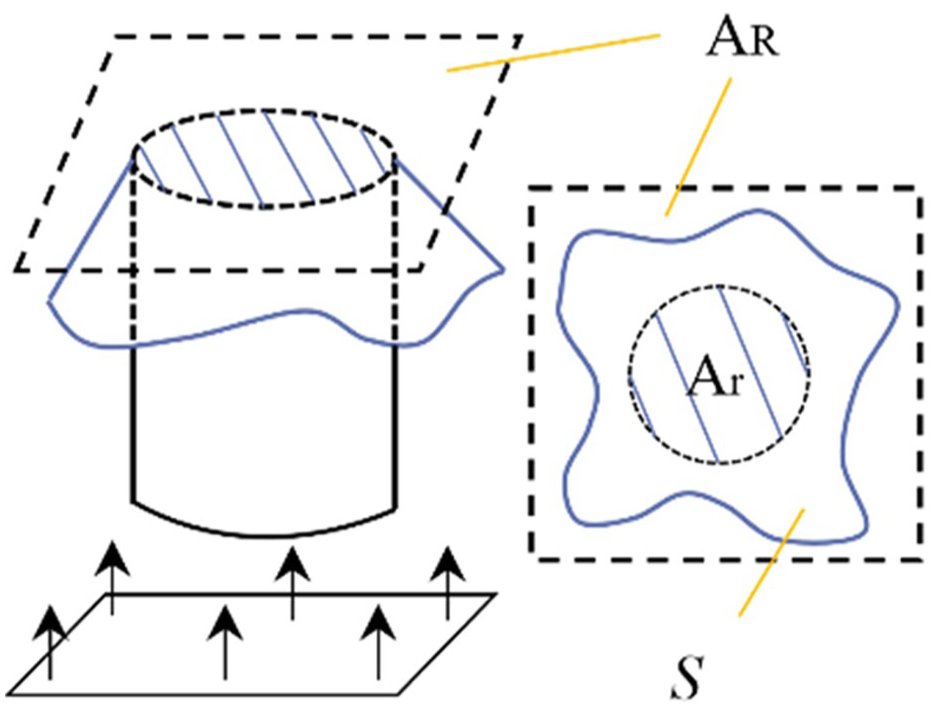
Schematic diagram of the drapeability measurement principle.
In summary, this section provides the definition of fabric MMPs specifically tailored to match SMPs, unifying the mechanical principles and unit systems. Subsequently, four sets of yarn-level FE models were established to obtain MMPs, detailing the decoupled simulation approach for flexible body models and suggesting parameter ranges. In addition, methods for analyzing matching errors were proposed. In this process, the yarn-level models are described by SDPs, and the simulation results represent MMPs, which are equivalently assigned to SMPs. Therefore, through yarn-level FE simulation, the correspondence between SDPs and SMPs can be established.
For fabric designers and other users, relying on yarn-level FE simulations for each individual case remains relatively complex. Therefore, it is essential to develop data-driven SMods to better facilitate the fabric development and design process.
Case study: data-driven SMods for SDPs and SMPs of weft-plain fabrics
To validate its applicability, we use weft-plain fabrics as a case study, leveraging yarn-level FE simulations to build a database and establish a data-driven SMods linking SDPs and SMPs. The model is then applied to design cases and validated through experiments for drape error analysis. The application framework is illustrated in Figure 10. The third part of the figure further summarizes the flowchart of the connections between multiple abbreviated terms involved in the paper, enhancing readers' understanding. Since MMPs in this study are equivalently assigned to SMPs, the MMPs obtained from FE simulations are directly represented by k1, k2, k3, and uzn in the description of the relationship model. This data-driven SMods, with its rapid response capability, can be integrated into intelligent manufacturing systems to accelerate the intelligent development and design of fabrics and optimize smart manufacturing processes.
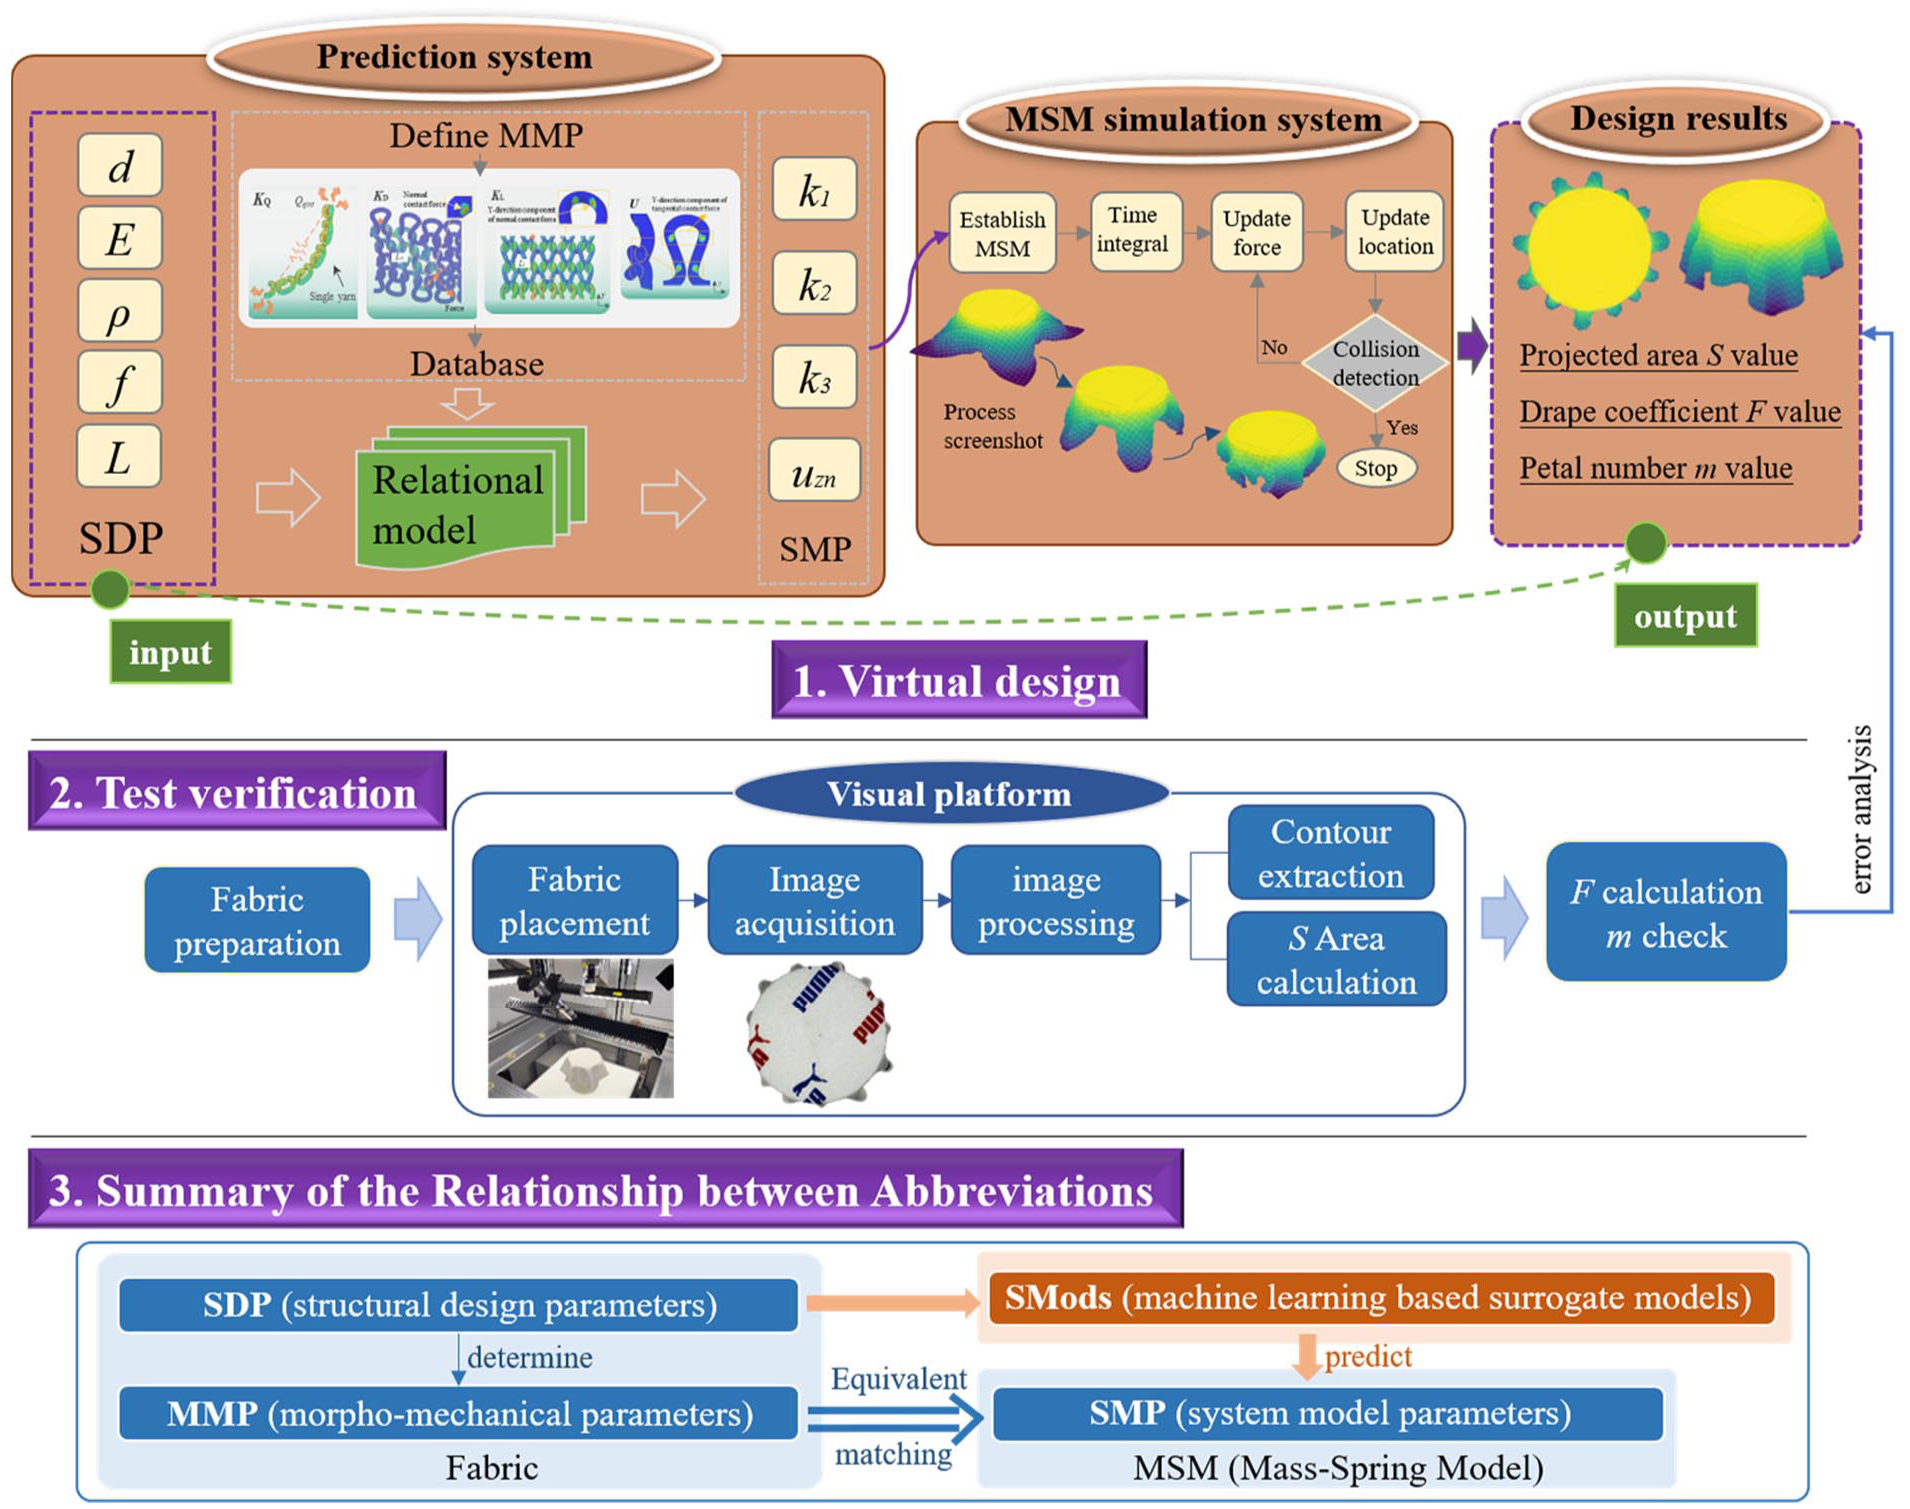
Application framework for the design case.
Selection of features
SMPs represent the physical and mechanical properties of fabrics, which are determined by the physical characteristics of the yarns and the fabric's structural organization. These properties can be defined during the fabric structural design phase. 41 Linear regression fitting using fiber tensile stiffness, yarn fineness, warp, weft densities, and grammage weight was employed to predict fabric bending stiffness with reasonable accuracy. 42 Other scholars43,44 have studied the factors affecting the mechanical properties of fabrics. However, such predictions pertain to conventional fabric mechanical attributes, and the results cannot be applied directly to SMPs. The MMPs proposed in this study depend on the fabric's inherent physical attributes and can also utilize extensive datasets to achieve ML.
Fabric organization mainly refers to the fabric weave, where the same weave can make the mechanical attributes of the fabric more regular. This study chose a common weft-plain fabric as an example to be investigated. Transverse (longitudinal) density refers to the number of yarns in a unit width (or length) of fabric, and the length of the coil has the greatest influence on it. Therefore, the transverse longitudinal density can be replaced with the coil length. In characterizing the physical attributes of a yarn material, the yarn tensile modulus, density, and coefficient of friction are comprehensive factors. In addition, yarn diameter affects fabric thickness, cross-length density, and grammage, so it cannot be ignored. Accordingly, weft-plain fabrics are taken as an example, and yarn diameter d, initial elastic modulus E, yarn density ρ, friction coefficient f, and coil length L of the organizational structure, a total of five parameters, are selected as features. These five features comprehensively cover the factors affecting the mechanical attributes of the fabric.
Databases
With the rapid development of computing, FE and ML have become the technical methods to study the mechanical properties of fabrics, composites, etc. For database creation, yarn-level FE offer the following advantages over physical experimental measurements.
(1) It is possible to flexibly implement multiclass simulations depending on the needs of mechanical analyses and eliminate the costs and limitations associated with experimental equipment.
(2) Modeling simulations can be conducted directly based on a wide range of fabric structures and yarn parameters provided by consulting or manufacturers, which facilitates obtaining numerous results and simplifies the process of subsequent database creation.
(3) It enables comparative analysis of control variables, such as different yarn materials for the same fabric construction, which is simpler than collecting numerous fabrics to meet control variable requirements.
(4) Multiple experimental measurements are necessary if fabrics with unclear fabric structures and yarn attributes are collected, whereas FE simulation can effectively avoid this issue.
In Figure 11, we show the specific results of nine groups of FE simulation. It can be observed from the figure that the stretch curves of flat knitted tissues with different yarn sizes and materials exhibit differences, though they remain very similar. This indicates that the deformation principles of weft-plain fabrics are closely related. A similar trend is evident for the bending energy curve and the friction curve. In addition, the mechanical attributes of fabric during deformation under the same weave are traceable and related to the yarn attributes, contributing to the accuracy of subsequent ML. 45
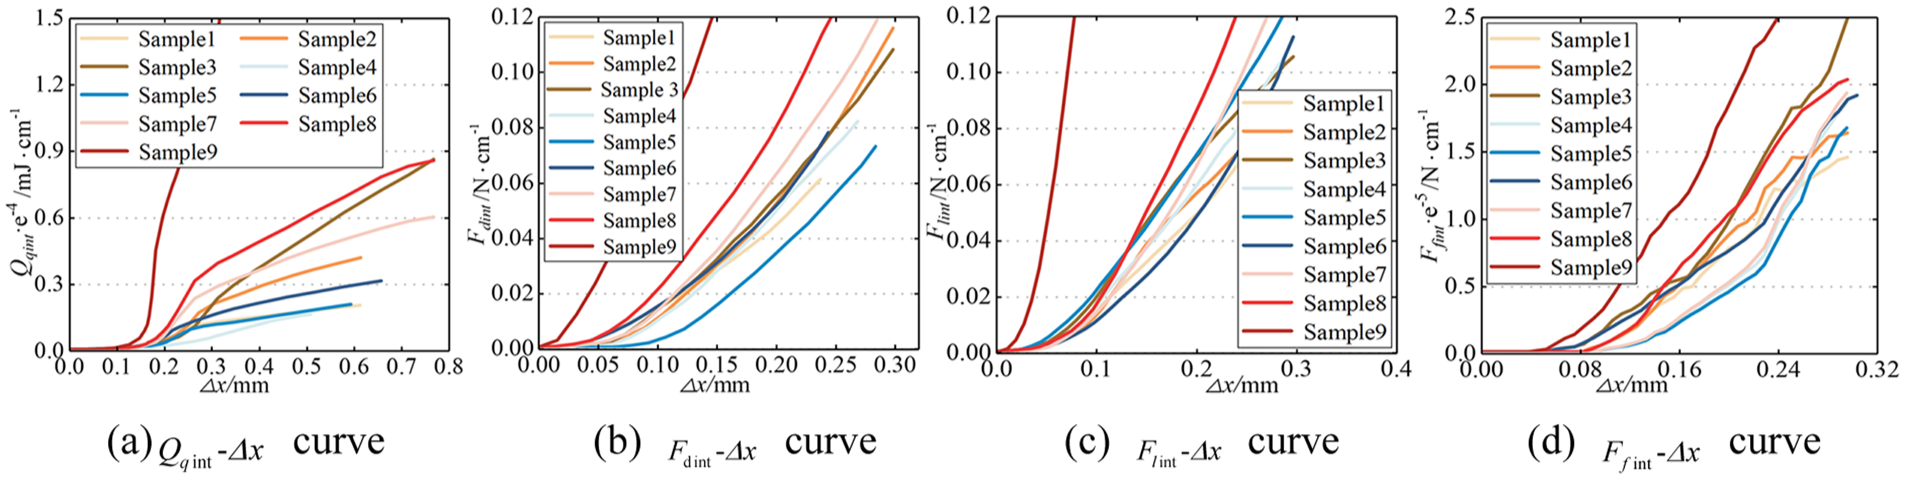
Simulation results of samples: (a)
The simulation results can obtain nonlinear curves, which can be used in complex fabric scenes. According to the natural drape scene of this study, we can also obtain the parameter value MMPs when the shape variable is 1%, and assign an equivalent value SMPs.
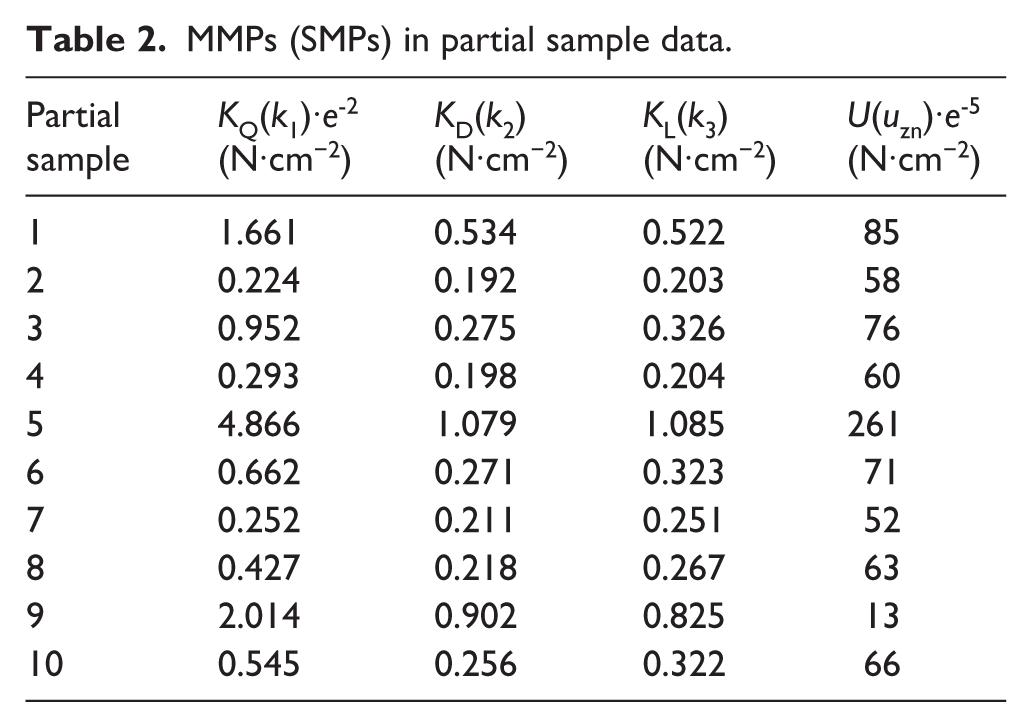
In this paper, the common yarn materials such as cotton, nylon, polyester, flax yarn, and wool are selected for yarn grade FE simulation. Tables 1 and 2 present part of the sample data when the shape variable is taken at 1%.
Fabric SDPs and specification parameters in partial sample data.
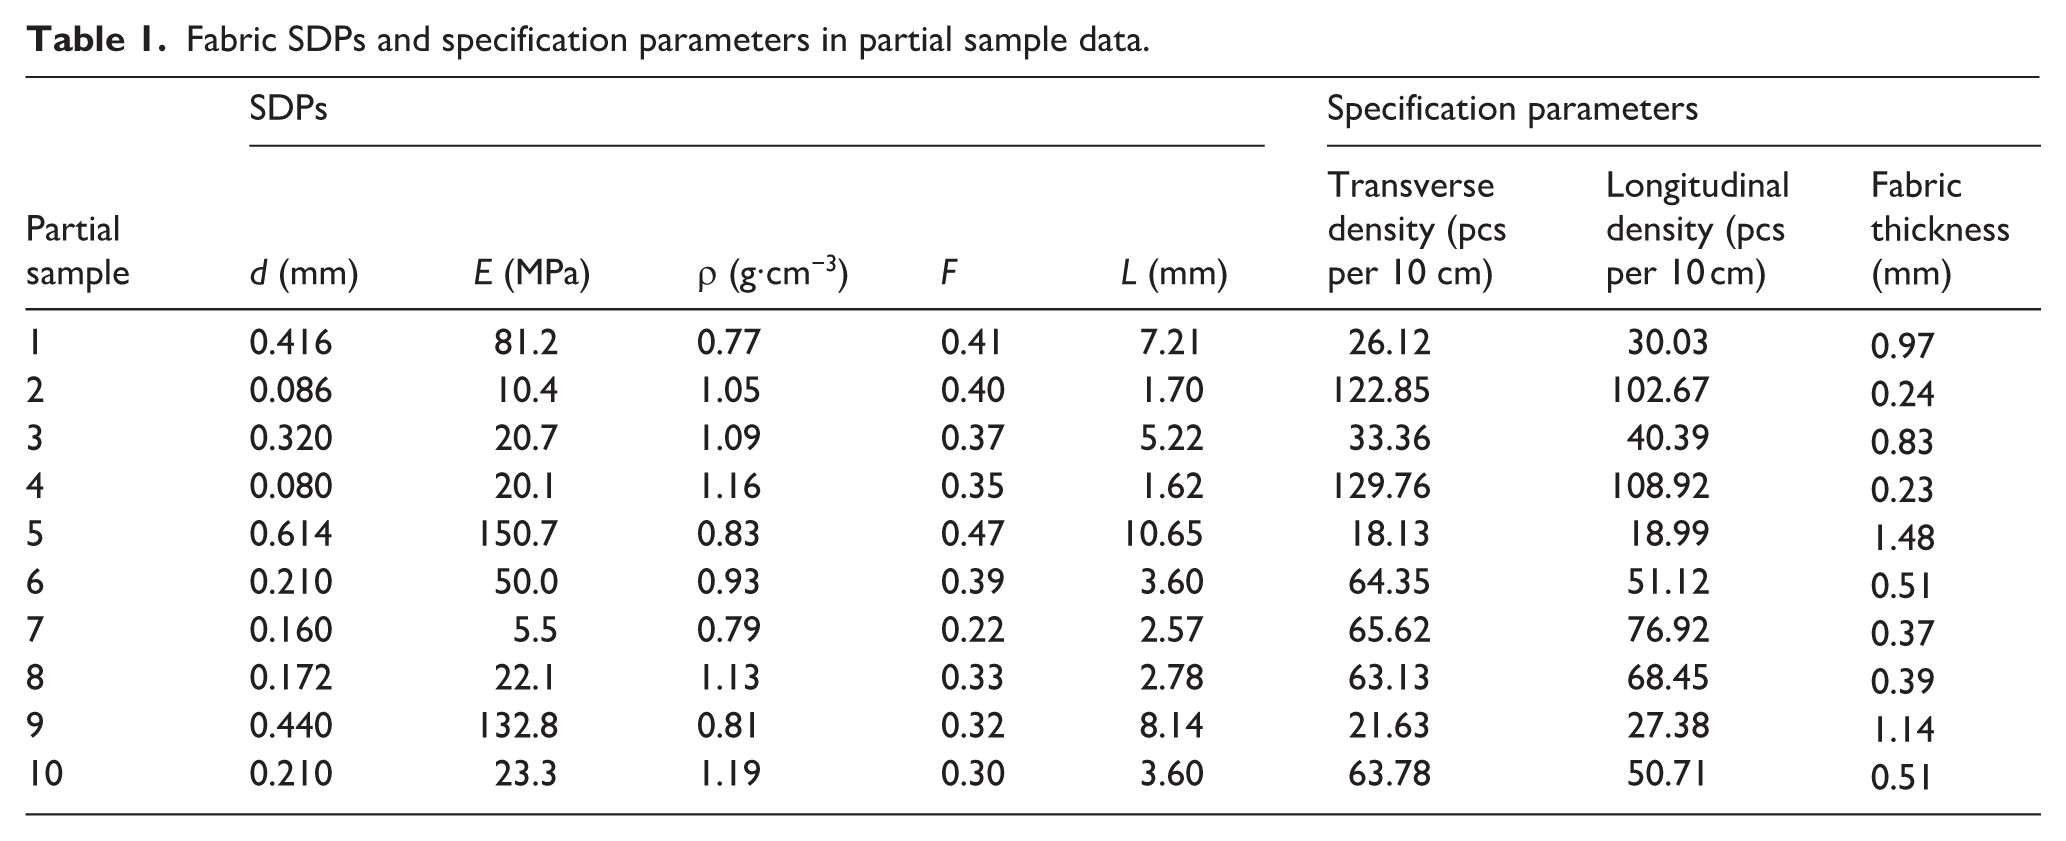
MMPs (SMPs) in partial sample data.
Model establishment and validation
In order to build the data-driven SMods, we have carried out three kinds of regression models, including polynomial regression, support vector machine, and random forest. Among them, the fitting results of the polynomial regression model are more general, with R2 only around 0.7, which cannot learn the knowledge model embedded in the sample set well. For the support vector machine regression model of Gaussian kernel, not only is the computational speed significantly slower, but also the interpretability is lower, making it difficult to directly analyze feature importance. In contrast, the random forest regression model performs better on multidimensional data, is suitable for dealing with nonlinear relationships and complex feature interactions, has interpretability, and has been widely used in industrial efficiency, finance, and marketing. 46 Therefore, we finally chose the random forest regression model, which is superior in all aspects, to achieve the SDPs and SMPs relationship model. This is followed by a description of the model establishment and validation process.
First, after the data loading and preprocessing process, the training and test datasets were then divided by the train_test_split() method with a test datasets ratio of 0.23 and a random seed setting of 42. Then, in order to perform hyperparameter tuning more comprehensively and reliably, parameter combinations were searched using the GridSearchCV system. In this case, the parameter grid was tested for three types of key parameters.
(1) The number of trees (n_estimators): four values of 50, 72, 90, and 100 were tested to balance model complexity and computational efficiency.
(2) Maximum tree depth (max_depth): try 3, 5, and 7 layers and none to control the complexity of a single tree.
(3) Minimum number of samples for node splitting (min_samples_split): set to 2 or 3 to prevent overfitting on small datasets.
Then, the best parameters are selected by fivefold cross-validation (with n_splits = 5, shuffle = True and random_state = 42). Finally, the hyperparameter tuning results for the above three key parameters are 72, 5, and 2, respectively.
The total number of samples in this study is 90, of which 70 are training datasets and 20 are test datasets. Figure 12 depicts the predicted values against the true values for this random forest regression model. Figure 13 illustrates the significance of each feature. The R2 and mean squared error (MSE) values for the model were obtained to evaluate the model results, as listed in Table 3. Together, these two metrics provide a comprehensive assessment of the performance of the random forest regression model.
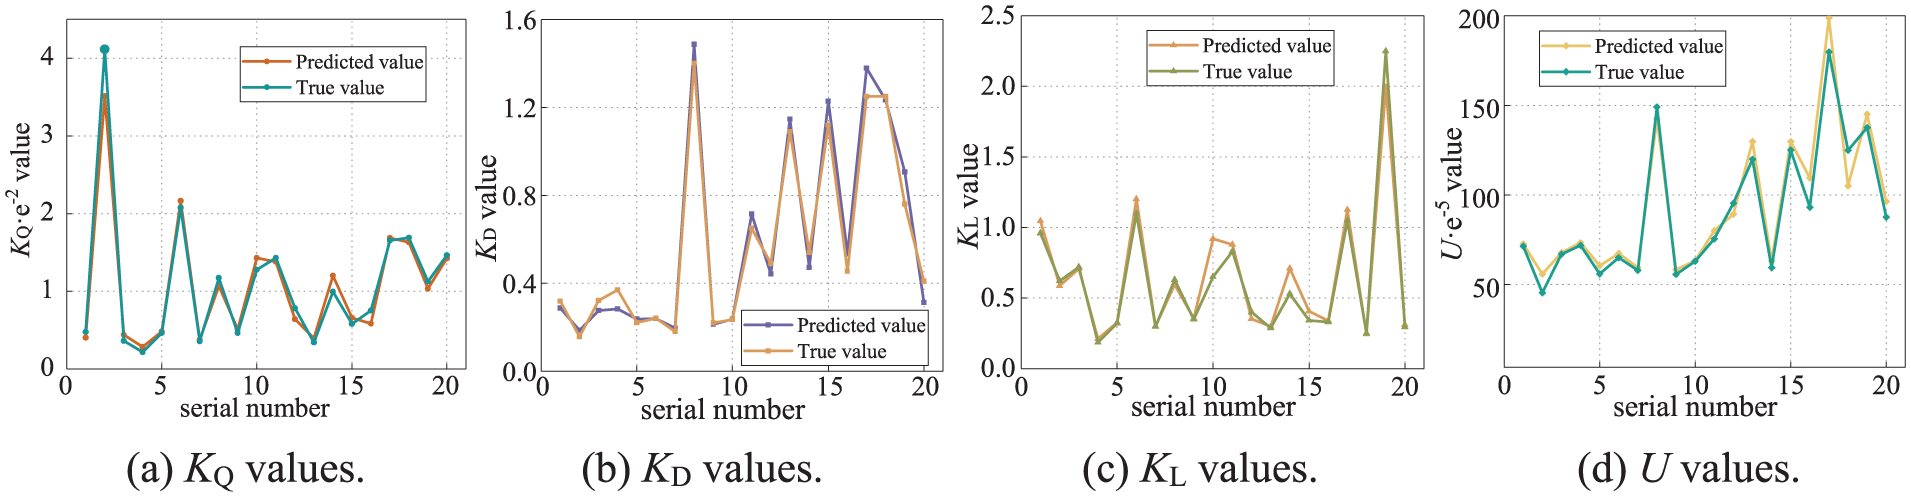
Plot of predicted versus true values of the regression model: (a) KQ values; (b) KD values; (c) KL values; (d) U values.
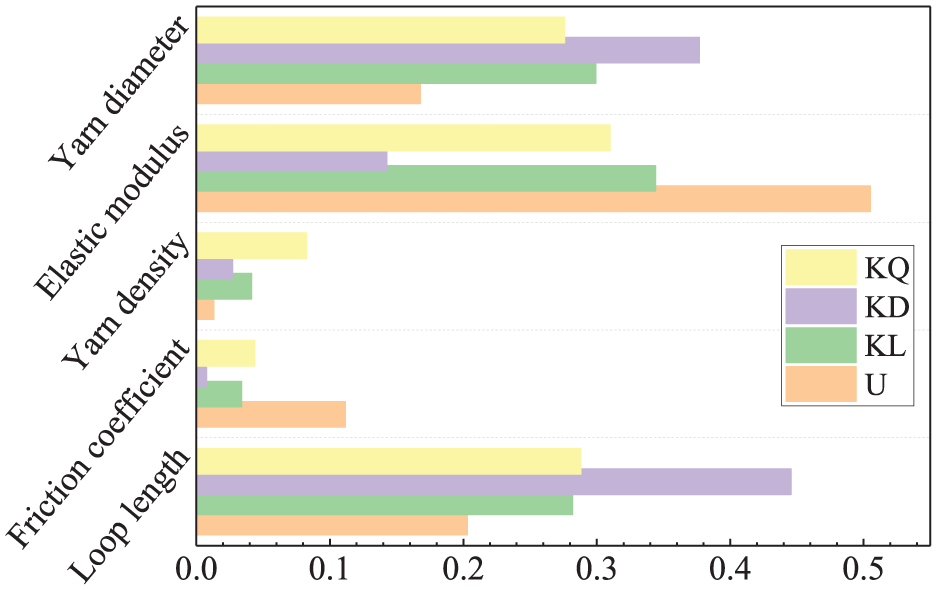
Status of feature significance.
Validation results of the random forest regression model.
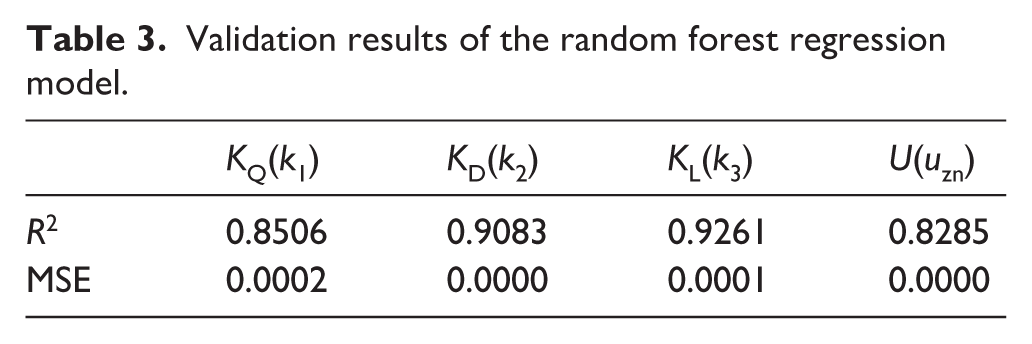
Figure 12 and Table 3 indicate that the data fits are better, as they are all above 0.8. The MSE values of the four coefficients are below 0.0002, and the results are also improved. Figure 13 shows that the most essential features are yarn diameter, elastic modulus, and loop length, followed by yarn density and friction coefficient. Therefore, when applying the model, if more accurate recommendations are desired, it is essential to ensure the accuracy of these three most important features. Therefore, this paper takes weft-plain fabric as an example to establish a data-driven SMods linking SDPs and SMPs.
Application error analysis
After establishing the relationship model between SDPs and SMPs, we can show and analyze the error through case experiments. Therefore, we carried out 10 groups of drape experiments, and the experimental samples were named samples 1–10. We measured and collected the SDPs of the sample and recorded them in Table 4.
SDPs of the samples.
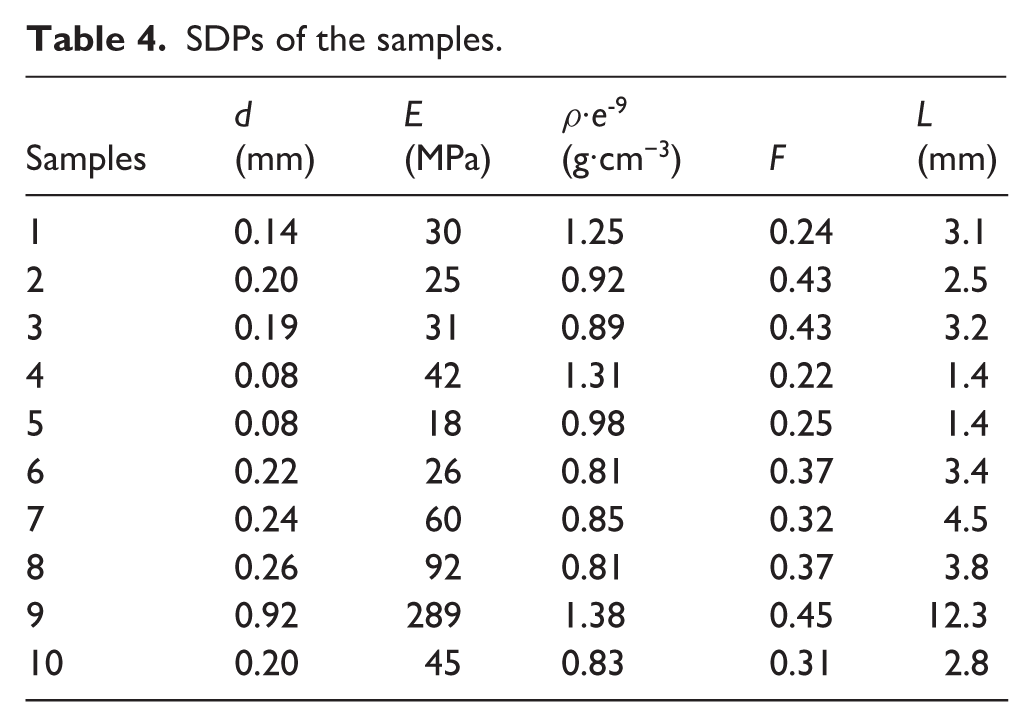
Therefore, SDPs are used as the input to output the virtual results through the relationship model and MSM simulation system. In MSM simulation system, the size of virtual fabric is 24 cm × 24 cm, and the diameter of cylindrical table is φ12 cm, which makes the fabric fall naturally after t = 0. The virtual drape simulation can directly obtain the projected area of the stabilized outer contour of the cloth in the XY plane, as shown in Figure 14, which is recorded as SMSM, and the number of points is mMSM. The output result here is that in the fabric development and design stage, the animation and drapability of fabric drape form are displayed virtually for designers to optimize the design.
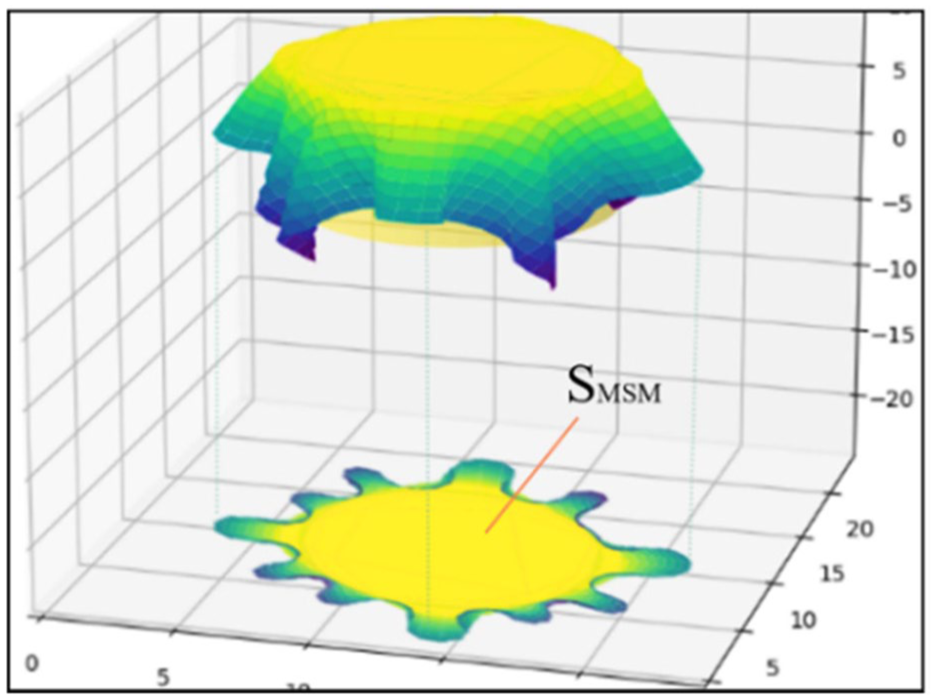
Virtual simulation of fabric drape.
In order to verify the virtual design error, we established a visual platform for the drape experiment according to the experimental method described previously, as shown in Figure 15(a), which is the overall schematic diagram, including worktop, panel, keyboard, and control cabinet. The details of worktop include cylindrical pedestal, projection board, illuminant, and fixed camera, as shown in Figure 15(b). We will place the prepared and cut fabrics one by one on the cylindrical pallet, with the center aligned. The size of the fabric is 24 cm × 24 cm. The humidity is reduced under the condition of 20 ± 2° and 65% ± 3% relative humidity to ensure that it is flat without obvious folds. The cross-section size of the cylindrical pedestal is ϕ12 cm. Then release the four corners of the fabric at the same time to make it fall naturally. After the fabric is stable, the image of the fabric on the projection board is collected by a fixed camera, and the pixel area of the cylindrical pallet and the pixel area of the fabric contour are obtained by image contour recognition technology. According to the actual area ratio of the cylindrical pedestal and the pixel area, the actual area of the cloth contour is obtained, which is recorded as Stest, and the mtest value is counted at the same time. The number of experiments for each sample is 10, and the average value is finally taken.
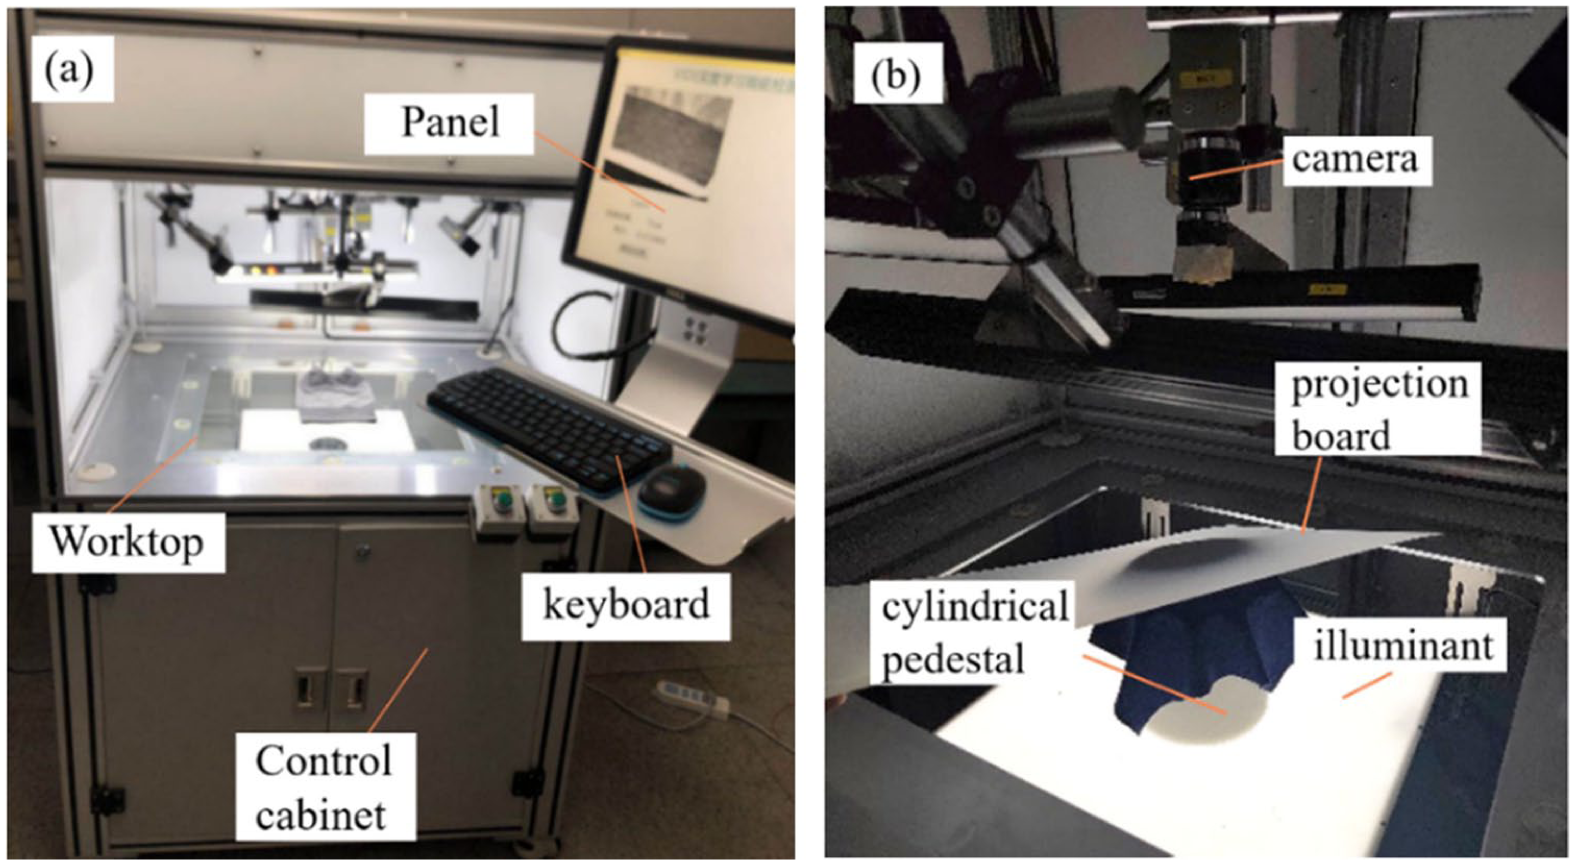
Experimental setup of fabric drape: (a) integral device; (b) details of the worktop.
Finally, the top view, overall appearance, projected area S and petal number m for the 10 samples of virtual simulations and experiments are presented in Figure 16.
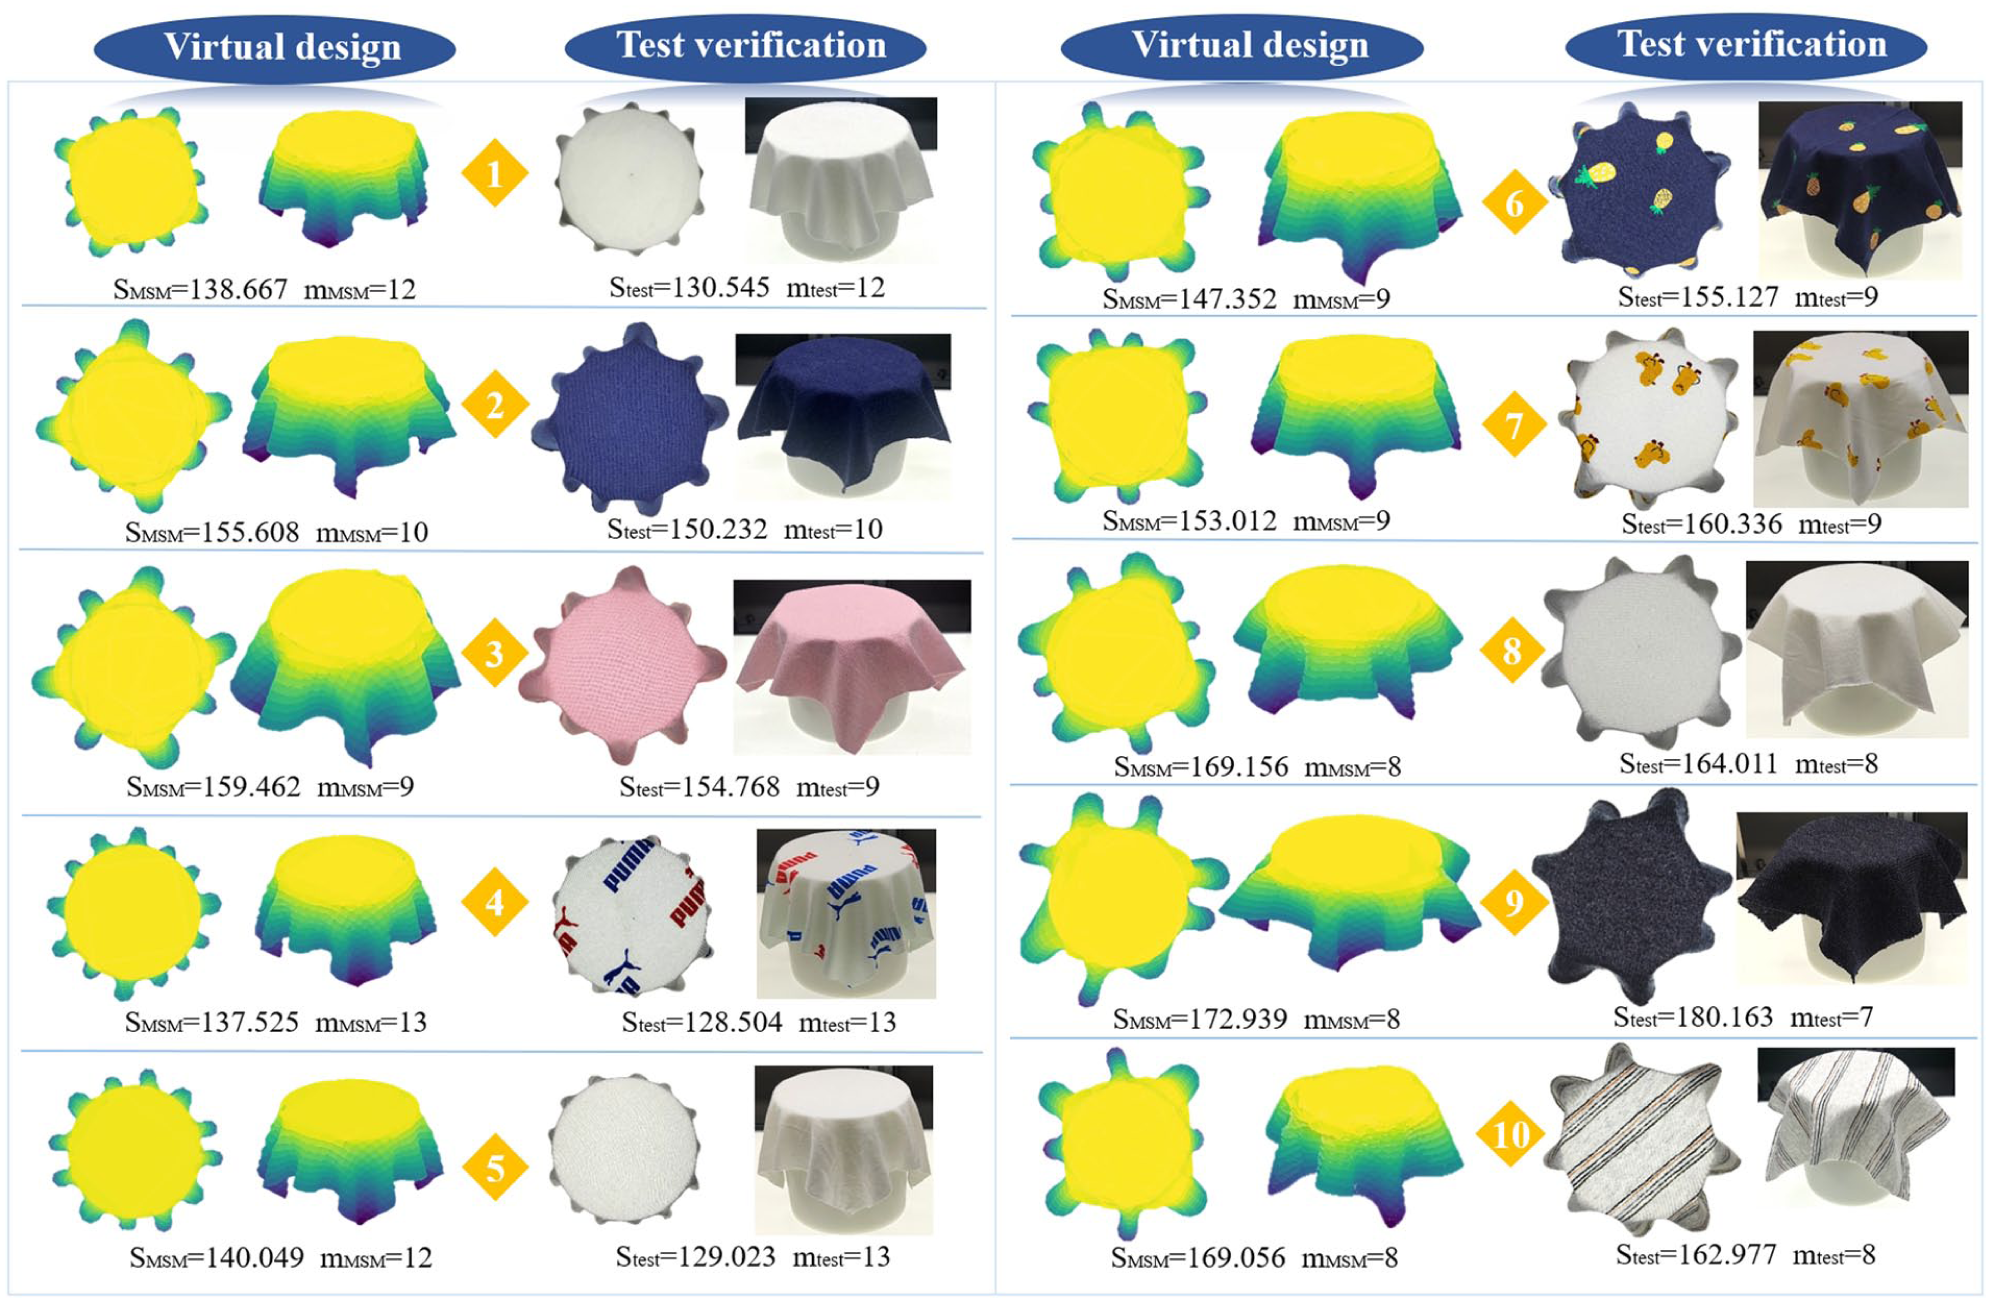
Comparison diagram of virtual design and drape experiment.
From this, the error of fabric projection area S of samples 1–10 is 6.22%, 3.58%, 3.03%, 7.02%, 8.55%, 5.01%, 4.57%, 3.14%, 4.01%, and 3.73%, respectively, and the error is small, within ±8.55%. The appearance is also close, and the error of the petal number m is within ±1, which is enough to show the fabric shape effect more accurately.
This process indicates that drapability is most affected by KQ; the smaller the KQ, the smaller the projection area S tends to be. This indicates that the bending stiffness in the conventional fabric mechanics parameters represents the ratio of bending torque to curvature, which is inherently challenging to match with the SMP, often leading to large errors in virtual simulations. When the fabric is smoother and less damped, it causes excessive fabric swing and jitter. The stability of the virtual simulation system and the termination position are affected, increasing the error. For example, samples 4 and 5 exhibit the most pronounced effects, whereas samples 1 and 6 also show some reflection of this issue. The reason is that during the FE simulation, factors such as hairiness, twist, and interfiber friction within the yarn are ignored, which can cause the damping bias to be small. The damping deviation becomes more evident in fabrics with small damping. In addition, the more softer the fabric, the smaller the morphological parameters and the more pronounced the effect of the damping deviation. But they are all within a small error range, which is enough to meet the requirements of visual design.
This case utilizes the virtual simulation realism of drape morphology to demonstrate the accuracy and rationality of the modeling framework proposed in this paper. This model is established based on the values taken on the FE result curve under the condition of small deformation (1%) when the fabric naturally drape. Therefore, this case is suitable for virtual simulation of natural morphology of fabrics with small deformations close to 1%, such as natural hanging, fluttering skirts in the wind, natural fabric landing, tablecloths, and other scenarios. If virtual simulation of large deformation of fabrics is required, segmented values can be obtained from the FE result curve, and the values of each segment can be easily used to construct a regression model for accurate prediction. When applied to the MSM system, the deformation of Δx can be input into the corresponding SMPs in real time to obtain a more realistic virtual form.
Therefore, this section has taken weft-plain fabric as an application case to establish the data-driven SMods of SDPs and SMPs. The model verification results are good and the experimental error is small. This case further illustrates that the proposed method of fabric MMPs matching SMPs, and yarn-level FE decoupling simulation can help build the relationship model between SDPs and SMPs, and enable the fabric intelligent development architecture proposed in this paper to be realized.
Conclusion
In the fabric development stage, we studied the SDP and SMP data-driven SMods for the implementation of flexible virtual collaborative design architecture. At the fabric development end, the designer inputs the SDPs to the data-driven SMods, and the fast output SMPs are used in the physical particle system to simulate and display the natural drape shape and drape parameters of the fabric. The designer can adjust the design parameters until the shape effect meets the expectation, avoiding repeated sample production and drape experiments, saving resources and time costs.
In order to achieve this goal, this paper first defines the fabric MMPs that specifically match the SMPs. Then, a method to obtain the mechanical parameters of fabric morphology is proposed based on the SDPs of fabric and the uncoupling flexible body simulation of yarn-level FEs. Finally, taking weft-plain fabric as an application case, the relationship model between fabric SDPs and SMPs is constructed by introducing data-driven SMods. The experimental results show that the error is within ±8.55%, which is enough to accurately display the fabric shape effect, so that the architecture of flexible virtual collaborative design in the fabric development stage can be realized.
Therefore, this method can significantly improve the convenience and accuracy of SMP acquisition for physical particle systems. However, at present, we have only studied the weft-plain fabrics as an example, which has certain limitations, and the fabric types can be gradually extended in the later stage according to the general idea of the thesis. In this process, the FE model is more time-consuming, so for fabrics with simple structures (such as plain weave, twill weave, and ribbed stitch), which are closer to this example, it will be easier to expand and realize in the future. For complex structured fabrics (e.g., jacquard), the corresponding FE model will be significantly more complex and time-consuming, and the setting of boundary conditions will be challenging. In addition, the fabric SDPs are significantly different from the present example, and in-depth analysis is required in determining the independent variables. In conclusion, when the type and quantity of data are sufficient, it is hoped we can form a large AI model of SDPs and SMPs, which will have broad application prospects in the future.
Footnotes
Declaration of conflicting interests
The authors declared no potential conflicts of interest with respect to the research, authorship, and/or publication of this article.
Funding
The author(s) disclosed receipt of the following financial support for the research, authorship, and/or publication of this article: This work was supported by the Program Project of Science and Technology Guidance of China National Textile and Apparel Council (2025049), and Ministry of Industry and Information Technology Industrial Technology Basic Public Service Platform Project (grant number 2021-0173-2-1), and by Key Project of the Natural Science Foundation of Tianjin City (grant number 24JCZDJC00670).
