






Abstract
This study introduces an innovative three-dimensional (3D) fully fashioned shoe body knitting technology to streamline the complex process flow of traditional footwear manufacturing. While designing the shoe body with functional partitions and prioritizing lightweight construction as the primary goal, the study focuses on the toe area, which has received less research attention. A differentiated fabric structure and yarn combination scheme are developed for this critical region using the SHIMA SEIKI four-needle bed computerized flat machine to weave 18 groups of single-sided fabric samples and conduct multidimensional performance tests. The experiments systematically examine how fabric structural deformation and yarn ratios influence key performance indicators, including thickness, weight per square meter, strength and elongation at break, fabric stiffness, top breakage, abrasion resistance, crease recovery, air permeability, and moisture permeability. A rating system is used to comprehensively evaluate these indices and identify the optimal solution with the best overall performance, providing a precise path for structural design and material selection in the toe area. The findings reveal the relationship between fabric structures, yarn combinations, and performance parameters, offering a systematic theoretical basis for the design of 3D fully fashioned knitted shoes.
Keywords
Knitted uppers can be classified into three types based on the knitting method: warp-knit uppers, flat-knitted uppers, and weft-knit uppers. Among these, warp-knit uppers have the highest production efficiency but are less diverse in knitting structure compared to the other two types. Though they have the lowest production efficiency, flat-knitted uppers can be formed into fully fashioned knitted uppers with rich colors and complex designs. Weft-knit uppers fall roughly between warp- and flat-knitted in terms of production efficiency and structural variety. 1 Flat-knitted uppers are produced using computerized flat knitting machines, which, due to features like electronic needle selection on their front and rear needle beds, needle turning functions, and local knitting and tension control, can create fully or semifashioned uppers with a variety of colors and designs by adjusting knitting density or adding color filaments during the process. 2 Particularly in lightweight sports shoe design, although the overall weight is light, different functional areas often require diverse structural changes. The technical features of computerized flat knitting machines can easily meet this design demand.
Each part of the shoe body has different functional requirements, and its structural design also exhibits varied characteristics. In the field of functional zoning research, Lu et al. 3 divided the upper into functional zones and used different yarns to design the upper structure according to the performance needs of those different zones. Cheng et al. 4 and Cong et al., 5 among other scholars, 6 on the other hand, systematically analyzed the style features and structural characteristics of flat-knitted uppers, based on human foot characteristics and functional requirements, thereby achieving digital design and three-dimensional (3D) simulation technology for flat-knitted uppers.
As a key part of a shoe, the toe plays a crucial role in comfort, esthetics, and more. Zhu et al. 7 and Li et al. 8 explored in depth the influence of different running shoe toe shapes on toe impact to prevent toe injuries caused by long-distance running. Gu et al. 9 effectively reduced the risk of mechanical injury by structurally optimizing the toe of running shoes, thereby preventing subungual toe hematoma injuries. Focusing on the toe box area, Lin et al. 10 systematically analyzed its impacts from the perspective of sports biomechanics and put forward a framework for the research, development, and evaluation of the toe box in the entire shoe.
In terms of research on the performance of footwear materials, Zhang et al. 11 systematically explored the optimization path to improve the crease recovery performance of materials through the crease recovery angle cycling test for warp-knitted upper materials with different jacquard layer structures. Zuo et al., 12 Sundar and Muralidharan, 13 and others 14 focused on the heat and humidity comfort performance of footwear uppers. They quantitatively analyzed the heat and moisture resistance of knitted upper fabrics to provide manufacturers with the best design and production methods for the heat and humidity comfort of knitted upper fabrics. Liu et al. 15 focused on the support performance of basketball shoes, specifically examining the influence of the lateral upper support position on ground reaction forces, ankle kinematics parameters, and moment changes during change-of-direction movements. Seul et al. 16 conducted a mechanical analysis of footwear using finite element simulation tools to explore methods for enhancing mechanical performance. They conducted analyses to explore a technical approach that can enhance the footwear design and manufacturing process.
In the traditional footwear industry, the manufacturing process of the shoe body is complex and it is impossible to achieve one-shot molding. There is room for improvement in production efficiency and material utilization, making it urgent to address industrial problems through technological innovation. In response to this problem, Sterman and Almog 17 applied 3D knitting technology to knitted cylinders for manufacturing knitted garments; through process optimization, they achieved the simplification of production procedures, which provided important practical references for the innovative development of cylindrical knitted shoe bodies. Peng et al. 18 utilized the partial knitting process in fully fashioned knitting technology to play a key role in the realization of fully fashioned one-piece knitwear forming technology. Lu et al. 19 and Zhan et al. 20 further deepened the research on the full-fashioning process, utilizing the changing stitch system of a four-needle bed computerized flat machine to promote the technological development of fully fashioned woolen textiles and enhance product innovation. Dong et al. 21 utilized a four-needle bed computerized flat machine to weave 3D fully fashioned shoes and analyzed structural deformation while conducting in-depth research on tissue properties to provide the best design solutions for different parts of the shoe body.
As shown in Figure 1(a), the shoe body is divided into five functional zones, namely (1) toe, (2) tongue, (3) heel, (4) sole, and (5) sides. Among them, the toe is further subdivided into regions 1 and 2, which are slightly different in terms of fabric performance. This study focuses on the structural design and performance of toe fabric. As an integral part of the shoe body, the toe requires good strength and resistance to top breakage and abrasion, as well as breathability and moisture permeability. The knitting of the fully fashioned toe adopts an open-needle design so that the loops on both sides are gradually turned perpendicular to the knitting direction, and the knitting sequence is counterclockwise from the front to the back, as shown in Figure 1(b). Figure 1(c) shows the main functional requirements of the structure of the toe area in the actual wearing process. Figure 1(d) parts (1) and (2) illustrate the process flow of the traditional two-dimensional (2D) semifashioned upper and the new 3D fully fashioned shoe body, respectively. The 3D fully fashioned shoe body features two knitting methods: forward knitting and lateral knitting. Compared to the 2D semiformed upper, the plane shaping and sewing processes are eliminated, which not only improves production efficiency but also enhances the esthetics of the shoe body due to its seamless structure. Compared to the forward knitting method, the lateral knitting method has the advantages of simple plate making and high efficiency because the knitting action of the front and rear machines is the same. In this paper, a performance study is conducted by selecting various single-layer toe fabric and yarn combinations to determine the optimal structure.
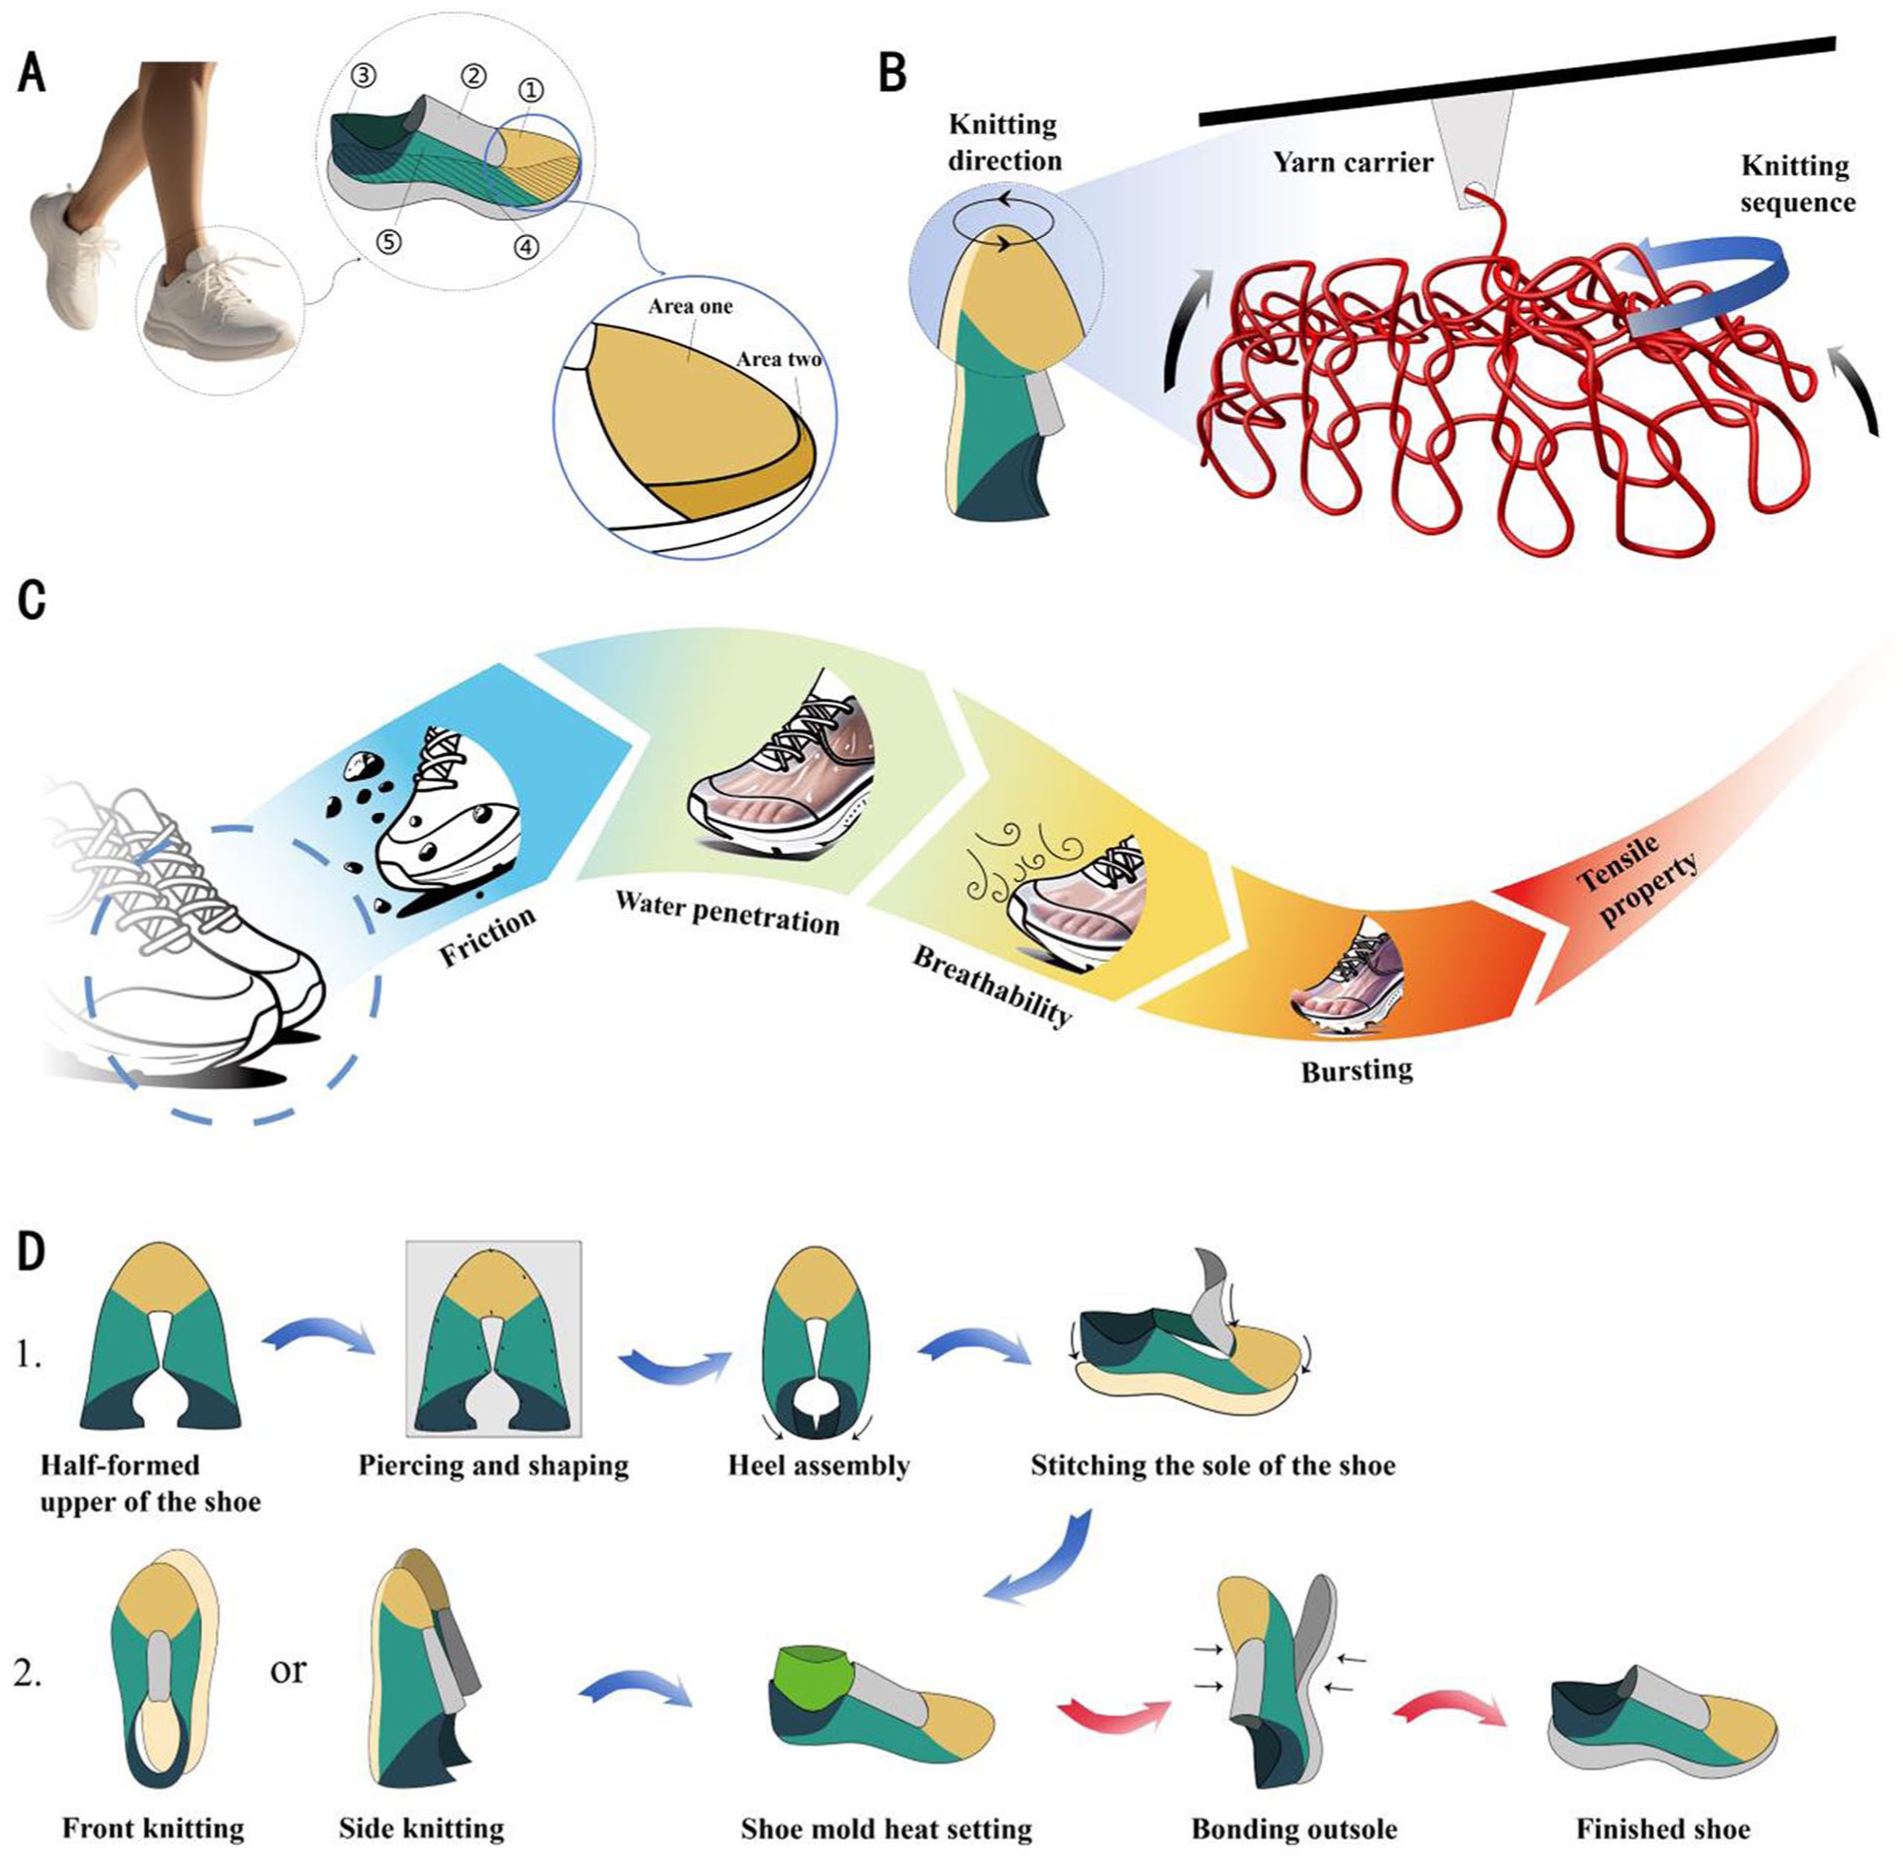
(a) Functional zones of sports shoes. (b) Diagram of shoe toe knitting. (c) Required functions of the shoe toe structure. (d) Comparison of the manufacturing processes for (1) two-dimensional shoe upper and (2) three-dimensional shoe body.
Experimental details
Materials
High-strength polyester composite yarn (666D/192F, Zhejiang Hailide New Material Co., Ltd.), ordinary polyester composite yarn (222D/96F, Hengli Petrochemical Co., Ltd.), full-melt hot-melt thermoplastic urethane (TPU) with a hot-melt temperature of 110°C (75D, Fujian Jinhao Sheng Textile Science & Technology Co., Ltd.), nylon monofilaments (0.15 mm, 0.18 mm Nantong Xintik Monofilament Technology Co. Ltd.), nylon monofilament (0.12 mm, Xintex Technology Co., Ltd.), polyester monofilament (0.12 mm, Xintex Technology Co., Ltd.).
Fabric design and processing
All fabrics were knitted on a SHIMA SEIKI four-needle bed computerized flat machine (ACH2XS153-15G, SHIMA SEIKI Seisakusho Ltd., Japan). Based on the “lightweight” design requirement, the toe fabric was designed as a single-sided fabric. Combined with the mainstream fly-knit toe tissue design on the market, the fabric is divided explicitly into six tissue types based on structural differences: type I, type II, type III, type IV, type V, and type VI. In terms of structural yarn selection, three different combinations of yarns, A, B, and C, are used for knitting, forming a total of 18 structure designs: IA, IB, IC, IIA, IIB, IIC, IIIA, IIIB, IIIC, IVA, IVB, IVC, VA, VB, VC, VIA, VIB, and VIC.
Among them, the main structure of yarn combination A consists of high-strength polyester multifilament + polyester multifilament + full-fusion hot-melt TPU, and the sub-structure is 0.15 mm nylon monofilament + polyester monofilament. The main structure of yarn combination B is the same as that of combination A, and the sub-structure is 0.12 mm nylon monofilament. The main structure of yarn combination C consists of high-strength polyester multifilament + full-fusion hot-melt TPU, and the sub-structure is 0.18 mm nylon monofilament + full-fusion hot-melt TPU. The main structure yarns construct the main body of the fabric, while the secondary structure monofilaments play a dual role in forming pores and connecting tissues.
The artisanal diagrams, coil simulations, and physical drawings of the six structures are shown in Figure 2(a). Structure I adopts the knitting process with monofilaments and multifilaments, and the pores are formed by the stretched loops of the multifilament. The structure is divided into nine horizontal rows.
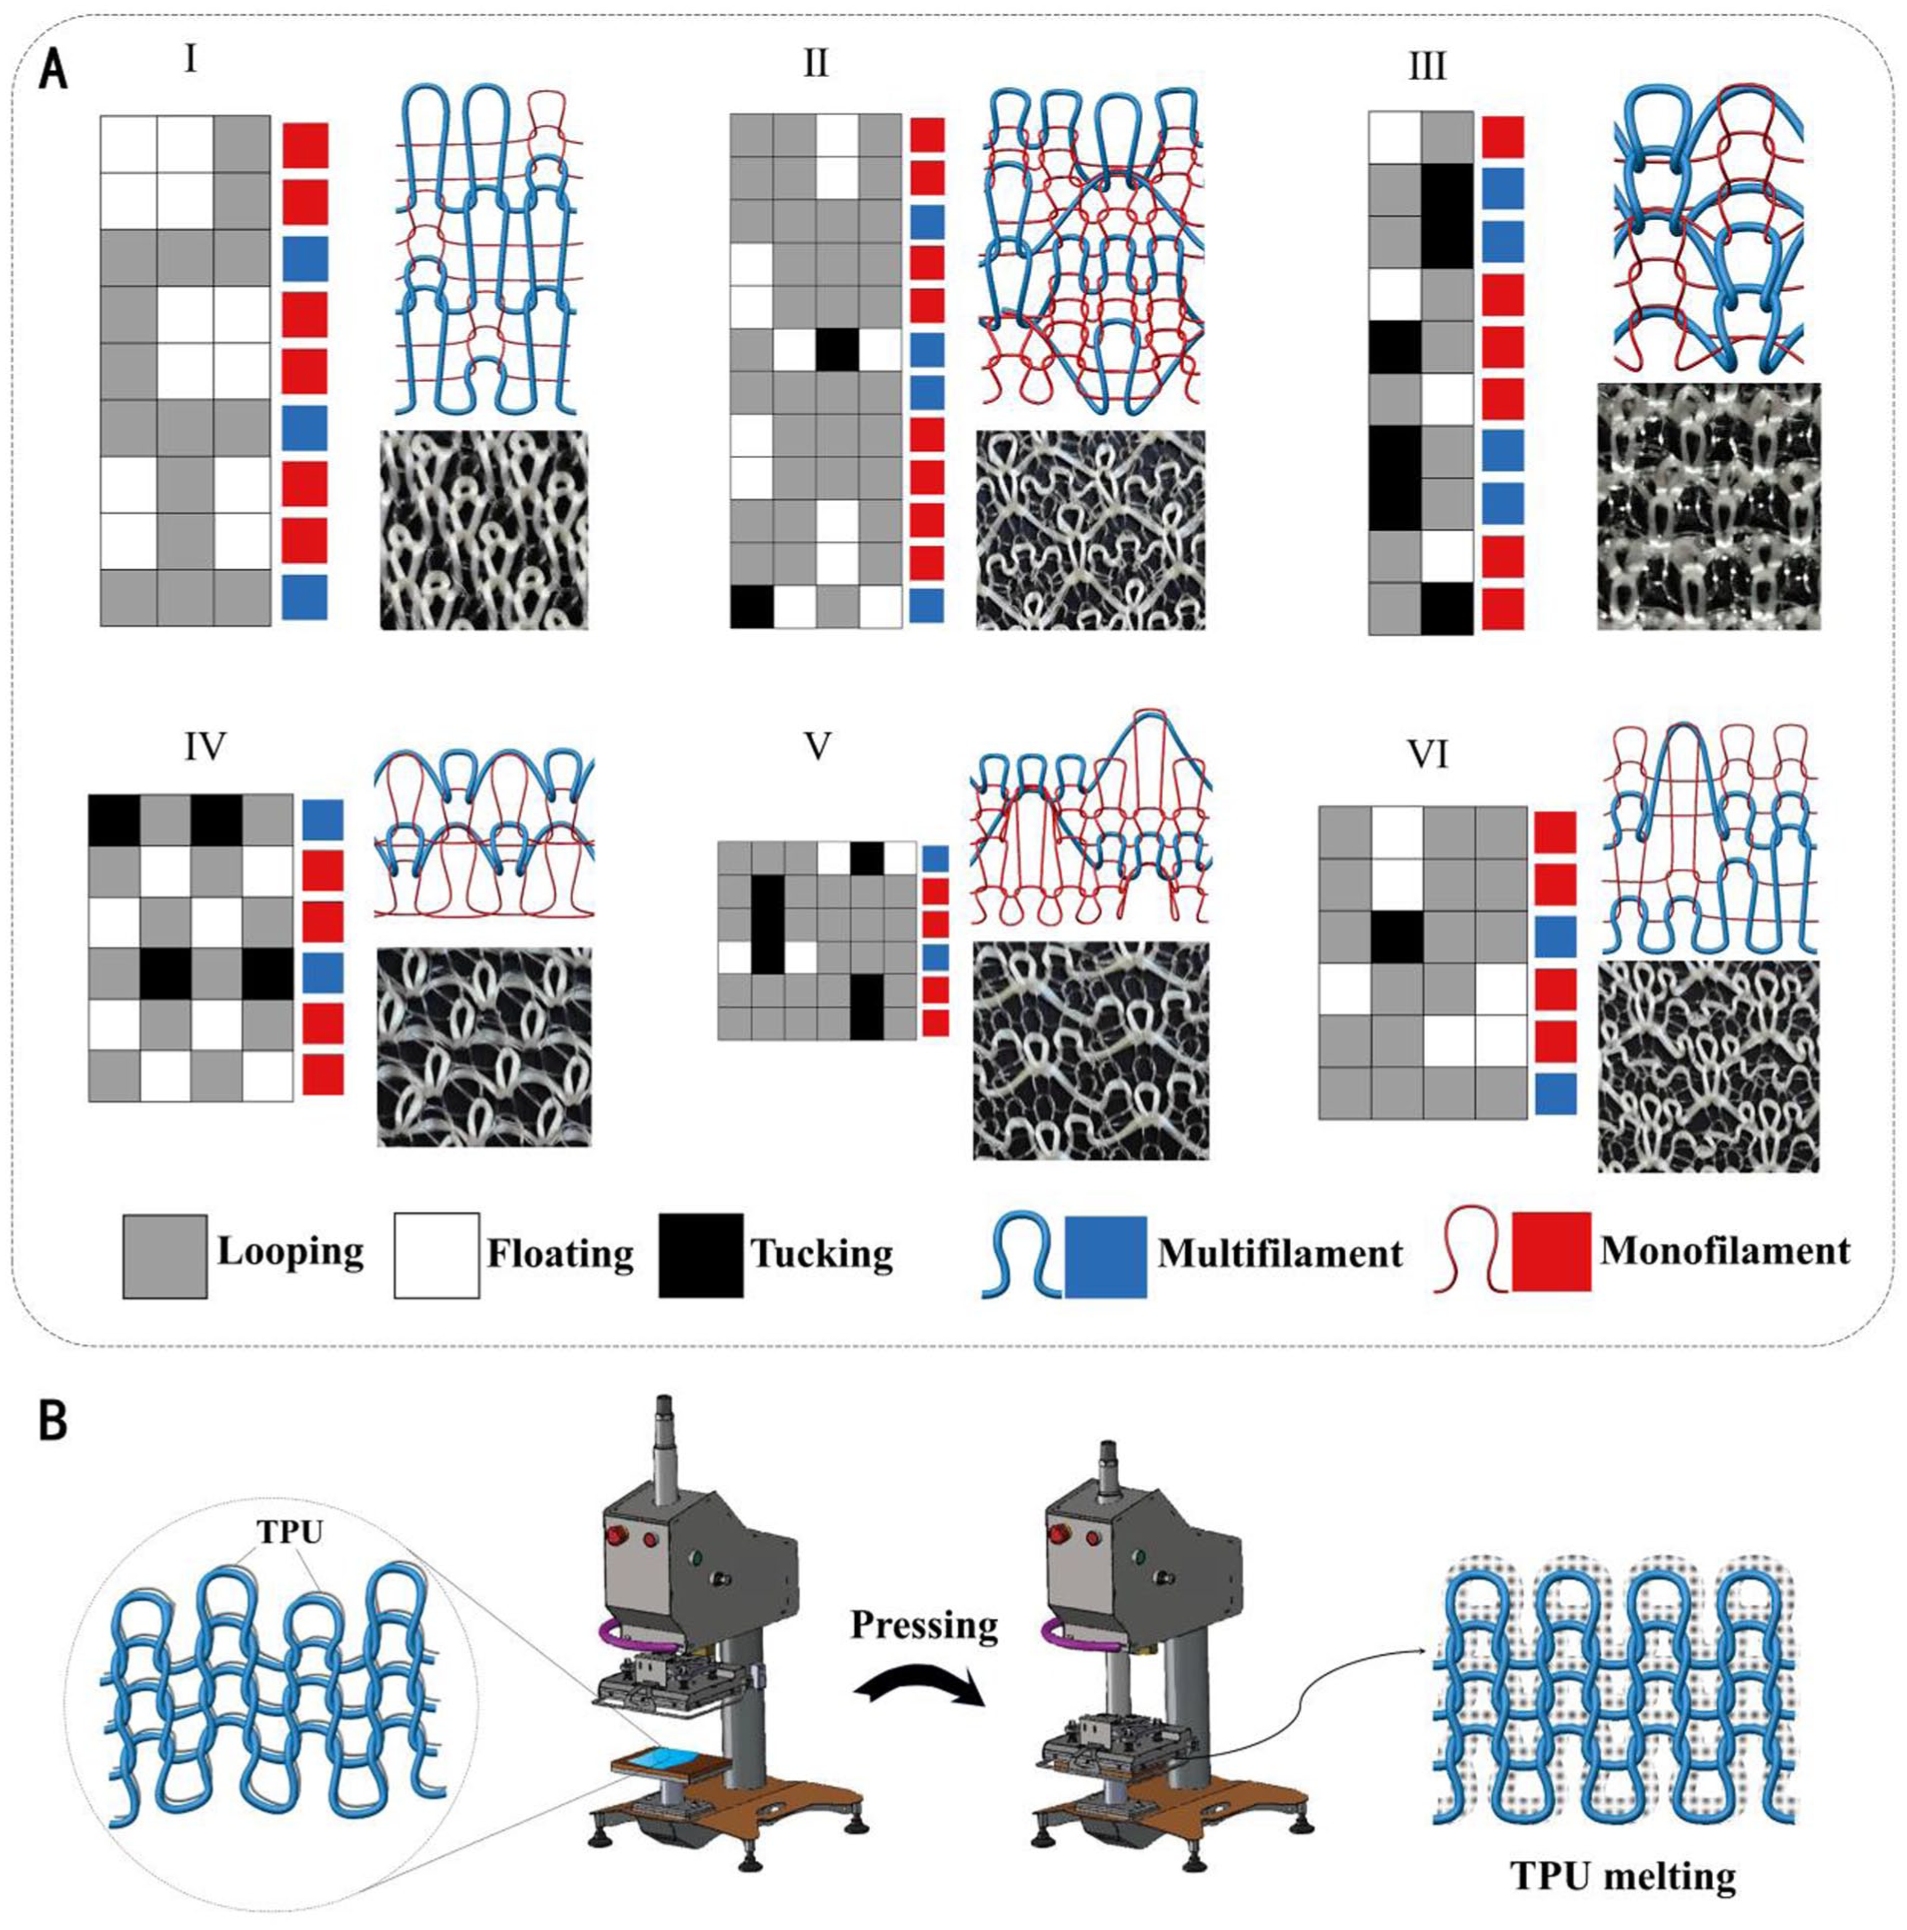
(a) Fabric pattern design drawings, simulation diagrams, and product drawings. (b) Diagram of fabric heat setting.
Structure II is constructed in a diamond-shaped grid of large holes using a loop gathering process, which requires a complete cycle of twelve horizontal rows.
In structure III, the multifilaments are knitted alternately in a “loop formation–loop gathering” manner; the monofilaments are shortened due to extrusion, with the coil height shortened. The structure repeats every 10 horizontal courses, where each course is offset by 1 vertical wale to the right relative to the previous one.
In structure IV, monofilaments are alternately arranged in a one-by-one manner and The multifilament yarn section is formed by alternating knitting and tucking within each single course, with the full structure repeating over a 6-course cycle.
Structure V is based on three transverse horizontal rows of basic units, each unit consisting of one horizontal row of multifilament coils with two horizontal rows of monofilament coils. Subsequent units are sequentially shifted three coil longitudinal horizontal rows to the left, and every two basic units are spliced laterally to form a complete loop structure.
The monofilament part of structure VI presents two structural forms, both of which are composed of two horizontal rows. The two monofilament structures are arranged in alternating horizontal rows and are connected by multifilaments. Adjacent multifilaments are knitted in alternating full knit and once every three knit loops, respectively, and the whole structure is knitted in a cycle of six horizontal rows.
As shown in Figure 2(b), the fabric was cut appropriately and then heat-set using a pneumatic press (4C90, Dongguan Zhengke Printing Equipment Co., Ltd., China). The heat-setting process was carried out at 130°C for 30 s. The TPU hot-melt filament was melted by the heat and played the role of reinforcing and stabilizing the fabric structure.
Experimental methods
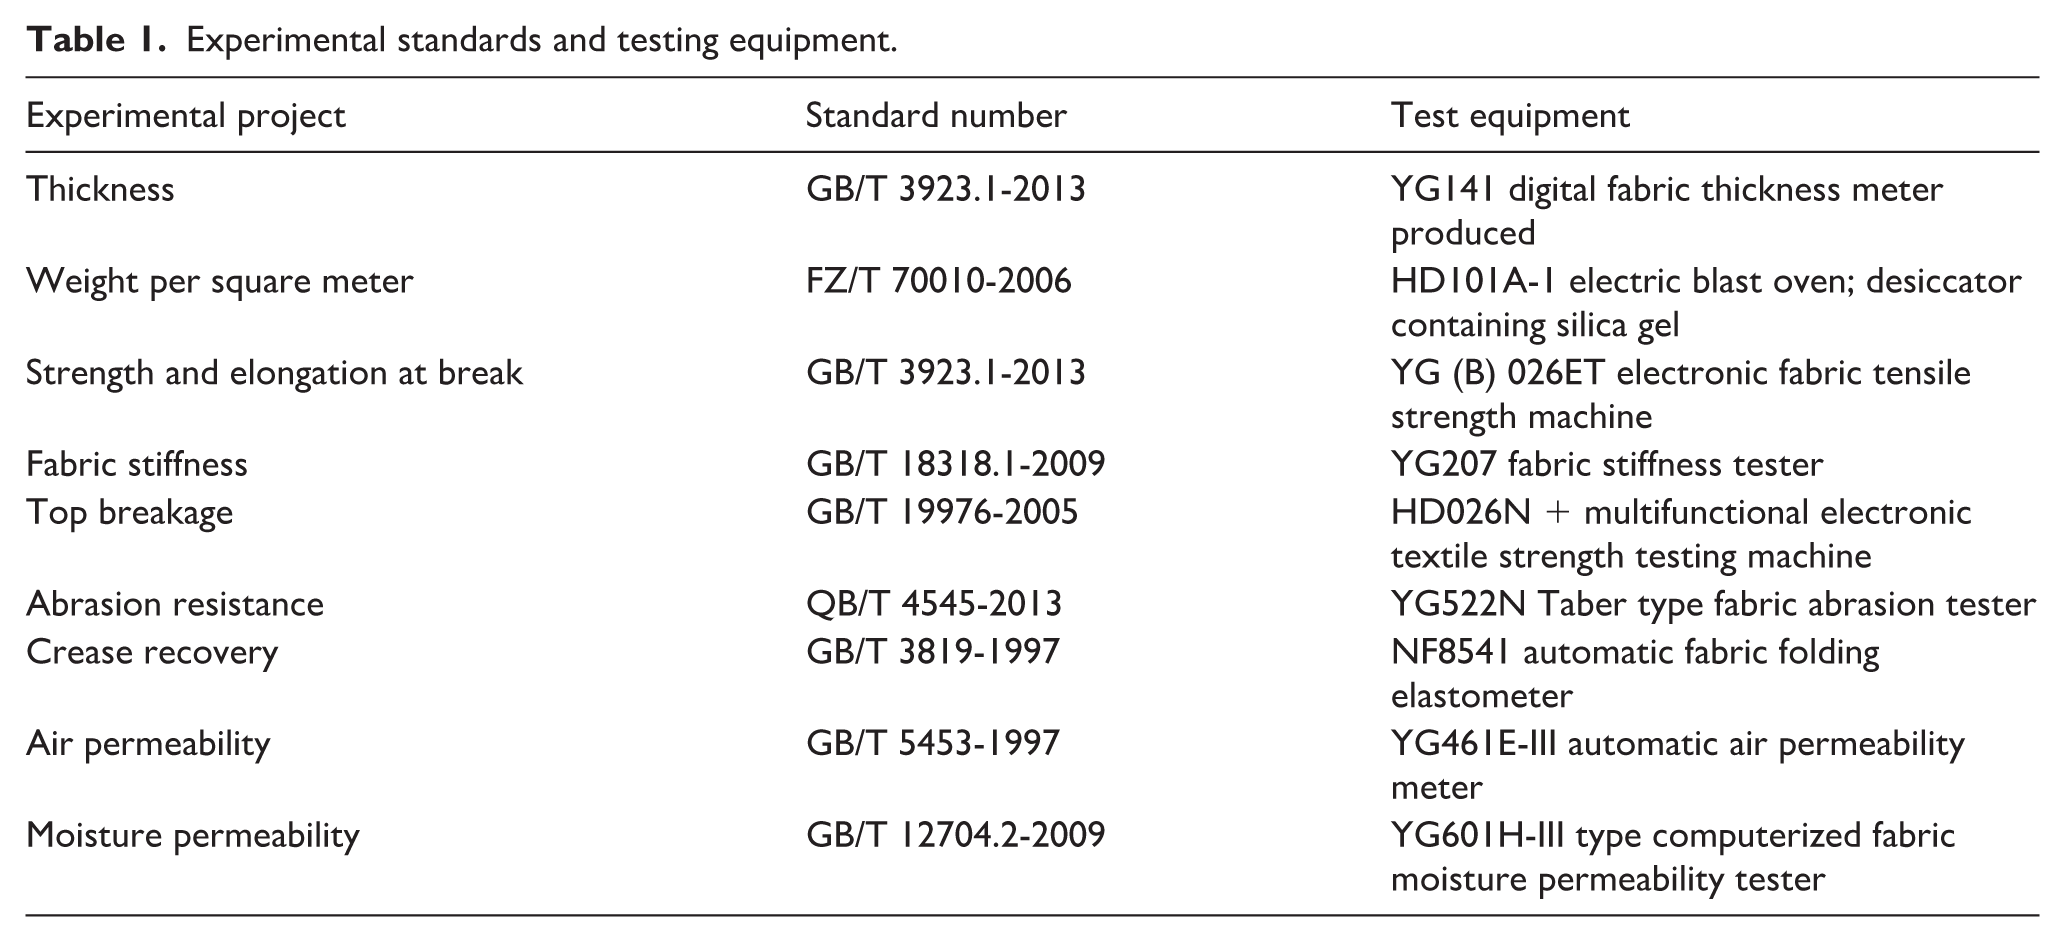
The properties tested in the fabric experiments include thickness, weight per square meter, strength and elongation at break, fabric stiffness, top breakage, abrasion resistance, crease recovery, air permeability, and moisture permeability. The specific test standards and the test equipment used for each test are listed in Table 1.
Experimental standards and testing equipment.
Results and discussion
Knitting of sample fabric
As shown in Figure 3(a), in the front view of the 5 cm × 5 cm fabrics with 18 different structures and yarn combinations, it can be observed that there is a significant difference between the fabrics with different structures. In contrast, the difference between the fabrics of the same structure but with different yarn combinations is relatively small. Owing to the presentation of the filament structure on the front side of the fabric, the front side is more concave and convex. The reverse side is flatter than the front side, which makes it more comfortable when in contact with the feet.
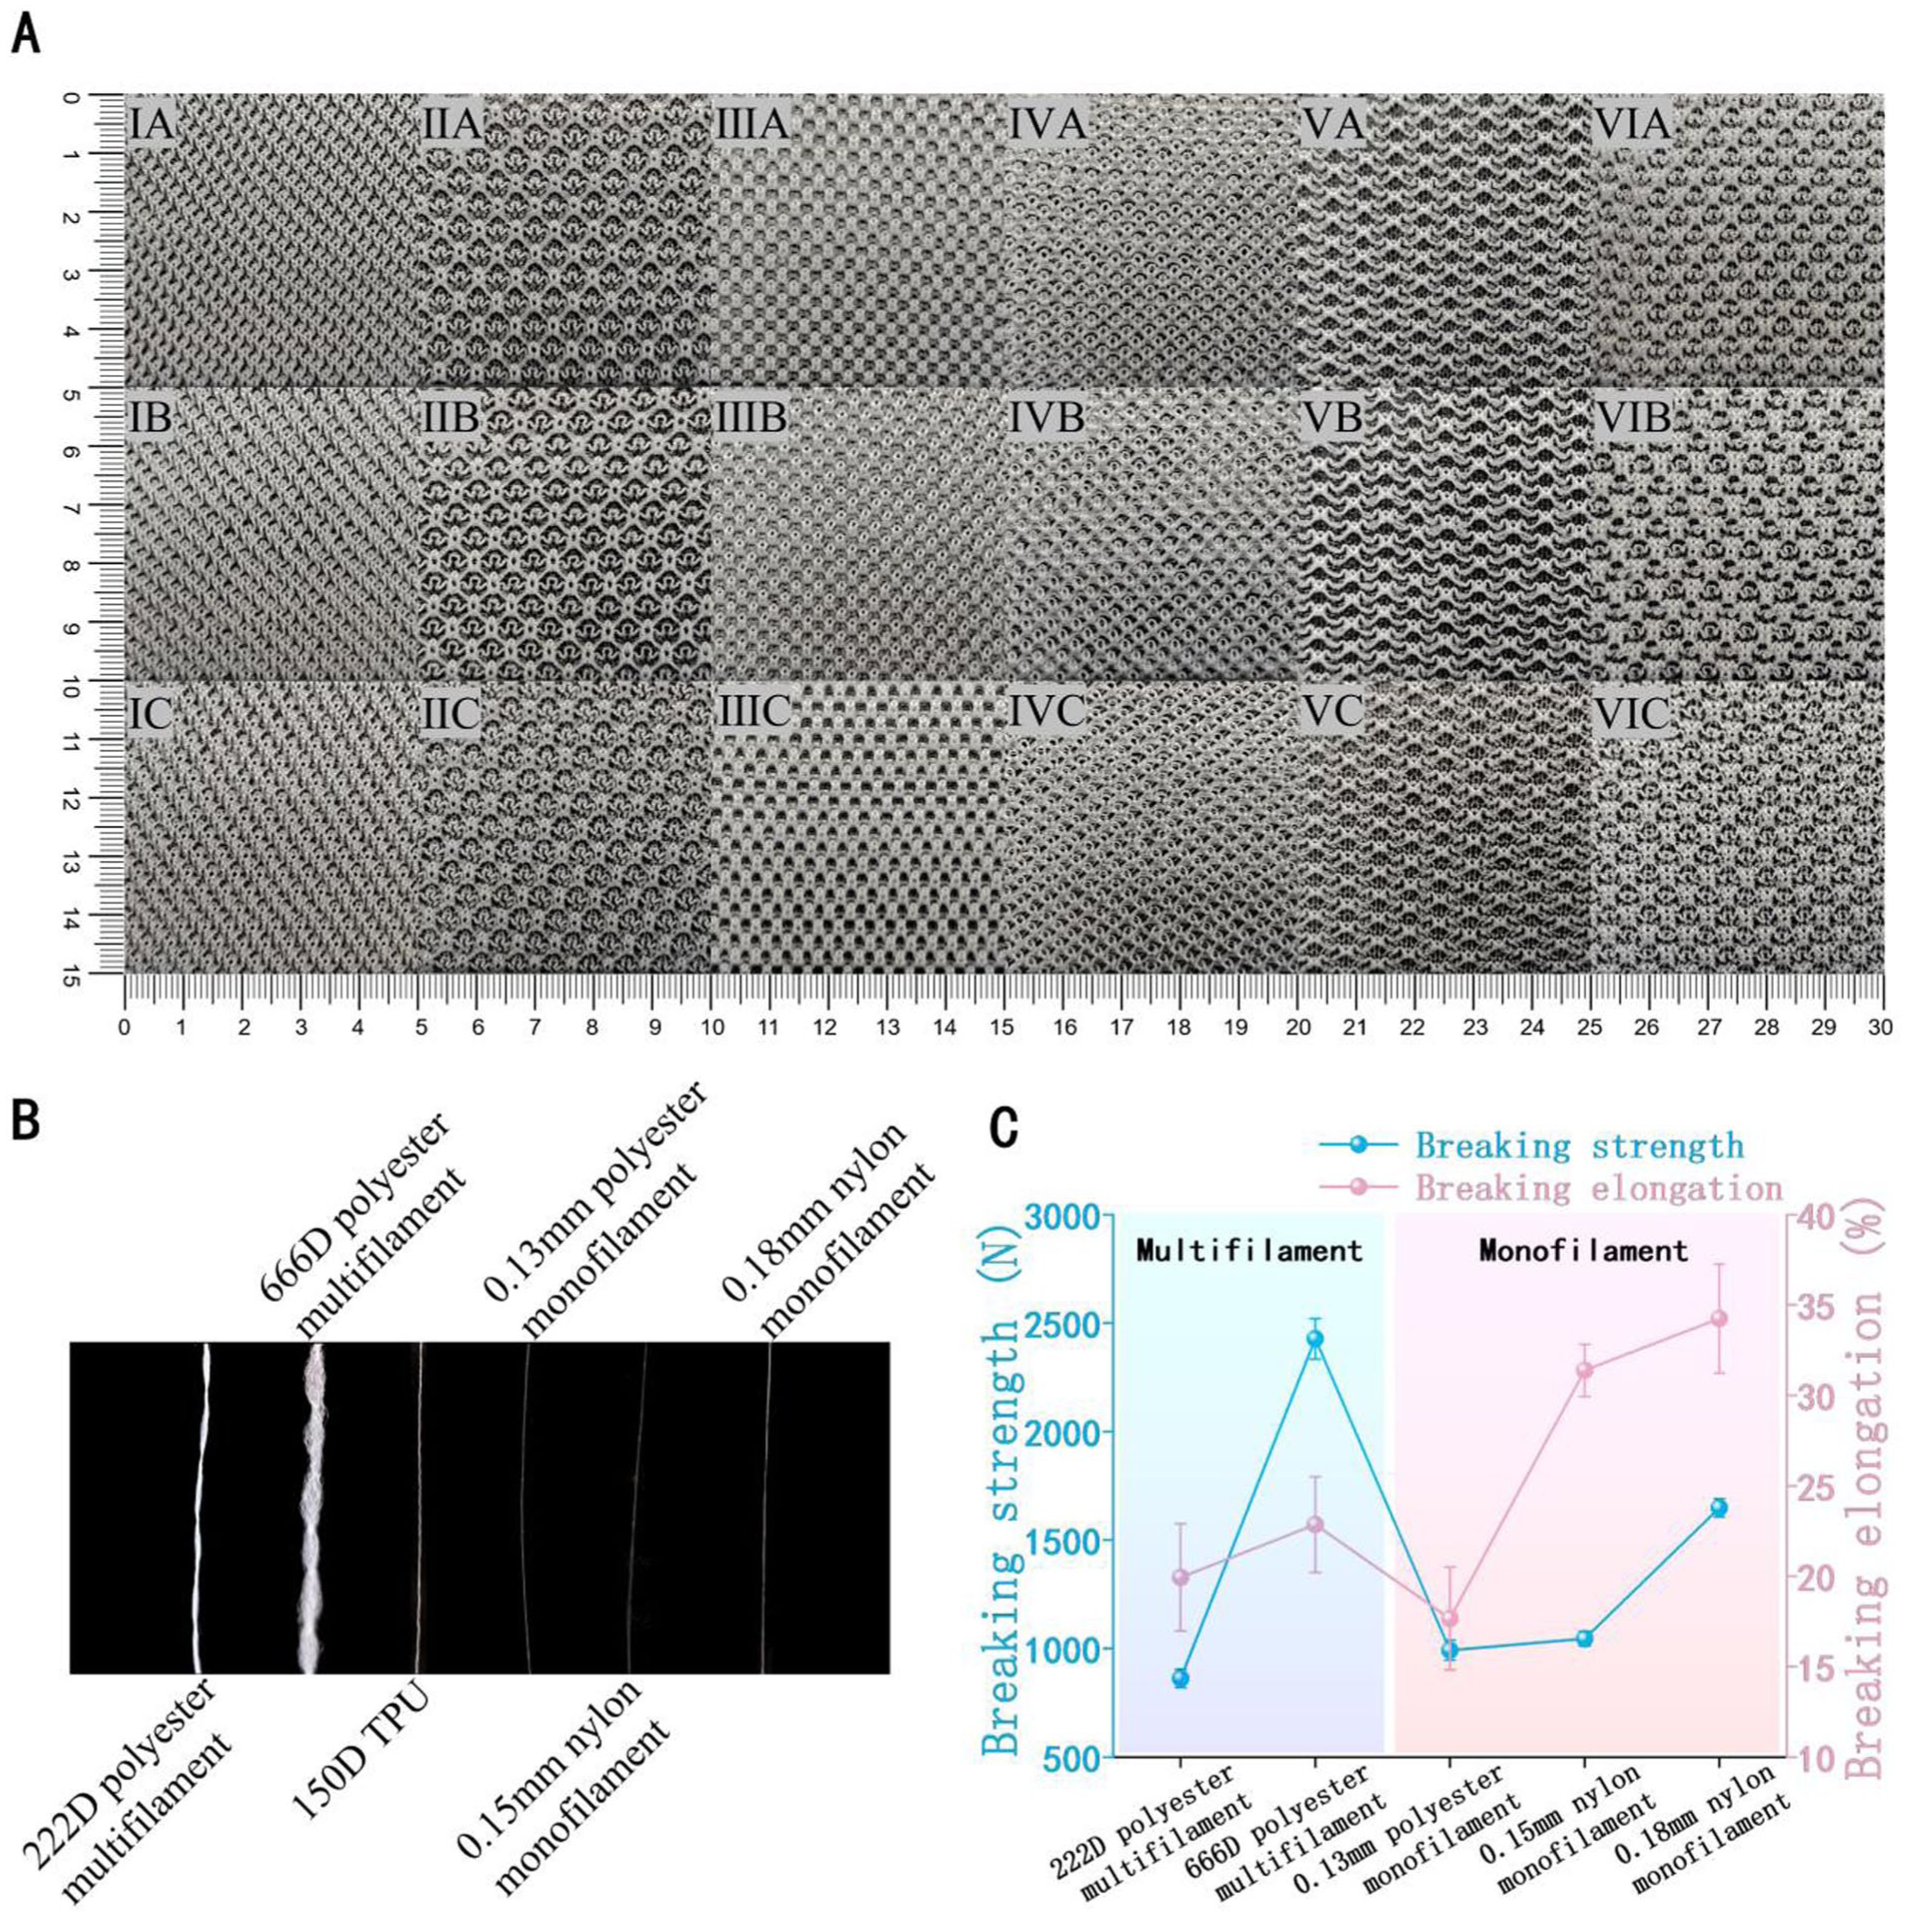
(a) Physical images of 18 fabric samples. (b) Physical picture of the yarn used for the knitting sample. (c) Yarn breaking strength performance and breaking elongation performance.
Figure 3(b) shows a physical image of the yarns used cut to the same length. To the naked eye, the 666D polyester multifilament is the thickest and differs significantly from the other yarns. Figure 3(c) shows the strength and elongation at break properties of the yarns used. Analyzed in terms of the breaking strength dimension, the multifilaments showed significant polarization, with the 666D polyester multifilament having the highest strength, significantly exceeding that of the other yarns, and the 222D polyester multifilament having the lowest strength. The strengths of the three monofilaments were in the middle range, with the 0.18 mm nylon monofilament having the highest strength and the 0.13 mm polyester monofilament being the weakest, and the difference in strength between the latter and the 0.15 mm nylon monofilaments being relatively small. From the breaking elongation dimension, the breaking elongation of the two nylon monofilaments was significantly higher than that of the rest of the yarns, and the elongation of the 0.18 mm nylon monofilament was the largest. The breaking elongation of the 0.13 mm polyester monofilament was the smallest among all the yarns, and the breaking elongation of the two composite filaments was in the intermediate range.
Basic specifications of fabrics
Density
Fabric density is jointly regulated by yarn fineness and fabric structure, serving as a core link connecting yarn characteristics and fabric properties: high density can enhance tensile, bursting, and wear resistance, but it will reduce air and moisture permeability; the opposite is true for low density. The measurement of density in this study aims to establish the correlation between density and subsequent properties, providing a basis for balancing “wear-resistant support and breathable comfort” in the toe area during material selection.
As shown in Figure 4(a), the fabric density was determined by the image binarization method. A 5 cm × 5 cm area of the fabric was selected to obtain an image, which was imported into ImageJ software and then binarized so that the pores appeared black and the yarns appeared white. All the photographs of the samples were processed in a batch, the percentages of the areas of the white yarn area were calculated, and the average of each photograph was taken by sampling from multiple points to provide the yarn density of the samples.
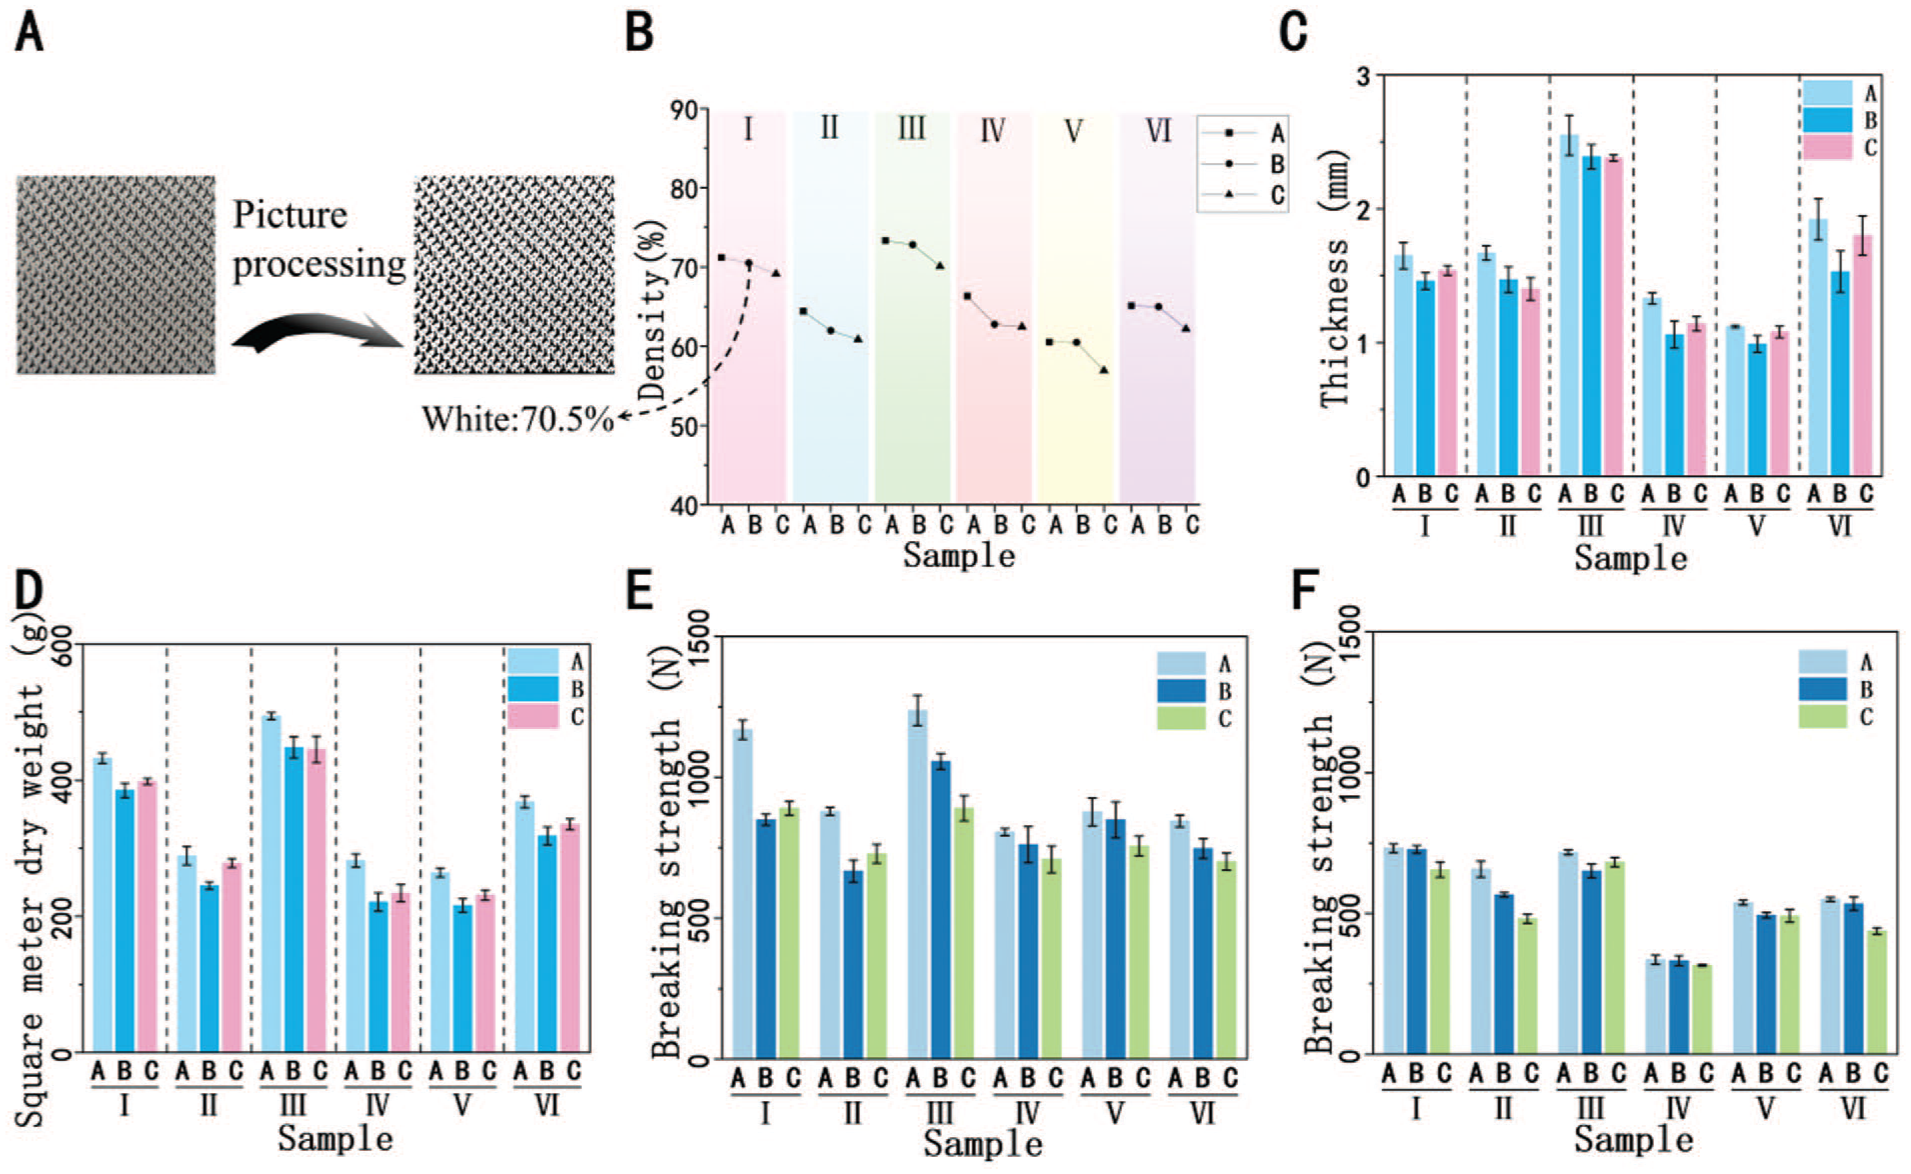
(a) Image processing procedure. (b) The density of the fabric. (c) The thickness of the fabric. (d) The dry weight of the fabric per square meter. (e) The weft-direction tensile strength and breaking force of the fabric. (f) The warp-direction tensile strength and breaking force of the fabric.
As shown in Figure 4(b), the density data in the figure were determined by a binarization method, and the figure presents the fabric density under different combinations of structure groups and yarns, using color blocking combined with a dot line diagram. Regarding the structures, the densities of structures I and III are not much different and are significantly higher than those of the other four groups, with the density of group III being slightly higher, reflecting that the knitting structure is more compact; the densities of structures II, IV, and VI are at the intermediate level; and the densities of group V are significantly lower than those of the other groups, which indicates that the structure has a larger porosity. Within the same structures, the density of yarn combination A is higher than that of combinations B and C (e.g., groups IV, V, and VI). This is because the yarns in combination A have a thicker pattern, which is more conducive to a close arrangement, and combination A has more types of yarns, giving a greater yarn coverage.
Thickness
Fabric thickness is affected by density, yarn fineness, and fabric structure, and is directly related to the functions of the toe area: an appropriate thickness can improve stiffness and wear resistance, while excessive thickness violates the lightweight design and may reduce air permeability. The measurement of thickness in this study aims to analyze its synergistic effect with density and dry weight, and explain the adaptability of different structures to the support and comfort requirements of the toe area.
The bar chart in Figure 4(c) illustrates the variation in fabric thickness resulting from different combinations of structural groups and yarns. Regarding the dimension of structure, the thickness of structure III is significantly higher than that of other groups, which indicates that this structure has the most prominent effect on thickness enhancement, because the monofilaments of this structure are extruded by the multifilaments, which makes the coils protrude and affects the overall thickness. Among the rest of the groups, the thicknesses of groups IV and V are on the low side, and the thicknesses of groups I, II, and VI are intermediate. Analyzed from the dimension of yarn combination, the difference of yarns within the same structure has a milder effect on the thickness, and the difference is not significant. However, the thickness of yarn combination A is higher than that of the remaining two combinations.
Dry weight per square meter
The dry weight per square meter of fabric is a core indicator of “lightweight design,” determined by density, yarn fineness, and thickness, which requires balancing lightweight performance and mechanical properties: excessively low dry weight may lead to insufficient performance, while excessively high dry weight increases foot load. The measurement of dry weight in this study aims to clarify the adaptability of structures and yarns to lightweight design, providing data support for balancing “lightweight” and “durability” in the toe area.
The histograms in Figure 4(d) present the different dry weights per square meter of fabrics with different structure groups and yarn combinations. From the point of view of structure, the weight per square meter of structure III is significantly higher than that of other groups, due to the close nature of the structure and the larger yarn content in the same area of fabric; the weight per square meter of groups I and VI are at the intermediate level; and the weight per square meter of groups II, IV, and V are lower. Under the condition of the same fabric structure, the weight per square meter of yarn combination A is higher than those of B and C. This is because the yarn used in combination A is thicker and its composition is more complex, which makes it easier to form thick fabrics. When the structure is the same, the different yarn combinations within each structural group have little effect on the weight per square meter, and the difference in weight per square meter among the three yarn combinations is slight. However, the weight per square meter of combination A is still consistently higher than that of the remaining two combinations.
Mechanical properties of fabrics
Breaking strength
As shown in Figures 4(e) and 4(f), yarn combination A exhibits the highest breaking strength for the same fabric structure in both warp and weft directions. This performance is achieved because the monofilament part of this combination consists of two monofilaments, which allows the strength of the monofilament section to be increased to match that of the multifilament section, thus significantly improving the overall strength uniformity of the yarn, avoiding local premature fracture caused by excessive strength differences between monofilaments and multifilaments. In contrast, the breaking strength values of yarn combination B and yarn combination C are closer to each other. Further analyses showed that the fabric structure affected the strength to a slightly greater extent than the yarn combination.
In the weft tensile test, the overall strength of the group III structures is significantly higher than that of the other groups, with yarn combination A within group III being significantly stronger than the other two yarn combinations in the same group. This is because the structure of the group III fabrics, which adopts an alternating “looping-tucking” knitting structure for multifilaments and a compressed-shortened structure for monofilaments, is more compact than that of the other groups, with smaller fabric pores, more interlacing points between yarns, stronger bonding between yarns, and an improved ability to disperse tensile stress evenly. It is interesting to note that the strength of IA fabrics is outstanding and significantly higher than that of all other groups, except group III.
When stretched in the warp direction, the difference in strength within each group does not change much, but yarn combination A maintains a higher level of strength than the other two yarn combinations in the same groups. It is worth noting that the strength of the group IV structures is significantly lower compared to that of the other groups, because the multifilaments in the structure of this group are primarily in the collector-loop structure, where the yarn winding degree at the collector-loop positions is low, resulting in a weaker connectivity of the structure as a whole. Other than that, the strength values of the other five groups have slight differences and are at a similar level.
Breaking elongation
The green part of the graph in Figure 5(a) shows the weft breaking elongation of the fabrics, and the blue part shows the warp breaking elongation of the fabrics; the overall weft breaking elongation is significantly higher than that of the warp direction.
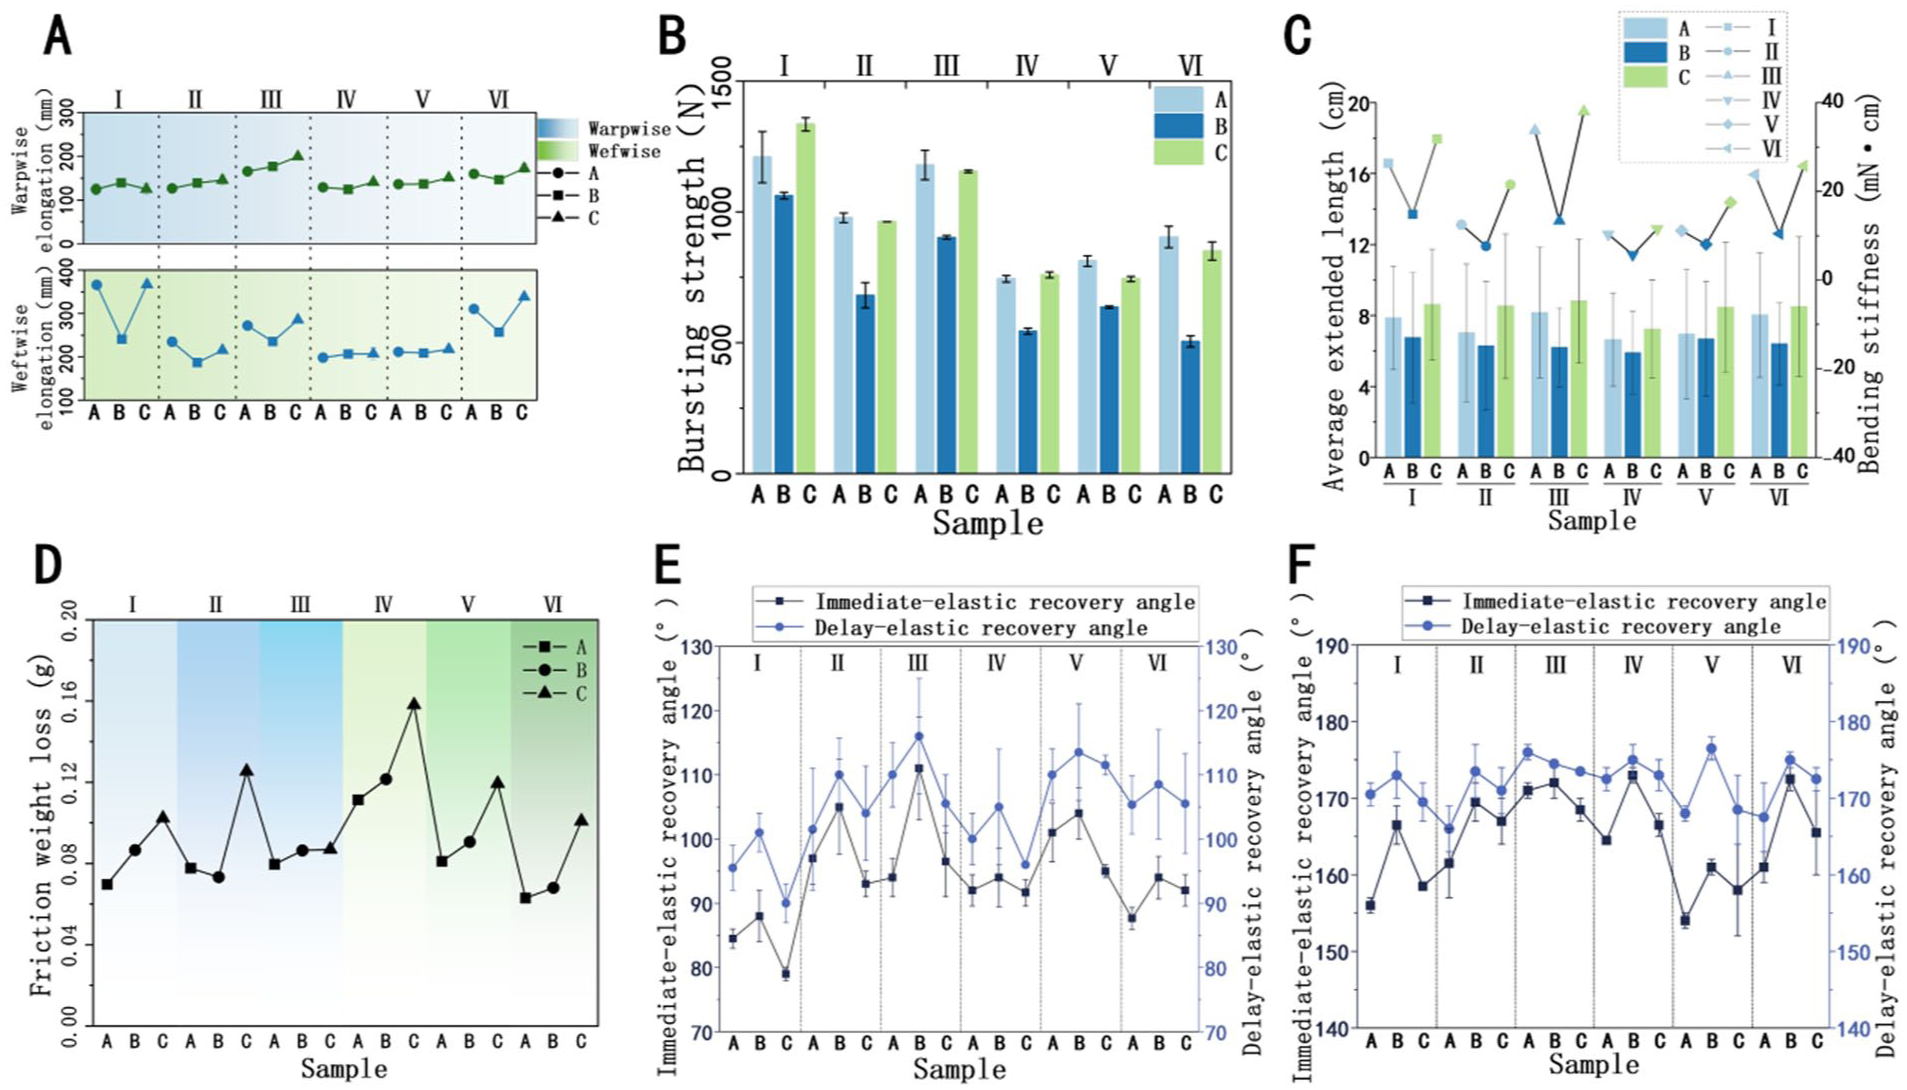
(a) Tensile elongation properties in the warp and weft directions of the fabric. (b) Top breaking performance of the fabric. (c) Average extension length of the fabric and the average extension length of the fabric and the bending stiffness. (d) Frictional weight loss of the fabric. (e) Recovery angle of the weft crease: specimen cut along the warp direction. (f) Recovery angle of the warp crease: specimen cut along the weft direction.
The weft breaking elongation analysis shows that in group IV and group V, the yarn combination has a weak influence, while in the other groups the yarn combination differences are significant. Among these, the group I differences are the most prominent: yarn combination B elongation is significantly lower than that of yarn combinations A and C. Further comparisons show that the weft elongations of the yarn combination B fabrics are generally low, which is attributed to the performance difference between their multifilaments and monofilament, as well as their insufficient interyarn deformation ability. In terms of warp breaking elongation, the difference between the groups is relatively small; only group III has a slightly higher elongation than the other groups, and the effect of different yarn combinations on elongation is most evident in this group.
Top breakage
Figure 5(b) shows the top breaking strength data for the 18 fabrics. Overall, group I and group III have significantly higher top breakage, meeting the durability requirement of toe impact resistance, which is attributed to the high yarn density and tight weave of these two structures. Group I forms small and uniform pores through the interweaving of monofilaments and multifilaments, while group III builds a stable framework through the alternating “looping-tucking” of multifilaments, both of which can effectively disperse local pressure during top breaking and avoid rapid rupture caused by stress concentration. Group IV has the lowest top breakage due to the sparse arrangement of yarns in the structure, and the upper and lower multifilament coils rely on the monofilament connection
Fabric stiffness
The bending stiffness of the warp and weft specimens was calculated according to equation (1) when the fabric was facing upwards on the front and back sides, respectively, and the results were retained to three significant figures:

where G represents bending stiffness, expressed in milli-Newton centimeters; m represents the actual weight of the fabric, expressed in grams per cubic meter; C represents half of the extended length, expressed in centimeters.
As shown in Figure 5(c), under the same fabric structure condition, the average outstretched length and bending stiffness of yarn combination B are significantly lower than those of combinations A and C. The values of these two indices of combinations A and C are closer, but the average outstretched length and bending stiffness of group C are slightly higher than those of group A. This is because both the multifilament and monofilament portions of group C have been added with hot-melt filaments.
From the comparison of the different structures, the overall difference in the average extension lengths of the six structures is relatively small, but in terms of bending stiffness, the overall performance of groups I and III is significantly higher than that of the remaining four groups. This phenomenon is related to the higher weight per square meter of the two structures, and the higher weight per square meter has a direct impact on enhancing the bending stiffness.
It should be noted that in the stiffness test, the front and back sides of the fabrics in the warp and weft directions need to be measured separately and then averaged. Owing to the significant crimping characteristics of single-knitted fabrics, there is a significant difference between the fabric’s outstretched length on the front and back sides, which leads to a substantial increase in the testing error range of this index.
Abrasive resistance
The line graph in Figure 5(d) presents the friction weight loss of fabrics with different combinations of structure groups and yarns; the smaller the loss, the better the abrasion resistance. From the structural dimension, under the condition of the same yarn combination, group III has the lowest friction weight loss and the best abrasion resistance, because the nature of this structure is close, with yarns closely interlaced and loops stable, making the yarns less likely to be hooked or worn and broken by the grinding wheel during friction testing and thus having stronger abrasion resistance. Group IV has the highest loss and the worst abrasion resistance, which originates from its sparse structure and large pores, resulting in a large exposed area of yarns and weak connectivity of the multifilament tucking structure, making the yarns more prone to falling off and being lost during friction testing. Within the same structure, yarn combination C generally has higher fabric weight per square meter loss by friction, which is attributed to the overall thinness and low strength of the yarns used in this combination, making them more prone to breakage and wear under friction; the difference in weight per square meter loss between combinations A and B is not significant, indicating that these two yarn combinations have similar yarn strength and interlacing stability, and thus similar abrasion resistance.
Crease recovery property
As shown in Figures 5(e) and 5(f), in the crease recovery property test, the acute elasticity recovery angle and the slow elasticity recovery angle show significant changes with the different yarn combinations and fabric structures. The overall value of the slow elasticity recovery angle is higher than that of the acute elasticity, which confirms the characteristic of “with the prolongation of time, the fabric crease will complete the morphology of the recovery gradually.” This is because the molecular chains inside the fabric need time to complete the relaxation and reset of elastic deformation after the pressure is released.
Regarding weft crease recovery characteristics (with the specimen cut along the warp direction), when the fabric structure is the same, the acute and slow elasticity recovery angles of yarn combination B are generally better than those of the combinations A and C, showing a better crease recovery ability. The primary reason is that the monofilament group of combination B is composed purely of high-elasticity nylon whose molecular chain has a higher elastic recovery rate than polyester and TPU hot-melt yarns, which reduces the loss of elasticity from the root and provides a better basis for crease recovery. If the yarn combinations are the same, the overall elastic recovery angle of the group III structure is significantly higher than that of the other groups, which can be attributed to its greater thickness and fluffier structure— this physical form can reduce fiber extrusion damage at the crease, and the interfiber force in the fluffy structure is weaker, making it easier to release the elastic recovery potential.
For warp direction crease recovery characteristics (with specimens cut in the weft direction), not only is the overall crease recovery angle of the warp direction test higher than that for the weft direction, but the fluctuations in the data are smaller, which intuitively suggests that it is easier to achieve morphological recovery after bending and deformation of warp-directed fabrics— a phenomenon related to the structural characteristic that multifilaments form more regular loops and are arranged more tightly during warp-wise knitting, as such a regular loop structure is more likely to return to its initial form after deformation. The advantageous trend of yarn combination still holds, and combination B maintains the performance advantage in the warp direction. Meanwhile, the overall elastic recovery performance of the group III structure remains optimal under the same yarn combination, continuing the logic of “fluffy structure gains elasticity.”
Thermal and moisture comfort of fabric
Air permeability
The bar graph in Figure 6(a) presents the air permeability of fabrics with different combinations of yarns and structural groups. Analyzing the structure dimension, the air permeability of groups II and V is significantly higher than that of the other groups, indicating that the pores of these two types of structures are looser and allow greater air movement. Group II has diamond-shaped grid-like pores constructed through multifilament tucking, while group V has continuous diamond-shaped pores formed via monofilament tucking and multifilament floating, and both have large pore sizes and good connectivity, allowing air to penetrate easily. Group I has the lowest overall permeability, reflecting its tightly packed structure, which makes it more difficult for air to pass through. Within the same structures, the effect of yarn combination on permeability shows the same pattern: the air permeability of yarn combination C is significantly higher than that of combinations A and B in each group, while the air permeability of combination A is consistently the lowest among the three combinations. The reason for this is that combination A has a more complex yarn composition, with thick yarn diameters and large coverage areas that easily block some pores. In contrast, the yarn composition of combination C is simpler, and the yarn is finer, making it easier for continuous air permeable channels to form.
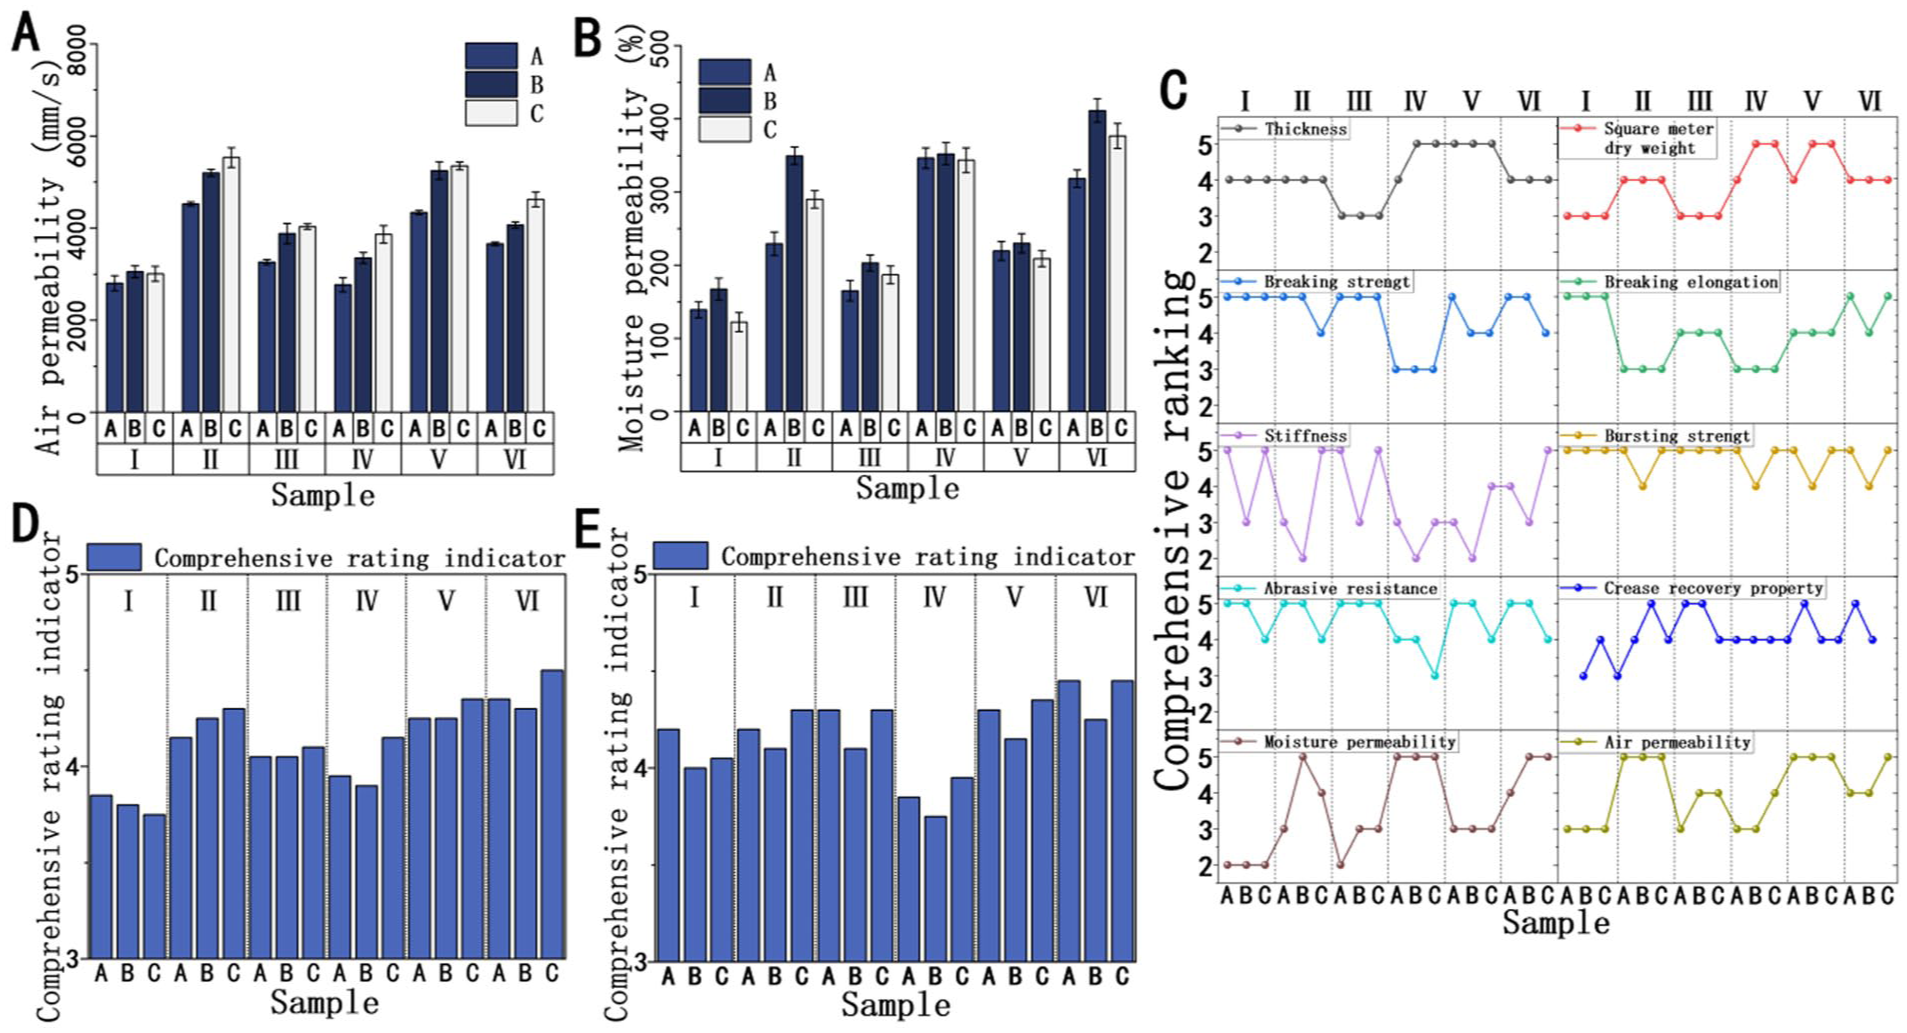
(a) Breathability of the fabric. (b) Moisture permeability of the fabric. (c) Ratings of different indicators of the fabric. (d) Comprehensive evaluation indicators of the fabric in region 1. (e) Comprehensive evaluation indicators of the fabric in region 2.
Moisture permeability
The average moisture permeability was found by using equation (2), and the results are shown in Figure 6(b).

where WVT represents wet vapor transmission rate, expressed in g/(m2·h) or g/(m2·d); ∆m represents mass loss, expressed in grams; m1 represents first weighing, expressed in grams; m2 represents second weighing, expressed in grams; A represents effective sample area, taken as 0.002,83 m2; t represents test time, expressed in hours.
Figure 6(b) presents the moisture permeability of fabrics with different combinations of structural groups and yarns. From the analysis of structure dimension, the overall moisture permeability of groups IV and VI is significantly higher than that of other groups, indicating that the larger pores of these two types of structures are more conducive to water vapor penetration—group IV forms longitudinally connected pores through the alternation of long and short monofilament loops, while group VI forms evenly distributed pores by connecting two types of monofilament floating structures with multifilaments, and both can provide sufficient channels for water vapor diffusion. Group I has the lowest moisture permeability, reflecting that its structure is dense and a substantial impediment to water vapor transmission.
Within the same structure, the yarn combination shows different influences: overall, yarn combination B has a higher moisture permeability than the remaining two combinations, since combination B yarns are finer than those of combination A, and the covering effect of the hot-melt filament is smaller than that of group C, and the pores formed by finer yarns allow water vapor to pass through more easily. In groups III, IV, and V, the difference in moisture permeability among the three yarn combinations is relatively small, which indicates that the pore characteristics of these structures dominate the moisture permeability performance, with the differences in yarn fineness or composition of yarn combinations overshadowed by the influence of structural pores, and the regulating effect of the yarn combination is weakened.
Comprehensive assessment
For the toe fitting fabrics of lightweight sports shoes, the evaluation and comparison of the indicators of the 18 fabrics were rated, and the specific rating rules are as follows.
For performance items with clear rating standards, the rating is performed directly according to the standards.
For the performance items with only a pass line and no specific rating standard, the level corresponding to the pass line will be taken as the benchmark: the data will be rated at level 3 when the pass line reached, the data exceeding the pass line will be upgraded to level 3 and above according to the demand of actual application scenarios, and the ones that have not reached the pass line will be downgraded to below level 3. The ratings will cover the range from 1 to 5, and the higher the rating, the better the performance.
For performance items with neither a qualifying line nor specific rating standard, first, the data of all samples in the same item are processed to calculate the average value, which is set as level 3, and then the performance level of the same type of fabrics and the actual application requirements are combined to estimate the rating, which ranges from 1 to 5, and the higher the rating, the better the performance.
The comprehensive evaluation is based on the comprehensive rating index, which is calculated by the weighted average of the performance indicators’ levels. The specific calculation process, is shown in equation (3).

where F represents the comprehensive rating index; Xi represents the rating of each performance indicator; Yi represents the weight value of each performance indicator.
The toe fabric is divided into region 1 and region 2, as specified in Figure 1(a). The weight allocation of each performance indicator is presented in Table 2, with the minimum weight set at 5%. The core basis for this weight allocation lies in the key demands of lightweight sports shoes and the main concerns of several wearers, while also considering the functional positioning of the toe area, the actual stress and usage requirements in sports scenarios, the core goal of this study (lightweight + functional adaptation), and the structural characteristics of the 18 fabric groups and the rules derived from the performance tests. It was scientifically determined, and the details are as follows.
Weight allocation for different performance levels.
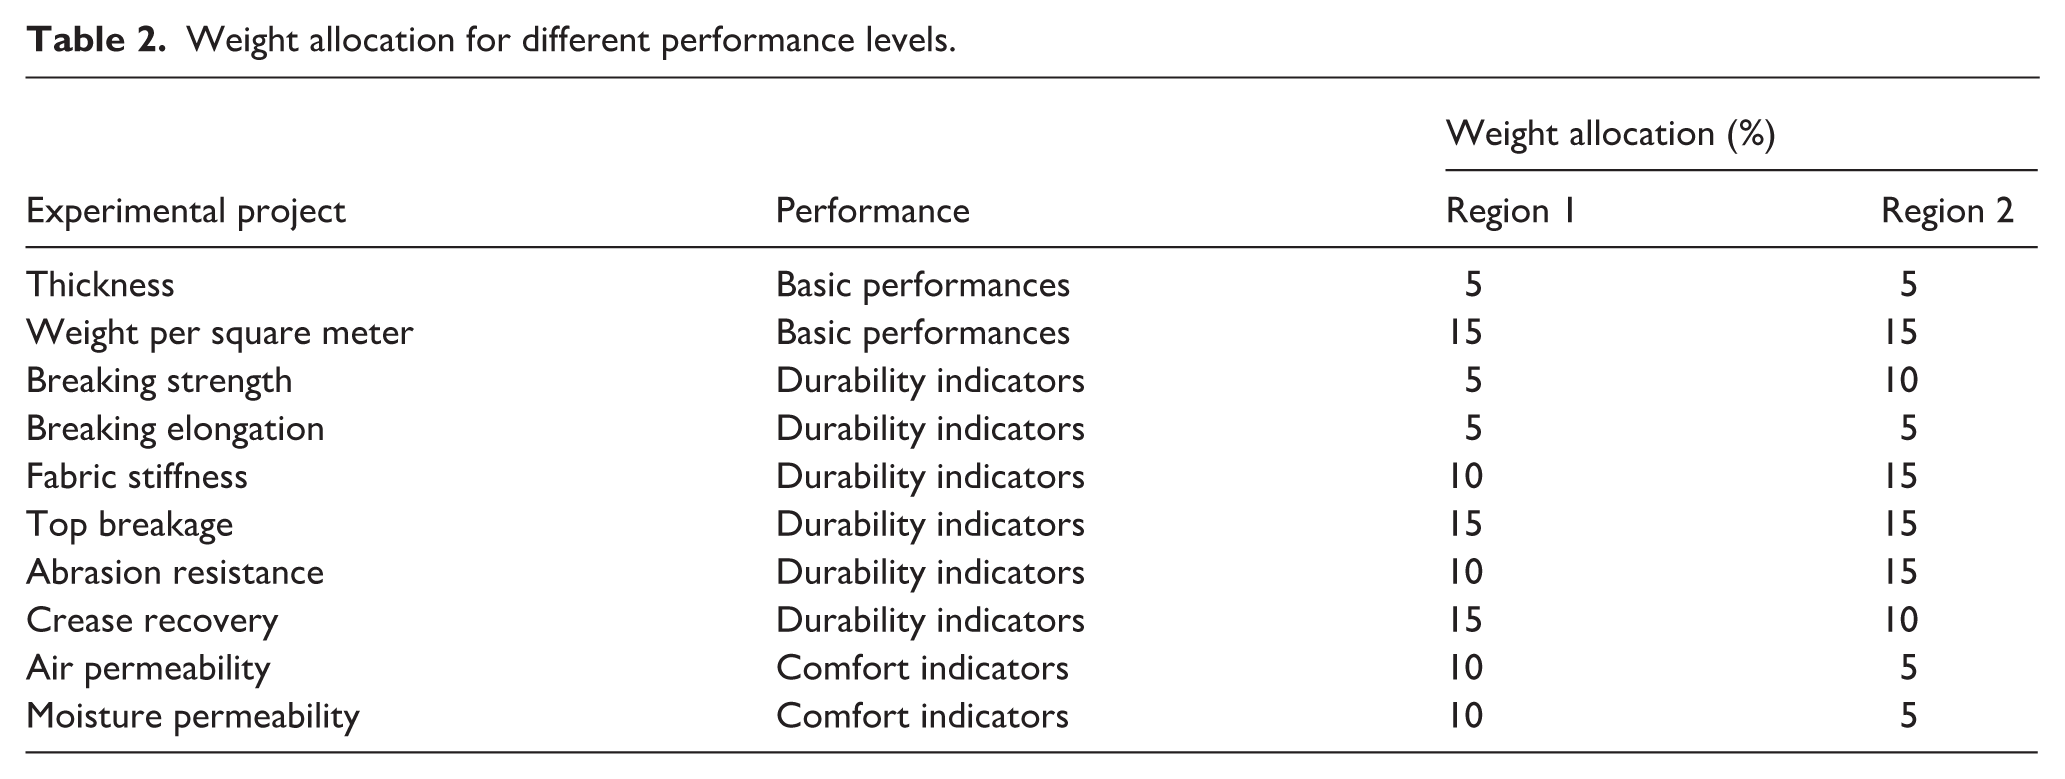
For the thickness indicator: All toe fabrics in this study adopt a single-sided single-layer structure. Experimental tests show that there are limited differences in thickness among different samples. Moreover, the single-layer structure determines that the impact of thickness on the support and comfort of the shoe toe is far weaker than that of fabric structure and yarn combination. Therefore, a minimum weight of 5% is uniformly set for both regions.
For the weight per square meter indicator: This is a direct quantitative indicator characterizing the “lightweight” goal, and its value directly determines whether the shoe toe meets the weight requirement of lightweight sports shoes. This not only responds to the key demand of lightweight sports shoes for “lightweight wearing,” but also aligns with the core concern of several wearers for “no foot pressure and low load” of the shoe body. Therefore, a high weight of 15% is uniformly assigned for both regions.
For the breaking strength indicator: In sports scenarios, the probability of extreme tensile fracture of fabrics in region 1 is low. However, region 2 is close to the front of the toes, where the toe extension range is larger and the demand for tensile resistance is higher. This is consistent with the demand for lightweight sports shoes that suffer “no easy damage after long-term wearing” and the wearers’ concern about “toe deformation resistance of the shoe toe.” Therefore, the weight for region 2 (10%) is higher than that for region 1 (5%).
For the breaking elongation indicator: The breaking elongation of the 18 fabric groups shows relatively small fluctuations overall. Moreover, during sports, the shoe toe is more prone to failure due to bursting and wear rather than excessive elongation, and the probability of extreme elongation scenarios is low, which has low correlation with the core concerns of wearers. Therefore, a uniform weight of 5% is set for both regions.
For the fabric stiffness indicator: Region 2 is in direct contact with the toes, thus requiring higher stiffness to maintain the shape of the shoe toe and avoid toe deformation under pressure. This meets the demand of lightweight sports shoes for “well-shaped shoe toe and toe protection against pressure” and the wearers’ concern about “sufficient toe movement space.” In contrast, region 1 is close to the instep, and excessive stiffness will affect comfort. Therefore, the weight for region 2 (15%) is higher than that for region 1 (10%).
For the top breakage indicator: During sports, the shoe toe continuously endures instantaneous impact from the toes, and bursting failure will directly lead to damage to the shoe toe and loss of protective function. This is a key demand of lightweight sports shoes for “durable toe protection” and also a core concern of wearers for preventing “toes breaking through the shoe toe.” Therefore, a uniform weight of 15% is set for both regions.
For the abrasion resistance indicator: The abrasion resistance test simulates the friction scenario between the shoe upper and hard objects. Region 2 is located at the frontmost end of the shoe toe, with a significantly higher friction frequency with the ground and external objects compared to region 1, resulting in a higher risk of wear failure. This corresponds to the demand of lightweight sports shoes for “wear resistance and no easy fuzzing or damage” and the wearers’ concern about “the durability of the easily worn parts of the shoe toe.” Therefore, the weight for region 2 (15%) is higher than that for region 1 (10%).
For the crease recovery indicator: Region 1 covers the area from the instep to the base of the toes, with a large bending range and high folding frequency; region 2 is the front end of the toes, with a small bending range. Poor crease recovery easily leads to fatigue damage of the fabric and affects its appearance, which relates to wearers’ demands for lightweight sports shoes with “no easy wrinkling after long-term wearing and maintaining appearance” and the wearers’ concern about “the flatness of the shoe toe.” Therefore, the weight for region 1 (15%) is higher than that for region 2 (10%).
For air permeability and moisture permeability indicators: Region 1 is close to the instep, which has a large skin area and dense sweat gland distribution. During sports, the risk of heat and moisture accumulation is high, and the demand for comfort performance is more urgent. This responds to the demand of lightweight sports shoes with “breathability without stuffiness” and the core concern of wearers for “dry feet during sports.” In contrast, region 2 is at the front end of the toes, with a low risk of heat and moisture accumulation. Therefore, the weights for region 1 (10% for both indicators) are higher than for region 2 (5% for both indicators).
The weight allocation based on the above not only closely aligns with the key demands of lightweight sports shoes and the core concerns of several wearers, but also reflects the differentiated performance requirements of different regions of the shoe toe. At the same time, it conforms to the core goals of this study and experimental rules, providing quantitative support that is in line with actual application scenarios for the comprehensive evaluation of the 18 fabric groups.
Figure 6(c) illustrates the ranking of fabrics for the 10 indices across different structure groups and yarn combinations. From the analysis of the index dimensions, the thickness rankings are mostly stable at 3–4, which is in line with the characteristic of slight differences in the thickness of single-layer fabrics. The dry weight per square meter reaches 5 in samples of groups II and IV. The fluctuation of the breaking strength and elongation rankings is significant, which shows that the actual probability of breakage is low, but the intrinsic qualities are different. The fluctuation of the stiffness rankings is extreme, which indicates that different structural and yarn combinations have a significant effect on the stiffness control. Most of the abrasion resistance rankings are at 4–5, with a few dropping to 3, which reveals the differentiation of performance under high-frequency friction scenarios. Most of the crease recovery rankings are at 4–5, with a few being at 3, which indicates that the overall fabrics are excellent at recovering from creases. The air permeability rankings are relatively stable, while the fluctuations in moisture permeability are more drastic, which indicates that the structures of the yarns more easily regulate moisture permeability in the humid-heat comfort system.
On the whole, for the performance differences between the structural groups and the yarn combinations, the ranking differentiation of high weight indices (e.g., weight per square meter, top breakage) directly affects the comprehensive evaluation, while the low weight indices (thickness, breaking elongation) fluctuates but has limited influence. The overall performance of the toe fabrics is excellent, but the ocal performance weakness still needs to be optimized, and the differentiation of comfort-related performance provides direction for designing suitable fabrics.
Figures 6(d) and 6(e) show the final composite ratings of the 18 fabrics for the two regions of the toe. On the whole, most of the samples fall within the range of 3.5 to 4.5, indicating that the performance of the toe fabrics meets the standard, but there are differences. In the middle, the performance of the samples of structural group VI is particularly outstanding, with good performance in both regions, and its core indices (lightweight, impact resistance, comfort) reached levels 4–5, indicating excellent performance and strongly meeting the functional requirements of the toes. Within the same structure, the difference in yarn combinations triggers the rating differentiation, reflecting the role of yarn composition in regulating the comprehensive performance for a specific structure; the lower-rated samples are dragged down by the key indices.
In conclusion, optimizing the structural design and yarn combination is central to improving the comprehensive performance of toe fabrics. To provide a concrete reference direction for selecting toe fabrics for lightweight sports shoes, the priorities for region 1 should be fabrics IVC, IIC, and VC, and the focus for region 2 should be fabrics VIA, VIC, and VC.
Conclusion
To advance the research and development of the toe for flat-knitted fully formed lightweight sports shoes, this study adopted 3D knitting technology and divided the shoe toe into region 1 and region 2. With “lightweight + functional adaptation” as the core goal, six types of single-sided fabric structures (I–VI) and three types of yarn combinations (A–C) were designed, and 18 fabric samples were prepared. Key conclusions were drawn through multidimensional performance testing and comprehensive rating. In terms of mechanical properties, structure III performed best in tensile strength, bursting strength, and wear resistance due to its tight weaving, while structure IV had the weakest mechanical properties because its yarns were sparsely arranged and relied on monofilaments for connection. In terms of thermal and moisture comfort, structures II and V had the best air permeability and structures IV and VI had the best moisture permeability. Yarn combination C was more conducive to forming continuous air-permeable channels due to its finer yarns and simple composition, resulting in better air permeability than combinations A and B, and yarn combination B had better moisture permeability because its yarns were finer and the covering effect of hot-melt yarns was weak. In terms of crease recovery performance, yarn combination B generally had better immediate and delayed elastic recovery angles, and structure III had stronger elastic recovery potential due to its greater thickness and fluffy structure. Based on the weighted comprehensive rating of “basic performance–durability–comfort,” it was determined that fabrics IVC, IIC, and VC should be prioritized for region 1 (requiring high comfort and crease resistance), while fabrics VIA, VIC, and VC should be the focus for region 2 (requiring high wear resistance and support). Meanwhile, this study breaks through the limitations of the “shaping-stitching” process of traditional 2D shoe uppers and provides a direct basis for the structural design and material selection of flat-knitted fully formed lightweight shoe toes.
Footnotes
Funding
The authors received no financial support for the research, authorship, and/or publication of this article.
Declaration of conflicting interests
The authors declared no potential conflicts of interest with respect to the research, authorship, and/or publication of this article.
Data availability
No data were used for the research described in the article.
