
Abstract
Compression garments exert an inward displacement perpendicular to the body surface on the human body, which is an important indicator for evaluating the pressure comfort and for optimizing the design of clothing structures. Delving into the relationship between clothing pressure and body surface displacement is of certain reference significance for the optimized design of functional pressure clothing. This paper takes the waist protector as the research object, in view of the unreasonable pressure distribution phenomenon existing in most current waist protector products, such as discomfort caused by excessive pressure or easy slipping due to insufficient pressure, and weakened protective function. Based on computed tomography (CT) scans of the waist, we constructed a three-dimensional model of the human waist. Considering that the pressure and displacement generated by a waist protector on the human body will vary with the wearing time, this study divides the wearing process of waist protector into four time periods (0, 1, 2, and 3 h). Using the Abaqus finite-element software, the cross-sectional deformation of the waist during the wearing of the waist protector by the human body was simulated, and the pressure and displacement distribution and changing trend of the waist during the wearing process of the waist protector were obtained. In order to further study the compression deformation of the human waist caused by the waist protector, this study divided the cross-section of the human waist into regions, and calculated the volume reduction of each region based on the finite-element simulation results. By analyzing the influence of the design of the waist protector structure, pressure distribution, and body surface displacement changes on the wearing comfort of the human body, this study provides a theoretical basis for the optimization of the design of waist protector products.
This is a visual representation of the abstract.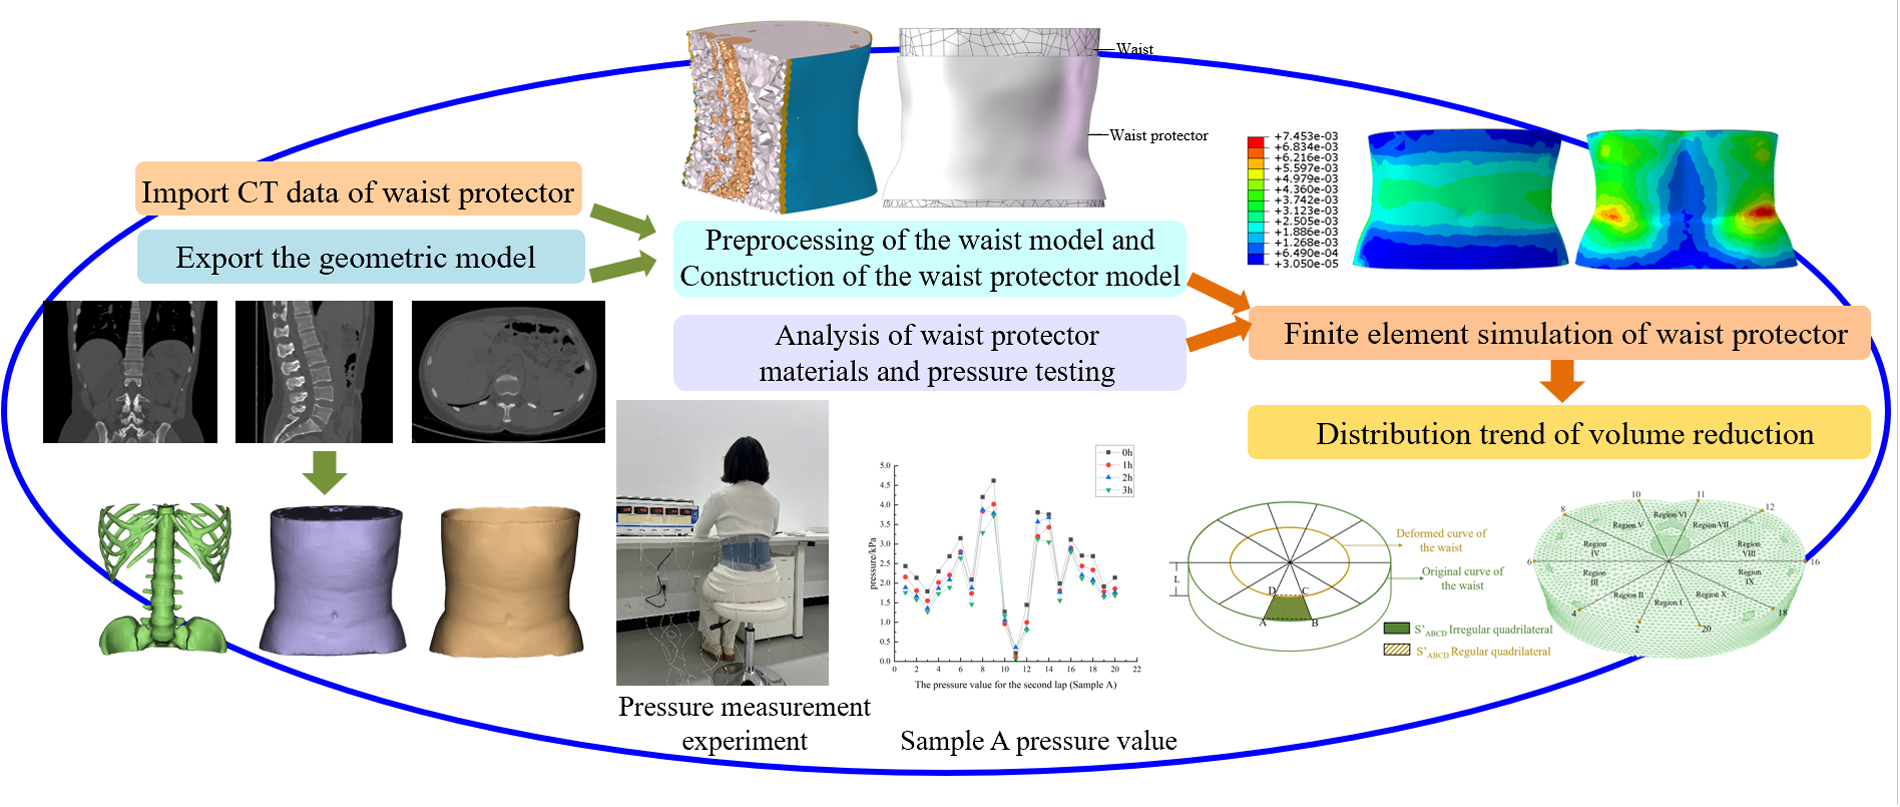
Keywords
In recent years, compression garments that reduce muscle load through pressure and provide protection to specific parts of the body have been widely used in various fields. 1 When the human body is in a state of movement, functional compression garments can apply pressure to specific muscles to promote blood circulation, thereby enhancing the athletic performance of the athletes. 2 In daily life, compression garments can also exert pressure on vulnerable parts of the body, thereby providing prevention, treatment, and support.3,4 The waist is an important part of the human body: if not properly protected during daily activities, serious injuries may result. The data in the literature show that by 2050, the number of people worldwide suffering from low back pain will reach 800 million. 5 Low back pain is closely related to biological functions, psychological factors, and social factors. 6 Waist protectors, as one of the most widely used functional pressure garments, play a significant role in alleviating muscle fatigue in the waist, maintaining the stability of the waist spine, reducing pain, and enhancing the human body’s movement capabilities.
The fit of the clothing and the pressure comfort are important factors influencing the comfort of the garment, 7 when a person wears pressure garments, the pressure generated by the contact between the garments and the body surface causes the skin to deform, and at the same time exerts pressure on the deep tissues of the body. 8 Wearing the waist protector properly can enhance the stability of the spine by increasing the intra-abdominal pressure and reducing the load on the trunk muscle.9-11 Sullivan and Mayhew conducted an experimental study on 30 men and 30 women. The results showed that an increase in intra-abdominal pressure could effectively reduce the compressive force on the spine, help the back muscles generate stretching torque, and thereby protect the spine from injury. 12
In recent years, the finite-element analysis method has been widely applied in the study of pressure distribution in various functional clothing items due to its significant advantages in simulating complex contact mechanics relationships.13-17 This method enables researchers to analyze the transmission path of pressure within soft tissues more intuitively by establishing a detailed finite-element model of the human body. However, in the development of functional waist protectors, the existing research mostly adopts methods such as direct measurement, implantation of intelligent sensors, or subjective evaluation. The research on the pressure distribution between the deep muscles and bones of the waist was relatively scarce.18-20 Furthermore, Dan et al. 21 used the finite-element method to divide the process of wearing elastic legwear for the human body into six stages: 0, 1, 2, 4, 8, and 12 h. They analyzed the functional relationship between pressure and displacement during this process. The research results showed that as the wearing time increased, the pressure displacement values at each point on the waist all showed a decreasing trend. After 8 h of wearing, the displacement values at each point on the cross-section of the waist basically reached equilibrium.
When the human body wears a waist protector, the inward displacement of the pressure exerted by the waist protector on the body, which is perpendicular to the body surface, is an important indicator affecting the comfort of the pressure and for optimizing the design of the clothing structure. At the same time, the pressure and displacement exerted by the waist protector on the human body will change with the different wearing durations. Therefore, in-depth exploration of the relationship between the pressure, displacement of the waist protector, and wearing time has certain reference significance for improving the protective performance of the waist protector and enhancing the comfort of human clothing wearing.
In our previous study, the research on the pressure distribution of the waist protector was limited to static moments, 22 ignoring the changes in pressure that occur to the waist protector due to physiological changes in the human body and material relaxation during prolonged wear. In real life, wearing a waist protector for a long time may affect the normal function of the waist muscles. To more accurately and realistically simulate the actual wearing scenario, this study maintains consistency with the duration settings of waist protector in existing studies. The wearing process of the waist protector is divided into four time periods: 0, 1, 2, and 3 h. 23 Based on computed tomography (CT) scans of the waist, a three-dimensional model of the human waist was constructed. Using the Abaqus software, the pressure and displacement distribution maps of the human waist during four time periods were obtained. The trend of pressure and displacement changes when wearing a waist protector was analyzed. Through formulas, the volume reduction of the human waist due to pressure during wearing the waist protector was further calculated. This provides data support for the improvement of the protective performance of the waist protector and the evaluation of pressure comfort. This method provides theoretical references for the functional improvement of the waist protector, the enhancement of wearing comfort, and the optimization design of the waist protector. This method is also applicable to other types of compression garments.
Materials and methods
Establishment of the three-dimensional model of “waist protector–human waist”
Construction of the finite-element model of the human waist
Due to the complex surface shape and internal structure of the human body, there are certain difficulties in modeling the human body, which also increases the complexity of studying the mechanical contact state between the human body and clothing. With the popularization of CT scanning technology and the development of Mimics medical processing software, a model foundation has been provided for the establishment of precise human models and finite-element simulations. Based on this, this study used CT scanning to collect cross-sectional images of the human waist. The specific experimental parameters were as follows.
During the experiment, CT scans were performed on the subject’s waist with a scan layer thickness of 1 mm, a spacing of 1 mm, and a resolution of 512 × 512. A total of 318 cross-sectional images of the human waist were obtained, as shown in Figure 1.
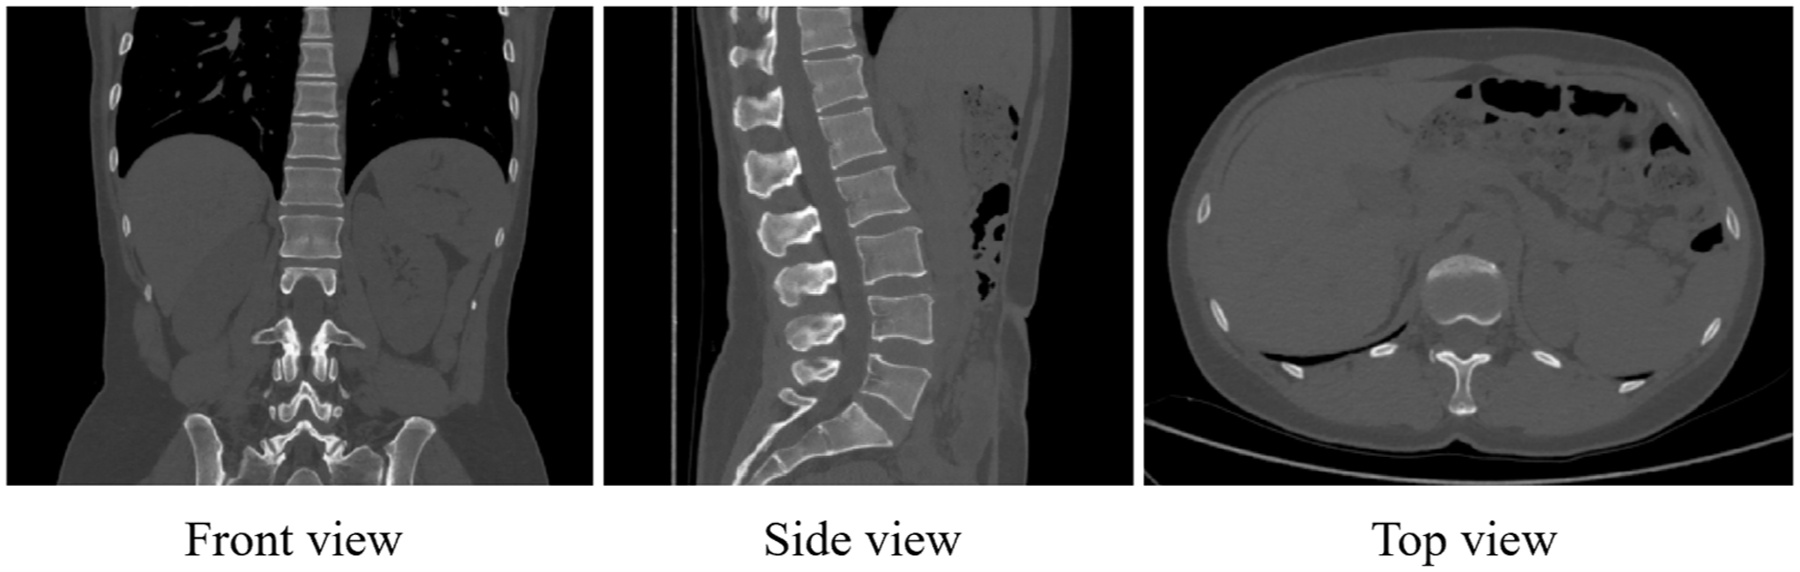
CT image of the human waist.
The bones in the waist and abdomen area of the human body are divided into cortical bone, cancellous bone, bone marrow, etc.; the waist vertebrae include intervertebral discs, ligaments, and other tissues; the soft tissues include organs and blood vessels in the waist and abdomen area of the human body; the skin is roughly divided into the epidermis layer, dermis layer, and subcutaneous tissue. Since the pressure exerted by a waist protector on the human body is relatively small, the pressure on the internal tissues and bones is limited. To improve the calculation speed of the finite-element model, this study divided the human waist into three parts: bones, soft tissues, and skin. Based on the different gray values of different parts of the human body, threshold segmentation, mask editing, and entity calculation steps were performed on the CT images of the waist, and three-dimensional models of the waist bones, soft tissues, and skin were established, as shown in Figure 2.
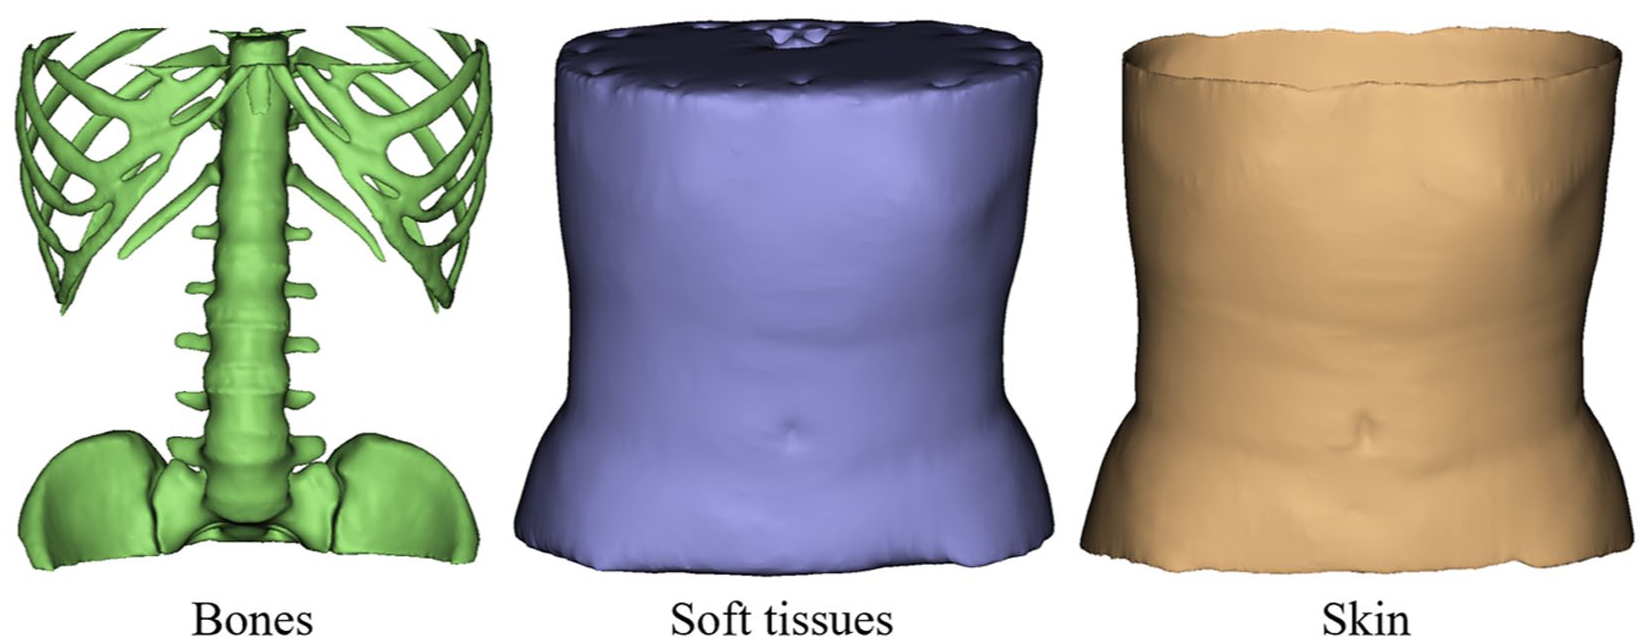
Three-dimensional model of the human waist.
Construction of the finite-element model of the waist protector
When a person wears a waist protector and is in a stationary position, the waist protector adheres to the surface of the person’s waist, and the curve of the adhered area is consistent with the shape of the person’s waist. At the same time, due to the significant differences in the structural form, width, and local functional construction of the waist protector, as well as the presence of fasteners, support strips, and noncontinuous contact areas in the actual structure, it is difficult to accurately reproduce the true structure during the modeling process. Therefore, under the premise of ensuring reasonable mechanical analysis, this study simplified the design of the waist protector. Based on the maximum size of the waist protector selected in this experiment, a waist protector model matching the human shape was constructed in SolidWorks to ensure the best form of the waist protector’s adhesion to the human body during wearing, and the establishment of the model’s waist protector is shown in Figure 3.
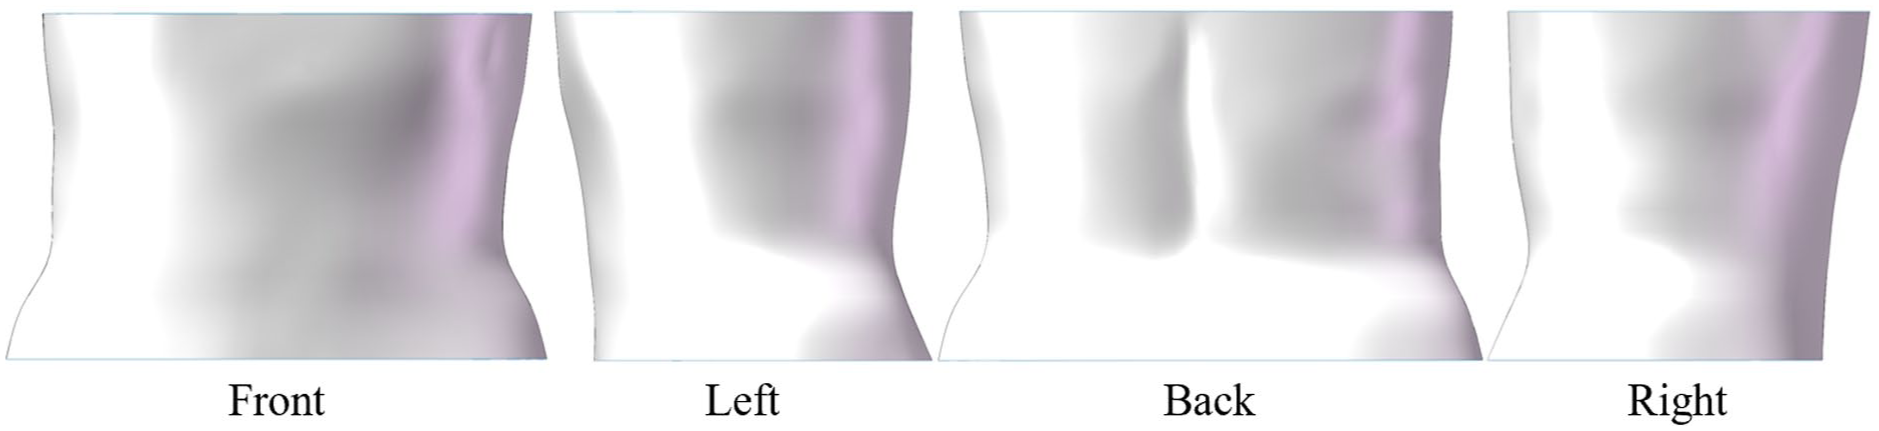
Establishment of the waist protector model.
Assembly of the three-dimensional model of waist protector–human waist
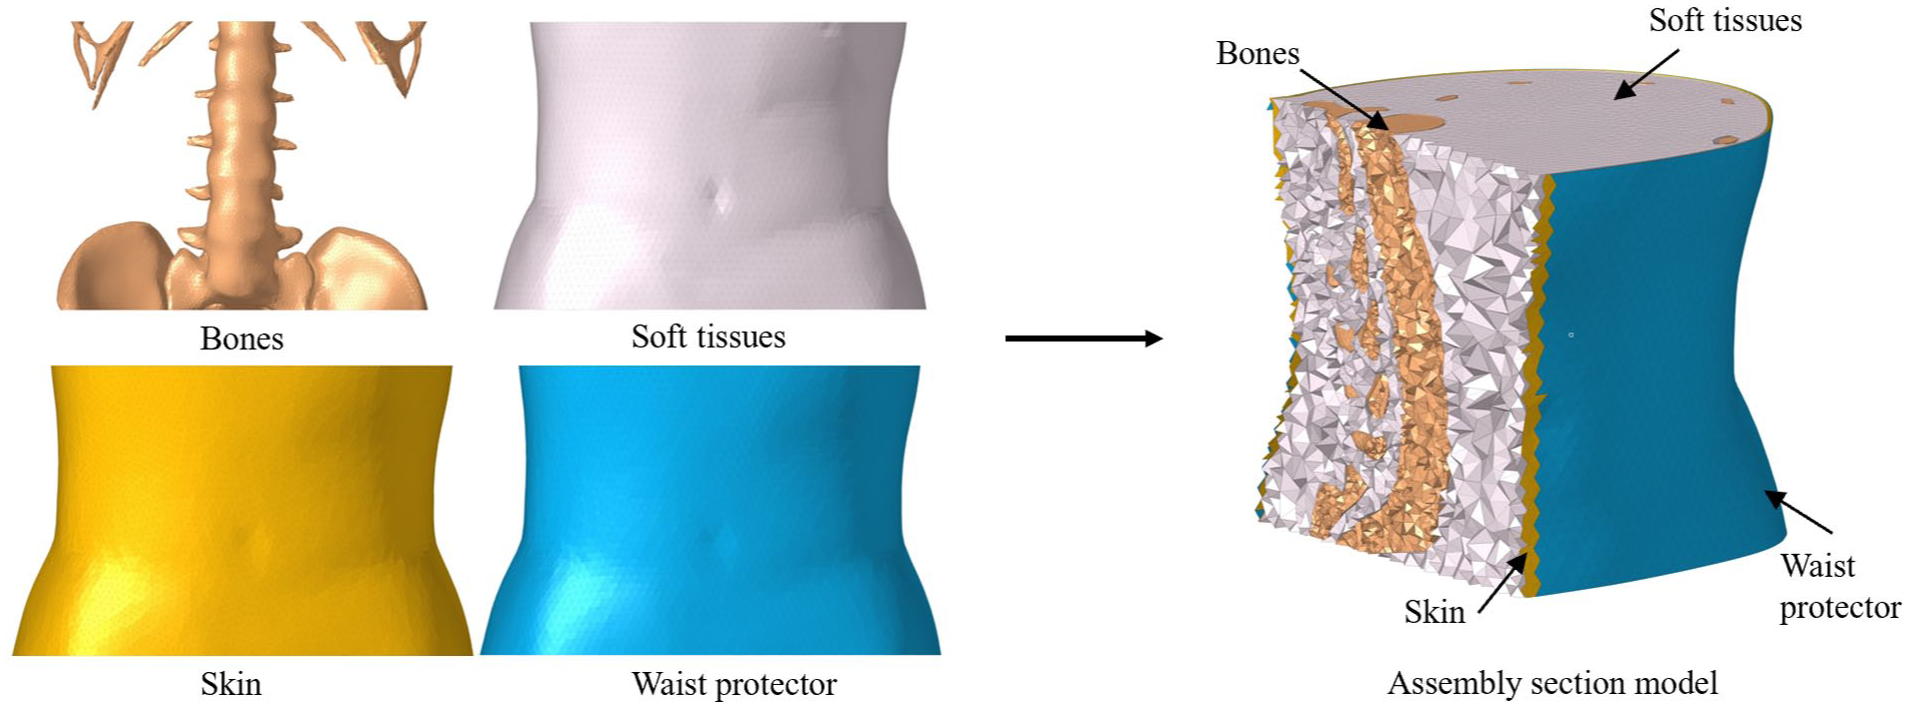
We imported the waist model into SolidWorks and converted it into a part format. Then, we assembled the waist bones, soft tissues, and skin in the assembly module, using the coordinate system origin as the reference point to complete the assembly of the waist model. At the same time, we used the segmentation tool to remove the interference areas of the waist model and saved it as an independent part. Finally, we completed the assembly of the waist protector and the waist model, and output it in STEP format, as shown in Figure 4.
Assembly of the waist protector–human waist model.
Three-dimensional model preprocessing of the waist
Mesh division
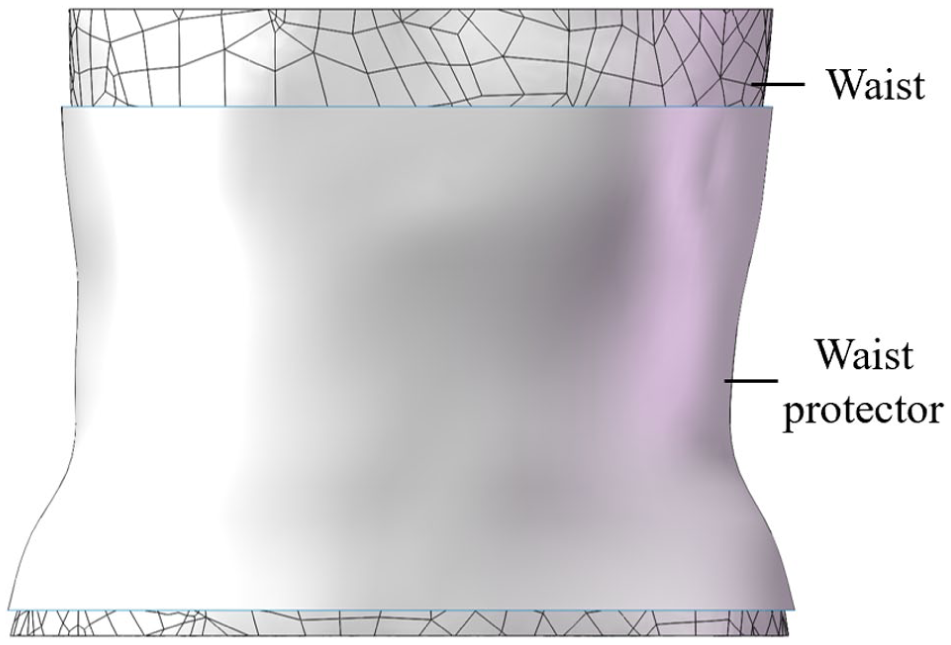
The various tissue structures of the waist were meshed in the HyperMesh software. The selection and quality of the mesh type will affect the accuracy of the finite-element analysis. Currently, the most commonly used mesh types are tetrahedral meshes and hexahedral meshes. Considering that the tetrahedral mesh has a shorter calculation time and can better adapt to complex geometric models, 25 this study set the mesh type as tetrahedral meshes. The mesh sizes were set as 3 mm for the bones and 5 mm for soft tissues, skin, and waist protector. The meshing of the model is shown in Figure 5.
Mesh division of the human waist.
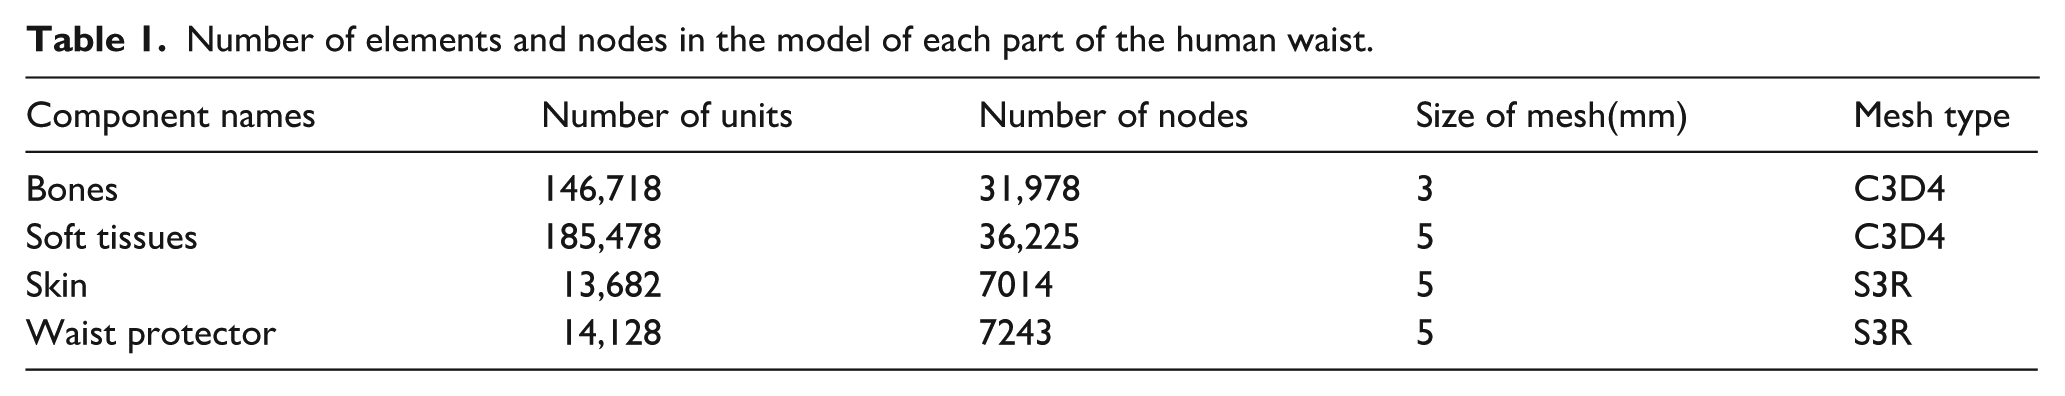
The number of elements and nodes generated by the mesh are presented in Table 1.
Number of elements and nodes in the model of each part of the human waist.
Material assignment
(1) Waist materials property settings.
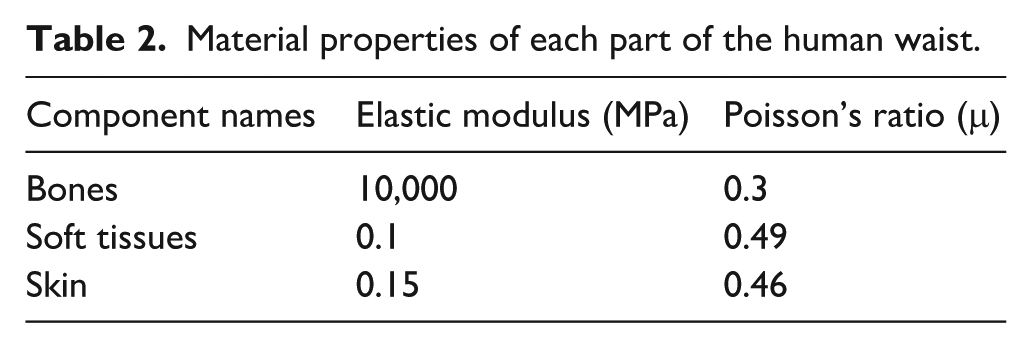
The human waist is composed of various tissues with different mechanical characteristics, and the model established during the pressure analysis should try to restore the material properties of the model object. In this study, the material properties assigned to the waist model in the property module are given in Table 2. Among them, the elastic modulus of bone was 1000 MPa and Poisson’s ratio was 0.3. 26 The elastic modulus of the soft tissue was 0.1 MPa and Poisson’s ratio was 0.49.27,28 The elastic modulus of the skin was 0.15 MPa and the Poisson’s ratio was 0.46,29,30 and the material property assignment is presented in Table 2.
Material properties of each part of the human waist.
(2) Waist protector materials property settings.
Since the materials used for functional waist protectors are generally the same, this study mainly focused on the differences in the structural design of the waist protectors. Five common functional waist protectors available on the market were selected as experimental samples, as shown in Figure 6.
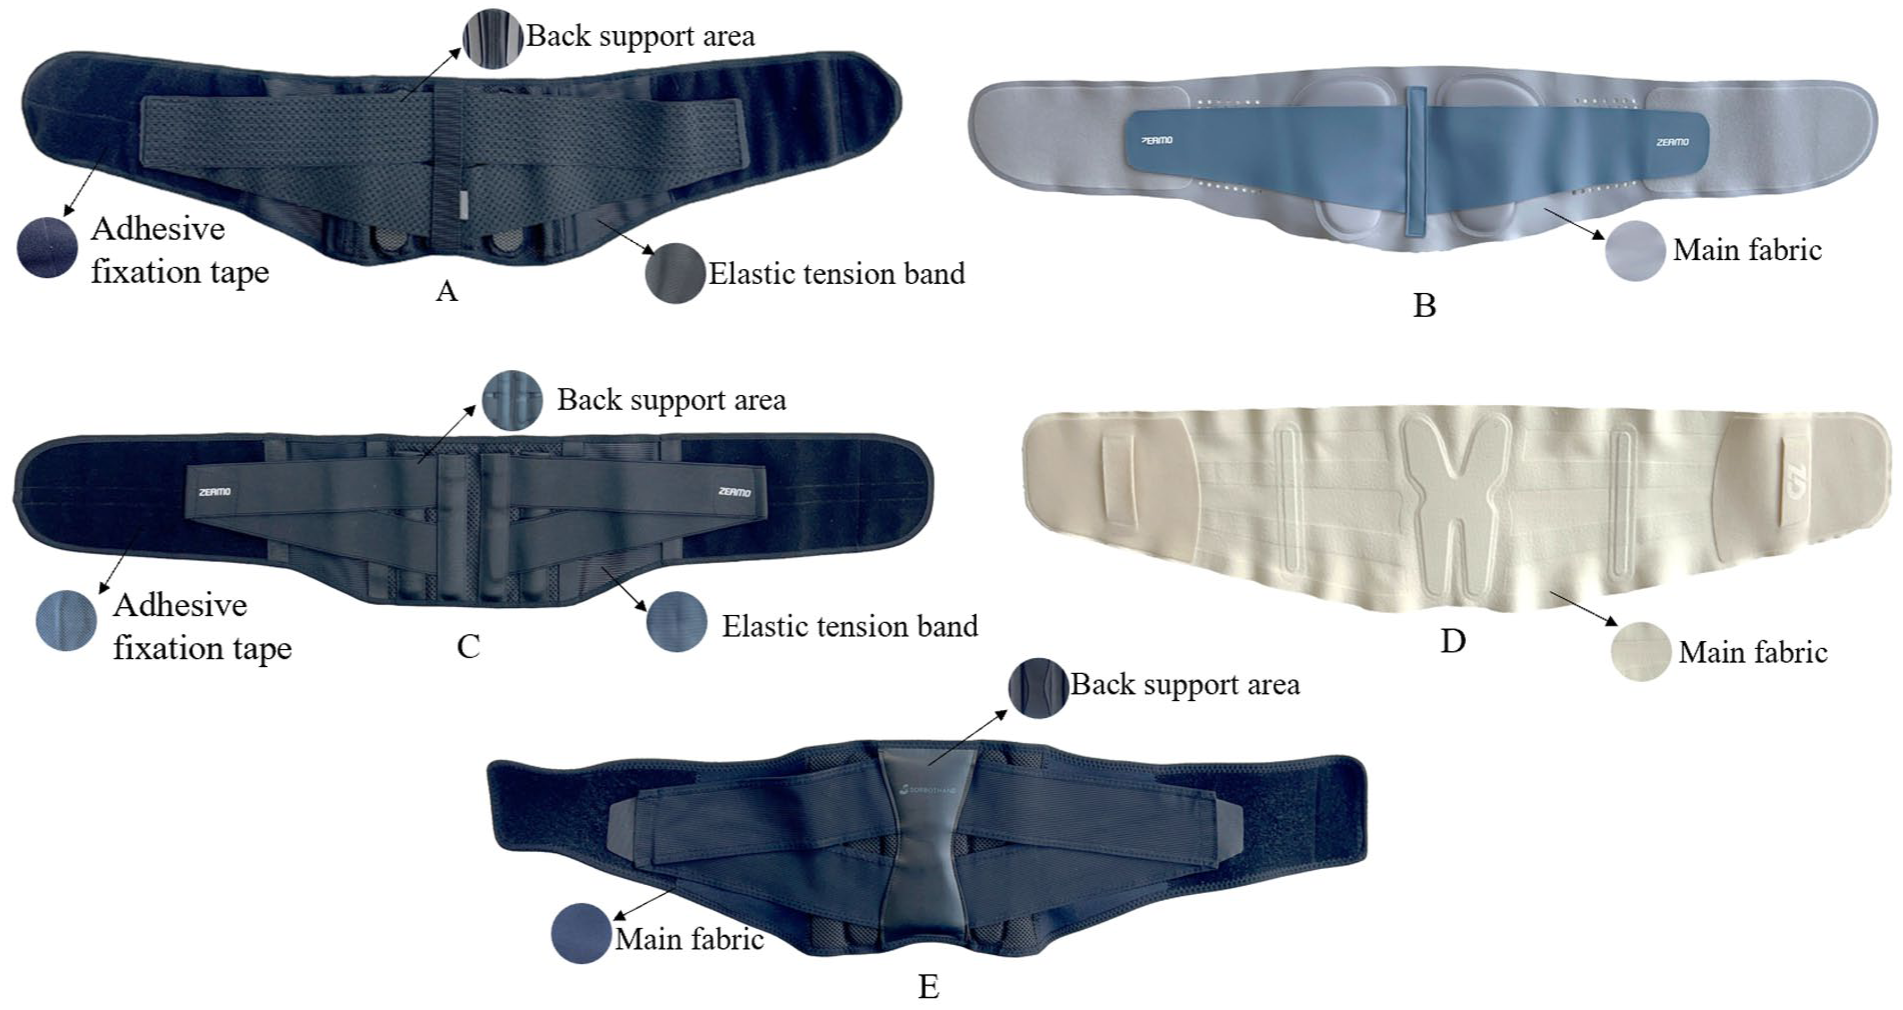
Five types of experimental waist protectors.
In order to obtain the material parameters of the waist protector, this study referred to GB/T3923.1-2013 “Textiles - Tensile properties Part 1: Determination of breaking strength and elongation at break (strip method).” 31 The experiment was conducted using the TENSOLAB2516 electronic fabric tensile testing machine. Three tests were carried out, with a stretching speed of 100 mm/min and a test spacing of 100 mm. The average value was taken as the result. During the experiment, the reduction in width and the increase in length of the fabric at each time period were recorded. Then, the decrease in material parameters in the horizontal unit width and the increase in material parameters in the vertical unit length of the samples were calculated successively. Finally, the material parameters of the five types of waist protectors were calculated using the formulas for Young’s modulus and Poisson’s ratio:
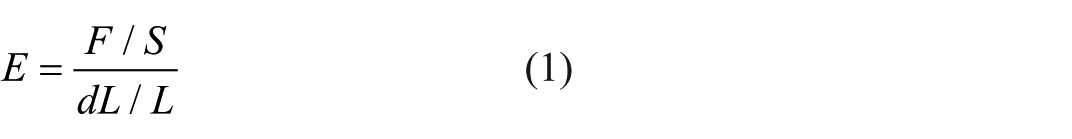
were E represents the Young’s modulus of the elastic fabric, F represents the tensile load of the elastic fabric, S represents the initial cross-sectional area, dL represents the elongation due to stretching, and L represents the initial length of the elastic fabric; and
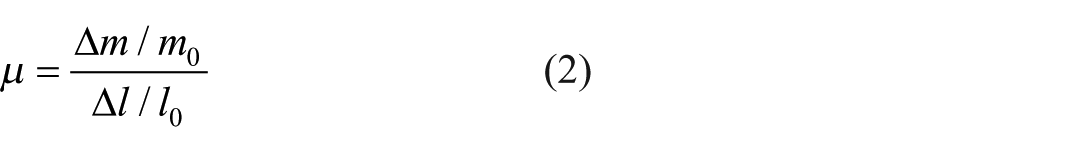
where
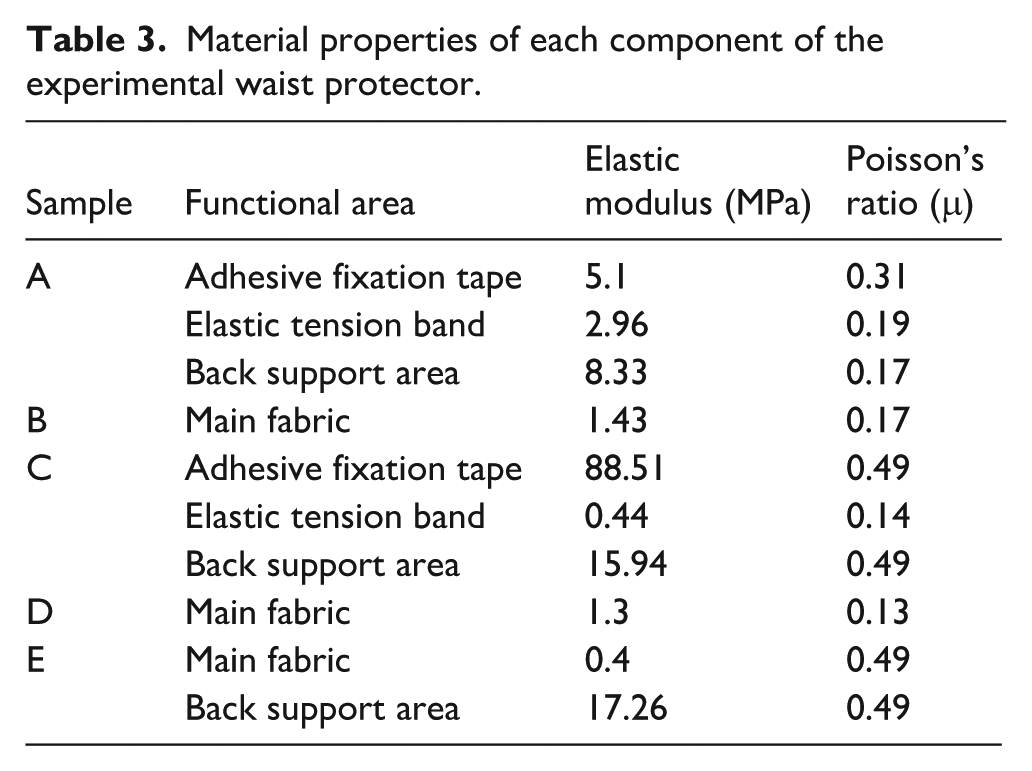
Material properties of each component of the experimental waist protector.
Contact settings
When conducting finite-element analysis on multiple models, if there is contact between the models, the contact settings need to be made for the models; otherwise, it will lead to the nonconvergence of the finite-element analysis results. In this study, the waist protector was closely attached to the human waist during wearing, and the finite-element model needed to transfer the normal force applied by the waist protector to the human waist model through “contact pairs.” To better constrain the models, three contact pairs were set in the waist model. The contact between the outer surface of the bone and the inner surface of the soft tissue, and the contact between the outer surface of the soft tissue and the inner surface of the skin were defined as bound contact 32 ; the contact between the outer surface of the skin and the inner surface of the waist protector was defined as “frictional contact,” allowing the two surfaces to separate in the normal direction and slide tangentially. The friction factor was set at 0.2, 33 and the contact algorithm selected the penalty function.
Load and boundary conditions
In this study, the loads during the finite-element analysis were applied in the form of pressure, thereby simulating the pressure exerted by the waist protector on the human waist. The pressure values measured in the pressure experiment for the human waist were input as loads into the finite-element software, and the direction of the applied load was perpendicular to the surface of the human waist.
The purpose of setting boundary conditions is to impose certain constraints on the model, which can improve the accuracy of the calculation results and ensure that the finite-element analysis has a solution. In this study, kinematic coupling was established between the reference point and the end face nodes, and the “displacement/rotation boundary” in the mechanical boundary conditions was selected to create the boundary conditions. To avoid the nonphysical stress concentration caused by the rigid constraint of the bone end face and to ensure that the position of the waist does not change during the simulation, the lower end boundary condition of the waist in this study was set as U1 = U2 = U3 = UR1 = UR2 = UR3 = 0, while the reference point at the upper end only remains free in the U3 direction, and the other directions were constrained. The load and boundary condition settings are shown in Figure 7.
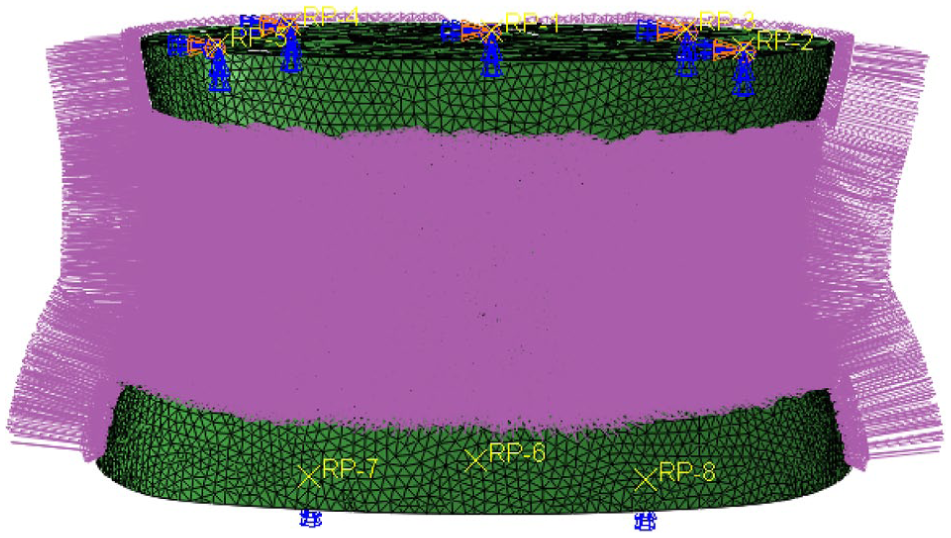
Load and boundary condition settings.
Objective pressure test experiment of the waist protector
Selection of experimental samples
The pressure of clothing is an important indicator affecting the comfort of clothing. 34 This study selected five commonly available functional waist protectors with different structural forms as the experimental subjects. In the “Material assignment” section, corresponding material parameters were assigned based on the actual material properties of the waist protector products. By eliminating the interference of material differences, this study focused on analyzing the impact of different waist protector structural designs on the pressure distribution trend in the human body.
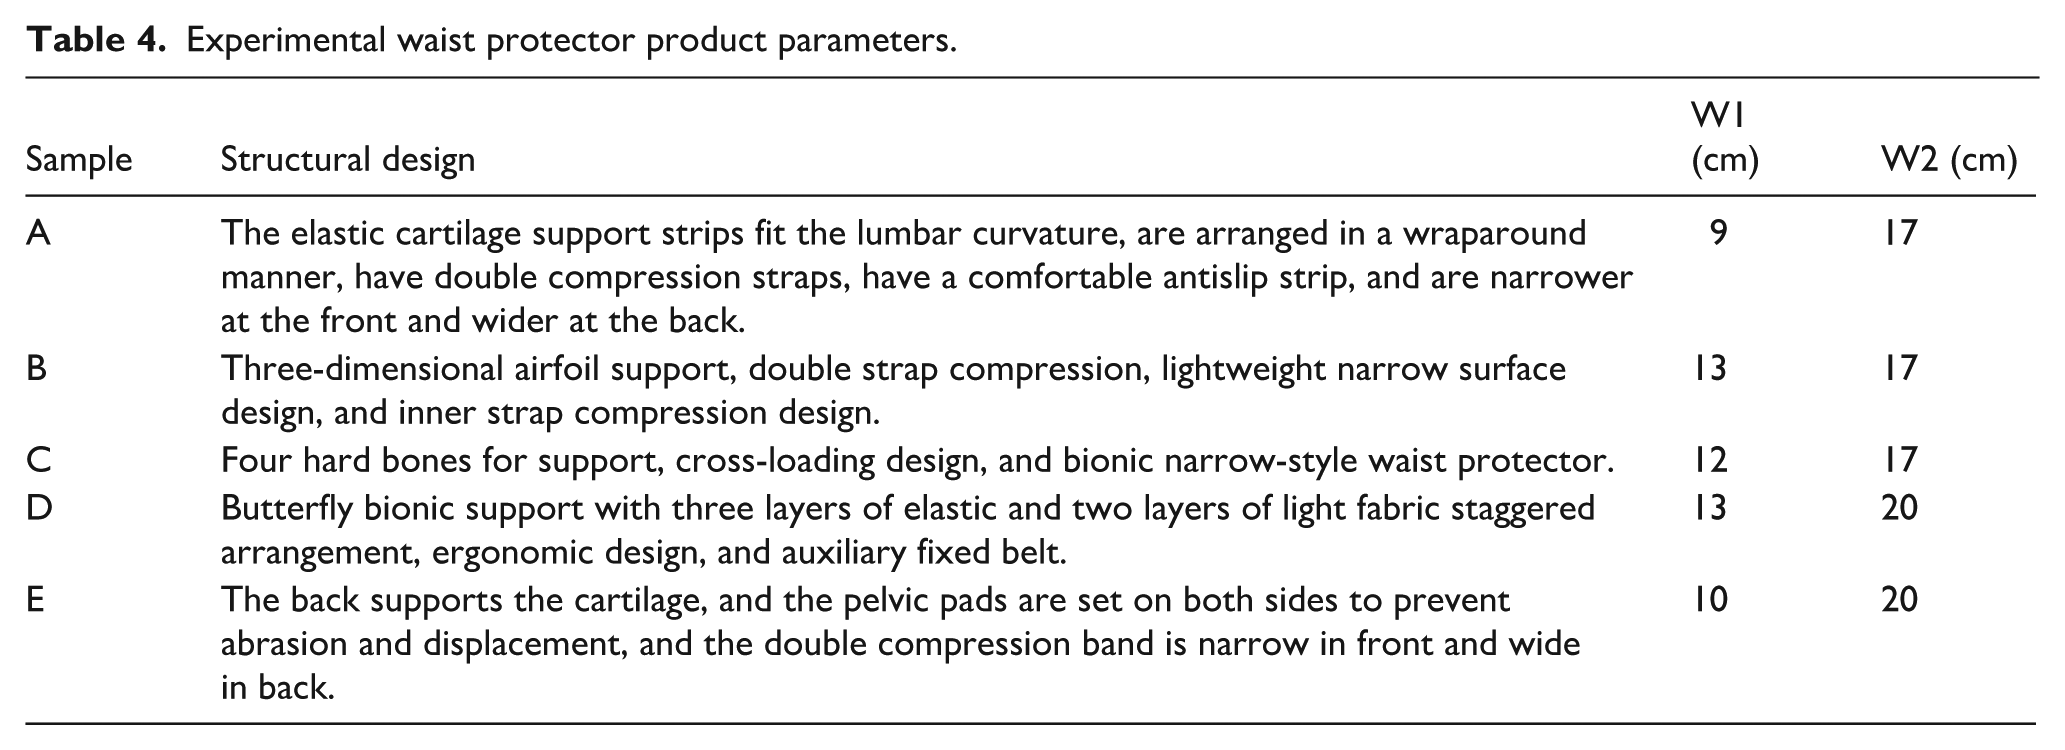
The specific parameters of the five experimental waist protectors are given in Table 4. Among them, W1 represents the width of the front part of the waist protector and W2 represents the width of the rear part of the waist protector.
Experimental waist protector product parameters.
Pressure test experiment of waist protector–waist
To measure the actual pressure values on each section of the waist when wearing the waist protector, this study used the AMI3037-5S airbag contact pressure tester. Thirty healthy female college students without a history of low back pain were selected, whose heights and body types were similar to those of the experimental subject. They underwent waist protector–waist contact pressure tests. The selection of the experimental subject was based on the national standard “Chinese Adult Human Dimensions” (GB/T10000-2023). Before the experiment, the positions of the pressure testing points on the waist were determined through a pre-experiment, and the test points were marked on the surface of the subjects’ waists.
According to the structure feature of the waist protector, which is shorter in the front and longer in the back, during the pressure experiment, three test laps were set on the front side of the waist protector, and five test laps were set on the back side. The test lap corresponding to the upper edge of the subject’s navel was taken as the third lap and used as the unified benchmark for the wearing position of the waist protector. For each test lap, 20 pressure test points were arranged (taking the second lap as an example). Among them, the central position in front of the waist was designated as the first test point, and the remaining test points were set along the cross-sectional direction of the waist, in a counterclockwise direction, at intervals of 18°. Due to the limitations of the waist protector structure and coverage area, pressure measurements were not conducted at test points 17 to 5 in the first and fifth laps. During the experiment, the subjects maintained a static sitting position, and the airbag pressure sensor was placed between the subject’s skin (underwear) and the waist protector. Pressure tests were carried out under natural breathing conditions. Each test point was measured three times, and the average value was taken as the final pressure result. The waist protector test experiment and test point settings are shown in Figure 8.
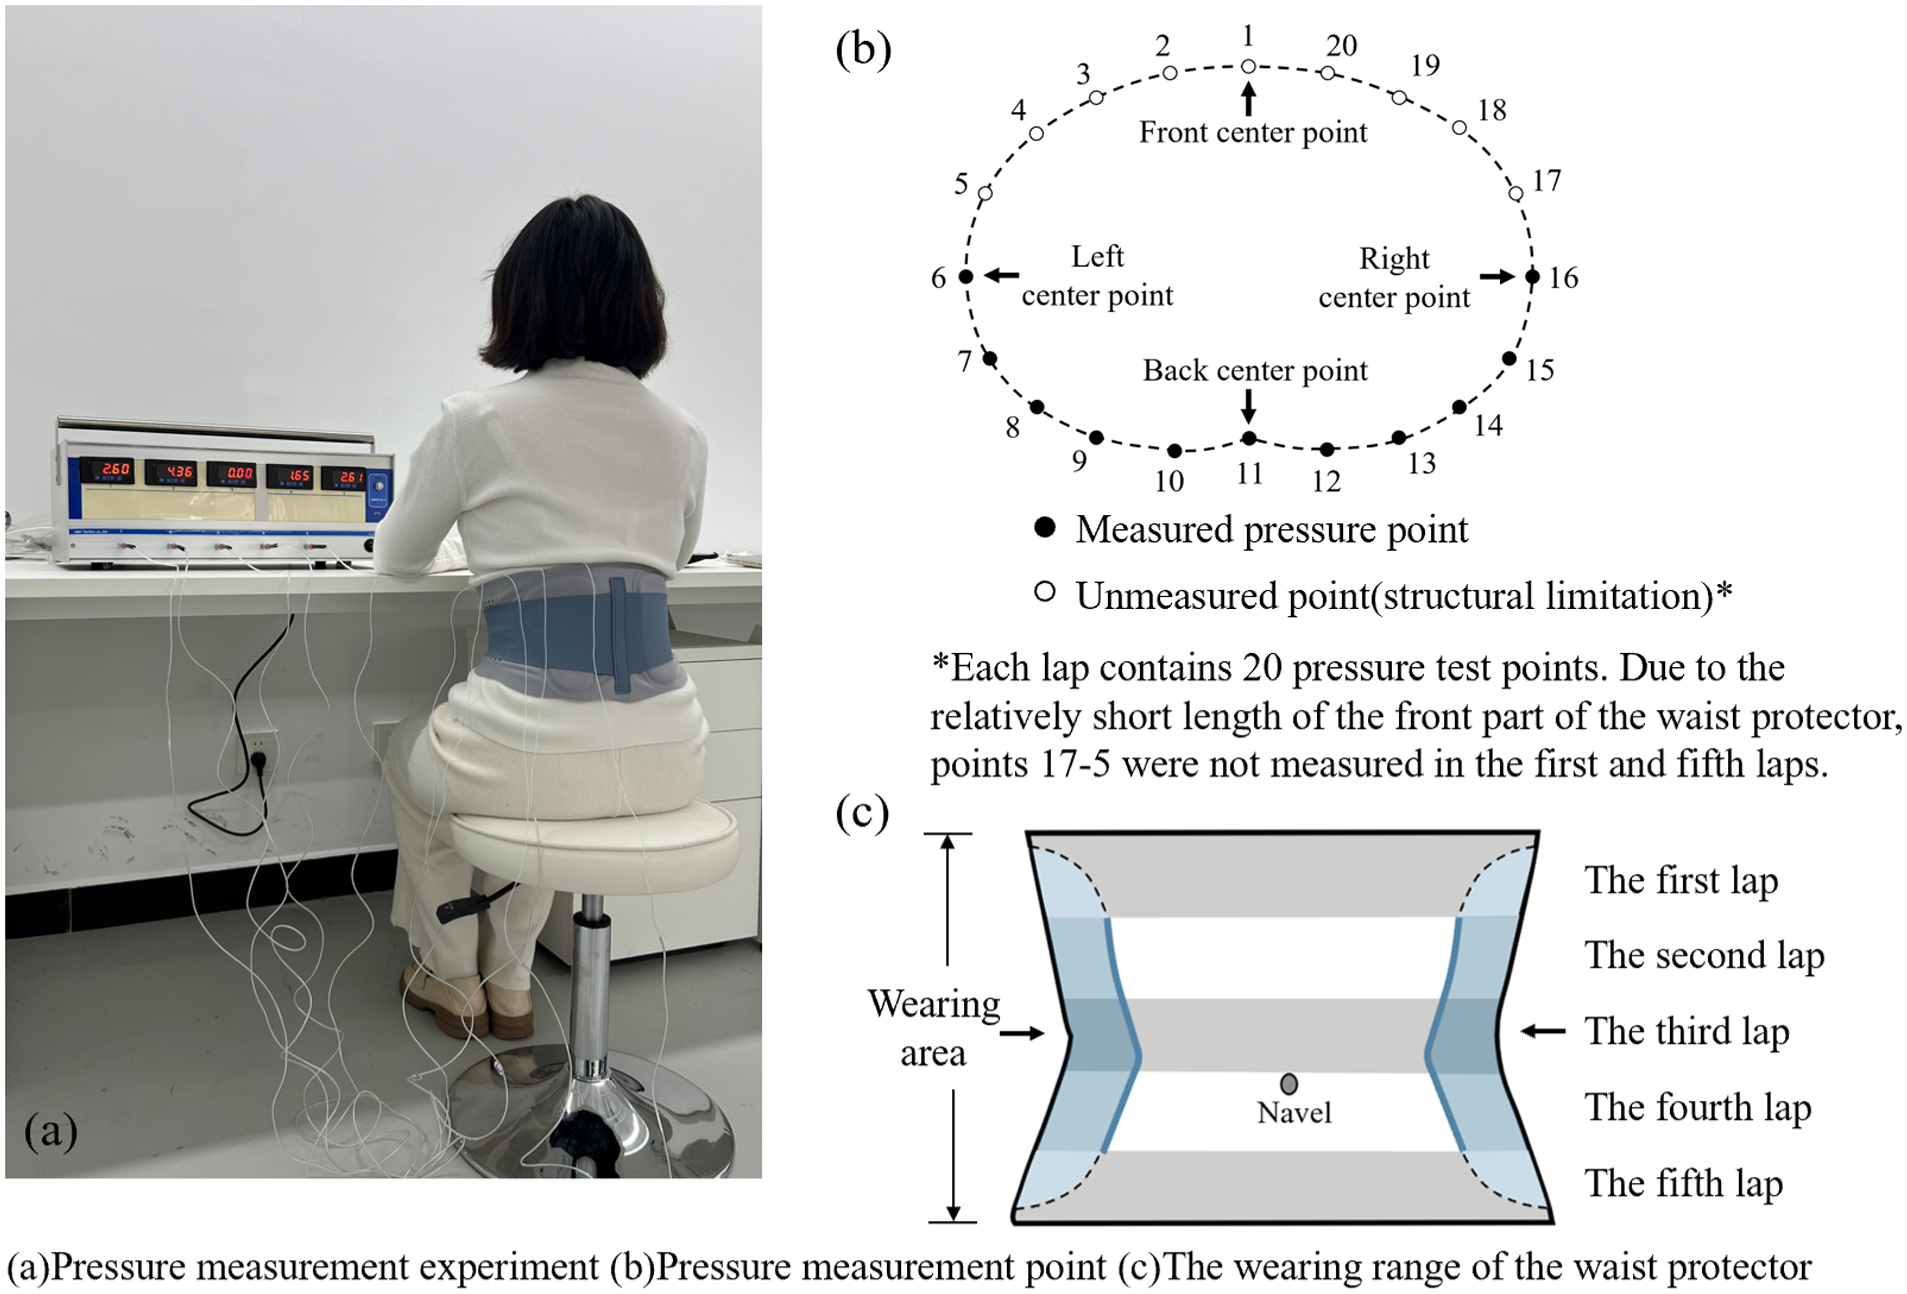
Pressure test experiment diagram of waist–waist protector.
Results and discussion
Experimental waist protector pressure test
Based on the physiological characteristics of the human body, this study set the longest duration for continuous wearing of the waist protector to be 3 h. To explore the pressure and displacement changes of the waist protector with the wearing time, this study divided the wearing process of the waist protector into four time periods: 0, 1, 2, and 3 h. The pressure data of 82 points on the cross-section of the waist of the subjects after wearing five waist protector samples were measured. Taking the waist protector sample A as an example in this study, the pressure test data are shown in Figure 9.
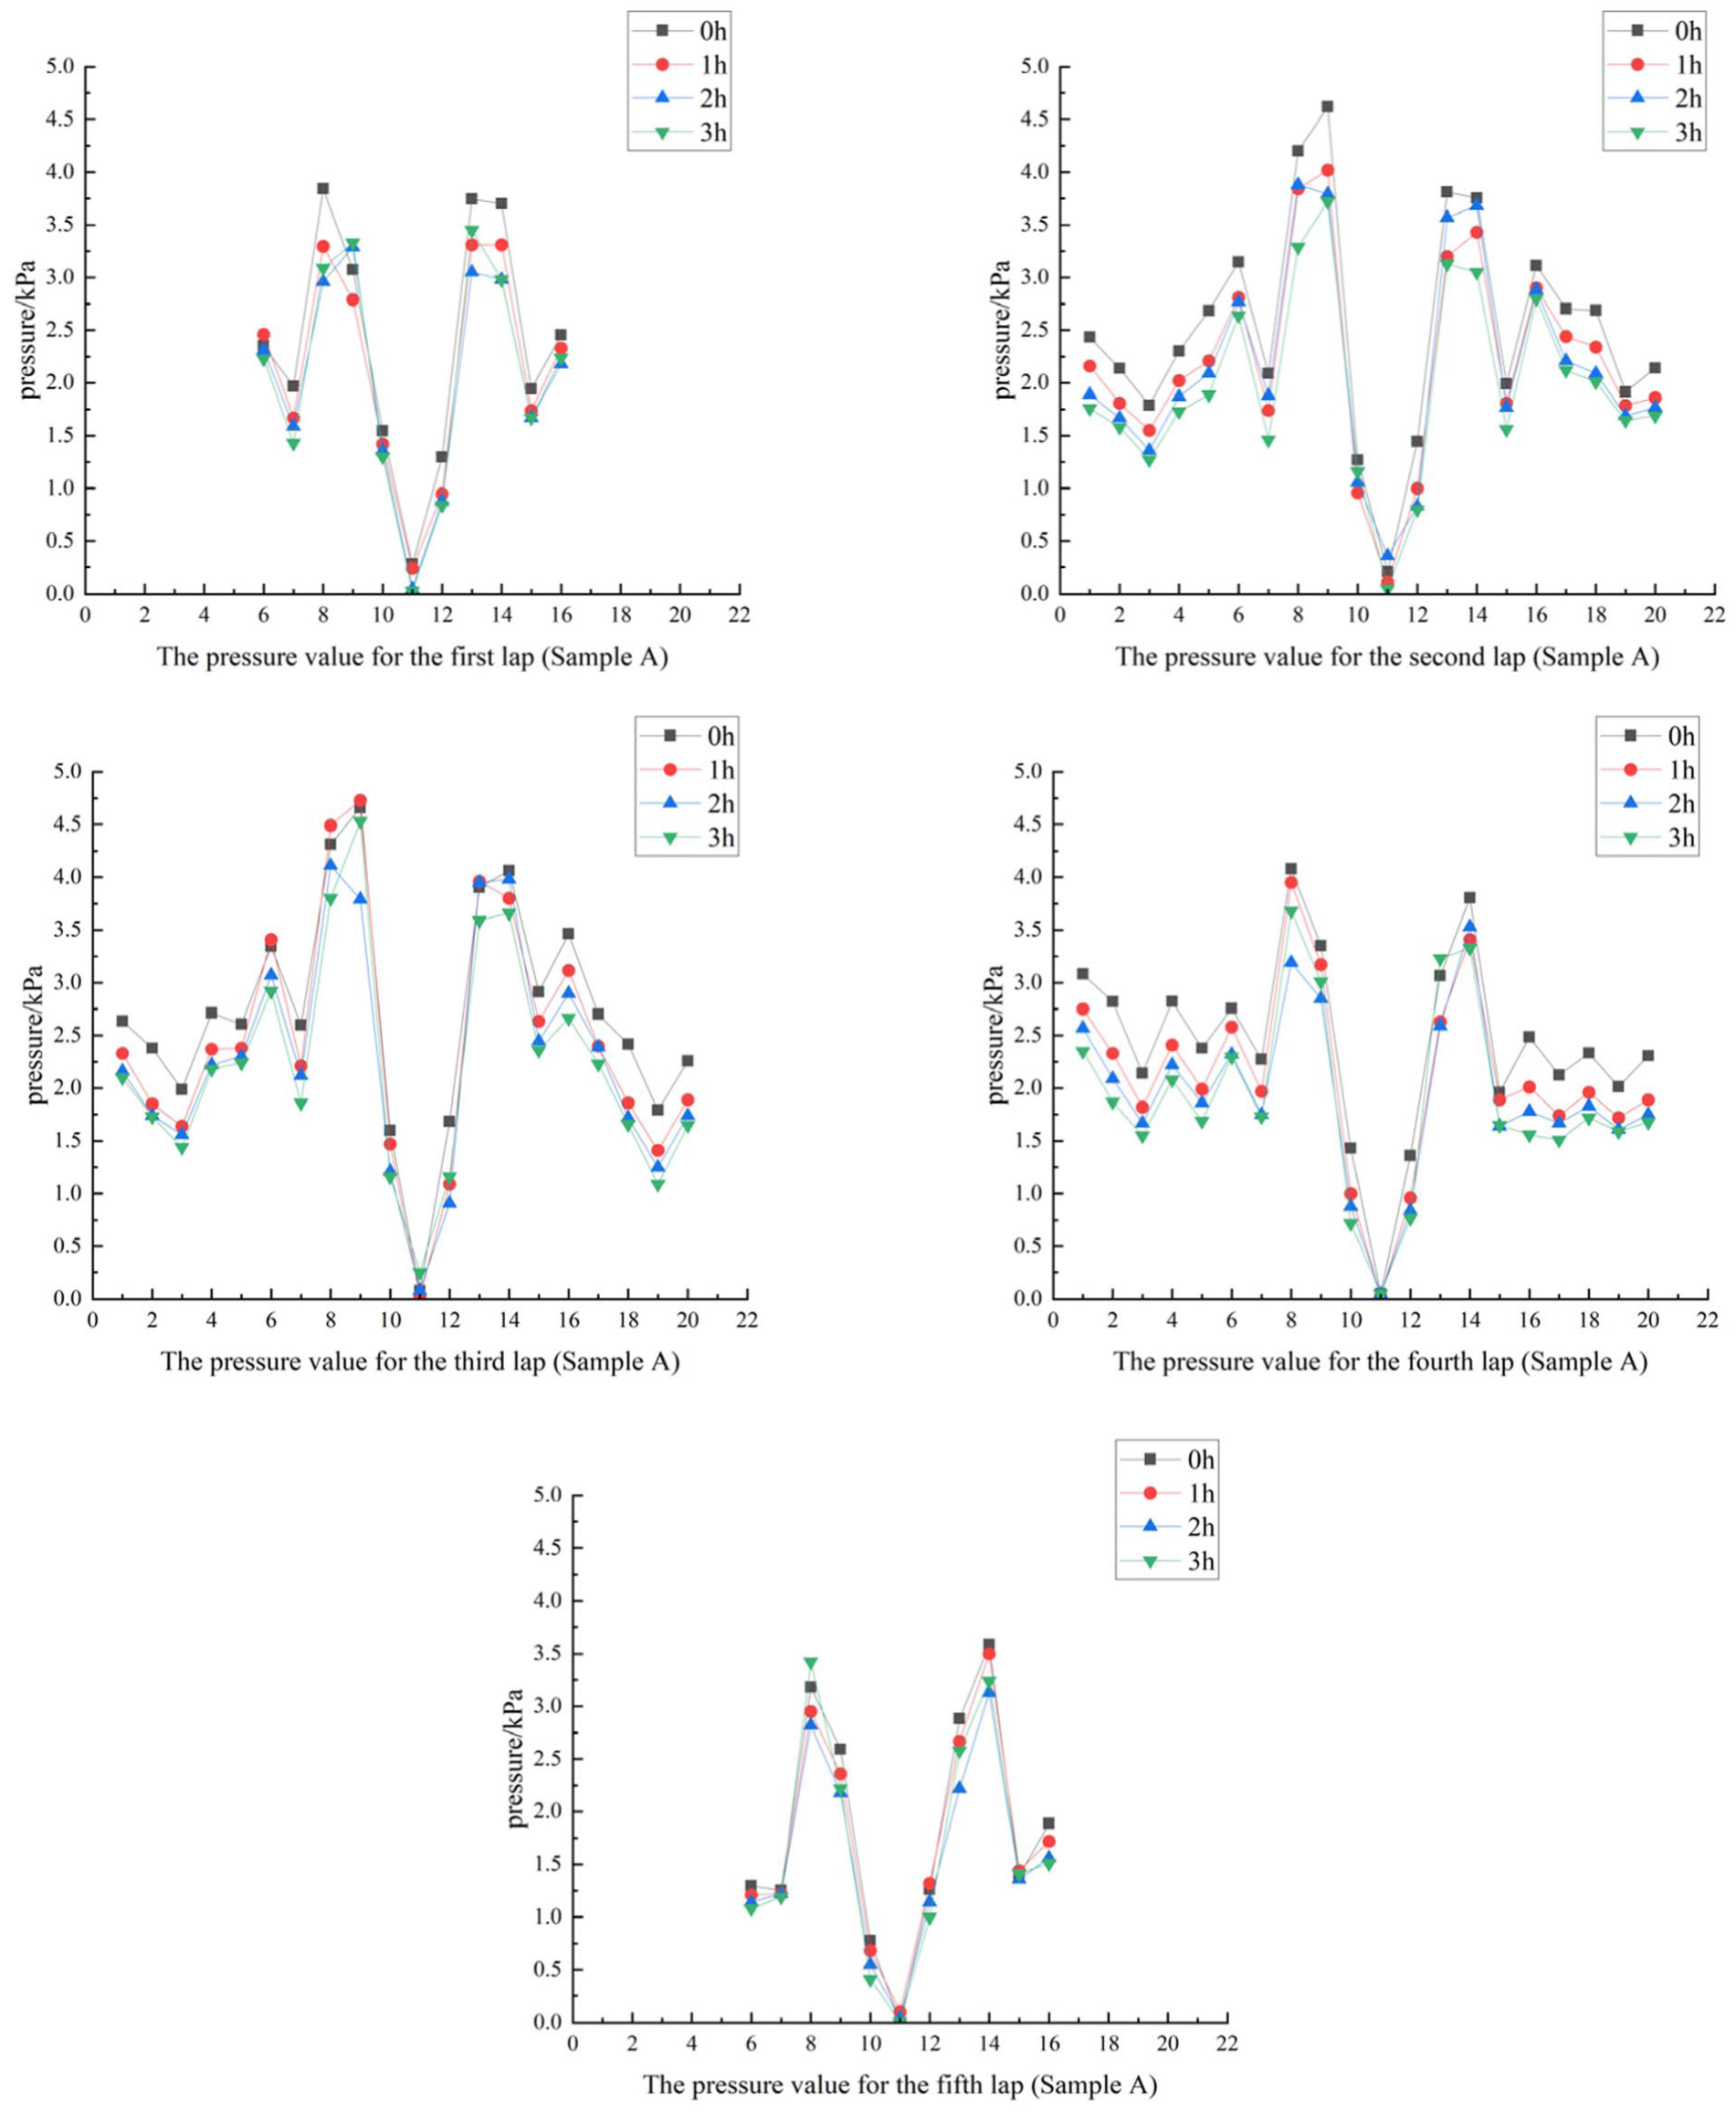
Pressure values at different time periods (sample A).
As shown in Figure 9, with the increase in wearing time, the pressure values at each test point on the waist cross-section generally show a downward trend. During the dressing process, the changes in waist pressure were mainly influenced by two factors: the human body’s structural characteristics and the design of the waist protector.
From a human anatomy perspective, the cross-section of the waist is not a regular elliptical shape; Instead, it exhibits a distinct noncircular asymmetry. 35 However, overall, it was centered around the 11th test point on the back of the human body, presenting a distribution feature that was approximately symmetrical on both sides. The pressure values at test points 6 and 16 were higher than those around them. This was because these two points were located in the lateral area of the human waist, where the local curvature radius was smaller. According to Laplace’s law P = T/R, pressure P is inversely proportional to curvature radius R. Considering the characteristics of the human waist shape, the curvature radius in the lateral area of the waist was relatively smaller, so this area was more prone to pressure concentration. In addition, due to the depression in the middle line area of the human back, the waist protector does not make sufficient contact with the human body, so the pressure value at test point 11 was almost zero.
From the perspective of the waist protector structure, after pressure testing and calculation, the average values of the pressure of the sample A model experimental waist protector with five laps were 2.38, 2.52, 2.71, 2.43, and 1.83 kPa, respectively. The pressure distribution gradually decreased from the center of the third lap to both sides. The pressure value at the third lap was the highest, mainly because the waist protector adopted a double-pressing design at this position, and this position corresponds to the thinnest part of the human waist, which was the main bearing area of the waist protector. The pressure value of the first lap was higher than that of the fifth lap. This was because the first lap was located in the thicker part of the human body and close to the bones, resulting in greater contact pressure, whereas the fifth lap was at the lower edge of the waist protector, so was prone to local suspension or insufficient adhesion, hence the lower pressure value. Support strips were set at the locations of test points 8, 9, 13, and 14. As a result, the pressure in this area was significantly higher than that in the surrounding areas. In addition, the pressure values at test point 19 were generally lower. This was because there was an overlapping structure at the front of the waist protector, which reduced the fit between this area and the human body, thereby causing a decrease in the local contact pressure between the waist protector and the waist.
From the overall trend, the pressure on the waist gradually decreases as the wearing time of the waist protector increases. In the initial stage of wearing (0–1 h), the pressure decreased significantly because the waist protector exerted a strong constraining effect on the waist during the initial wearing period, resulting in a higher pressure value. As the wearing time increases (1–3 h), the relaxation of the waist protector material and the gradual adaptation of the human waist to the external constraints caused the rate of pressure reduction to slow down. 36 By calculating the average pressure change rate of each test point within the two time periods of 0–1 h and 1–3 h, the results showed that during 0–1 h, the decline amplitudes from the first to the fifth lap were 10.22%, 12.76%, 9.32%, 13.2%, and 4.66%, respectively; during 1–3 h, the decline amplitudes from the first to the fifth lap were 3.94%, 10.55%, 9.76%, 9.82%, and 5.74%, respectively. By comparing the amplitude of pressure changes over a certain period of time, it could be observed that the rate of pressure change during the stable wearing stage was significantly lower than that in the initial stage of wearing. Moreover, during the stable wearing stage, due to the difficulty for the human body to maintain the same sitting posture for a long time, and influenced by the internal support strip structure of the waist protector, the pressure in the support strip area might slightly increase due to fatigue posture.
Finite-element simulation of a waist protector
The distribution trend of pressure and displacement of the human waist
In order to obtain the stress and displacement distribution trends during the human wearing process of the waist protector, this study conducted a finite element simulation of the contact state between the human body and the waist protector. The pressure values obtained from the pressure experiment of the waist protector were input as loads into the waist model. Through finite-element simulation, the pressure and displacement distribution maps of the human body during the wearing of the waist protector were obtained at four time points: 0, 1, 2, and 3 h. Taking the waist protector of sample A as an example, since the pressure and displacement distribution trends at different time points show similar spatial characteristics, this study selected the pressure and displacement contour maps at 0 and 3 h after wearing to analyze the changes in the load distribution on the waist. The stress and displacement distribution contour maps are shown in Figure 10.
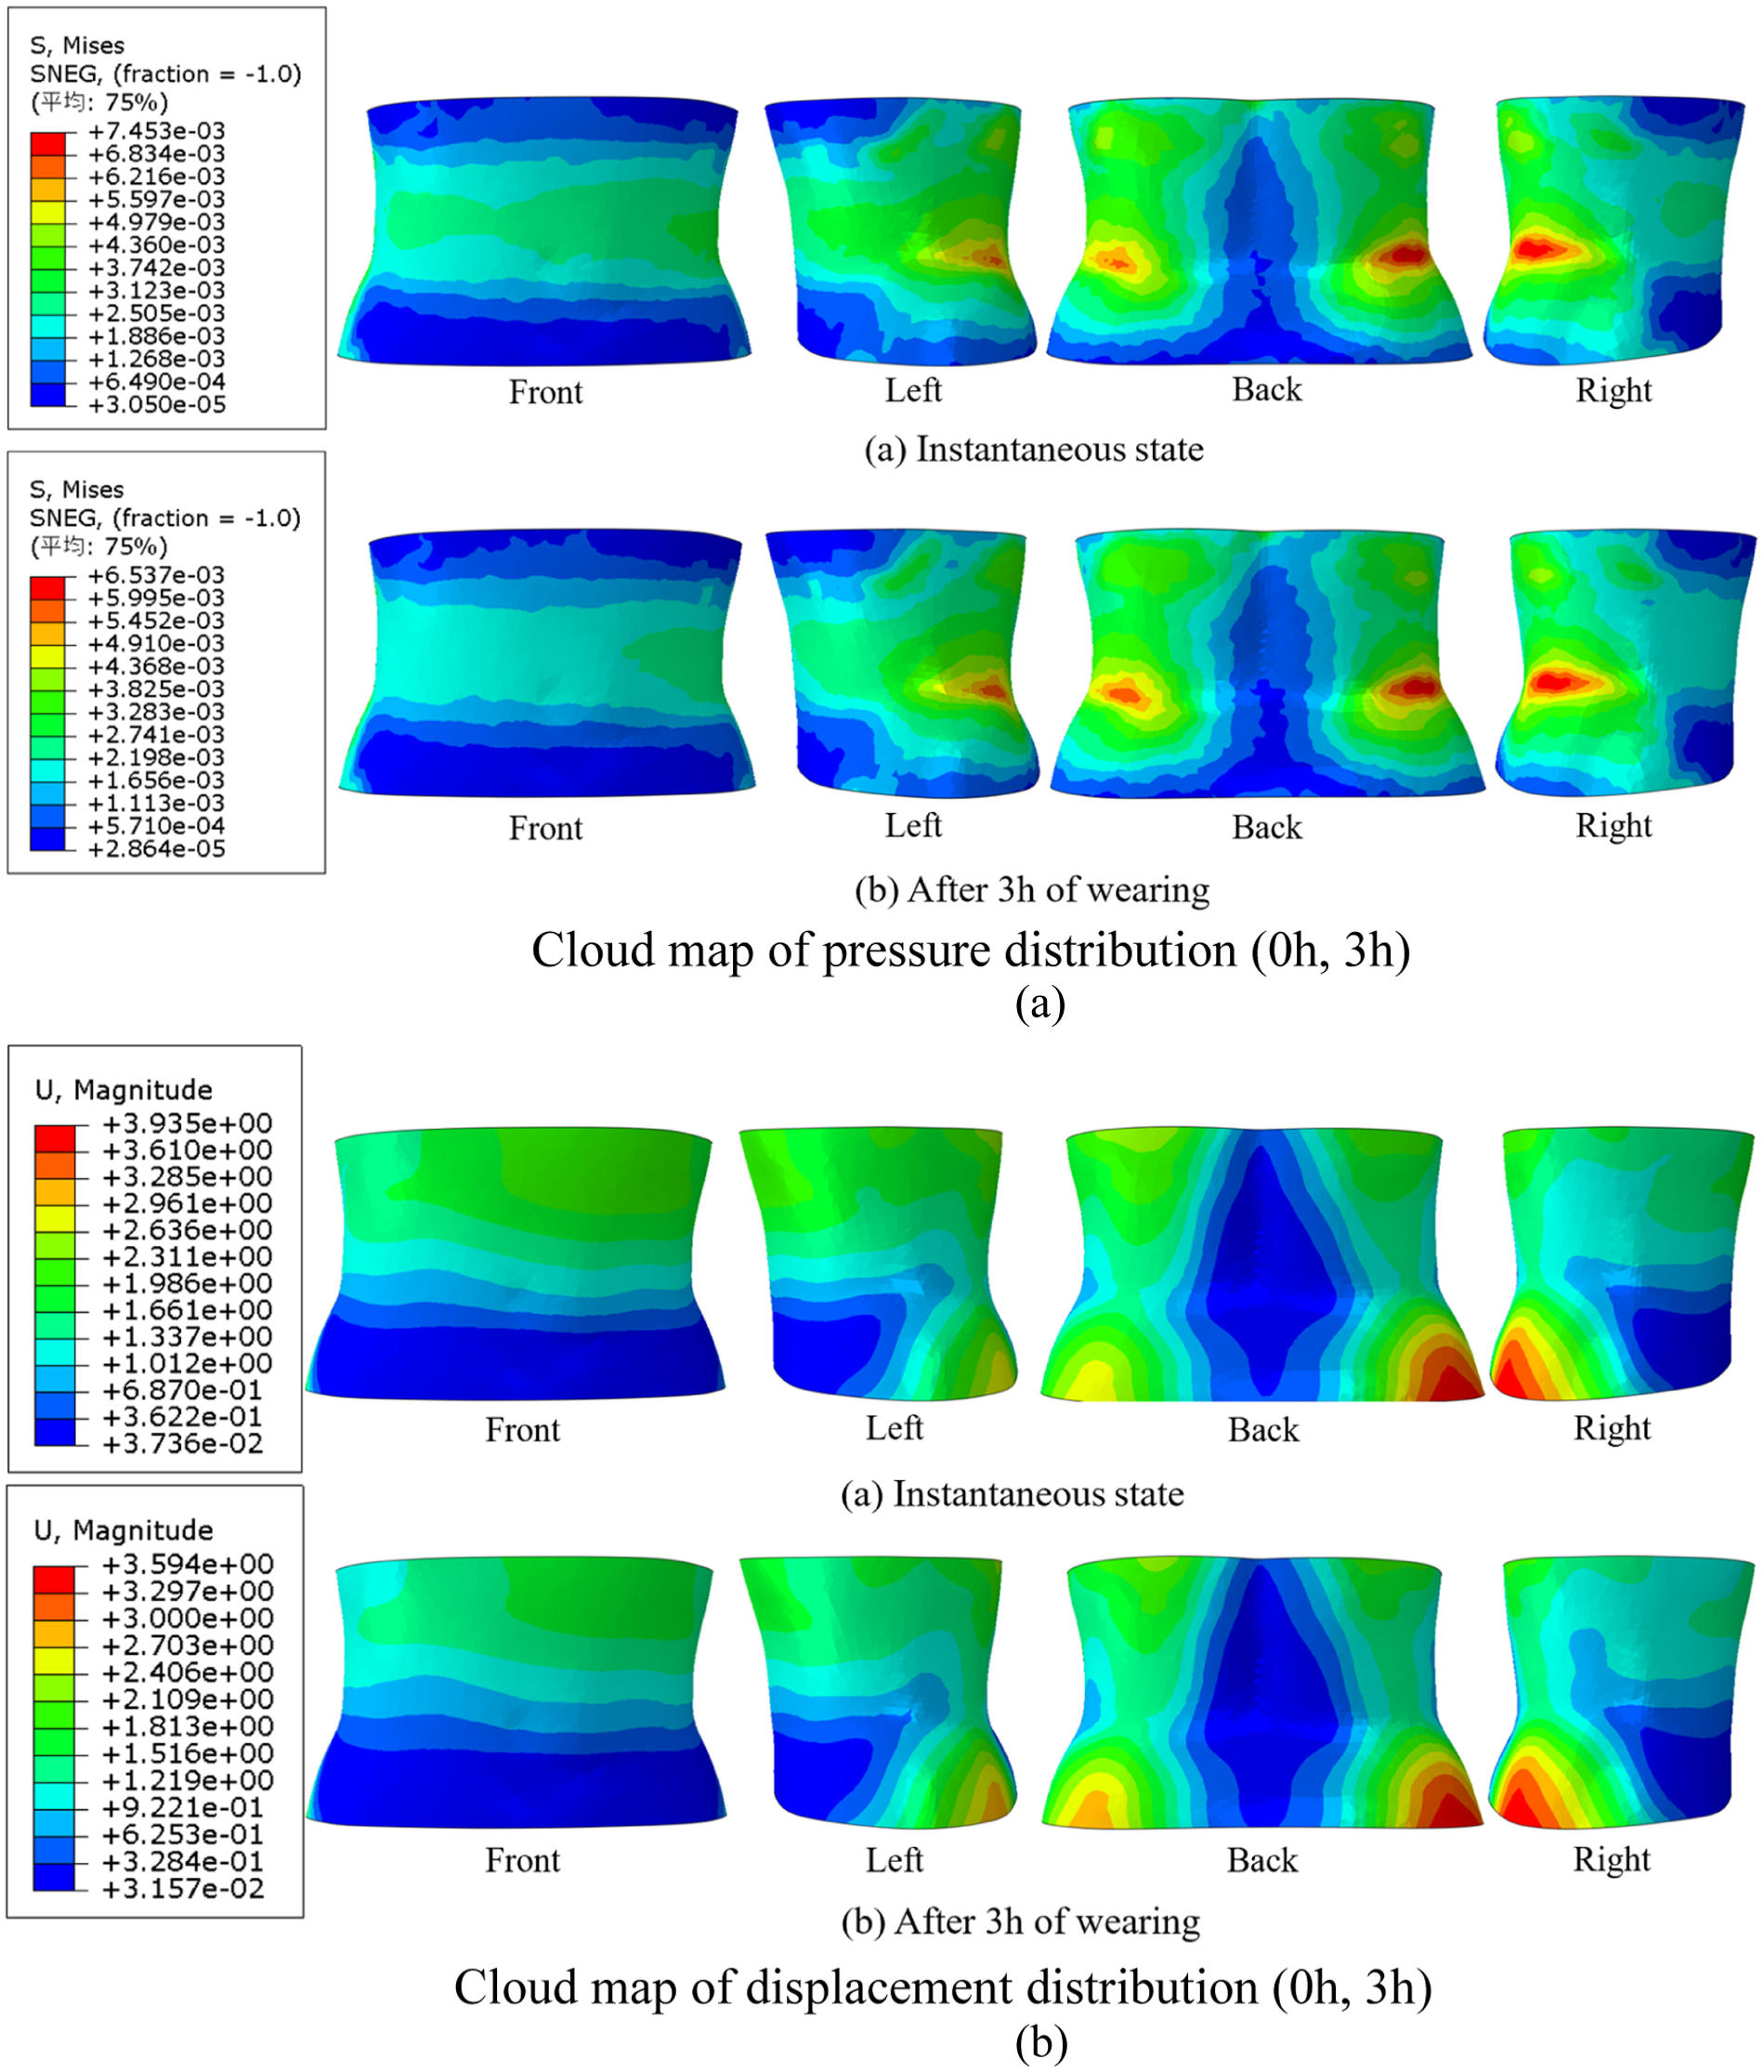
Cloud map of (a) pressure and (b) displacement distribution for experimental waist protector of Sample A (0 and 3 h).
As can be seen from Figure 10, different areas of the waist showed obvious pressure distribution differences during the wearing of the waist protector, with relatively high pressure in the lateral area of the waist. Research shows that under the influence of external pressure, surfaces with greater curvature are more prone to pressure concentration, and thus the pressure in this area is relatively high. 37 In the back area, the internal support strip structure of the waist protector provided significant support for the waist, thus resulting in relatively high pressure. The pelvic area, due to its more prominent bone structure and thinner soft tissue layer, was more prone to generating greater contact force during contact with the waist protector, resulting in greater stress in this area. As the wearing time of the waist protector increased, the overall stress level of the waist decreased compared with the initial stage of wearing. The pressure on the abdominal protrusion decreased, and the pressure in the back and the area near the pelvis tended to stabilize. This phenomenon indicated that during the continuous wearing of the waist protector, as the human waist gradually adapted to the waist protector, the supporting effect of the waist protector on the waist gradually changed from overall compression to structural support. The function of the support strip was gradually becoming apparent.
The human waist is an elastic part of the body. By analyzing the displacement changes of each area of the soft tissue in the waist, we can better understand the deformation state of the soft tissue in the waist during the process of wearing a waist protector. As can be seen from the displacement map shown in Figure 10, the areas with larger displacements were mainly concentrated in the upper half of the waist, the corresponding positions of the back support strip, and the pelvic area. This distribution feature was closely related to the thickness of the soft tissue in the waist and the position of the bone structure. Among them, the anterior protruding area of the abdomen, due to the relatively thick soft tissue layer and the lack of bone support, was more prone to deformation under the constraint of waist protector, and thus had a larger displacement. However, the lateral area, due to its relatively compact tissue and higher degree of limitation, had a relatively smaller displacement. The corresponding position displacement of the support strip on the back was relatively large, indicating that the supporting structure of the waist protector had a significant effect on the soft tissue of the waist. The pelvic area, under the tightening effect of the waist protector ring, was deformed by applying displacement to the surrounding areas, so the displacement in this area was relatively large. Overall, the distribution of waist displacement is closely related to the structural characteristics of the human body and the functional structure setting of the waist protector.
Validation of the finite-element model
To verify the validity of the finite-element model, in this study, the simulation values of each test point were extracted in the post-processing section of the Abaqus software, and the pressure test results were compared and analyzed with the simulation results of the finite-element method. Taking the waist protector of sample A as an example, Figure 11 shows the comparison of the measured values and simulated values of the five cross-sections of the waist when the subjects wore the sample A waist protector.
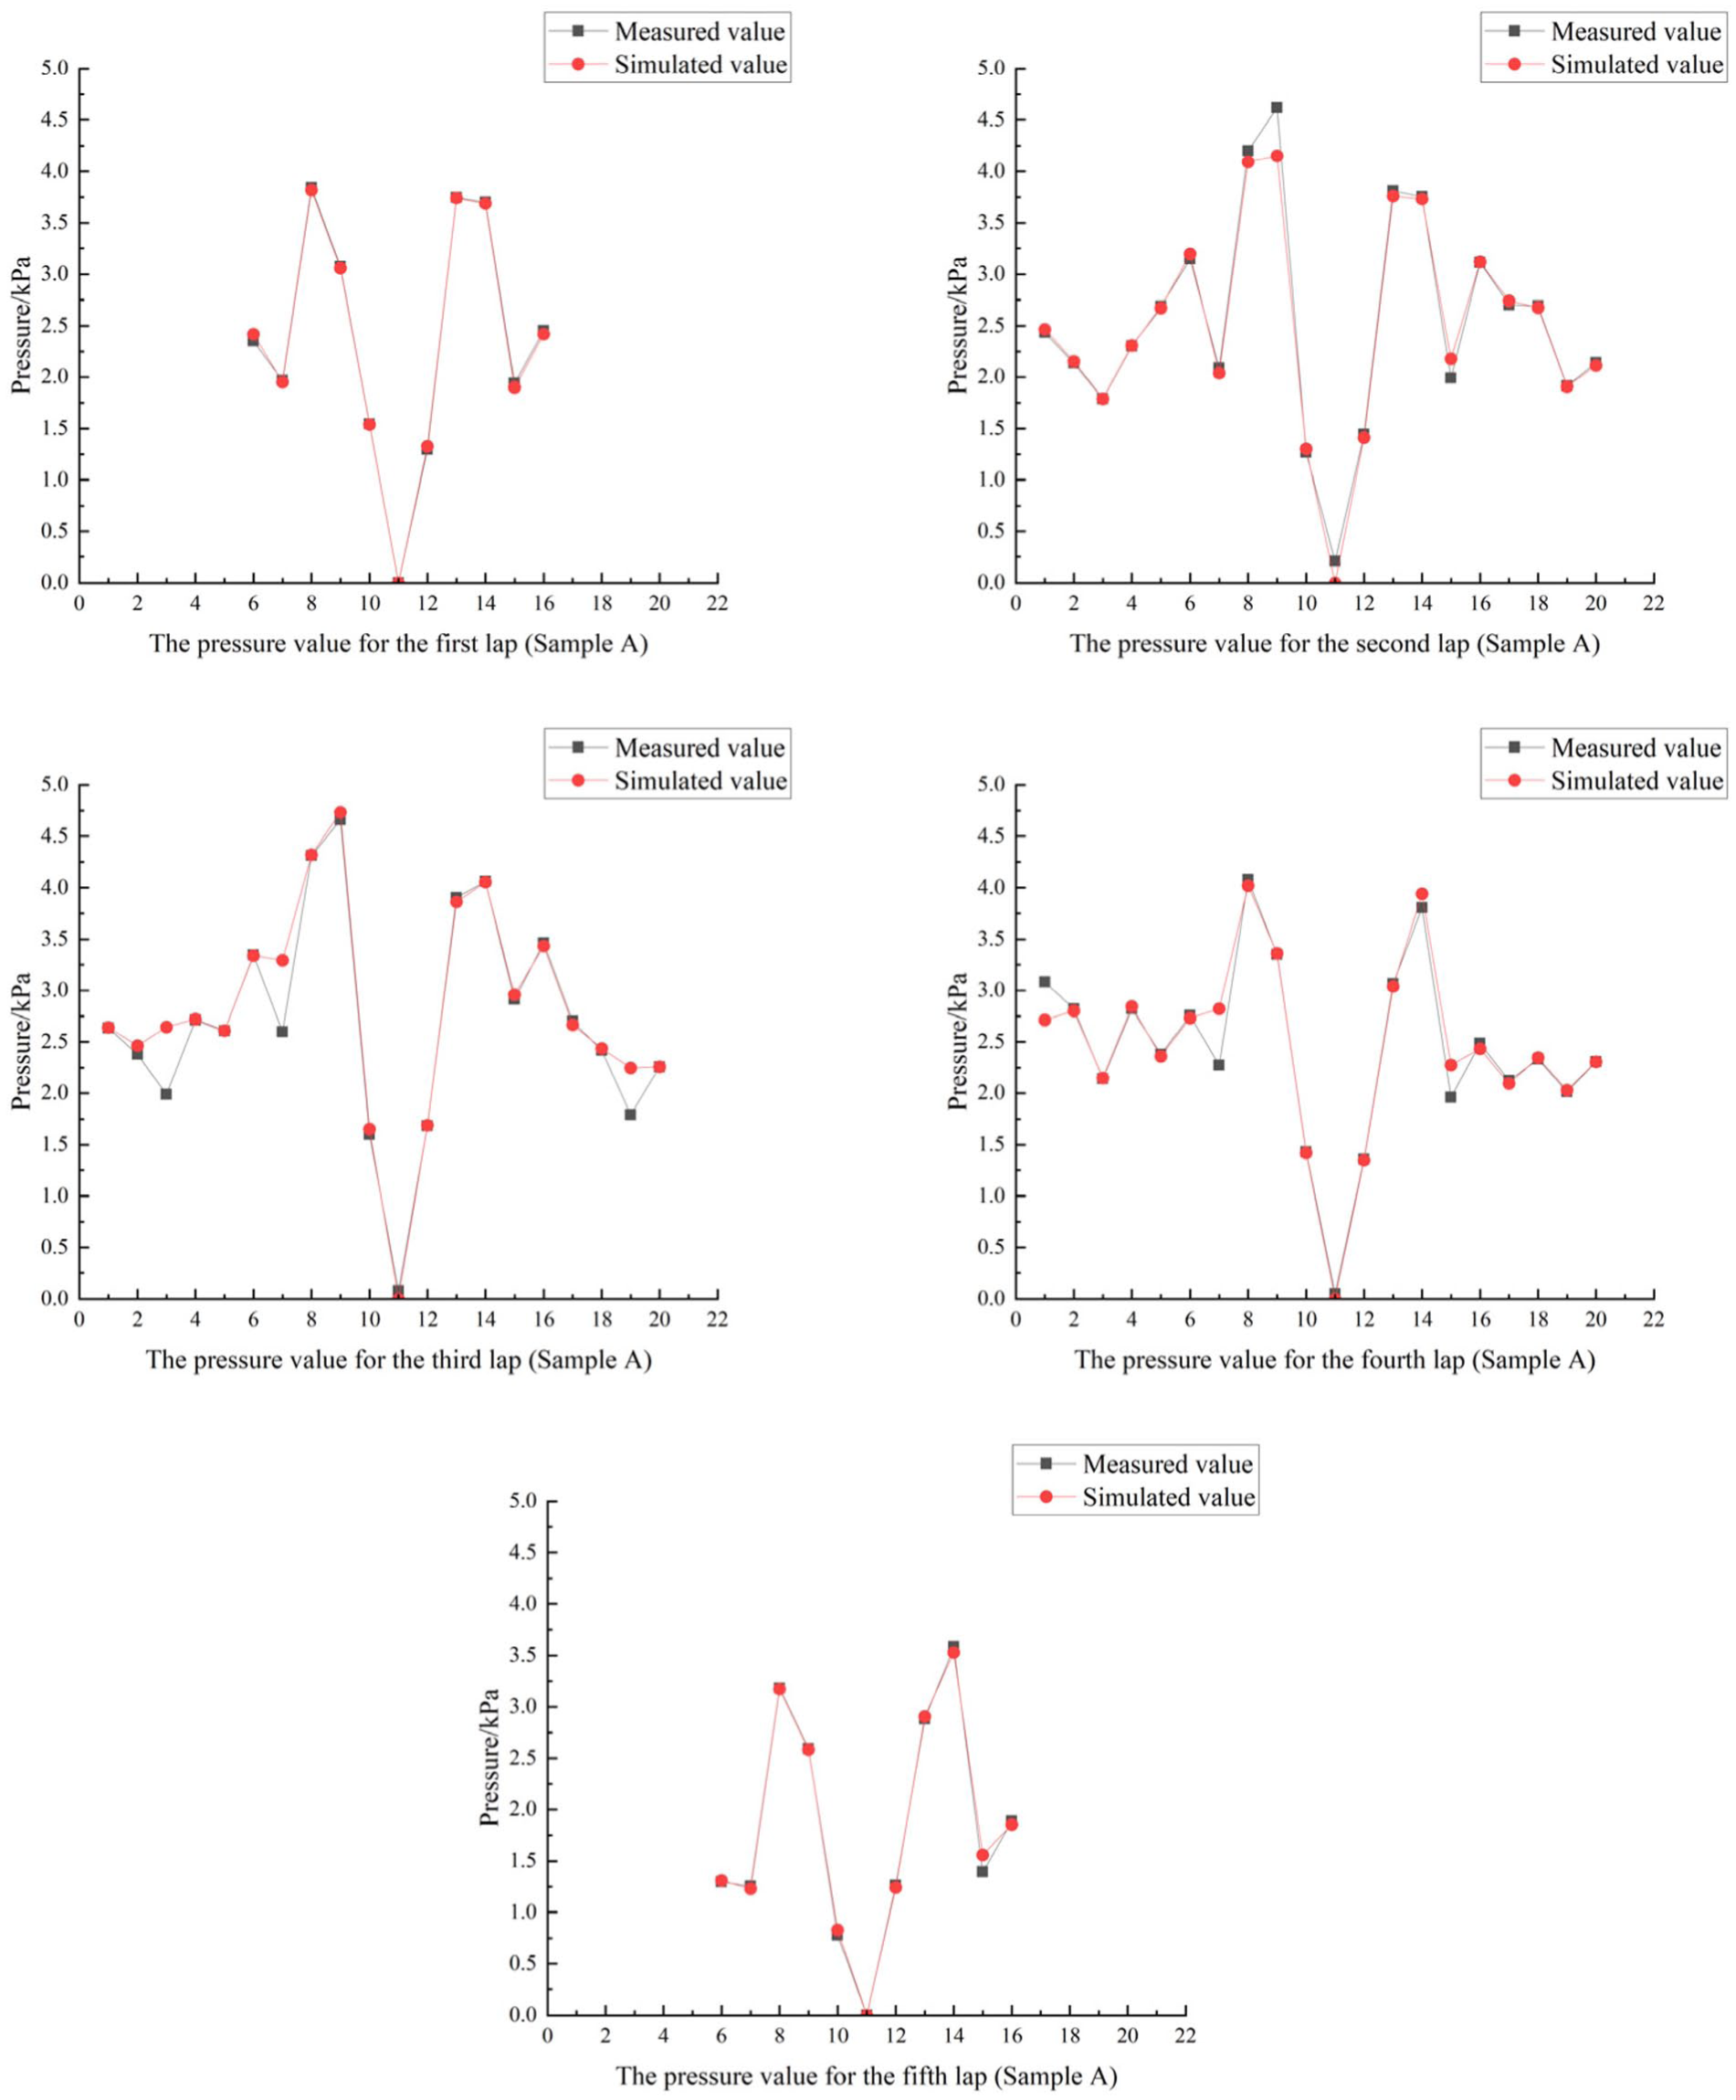
Comparison of finite-element simulation values and measured values of pressure for sample A model experimental waist protector.
From Figure 11, it can be seen that although the pressure simulation values of the sample A model experimental waist protector had certain differences from the experimental measured values, the overall pressure change trend was consistent. By calculating the pressure data error values of 82 test points of the sample A model experimental waist protector, the result showed that the average relative error between the simulated values and the measured values was 3.22%. At the same time, in order to further verify the accuracy and validity of the human waist model constructed in this study, a correlation analysis was conducted between the clothing pressure data obtained from the finite-element simulation and the measured data. Figure 12 shows the scatter plot of the pressure simulation values and the measured values for the second lap when the subject wore the sample A model experimental waist protector. The result indicated that the fitting degree R2 = 0.99, and the simulated values had a high correlation with the measured values, suggesting that this finite-element model can accurately predict the human waist pressure when wearing the waist protector.
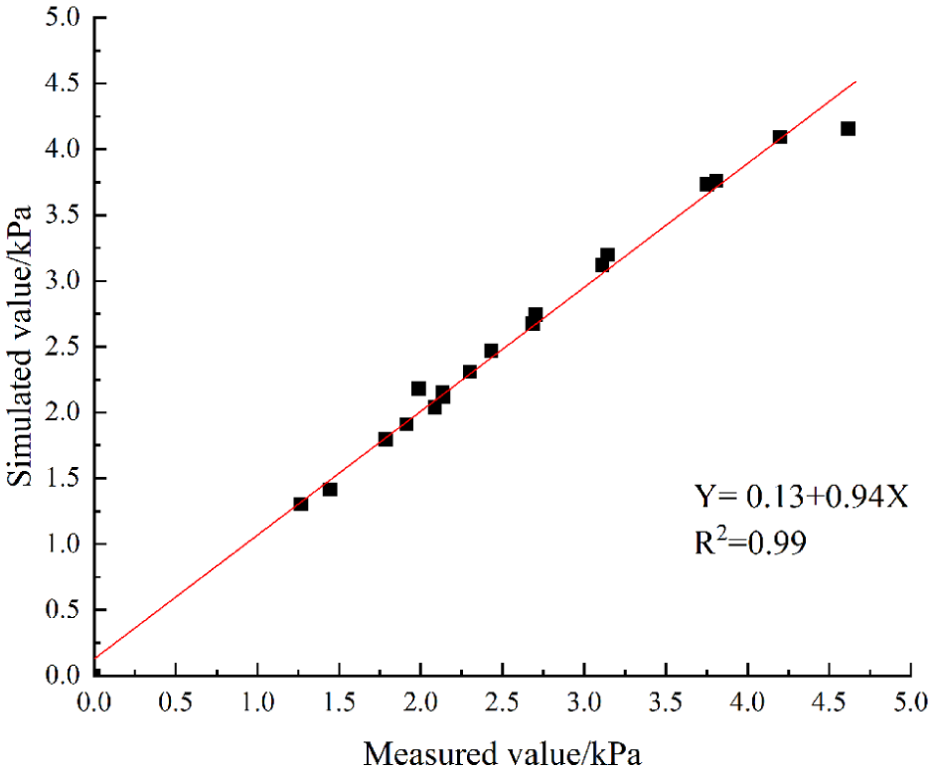
Scatter plot of simulated and measured pressure values.
The trend of volume reduction in the waist area distribution
In order to accurately analyze the compression of the soft tissues in the human waist after it is subjected to pressure, this study divided the waist cross-section into 20 pressure testing points (taking the second lap as an example). As shown in Figure 13, starting from the 20th test point, the 3 test points were grouped into one area, and a total of 10 areas were formed. To more clearly display the trend of displacement changes, the waist curves of the human body before and after wearing the waist protector were simplified. Among them, the outer curve represents the original waist curve before compression, while the inner curve represents the waist deformation curve after wearing the waist protector. Points A and B represent two adjacent test points on the human waist before the pressure is applied to it, whereas points C and D represent the corresponding test points after the waist has deformed under the pressure.
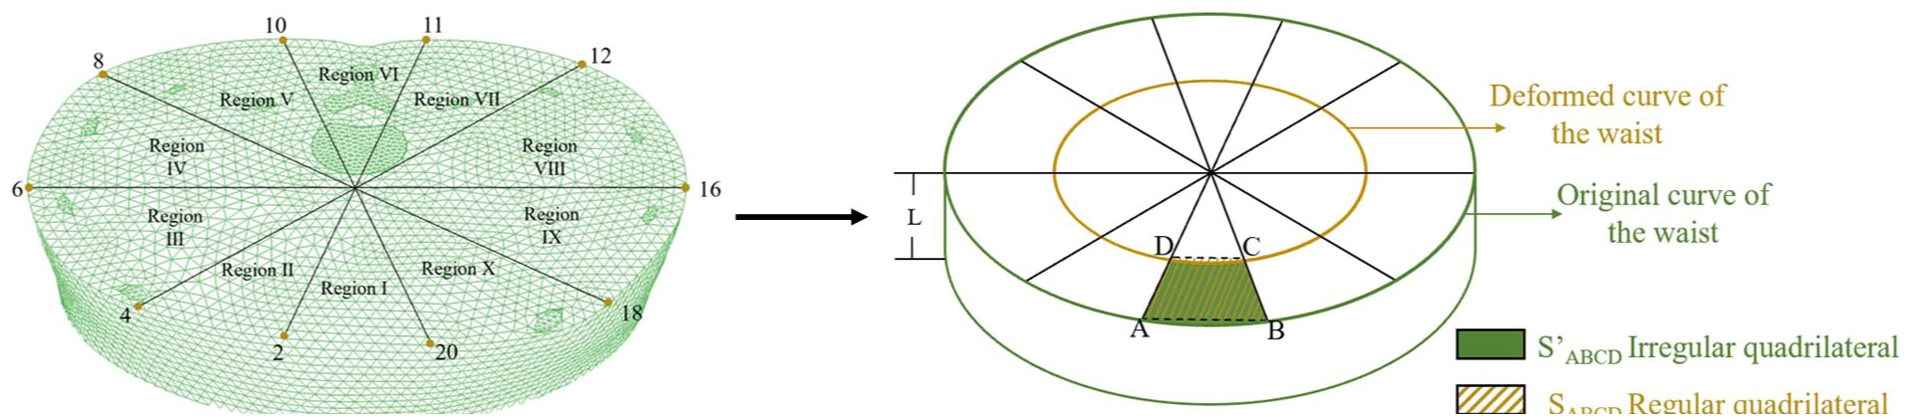
Waist soft tissue division diagram and volume reduction diagram.
Figure 13 shows that the area reduction after the two adjacent points in the waist are compressed forms an irregular quadrilateral shape, and the area of this quadrilateral is S’ABCD, Since there are two curved sides in this quadrilateral, its area is difficult to calculate using a formula. Moreover, the pressure exerted by the waist protector on the human waist is limited. To simplify the calculation process, this study assumes that S’ABCD = SABCD, where SABCD is a regular quadrilateral whose area can be calculated using a formula.
Suppose AB = a, BC = b, CD = c, DA = d, and z = (a + b + c + d)/2, the formula for the area reduction S is as follows:

Since the waist protector has a certain width, the reduction in the volume of the waist when a person wears the waist protector can be expressed as

Here V represents the volume reduction between two adjacent points after the waist is compressed, S represents the area reduction between the two adjacent points, which can be calculated using the above area formula, and L represents the width of the waist protector between two adjacent cross-sections.
According to formulas (3) and (4), the volume reduction data of the sample A model experimental waist protector under different wearing time periods (0, 1, 2, and 3 h) can be calculated as shown in Figure 14.
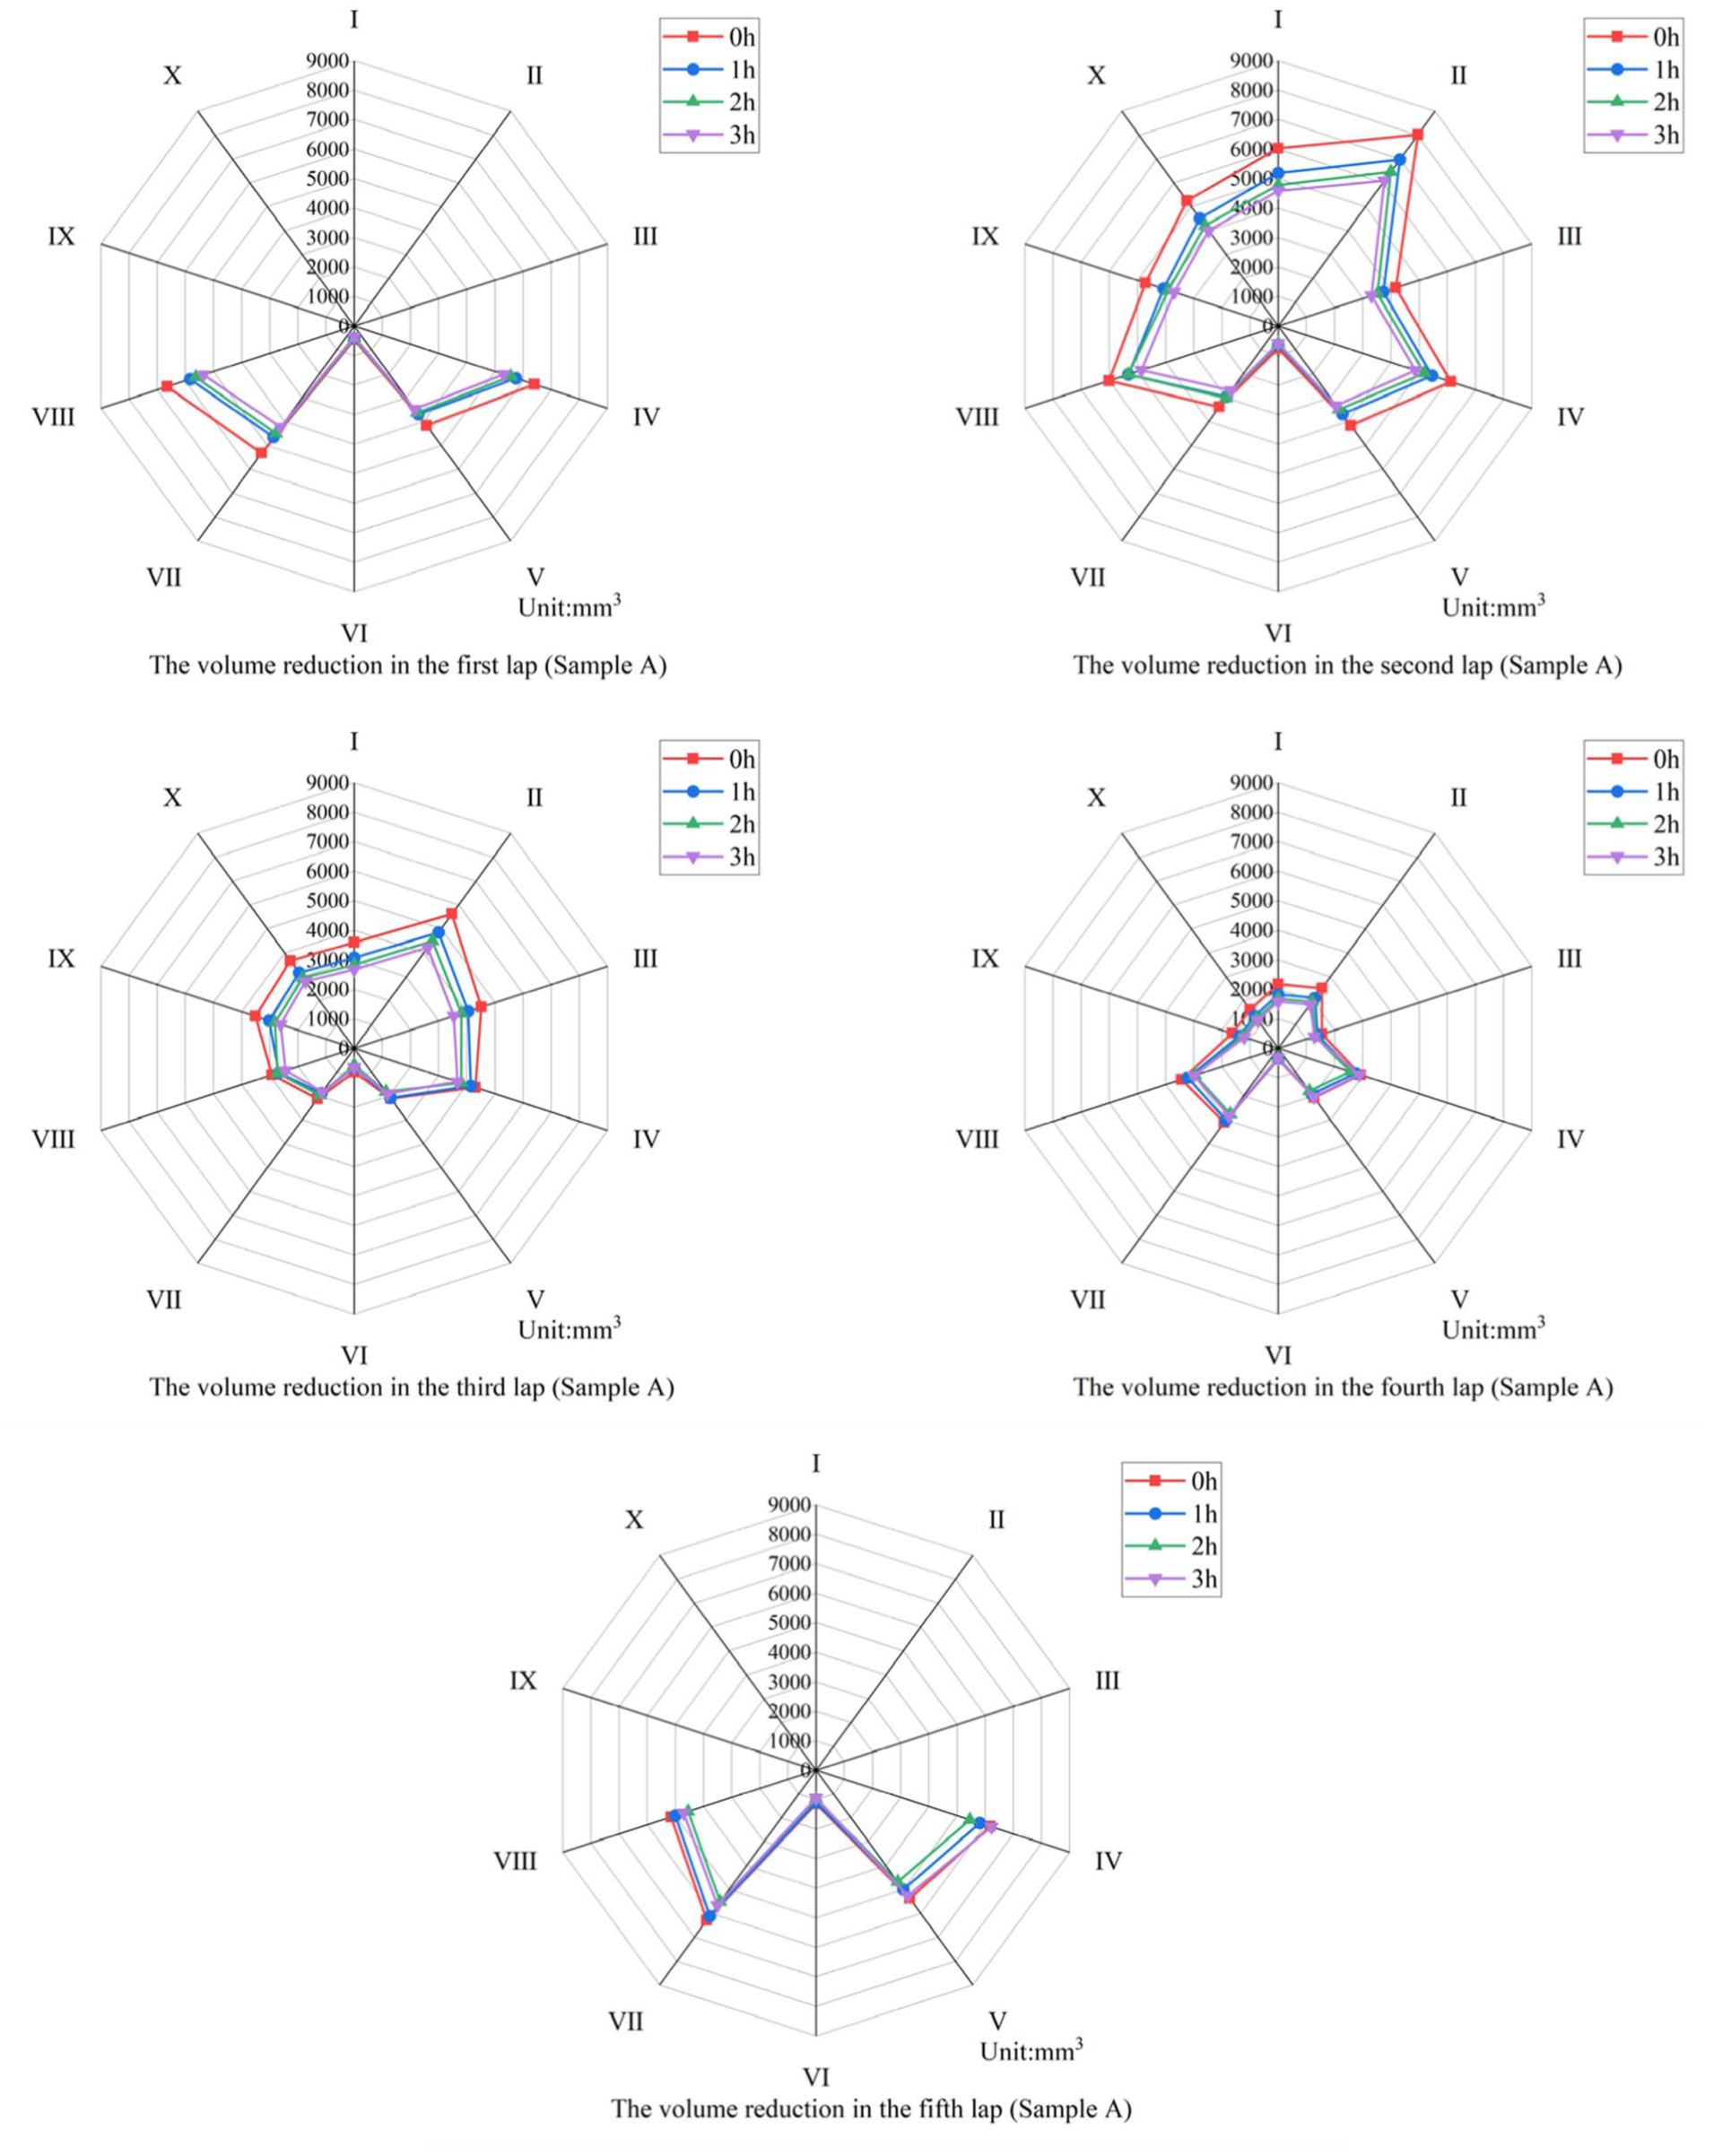
Volume reduction of the waist cross-section at four time points (sample A).
As shown in Figure 14, the volume reduction of the soft tissues in the waist area was centered around region VI and exhibited a nearly symmetrical characteristic, which corresponded to the symmetrical trend observed in the pressure distribution results mentioned earlier. From the perspective of the distance relationship between the soft tissue and the bones, the maximum volume reduction of the soft tissue in the waist area occurred near region II, whereas the minimum value was located in region VI. This was because region II was farther from the bones, and the soft tissue layer was relatively thicker. Under the external pressure, the displacement of the soft tissue was greater, thus resulting in a larger volume reduction in this region. Region VI was located in the posterior concave area of the human body. The waist protector had a lower degree of fit with this area, resulting in a smaller contact pressure, and the degree of soft tissue compression and deformation was limited. Therefore, the volume reduction was the smallest. From the perspective of waist protector, regions V and VII were located at the support strip area. The pressure value in this area was relatively high. However, as can be seen from Figure 14, the volume reduction in these regions did not reach the maximum value. This was because these two areas were close to the bones and had limited compressible space, thus resulting in a smaller volume reduction.
Furthermore, the volume reduction of the soft tissues on the anterior side of the waist was overall greater than that on the posterior side. This was related to the thickness distribution of the soft tissues on the anterior and posterior sides of the waist. Compared with the posterior side, the anterior soft tissue layer was thicker and had a greater compressive deformation capacity, thus exhibiting a larger volume reduction. The data on the volume reduction of soft tissues in the waist region showed that the volume reduction was the greatest in the second lap and the smallest in the fourth lap. This result was related to the structural differences of the soft tissues in the upper and lower parts of the waist. The upper part of the waist had thicker soft tissues, whereas the lower part was close to the pelvis and the soft tissues are subject to greater constraints from the bones, resulting in a relatively smaller volume reduction. From the perspective of the waist protector structure, due to the design of the waist strap, region II was subjected to double pressure, resulting in a further increase in the volume reduction of the soft tissues in this area. In contrast, in region X, due to the presence of a suspended state, the waist protector did not make sufficient contact with the human waist, resulting in a smaller pressure value and, consequently, a smaller volume reduction.
As the wearing time increased, the overall volume reduction of the soft tissues in the waist showed a gradually decreasing trend and tended to stabilize. This change process reflected the mechanical response changes of the waist protector material under continuous loading, as well as the adaptation process of the human soft tissues to external constraints. Compared with the posterior side of the waist, the decrease in the volume reduction of the soft tissues on the anterior side of the waist was more significant. The main reason was that the anterior side of the soft tissue layer was thicker, which made the relaxation of the waist protector material more obvious. As the contact pressure decreased, the variation range of volume reduction also became larger. Based on the above analysis, in the design process of the waist protector, the waist protector can be designed with different tightness levels in different distribution areas according to the distribution trend of volume reduction. While ensuring the basic protective performance of the functional waist protector, it can also meet the dressing comfort requirements of the human body. This conclusion provides a theoretical reference for the optimization design of functional waist protectors.
Conclusion
In this study, through CT scanning of the waist, construction of a three-dimensional model of the human waist, and establishment of a finite-element model of waist protector–human waist, the pressure and displacement distribution trend of the waist after wearing a waist protector were simulated and analyzed. The research results showed the following.
(1) The pressure values obtained from the finite-element simulation were highly correlated with the actual measured pressure values, indicating the reliability of this model in predicting the pressure and displacement distribution in the waist region. By summarizing the pressure distribution and displacement change patterns during the four time periods (0, 1, 2, and 3 h) of human body wearing the waist protector, it was found that factors such as the curvature radius of the waist, the thickness of the soft tissue, the position of the bones, and the structural design of the waist protector all have significant influences on the pressure and displacement distribution trends.
(2) Meanwhile, as the wearing time of the waist protector increases, the pressure on the human waist showed a gradually decreasing trend and then stabilizes. To further analyze the displacement and deformation of soft tissues after human body compression, this study calculated the volume reduction at different parts of the waist, analyzed the key role of the morphological and tissue characteristics of the human waist in the design of waist protector, and examined the structural characteristics of the waist protector during long-term wearing.
(3) The results of this study indicated that when designing functional waist protector, not only should the shape and tissue characteristics of the human waist be taken into account, but also the material, the structure of the waist protector, and the position of the support strip should be comprehensively considered. Targeted improvements should be made to the waist protector to ensure its basic support and protective performance while minimizing the discomfort caused by pressure and soft tissue displacement on the human body. This study provides certain theoretical references and data support for improving the overall protective performance and wearing comfort of functional waist protector.
Footnotes
Declaration of conflicting interests
The authors declared no potential conflicts of interest with respect to the research, authorship, and/or publication of this article.
Funding
The authors disclosed receipt of the following financial support for the research, authorship, and/or publication of this article: This work was supported by a key project of the State Key Laboratory of Bio-Fibers and Eco-Textiles (Qingdao University) (grant number ZDKT202103).
Data availability statement
Data are available on request through the corresponding author.