
Abstract
In response to the problems of the traditional limit oxygen index determination method, such as the cumbersome operation process, reliance on table lookup for result calculation, which is prone to introducing human errors, and a high dependence on the subjective experience of the operator, which affects the accuracy of the test results, in this paper, the calculation method of logistic regression binary classification is used to establish an oxygen index function model and, through Origin software, to fit the oxygen index function curve to calculate the limit oxygen index. The oxygen index function model was analyzed. The coefficient of determination, R2, was 0.6971, with P = 7.3675 × 10⁻¹⁰. The model had good fitting effect and stability. Through a comparison of tests using the logistic regression method and the lookup table method, it was indicated that the logistic regression method effectively shortened the test cycle, and the test results had low dispersion. This method could retain higher stability and consistency under different temperature and humidity conditions. The deviation between the limit oxygen index determined by the logistic regression method and the oxygen index determined by the table lookup method is less than 0.2%. The logistic regression method can be used to effectively avoid the generation of invalid data during the test, improving the traditional method of determining the oxygen index. It is simple to operate, quick in calculation, and accurate in results. This method can be used to effectively and accurately determine the limit oxygen index of textile materials.
In actual fire accident scenarios, once clothing catches fire, the harm it causes to the human body is far greater than the damage caused by direct exposure of the human body to the open flame.1–3 Flame-retardant fabric, as a key component of flame-resistant protective clothing, can significantly slow down the burning speed of the fabric surface.4–6 Once the fire source has been removed, the fabric can quickly extinguish itself.7, 8 At the same time, during the burning process, the burning part will rapidly carbonize, without causing melting, dripping, or hole formation. The limit oxygen index is an important evaluation criterion for the flame-retardant performance of flame-retardant fabric.9, 10 A low limit oxygen index indicates that the material will continue to burn when removed from the fire source; a high limit oxygen index indicates that the material will extinguish itself when removed from the fire source.11, 12
Currently, the limit oxygen index of textiles is tested in accordance with the standard GB/T 5454-1997. 13 The sample is clamped onto a sample holder and placed vertically inside a combustion cylinder. In an upward-flowing oxygen–nitrogen gas stream, the upper end of the sample is ignited, and its combustion characteristics are observed. The continuing burning time or damage length is compared with the specified limit value. By testing the combustion conditions of a series of samples under different oxygen concentrations, the minimum oxygen concentration value for maintaining combustion can be determined. In the tested samples, 40% to 60% of the samples should exceed the specified continuing burning and smoldering time or damage length. 14 To determine the limit oxygen index, first the range of the oxygen index is determined, then the detection range is gradually reduced, and the combustion state is recorded and assigned a reaction symbol.15, 16 Finally, a lookup table is consulted to calculate the limit oxygen index. This test method has a cumbersome operation process, requiring several tests and gradual adjustment of the oxygen concentration to approach the limit value; the calculation results are heavily dependent on table lookup, which is prone to introducing human errors and also reduces the detection efficiency; at the same time, the test process is highly dependent on the subjective experience of the operator, affecting the accuracy of the test results.
Logistic regression, as a classic statistical learning method, is mainly used to solve classification problems, dealing with binary or multiclass problems caused by the dependent variable. Among these, binary classification problems are the most common, such as yes/no or 0/1 scenarios.17–19 The core of logistic regression lies in constructing a model that can predict the probability of a sample belonging to a certain category, thereby achieving the purpose of classification. According to the standard GB/T 5454-1997, the combustion of the sample presents two typical states. The first state is that when the sample is ignited, it immediately goes out, or the afterflame time and afterglow time are less than 2 min, or the damage length is less than 40 mm. This indicates that the oxygen concentration is too low. The second state is that the sample continues to smolder after ignition, or the afterflame time and afterglow time exceed 2 min, or the damage length is greater than 40 mm. This indicates that the oxygen concentration is too high. These two combustion states precisely constitute the binary classification scenario in logistic regression.
In this study, an oxygen index function model is established using a binary logistic regression algorithm. With the aid of Origin software, the oxygen index function curve is fitted to calculate the limiting oxygen index; this effectively avoids the generation of invalid data during the test and optimizes the traditional method for limiting oxygen index determination. Distinct from the traditional discrete table lookup evaluation mode, in this testing method, a binary logistic regression model is innovatively applied to the quantitative assessment of the limiting oxygen index of textiles. A tailored oxygen index function model is constructed based on the critical combustion characteristics of fabrics, realizing continuous quantitative characterization of combustion critical states. Compared with the traditional lookup table method, the proposed testing method features simple operation, effectively reduces reliance on the subjectivity of operators, and boasts high calculation efficiency and accurate results.
Model establishment
Principle of logistic regression
In the logistic regression model, the sigmoid function plays a crucial role. The function is denoted as a sigmoid function, g(z), and its mathematical expression is 1/(1 + e−z). The graph of the sigmoid function resembles the shape of the letter S.20–22 From the perspective of the domain and range of the function, the independent variable z of the sigmoid function can take values within the real number range, and its output value is strictly limited to the closed interval [0, 1]. When the independent variable z approaches negative infinity, the function value g(z) approaches 0 infinitely; when the independent variable z approaches positive infinity, the function value g(z) approaches 1 infinitely. This characteristic enables the sigmoid function to map any real number input to the interval [0, 1], providing a function-based expression for the probability of an event occurring.
During the detection of the limit oxygen index, the sigmoid function can be effectively applied to the classification analysis of the oxygen concentration state during combustion. The purpose of the limit oxygen index detection is to determine the minimum oxygen concentration required for the material to sustain combustion. In this process, the combustion state of the material can be divided into two situations: the oxygen concentration is too low and the oxygen concentration is too high. For ease of analysis and data statistics, the situation of low oxygen concentration is recorded as 0, and the situation of high oxygen concentration is recorded as 1. By mapping the sigmoid function to this detection process, its output value can be used to accurately determine the current oxygen concentration state. When the output value g(z) of the sigmoid function approaches 0, this indicates that the current oxygen concentration is too low and it is difficult for the material to sustain continuous combustion; when the output value g(z) approaches 1, this indicates that the current oxygen concentration is too high and the material can more easily sustain combustion.
Oxygen index function model
The limit oxygen index is an important indicator for evaluating the combustion performance of textile materials. It refers to the minimum oxygen concentration required for a textile material to maintain a burning state in an oxygen–nitrogen mixed gas environment under specified test conditions. From a probabilistic perspective, at this minimum oxygen concentration, the textile material has a 50% chance of burning. Based on this reasoning, a logistic regression method can be used to construct a function model between the oxygen index and the combustion probability. Logistic regression can be used to estimate the probability of an event based on given independent variable data. The oxygen index is mapped to the combustion probability and an oxygen index combustion probability logistic regression function (referred to as the oxygen index function) is established, as
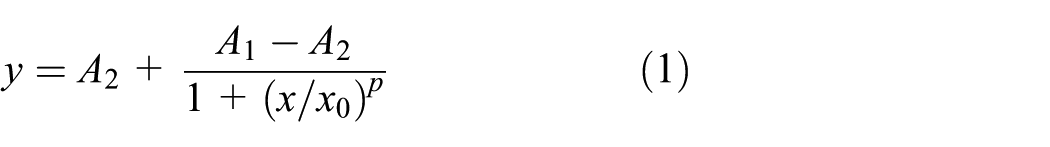
where y represents the probability of textile material combustion, as a percentage; x represents the oxygen concentration, as a percentage;
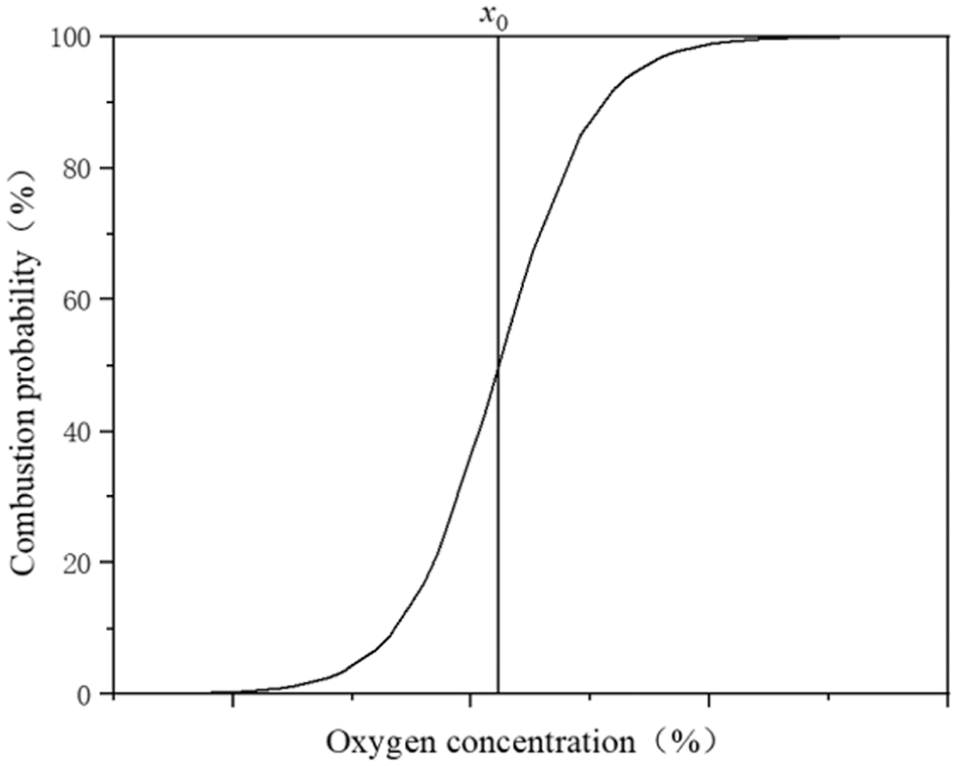
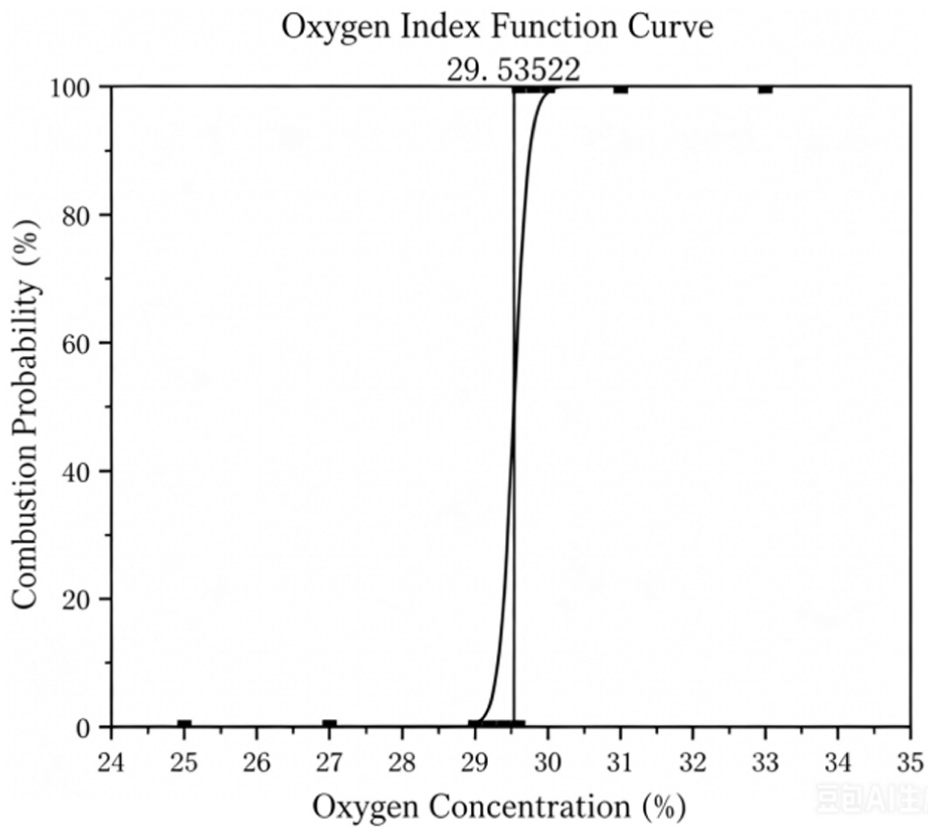
Oxygen index function.
The oxygen index function can clearly describe the combustion probability of textile materials under different oxygen concentrations. By plotting the oxygen index function, one can visually observe the trend of the combustion probability of textile materials changing with the oxygen concentration. In the graph, the horizontal axis usually represents the oxygen concentration and the vertical axis represents the combustion probability of the textile material. When the oxygen concentration is low, the combustion probability of the textile material approaches 0%. As the oxygen concentration gradually increases, the combustion probability of the textile material also increases. When the limit oxygen index is reached, the combustion probability of the textile material is 50%. On further increasing the oxygen concentration, the combustion probability of the textile material approaches 100%.
Experiment
Experiment procedure
Experiment preparation
In the experiment, a KST921 fully automatic oxygen index tester with an intelligent touch screen, produced by Shandong Kastar Instrument Co., Ltd, was used. During sample preparation, at least 21 samples were cut from the sample along the warp and weft directions. Each sample size was 150 mm × 58 mm, and the samples were conditioned at a temperature of (20 ± 2)°C and a relative humidity of (65 ± 4)% for 24 h. The experiment was conducted under environmental conditions of an ambient temperature of 10°C to 30°C and a relative humidity of 30% to 80%.
Selection of initial oxygen concentration
When the oxygen index of the tested sample is completely unknown, the sample can be ignited in the air and the initial oxygen concentration can be determined based on its burning state. If the sample burns rapidly, the initial oxygen concentration can start from around 18%; if the sample burns slowly or the burning state is unstable, the initial oxygen concentration should be set at approximately 21%; if the sample cannot continue to burn in the air, the initial oxygen concentration should be no less than 25%.
Test data selection
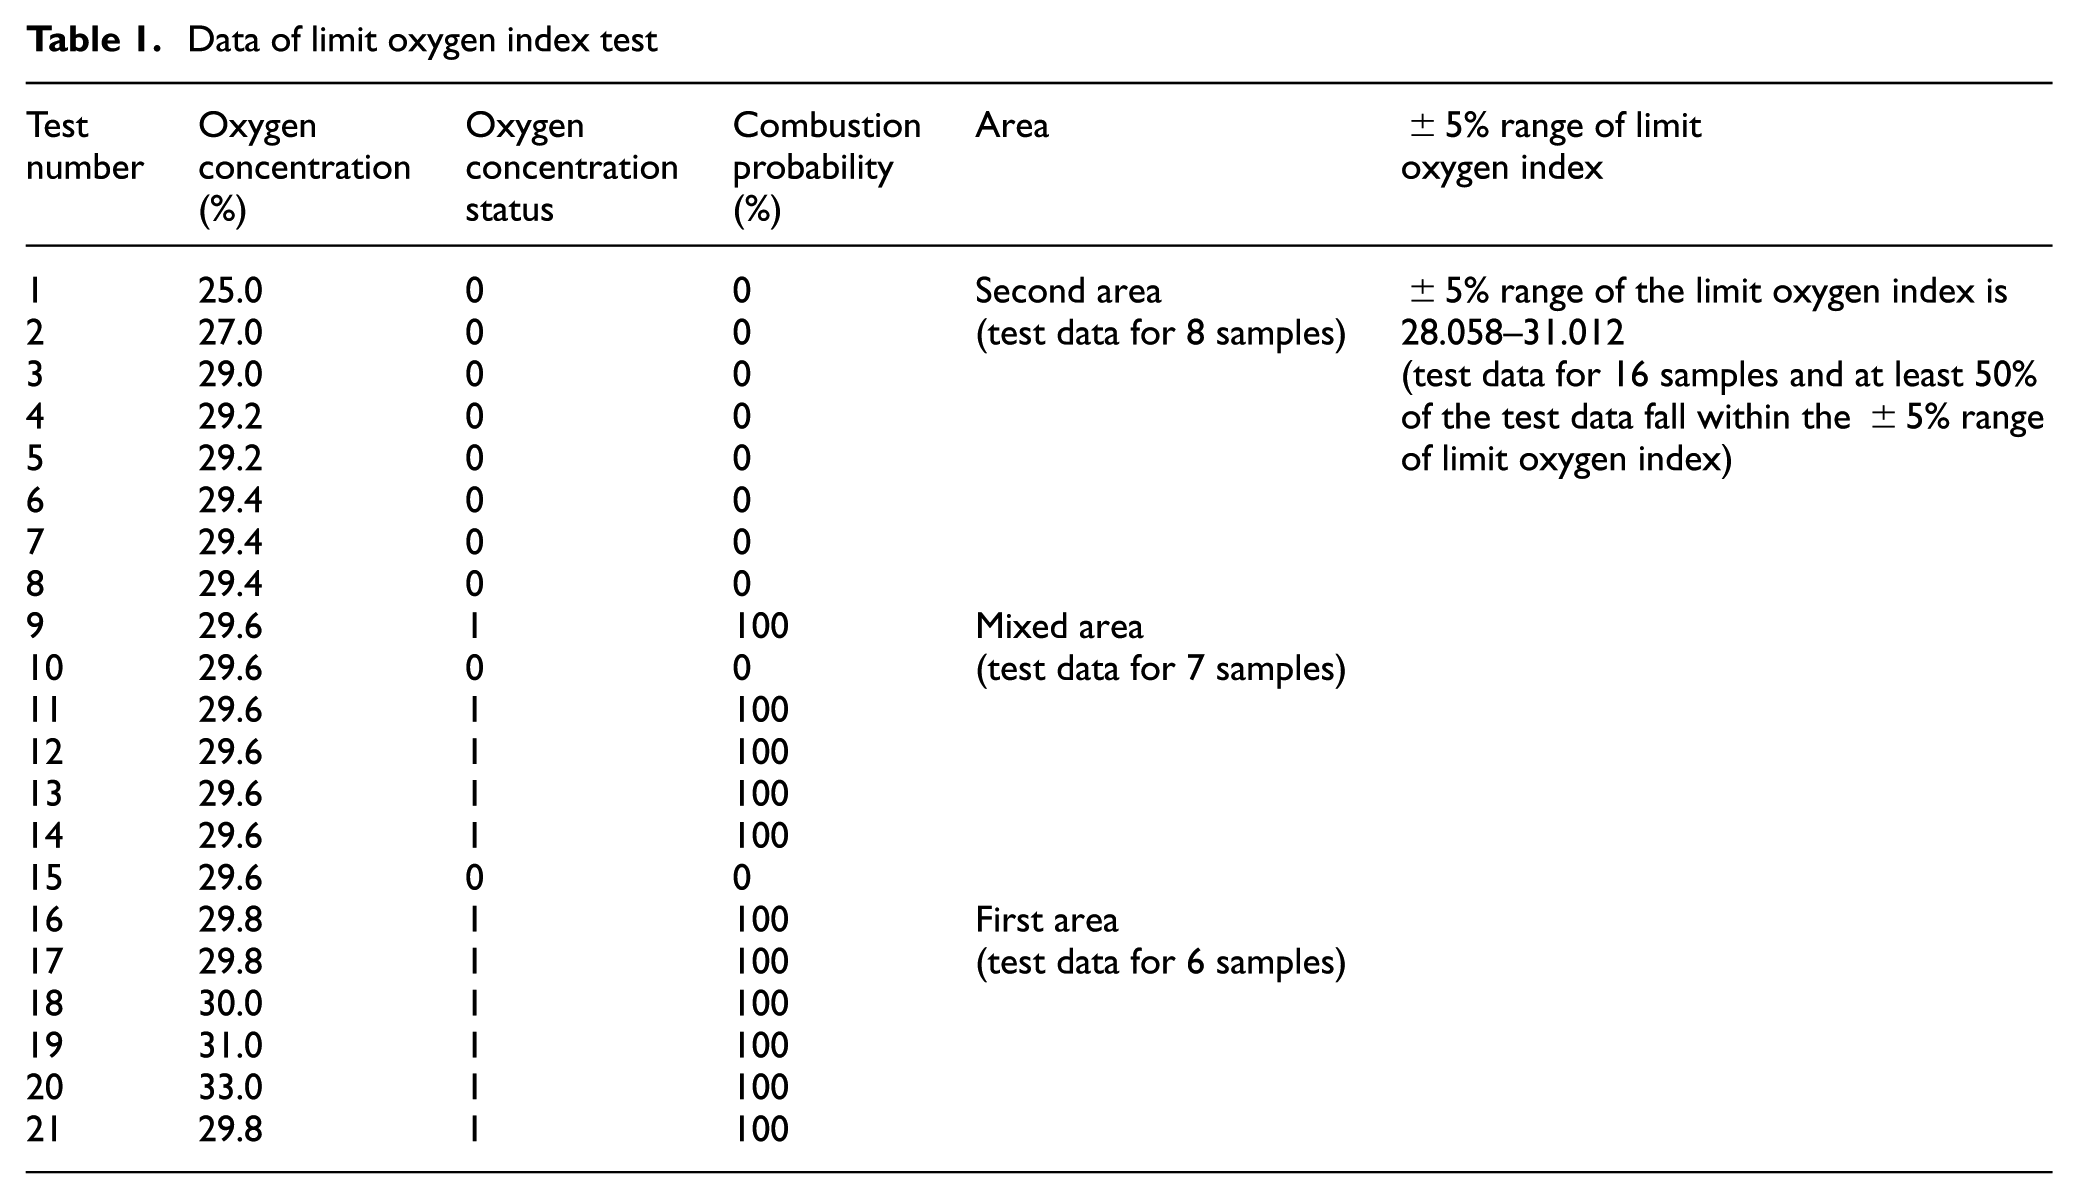
Among the 21 sets of test data, at least 15% of the data should fall within the first region, where the oxygen concentration is too high and is denoted as 1; and at least 15% of the data should fall within the second region, where the oxygen concentration is too low and is denoted as 0. In addition, at least 50% of the test data should fall within the mixed zone. Within this zone, the oxygen concentration varies; some areas have excessively high oxygen levels, while others have excessively low oxygen levels. These values are distributed within a ±5% range of the limit oxygen index. If the test data do not meet these requirements, the sample quantity should be increased.
Logistic regression
Data fitting
Origin is a software package for scientific graphing and data analysis, which enables curve fitting, integral calculation, logistic regression, and other data analysis functions.23,24 After starting up the Origin software, the software will automatically create a workbook named BOOK1. The experimental data are entered into BOOK1 of the Origin software. The oxygen concentration is taken for the x-axis data and the combustion probability is taken for the y-axis data. The experimental data are given in Table 1. After selecting all the data, the scatter plot in the charting bar is selected. Finally, through the analysis function of the Origin software, nonlinear curve fitting is used for logistic regression. The logistic function is selected, the maximum value of the x data type range is set to 100 and the minimum value to 0. A1, A2, and p are selected as the three fitting parameters.
Data of limit oxygen index test
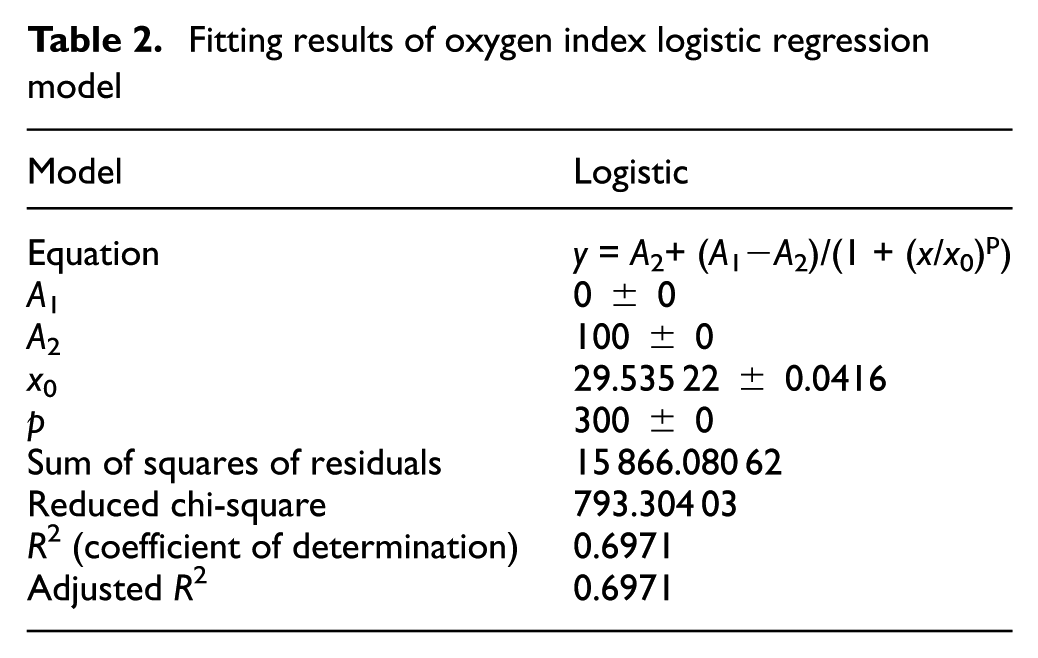
The parameter p is an important shape parameter of the logistic function, determining the steepness of the curve. In the limit oxygen index test, the combustion state of the material changes with the oxygen concentration in a typical steep threshold response characteristic. A slight change in oxygen concentration can lead to a rapid transition between the burning and extinguishing states. Therefore, the fitted curve needs to have a relatively steep S-shaped form. During the test process, in combination with the physical laws of the oxygen index test, through several sets of fitting calculations and comparisons, it was determined that p = 300 produces a curve form that optimally matches the actual data trend, and ensures that the estimated limit oxygen index is stable and the standard error is small. Therefore, when performing logistic fitting in Origin software, the parameter p was fixed at 300 to enhance the model reliability and the interpretability of the physical phenomenon. In practical testing, if the fixed parameter p = 300 fails to fit the combustion curves of textile materials, the value of p can be adjusted appropriately, according to the actual combustion characteristics of the tested fabrics.
Using Origin software for logistic regression analysis, the oxygen index function was obtained, as
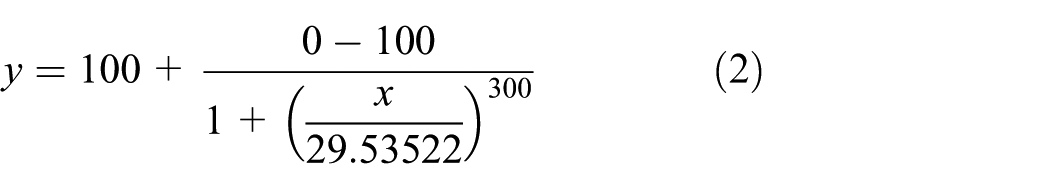
The oxygen index function curve data are shown in Figure 2. When the oxygen concentration is 29.535 22%, the combustion probability is 50%; then the limit oxygen index of this sample is 29.535 22%. Rounded to three decimal places, it becomes 29.535%.
Oxygen index function.
Logistic regression analysis
The results of the logistic regression model fitting for the oxygen index given in Table 2 show that the coefficient of determination (COD), R2, is 0.6971, and the adjusted R2 is also 0.6971. This indicates that the model can explain approximately 69.71% of the variance in the dependent variable, and the fitting effect is good. The reduced chi-square value is 793.304 03. Considering the characteristics of the experimental data scale, this indicates that the deviation between the fitted values and the measured values is within a reasonable range, and the fitting accuracy meets the research requirements. The uncertainty analysis of parameter estimation shows that the fitted value of the limit oxygen index, x0, is 29.535 22, and the standard error is only 0.0416. This indicates that the parameter estimation fluctuation is extremely small, and the results have high stability. The standard errors of parameters A1, A2, and p are all 0; this is highly consistent with the experimental design for the binary classification of combustion states. The parameter estimation results are reliable. Sensitivity analysis was conducted on parameter p. After adjusting the gradient within its reasonable fluctuation range, it was found that the deviation of the calculated value of the limit oxygen index is at a relatively low level, indicating that the value of p has a relatively small effect on the final result, and the model stability is good.
Fitting results of oxygen index logistic regression model
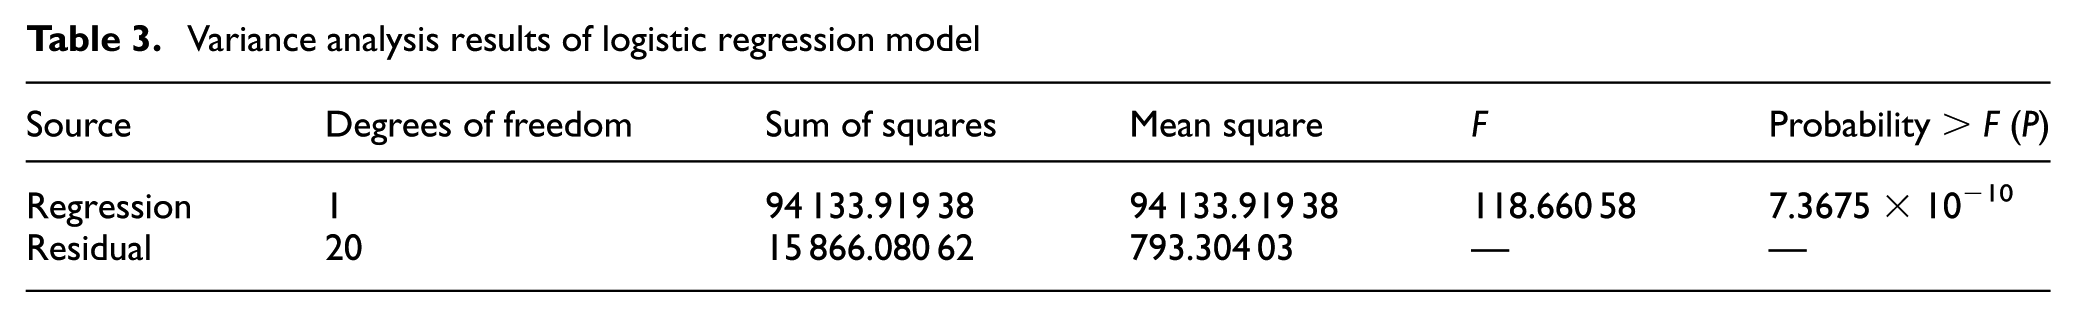
The variance analysis results of the logistic regression model given in Table 3 indicate that F of the regression term is 118.660 58, and the corresponding value of P is 7.3675 × 10⁻¹⁰. This shows that, at the 0.05 significance level, the fitted equation is significantly better than the zero model y = 0, and the model as a whole is statistically significant. 25 The residual sum of squares of the model is 15 866.080 62, and the residual distribution as a whole conforms to the characteristics of a normal distribution, with the deviation degree within the controllable range, and no obvious systematic deviation occurring. This further verifies the reliability of the model fitting.26, 27
Variance analysis results of logistic regression model
The random errors during the experiment mainly arise from minor fluctuations in oxygen concentration control and human errors in judging the combustion state. These have been controlled within a reasonable range through standardized experimental procedures and parallel tests. Systematic errors are avoided by strictly calibrating the limit oxygen index tester before the experiment. Data dispersion is mainly caused by the unevenness of the textile materials themselves. Based on the goodness of fit of the model, the dispersion is within an acceptable range and has not significantly affected the model fitting effect.
Test data analysis
As can be seen from Table 1, in the first area, where the oxygen concentration is too high, there are six samples, accounting for 29% of the total number of samples; in the second area, where the oxygen concentration is too low, there are eight samples, accounting for 38% of the total number of samples. The mixed area contains both data with high oxygen concentration and data with low oxygen concentration, meeting the requirement that at least 50% of the test data are within the ±5% range of the limit oxygen index. The overall distribution of the test data meets the requirements, indicating that this test is feasible and the detection results are reliable. Additionally, the more data points within the ±5% range of the limit oxygen index there are, the more accurate are the detection results.
Test analysis
Comparative analysis of two testing methods
To verify the superiority of the logistic regression method and the lookup table method, using the same specification of polyester fiber coated fabric as the test sample, three parallel tests were conducted for each method, in two different temperature and humidity environments. The test results are given in Table 4.
Comparative analysis of two testing methods
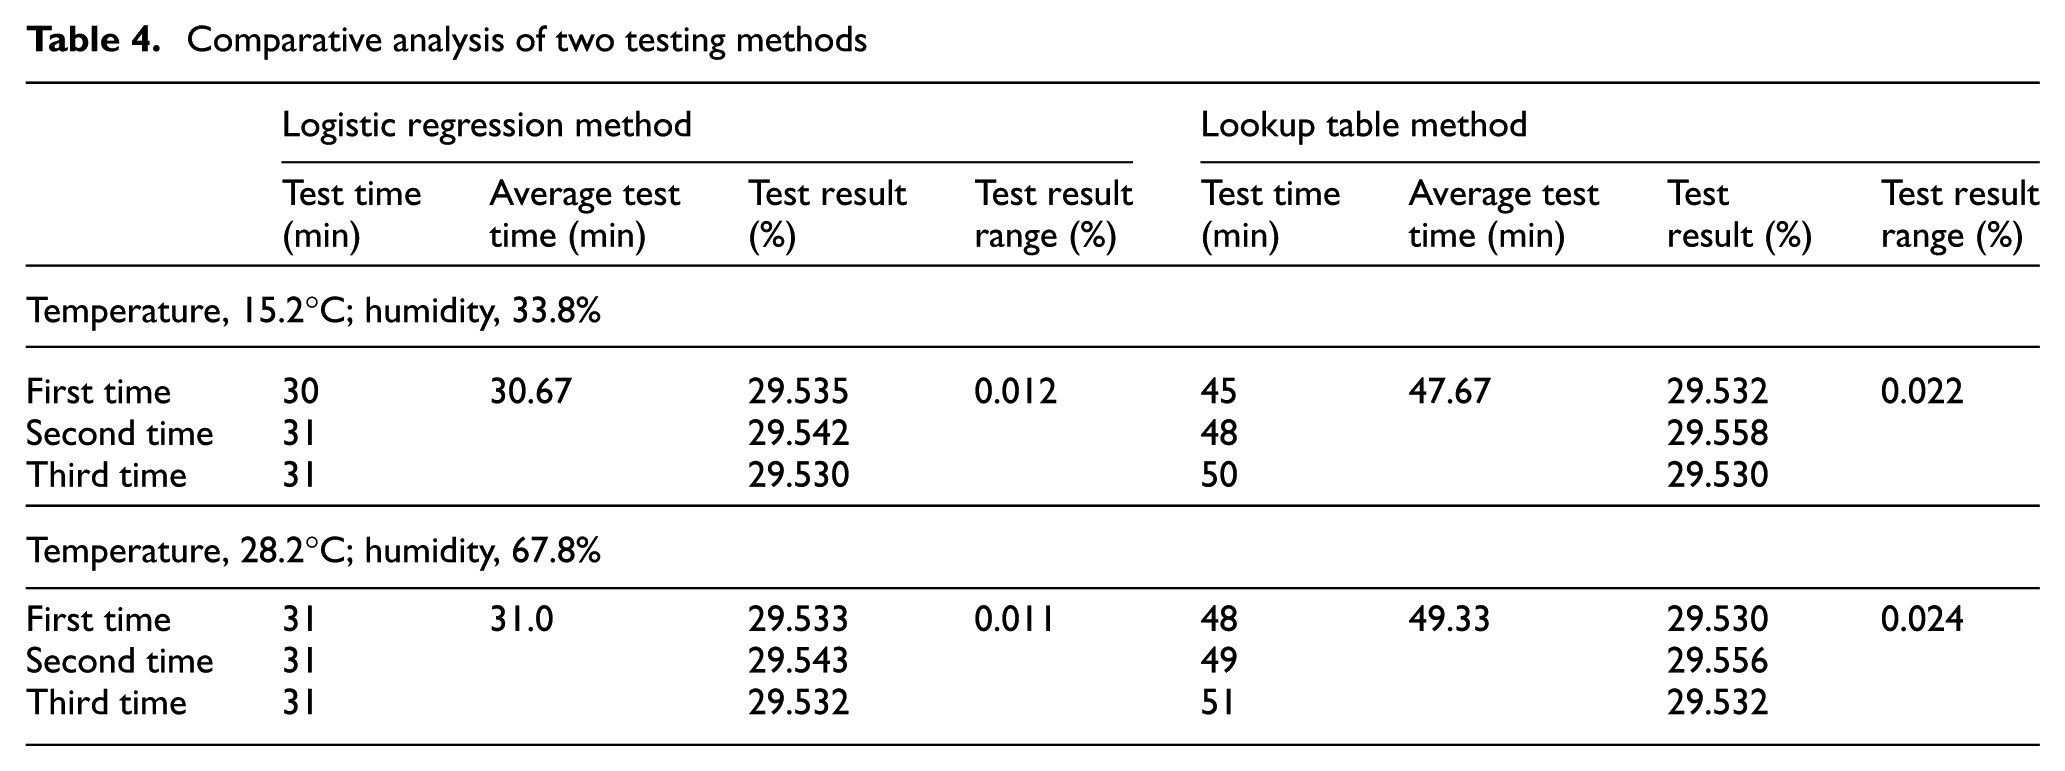
Under the two temperature and humidity conditions, the average test times for the logistic regression method were 30.67 min and 31.0 min, respectively, while the average test times for the traditional lookup table method were 47.67 min and 49.33 min, respectively. After calculation, under the two temperature and humidity conditions, the logistic regression method saved 17.00 min and 18.33 min, respectively, of test time, compared with the lookup table method. The logistic regression method effectively shortened the test cycle and improved the test efficiency.
The test result ranges for the logistic regression method under the two temperature and humidity conditions were 0.012% and 0.011%, respectively, while the test result ranges for the traditional lookup table method were 0.022% and 0.024%, respectively. The test result range for the logistic regression method was significantly smaller than that for the lookup table method, indicating that the test data for the logistic regression method have less dispersion, better repeatability, and better test stability.
Under the two temperature and humidity conditions, the test results of the logistic regression method fluctuated between 29.530% and 29.543%; while the test results of the lookup table method fluctuated between 29.530% and 29.558%. It can be seen that the logistic regression method is less affected by environmental changes and can maintain higher result stability and consistency under different temperature and humidity conditions.
Comparison of test results
To ensure the comparability of the test data, only the test data of the sample’s longitudinal direction were selected for comparison. From the samples inspected daily in the limit oxygen index laboratory, 15 samples were randomly selected as the comparison samples. The tests were conducted according to the test method specified in GB/T 5454-1997, 13 and the limit oxygen index was tested separately using the logistic regression method and the lookup table method. The test data are given in Table 5. The deviation of the limit oxygen index was represented by the difference in the calculation results of the logistic regression method and the lookup table method; this deviation was used to evaluate the accuracy of the calculation results of the logistic regression method.
Comparison of test results between logistic regression method and lookup table method
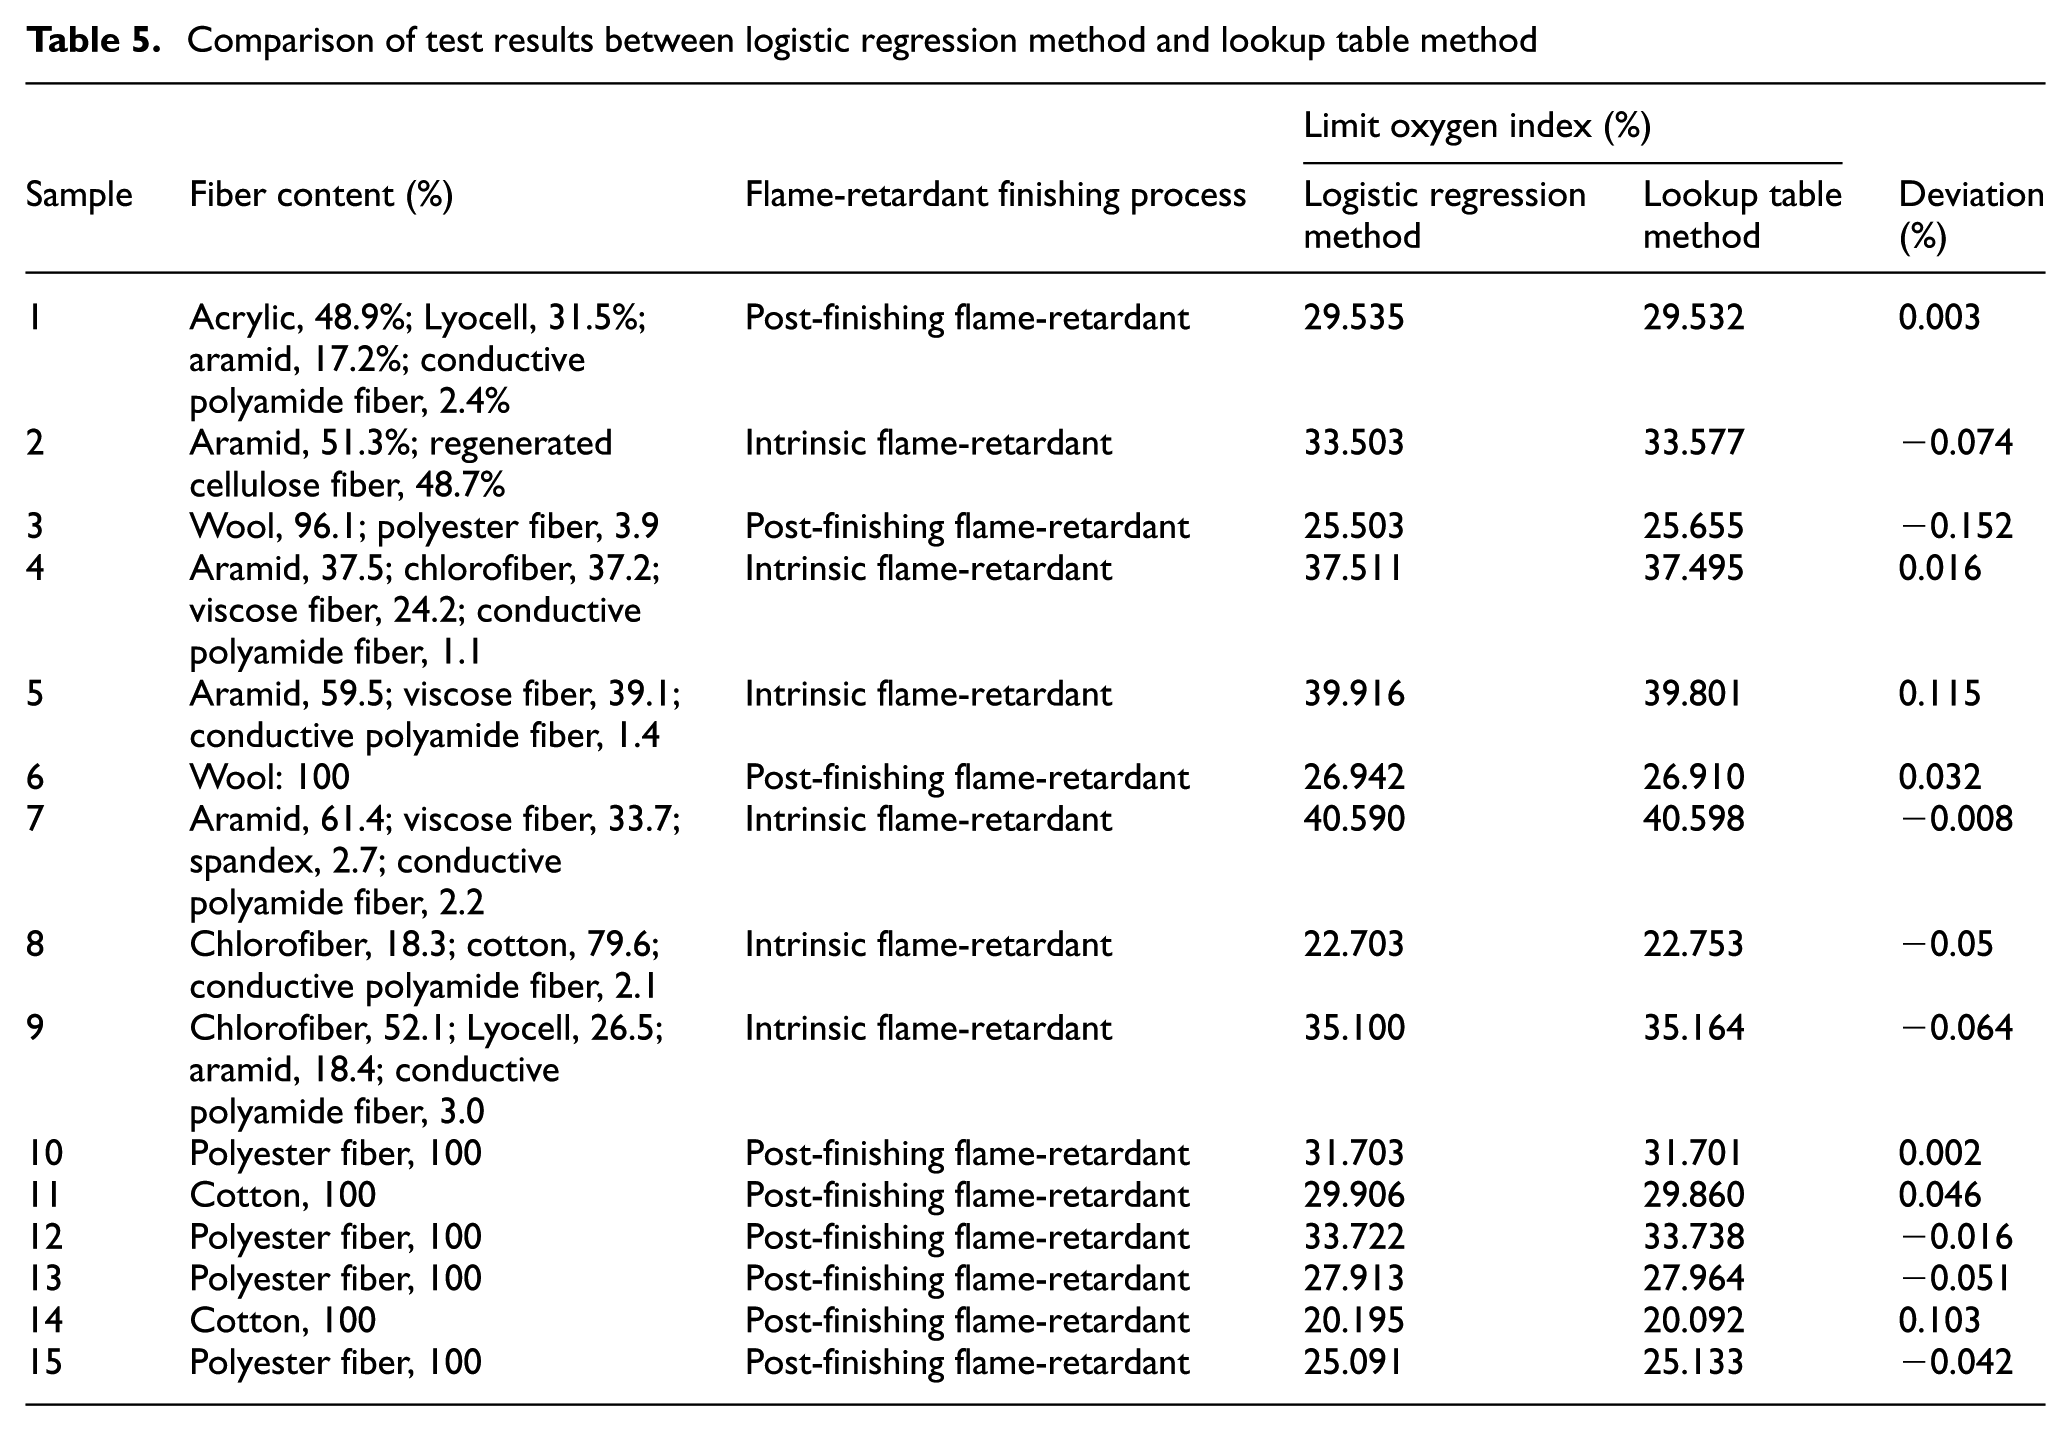
When conducting the limit oxygen index test in accordance with GB/T 5454-1997, 13 it is necessary first to determine the approximate range of the oxygen index and then gradually reduce the detection interval; the difference value in oxygen concentration for each test should be fixed at 0.2%. It can be concluded from the experimental data given in Table 5 that the logistic regression method is applicable to the limiting oxygen index (LOI) measurement of textile materials with different fiber compositions and flame-retardant finishing processes. The deviations of limiting oxygen index values between the logistic regression method and the conventional lookup table method for all 15 samples are less than 0.2%. Accordingly, the proposed logistic regression method can be used to realize the effective and accurate determination of limiting oxygen index for textile materials.
Conclusion
In this study, an oxygen index function model is developed, based on binary logistic regression. Origin software is adopted to fit the oxygen index curve and calculate the limiting oxygen index, and the results are compared with those obtained via the conventional lookup table method. The proposed logistic regression method features simple operation, rapid calculation, and reliable accuracy. It effectively reduces invalid test data and weakens the reliance on operator subjectivity. The established model quantitatively characterizes the variation in textile combustion probability under different oxygen concentrations; this validates the feasibility of curve fitting for limiting oxygen index evaluation. The experimental data meet the distribution requirements and further confirm the rationality of the test scheme and result reliability. A higher data concentration within the range of ±5% of the critical oxygen concentration contributes to better testing accuracy. The LOI deviation between the logistic regression method and the lookup table method is less than 0.2%. Comparative tests and statistical analysis demonstrate that the logistic regression approach enables efficient, accurate, and stable measurement of the limiting oxygen index of textile materials.