






Abstract
Unlike color, which has already been widely digitized and standardized in the textile industry, fabric hand feel and skin comfort remain weakly standardized and digitized. The hand feel properties of fabrics are highly sensitive to structural changes induced by finishing processes, making it challenging for manufacturers in the wool textile sector to consistently reproduce the desired hand feel characteristics when processing new samples. Motivated by this gap, this study proposes a structure-centric framework, utilizing SEM and the fabric touch tester (FTT) to correlate processing-driven micro/mesoscale alterations with hand feel and skin comfort performance, enabling standardizable measurement and predictive control. A double-faced semi-worsted fabric (80% wool, 20% Tencel) was sampled across 12 manufacturing and finishing processes. This study quantitatively characterizes and focuses on three structure-related descriptors: total fabric hair thickness (
In industrial textile production, color has been extensively digitized and standardized. Munsell established a systematic approach to color notation and classification. 1 Pantone provides widely used standardized color systems for industrial color communication. 2 The CIE L*a*b* color space has also been standardized for quantitative color representation and comparison. 3 In addition, digital color management technologies have further supported the communication and digital handling of color information in textile production. 4 When brands or fabric buyers specify a target color, manufacturers can use established color standards to define and communicate the target color precisely.2–4 By leveraging intelligent color-matching software, such as Datacolor Match Textile, manufacturers can generate or optimize dyeing formulations to improve first-shot matching and process efficiency. 5
By contrast, fabric hand and skin comfort remain less standardized and are still weakly supported by intelligent design tools. 6 Achieving a target fabric hand for a new fabric is often difficult to reproduce reliably, and production still relies heavily on tacit expertise, repeated trial runs, and subjective hand evaluation by operators. 7
Fabric hand refers to the tactile sensations perceived when a fabric is touched or handled, involving sensory attributes such as softness, smoothness, and thermal feeling.8–10 It is primarily concerned with the immediate impression perceived through contact with the textile, which is influenced by its physical and mechanical properties, including fiber type, yarn structure, fabric texture, and finishing treatments.11–13 Complementarily, skin comfort describes the overall combined physiological and psychological reactions of the human skin when exposed to sustained and direct contact with a textile.14–16 It encompasses multiple dimensions such as thermal regulation and moisture management.16,17 It is also influenced by air permeability and skin friction during textile-skin contact.18,19 While fabric hand is often evaluated in brief tactile assessments, skin comfort relates more directly to long-term wearability and user satisfaction during actual garment use.14–16 These two interrelated attributes play a central role in shaping consumer perception and satisfaction in textile products.13,20
Finishing processes in textile manufacturing include a range of mechanical and chemical treatments applied after weaving or knitting to improve fabric properties.21,22 For semi-worsted wool textiles, the finishing process involves several sequential treatments designed to enhance both the functional and aesthetic qualities of the fabric.23,24 These include scouring, which removes residual lanolin, dirt, and processing oils to prepare the fabric for further treatment; 23 milling, which induces controlled felting to compact the fabric structure, improving density, stability, and surface cohesion;25,26 raising, where mechanical brushes lift surface fibers to create a soft and voluminous handle; 24 calendering, which applies heat and pressure through rollers to flatten the surface, resulting in a smooth texture and a subtle increase in luster;24,27 shearing, which trims the raised fibers to ensure a uniform surface height and refined appearance; 21 and decatizing, which involves the application of pressurized steam to stabilize fabric dimensions, enhance drape, and improve surface smoothness. 28 Each process exerts substantial and irreversible influences on the fabric’s surface and cross-sectional structures, thereby affecting the fabric hand and skin comfort properties.26,29 If process parameters or sequences are inadequately set, deviations in hand and skin comfort may only emerge at a late stage, leading to overuse of raw materials and utilities (water, electricity, and steam) and avoidable labor time.22,30 This challenge highlights the need for a structure-performance-based pathway that enables early prediction and parameter setting. 31
From a structure-mechanistic perspective, manufacturing and finishing induce micro- to mesoscale modifications in wool fabrics. These include changes in surface fiber orientation and packing, hairiness-layer thickness and coverage, bulk/loft and compressibility, surface friction and roughness, and densification and resilience at yarn and construction levels.21,32–34 These parameters influence hand feel and skin comfort, and interact with heat-moisture transfer and dynamic friction. 35 Since these parameters are set by machine and process conditions (e.g., speed, tension, temperature, hygrothermal regime, and the intensity and duration of mechanical action), these structural descriptors can be incorporated into a data-driven control strategy that monitors and models outcomes, generates predictions, and then adjusts machine settings accordingly.7,22,30
Against this background and research gap, this study systematically examines how the structural evolution of wool fabrics during manufacturing and finishing influences hand feel and skin comfort performance. Scanning electron microscopy (SEM) is used to examine the evolution of fabric surface morphology across different processing steps. In addition, fabric hand and skin comfort properties are evaluated using the fabric touch tester (FTT). By integrating these analyses, the study aims to establish correlations between structural modifications and hand feel and skin comfort characteristics, thereby providing insights into how processing techniques affect the sensory and functional qualities of wool fabrics.
The contribution of this work is the provision of actionable evidence and a methodological basis for predicting potential hand and skin comfort from detected structural changes during manufacturing and finishing. In addition, the study demonstrates a practical approach for tracking structural evolution during finishing by combining SEM observation, image-based analysis, and FTT evaluation, thereby revealing how both cross-sectional and surface structures change across the process sequence. The findings offer early guidance to set and optimize process parameters, particularly for irreversible finishing, with possible improvements in first-pass yield and reduced rework. This work could further support data-driven control and quality prediction consistent with the European Union’s Ecodesign for Sustainable Products Regulation on resource efficiency and product reliability. 36
Materials and methods
Fabric collection
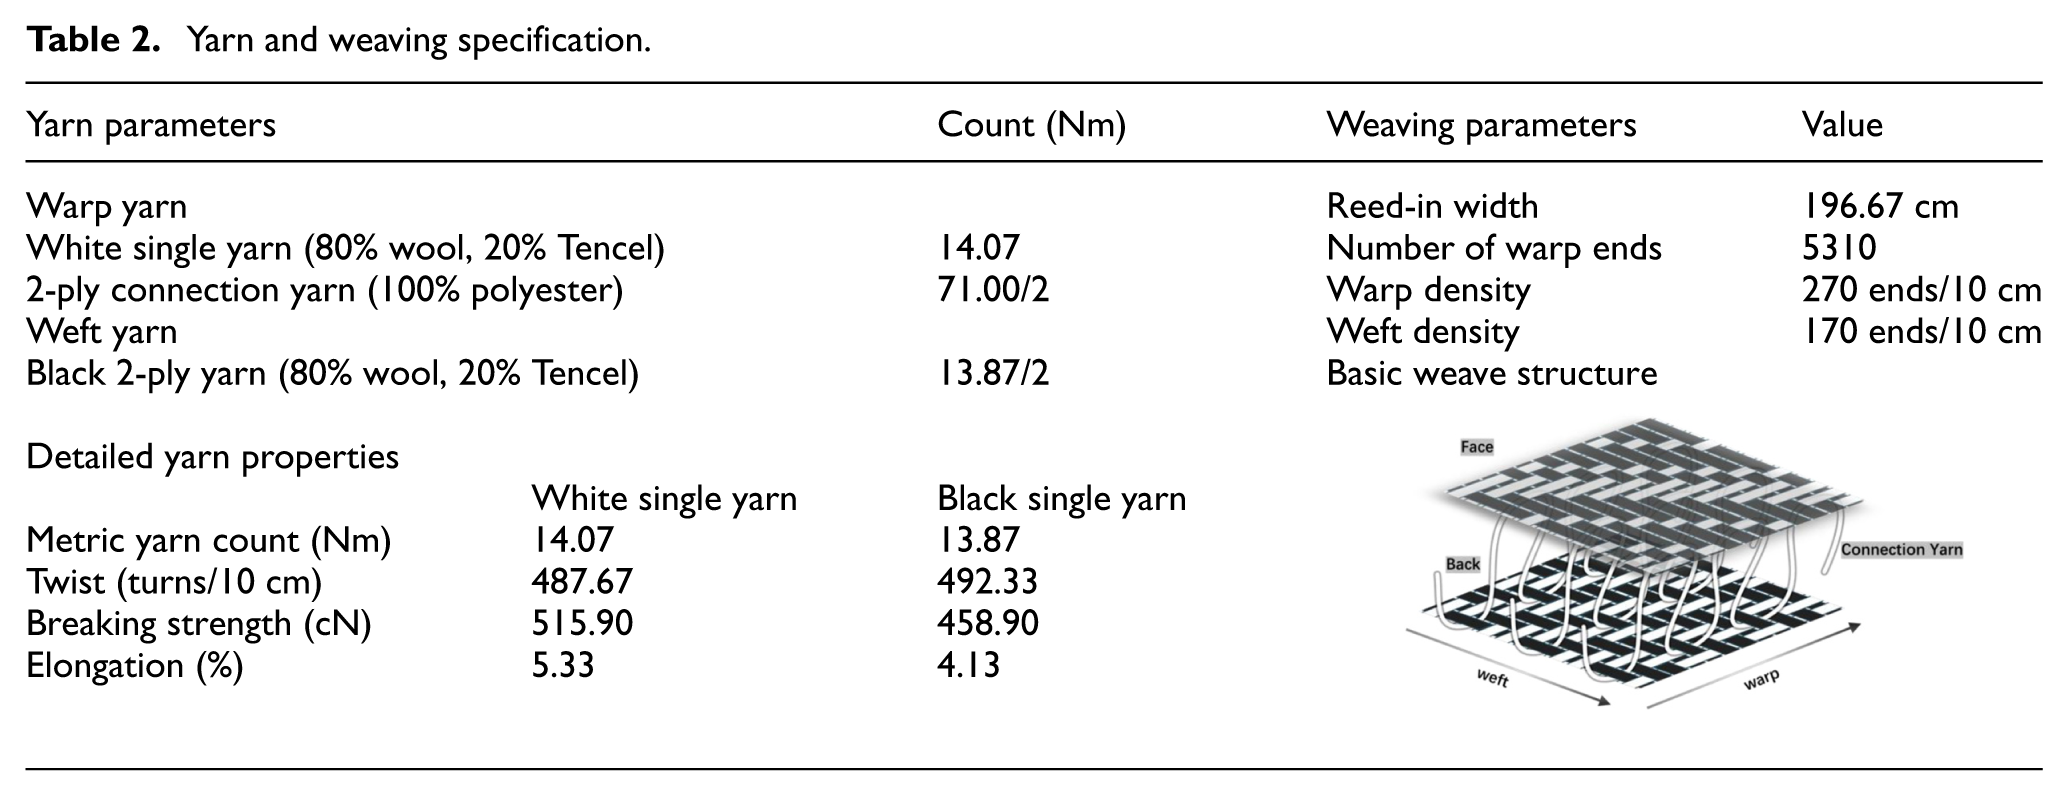
Twelve double-faced semi-worsted fabrics (80% wool, 20% Tencel) manufactured by Yiduo Dyeing and Finishing Ltd (China) were collected from different stages of the manufacturing and finishing processes (see Figure 1 and Tables 1–3 for detailed information). During sampling, two parallel fabric pieces produced from two weaving machines were selected and then subjected to the same subsequent manufacturing and finishing processes (denoted as Piece A and Piece B). Samples were collected from both fabric pieces at each process stage. For clarity, the fabrics were sequentially numbered as Fabric 1 to 12 according to their positions in the process flow, from weaving to final finishing.
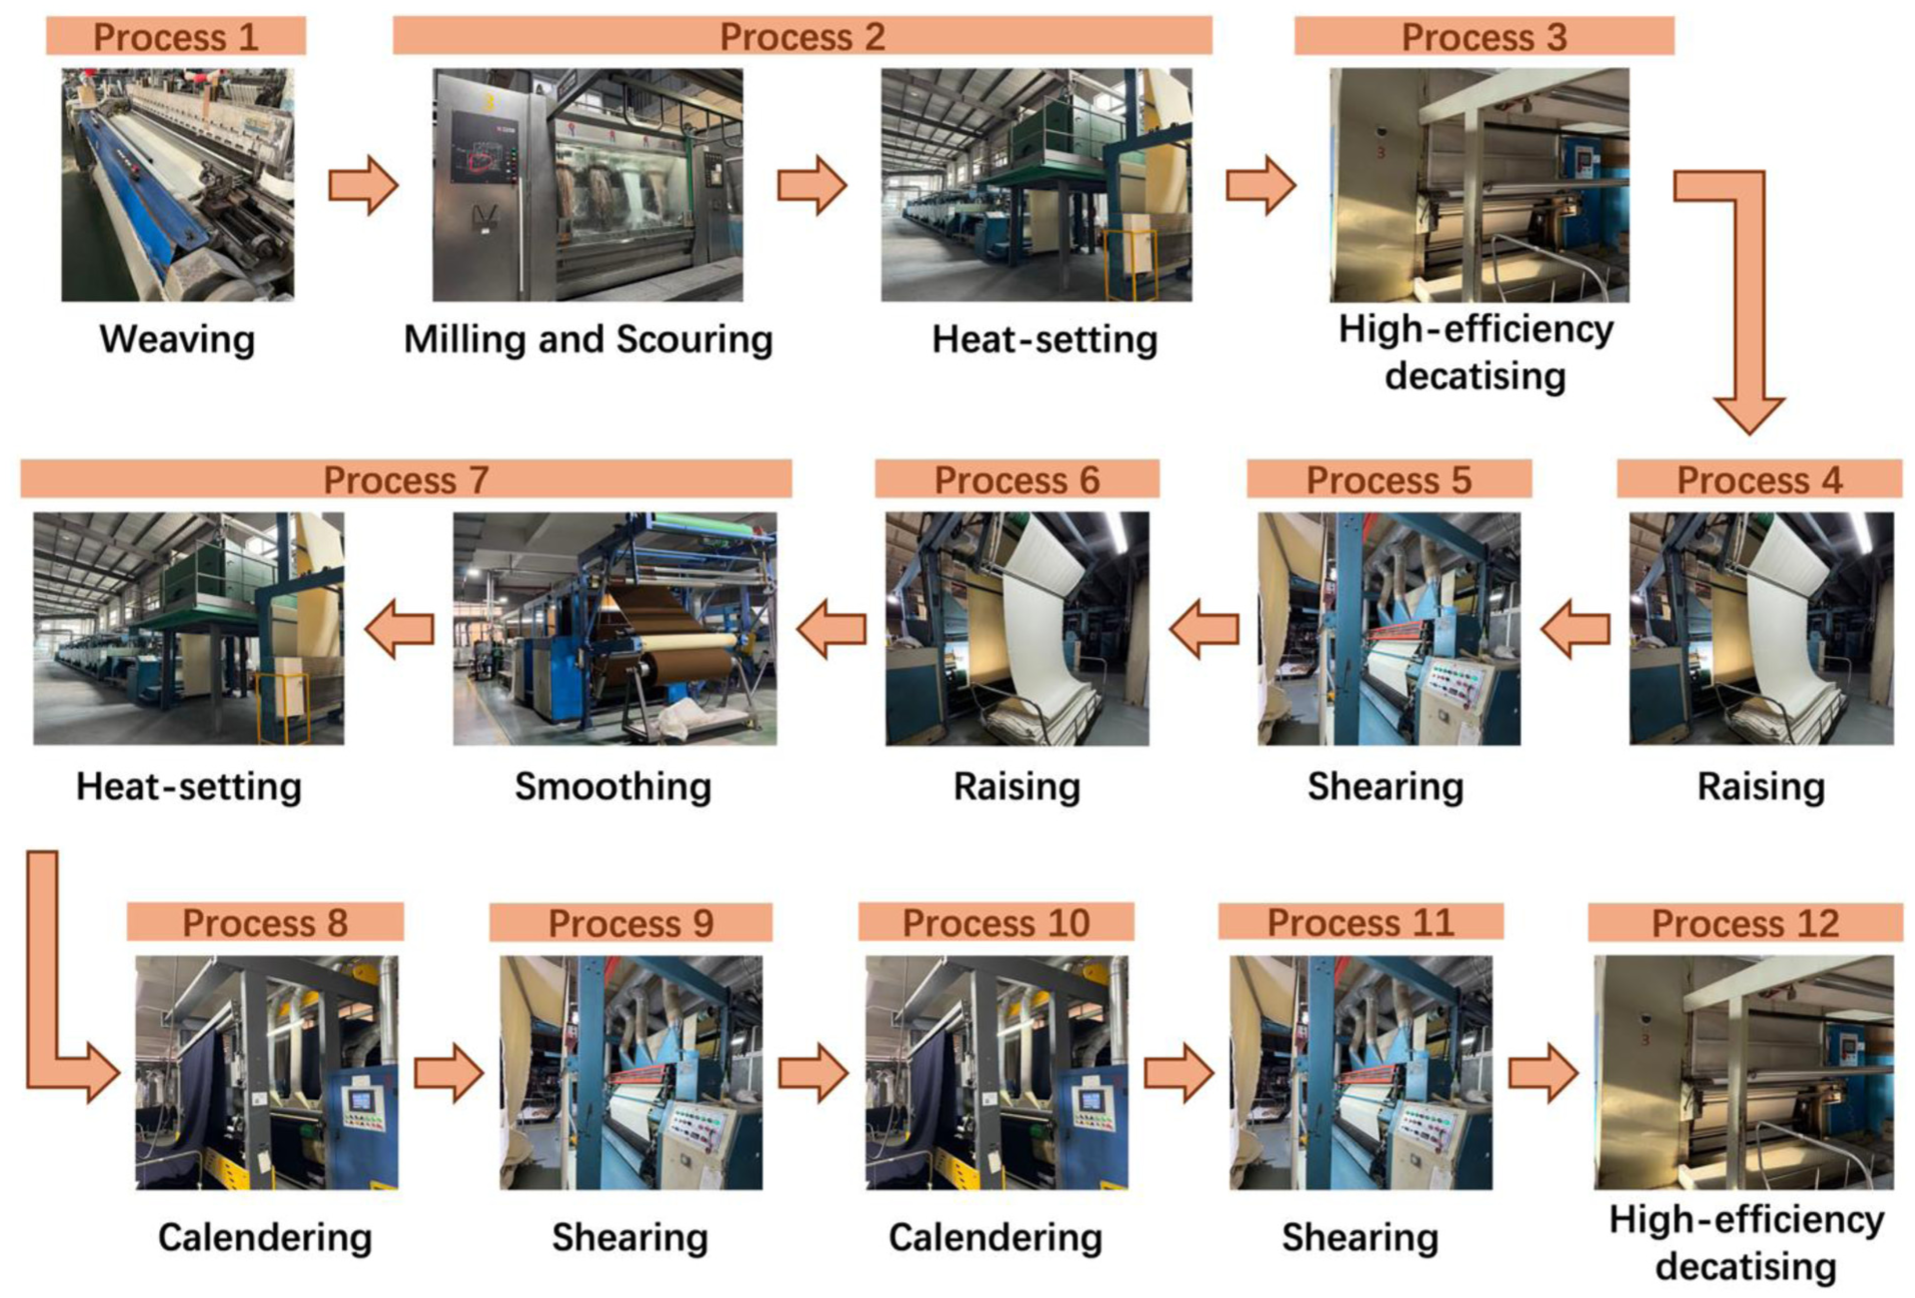
Production sequence and finishing processes of selected fabric.
Raw material information.

Yarn and weaving specification.
Fabric samples and measured parameters at different stages of the production process.
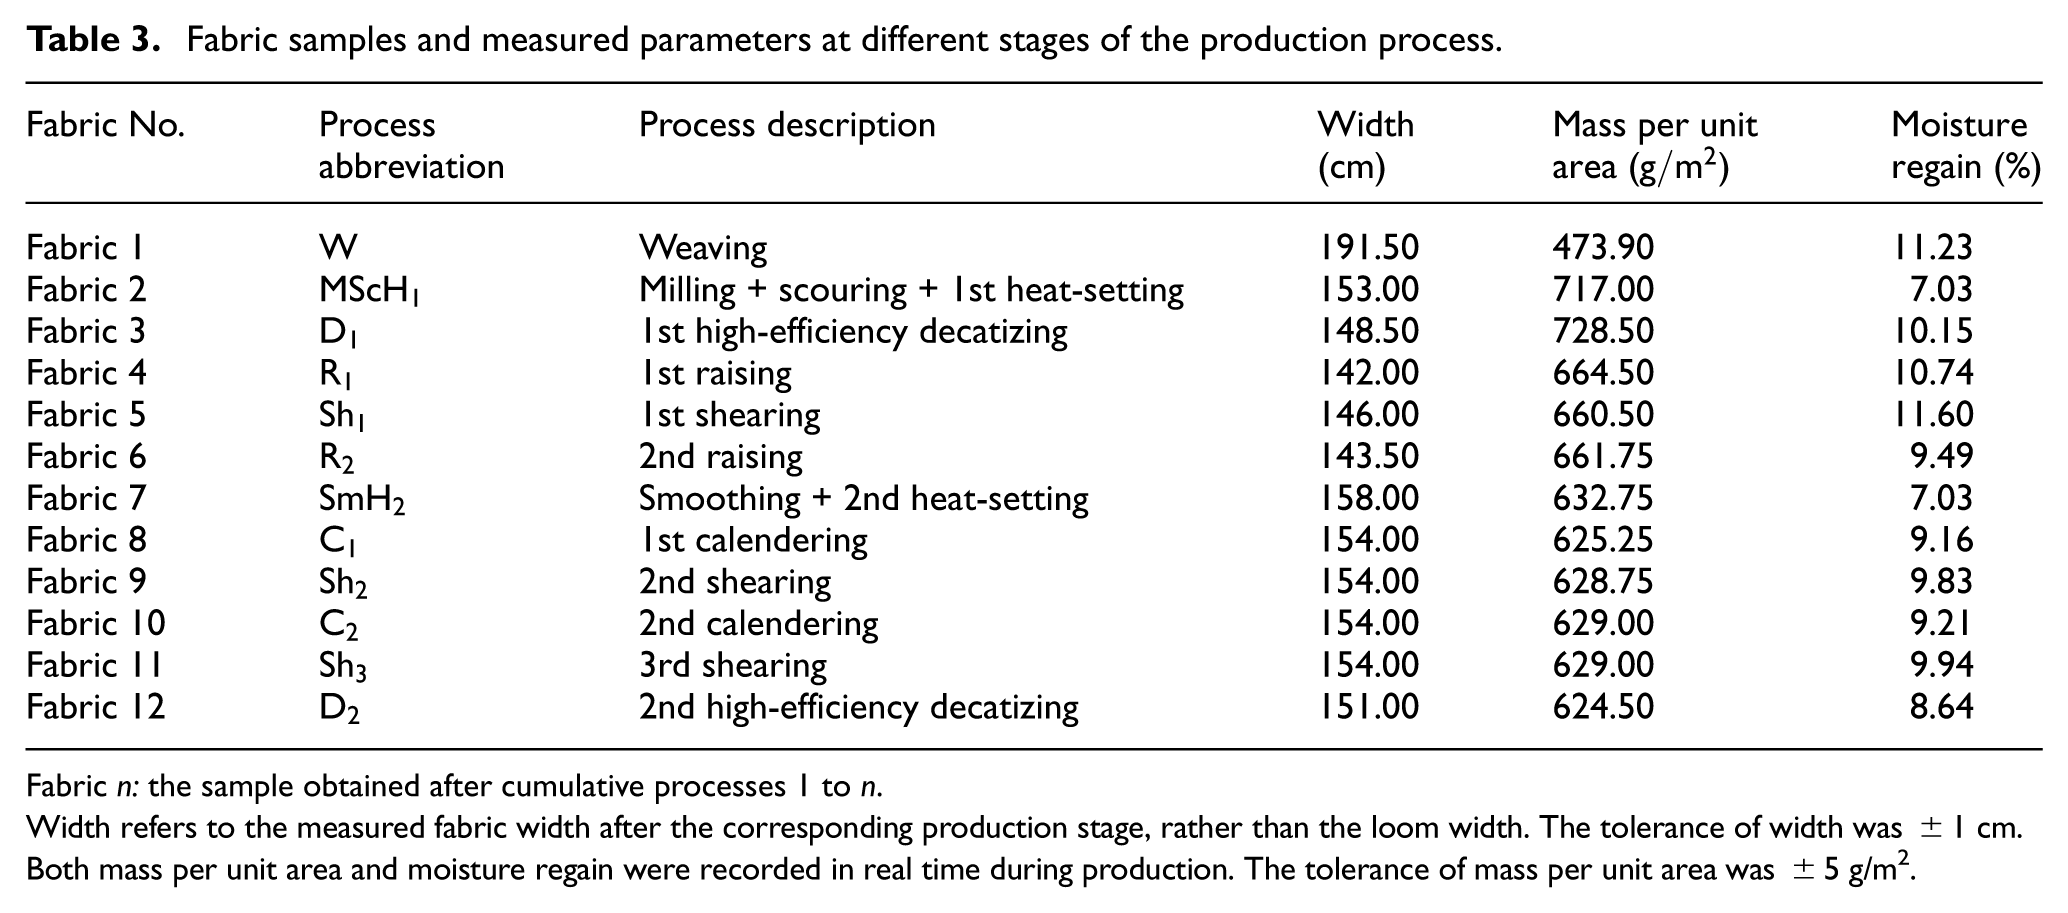
Fabric n: the sample obtained after cumulative processes 1 to n.
Width refers to the measured fabric width after the corresponding production stage, rather than the loom width. The tolerance of width was ±1 cm.
Both mass per unit area and moisture regain were recorded in real time during production. The tolerance of mass per unit area was ±5 g/m2.
Fabric hand and skin comfort assessment by fabric touch tester
The fabric hand was assessed using the FTT manufactured by SDL Atlas. 37 Following ASTM D1776/D1776M, all specimens were conditioned for 24 h at 21 ± 2°C and 65 ± 5% relative humidity, with visible creases removed before testing to ensure consistency. 38
The FTT is designed to measure both mechanical and surface-related properties by simulating fabric-skin interaction, thereby objectively quantifying fabric tactile properties, with each sample assessment completed in approximately 5 min.39–41 The FTT complies with the requirements of FZ/T 01166-2022, Textile Fabric Touch Determination and Evaluation Method: Multi-Index Integration Method, published by the Ministry of Industry and Information Technology of China,42,43 and AATCC TM218-2025, Test Method for Determination of Tactile Sensations of Textiles: Instrumental-Multi-Module, issued by the American Association of Textile Chemists and Colorists (AATCC),44,45 and provides standardized measurements of fabric hand. During testing, the conditioned fabric sample was placed between the upper and lower plates of the FTT. Once the test started, a series of measurements (detailed in Table 4), including fabric thickness, compression, bending, surface friction, surface roughness, and thermal properties, were obtained almost simultaneously. 46 These measured parameters were subsequently used to derive the primary sensory indices (PSIs), including smoothness, softness, warmness, and total hand/skin comfort index, according to the evaluation framework specified in standards FZ/T 01166-2022 and AATCC TM218-2025.42,45 Therefore, these PSI outputs were treated as standard-based tactile evaluation indices derived from the measured bending, compression, heat flux, friction, and roughness-related parameters, rather than as independent raw measurements.
List of modules and indices of the fabric touch tester (FTT)
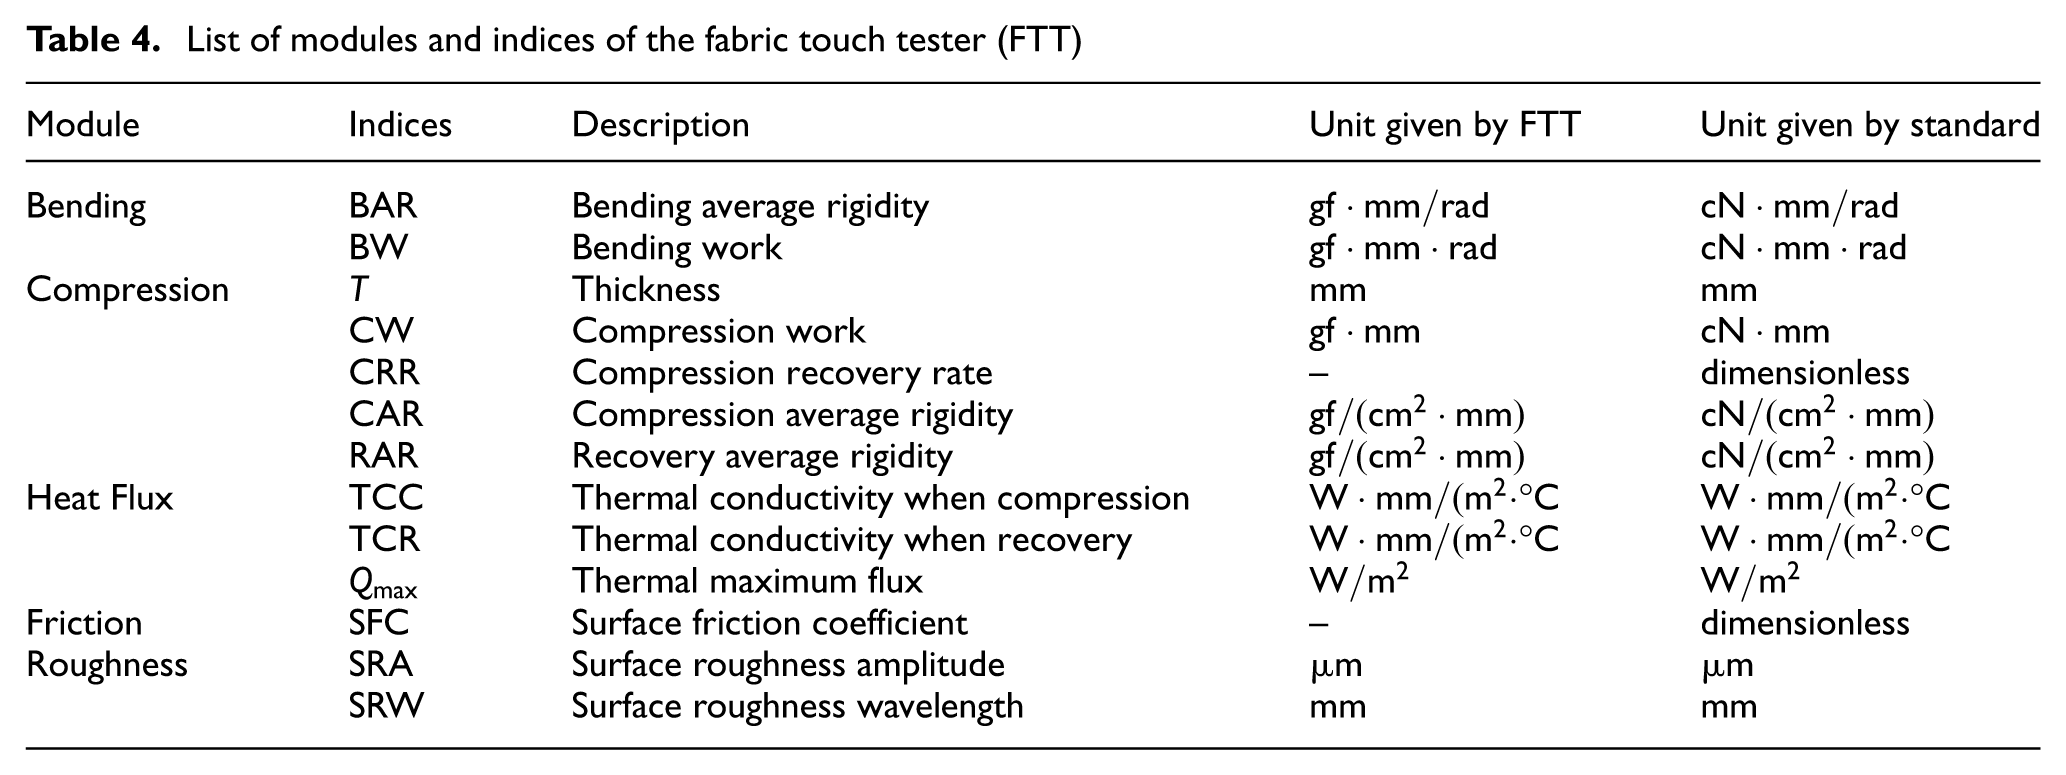
At each process stage, three specimens were taken from one fabric piece and two specimens from the other for FTT testing, giving five measurements in total. The mean values were used for subsequent analysis. Owing to the thickness increase caused by the raising process, Fabrics 4 to 7 exceeded the 5-mm thickness limit of the FTT, preventing a full assessment of all mechanical and surface parameters. 31 For these samples, only compression properties and heat flux measurements were conducted, while other indices could not be reliably measured. This limitation was considered in the analysis of fabric hand performance.
Characterization by scanning electron microscopy
The surface structure of the fabric samples was characterized using the TESCAN MIRA3 SC field emission scanning electron microscope. Each fabric sample was cut into approximately 1.3 cm × 1.3 cm pieces and mounted on aluminum stubs using conductive carbon tape. In addition to surface imaging, each sample was cut into strips of approximately 1.5 cm in length for cross-sectional SEM analysis, allowing detailed examination of the internal fiber arrangement and structural transformations induced by the different processing stages. To ensure conductivity and prevent charging, samples were coated with a thin layer (15 nm) of gold-palladium (Au/Pd) at a ratio of 80:20 using a Quorum Q150T ES sputter coater. Imaging was performed at an accelerating voltage of 5 kV, with a working distance of around 10–30 mm, using the secondary electron detector. Magnifications ranged from 20× to 3000× to capture both the overall surface structure and detailed features of the fabric samples.
Definition of fabric structural changes
In this study, fabric structural changes are described in two domains: surface structure and cross-sectional structure. These descriptors were selected to convert visible finishing outcomes into measurable variables for analysis.
Cross-sectional structure changes
Cross-sectional structure refers to the layered profile normal to the fabric plane. In this study, the cross-sectional structure was divided into three regions: the top fabric hair layer, the fabric core, and the bottom fabric hair layer, as shown in Figure 2. In the cross-sectional SEM images, the fabric core was identified as the compact region in which the original yarn structure remained clearly recognizable and had not been loosened into protruding surface fibers. The boundaries of the fabric core were determined according to the visible distribution range of this intact yarn structure. The regions outside the upper and lower core boundaries were defined as the top and bottom fabric hair layers, respectively. The same criterion was applied consistently throughout the analysis.
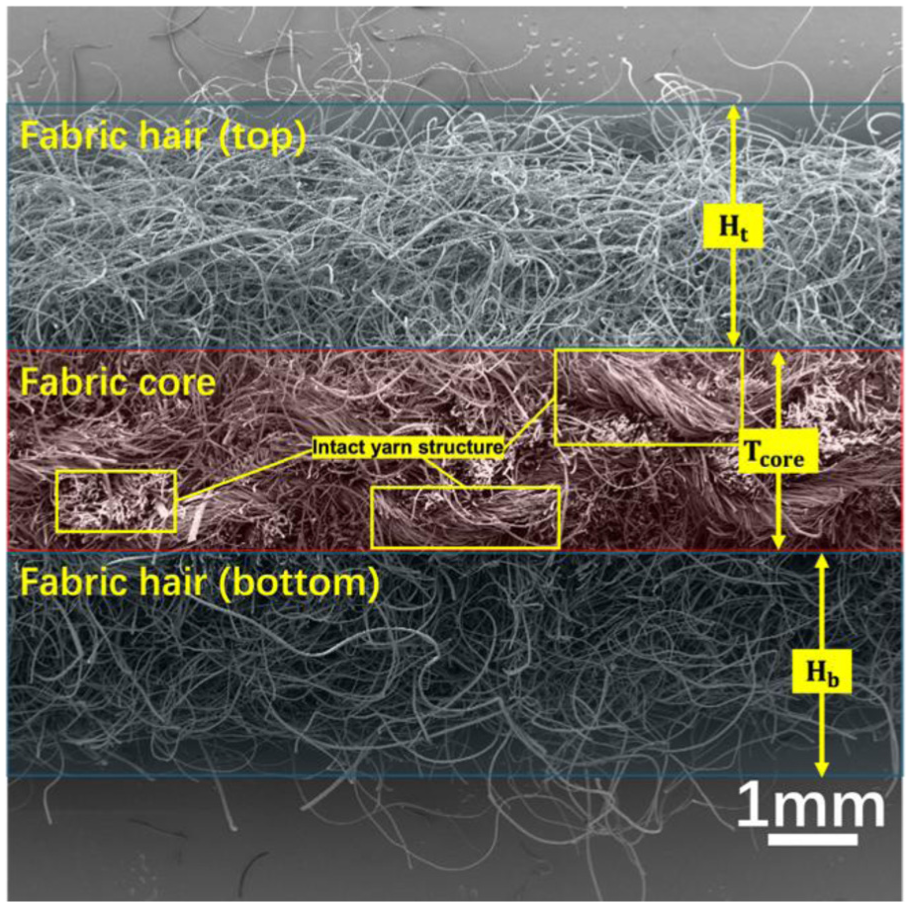
Schematic definition of the cross-sectional structural regions.
To characterize the cross-sectional structure, the following thickness-related parameters were used:
(a) top fabric hair thickness (
(b) bottom fabric hair thickness (
(c) total fabric hair thickness (
(d) fabric core thickness (
(e) uncompressed fabric thickness (
(f) compressed fabric thickness (
For each process-stage fabric, three randomly selected specimens were analyzed for cross-sectional structure evaluation, and representative images are provided in the manuscript.
Surface structure changes
Surface structure in this study refers to the alignment characteristics of fibers on the fabric surface. It was characterized by surface fiber alignment dispersion, expressed as the angular standard deviation derived from the fitted orientation distribution of SEM surface images. In addition, the dominant surface fiber direction was recorded from the orientation distribution and used only as a supplementary variable in the correlation analysis.
The orientation of surface fibers in each fabric sample was characterized through image analysis of SEM images. All SEM images were processed and analyzed using ImageJ (version 1.54, National Institutes of Health, USA), an open-source image processing software widely used in scientific research. 47 The original grayscale images were used to preserve the native structural features of the fiber arrangement. Fiber orientation was analyzed using the Directionality plugin, which applies a fast Fourier transform to detect the dominant angles of fiber alignment. Fiber orientation was quantified from the SEM images as an angular distribution relative to the horizontal axis, where 0° indicates alignment parallel to the horizontal and ±90° indicates a vertical orientation. The angle was extracted from SEM images using image analysis techniques, and the orientation distribution was visualized using a color-coded scheme, as indicated in Figure 3.
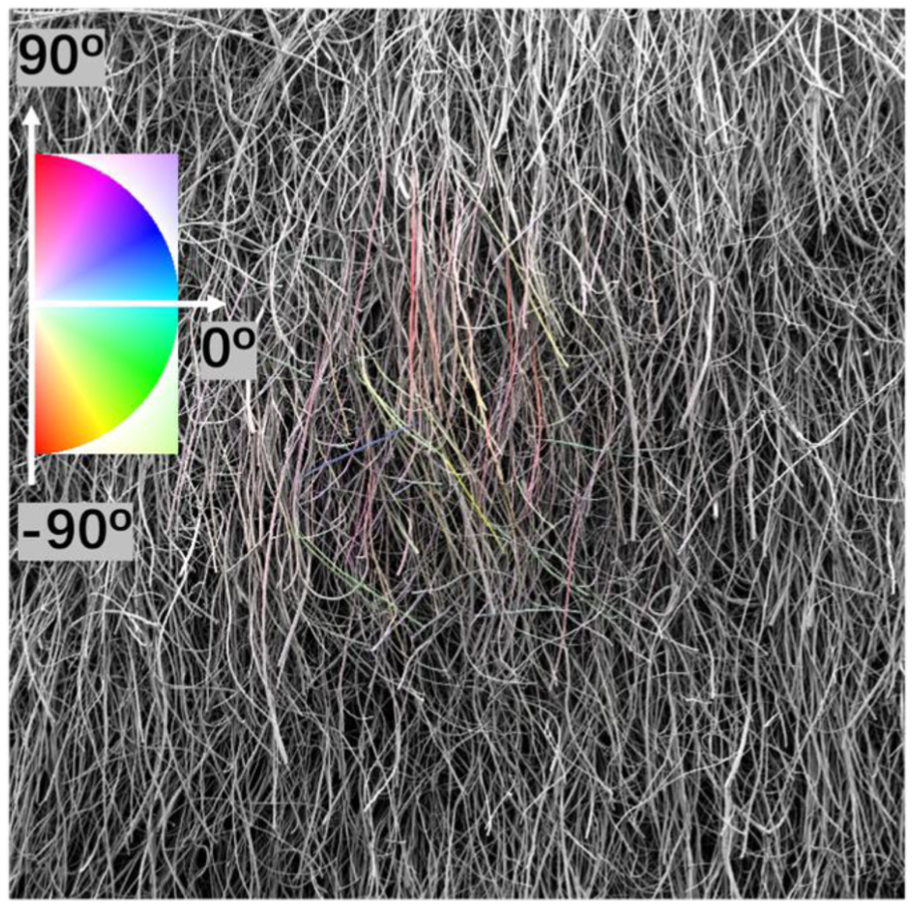
Scanning electron microscopy-based fiber orientation visualization with directional color encoding (Fabric 11).
Surface fiber alignment dispersion (

where
For each process-stage fabric, repeated measurements were conducted on three specimens for surface structure evaluation, and representative images are provided in the manuscript.
Statistical analysis
All statistical analyses were conducted using OriginPro 2026 (OriginLab, Northampton, MA, USA). One-way analysis of variance was used to assess differences in fabric properties across production stages. Pearson correlation analysis was employed to examine relationships between structural parameters and hand feel or skin comfort properties. Regression analyses, including both linear and nonlinear models, were conducted to assess the nature and strength of the relationships observed. Predictive models were developed where statistically significant correlations were identified. Statistical significance was determined at a 95% confidence level (p < 0.05).
Results
Fabric cross-sectional structure changes during finishing processes
As shown in Figure 4a, fabric thickness increased sharply from Fabrics 3 to 4 and then remained at a relatively high level from Fabrics 4 to 7. This overall trend indicates that the raising stages substantially increased the surface hair layer and loosened the compact fabric structure. By contrast, both the overall fabric thickness and the fabric hair thickness gradually decreased from Fabrics 8 to 12, indicating that the later finishing stages progressively refined and compacted the raised structure.
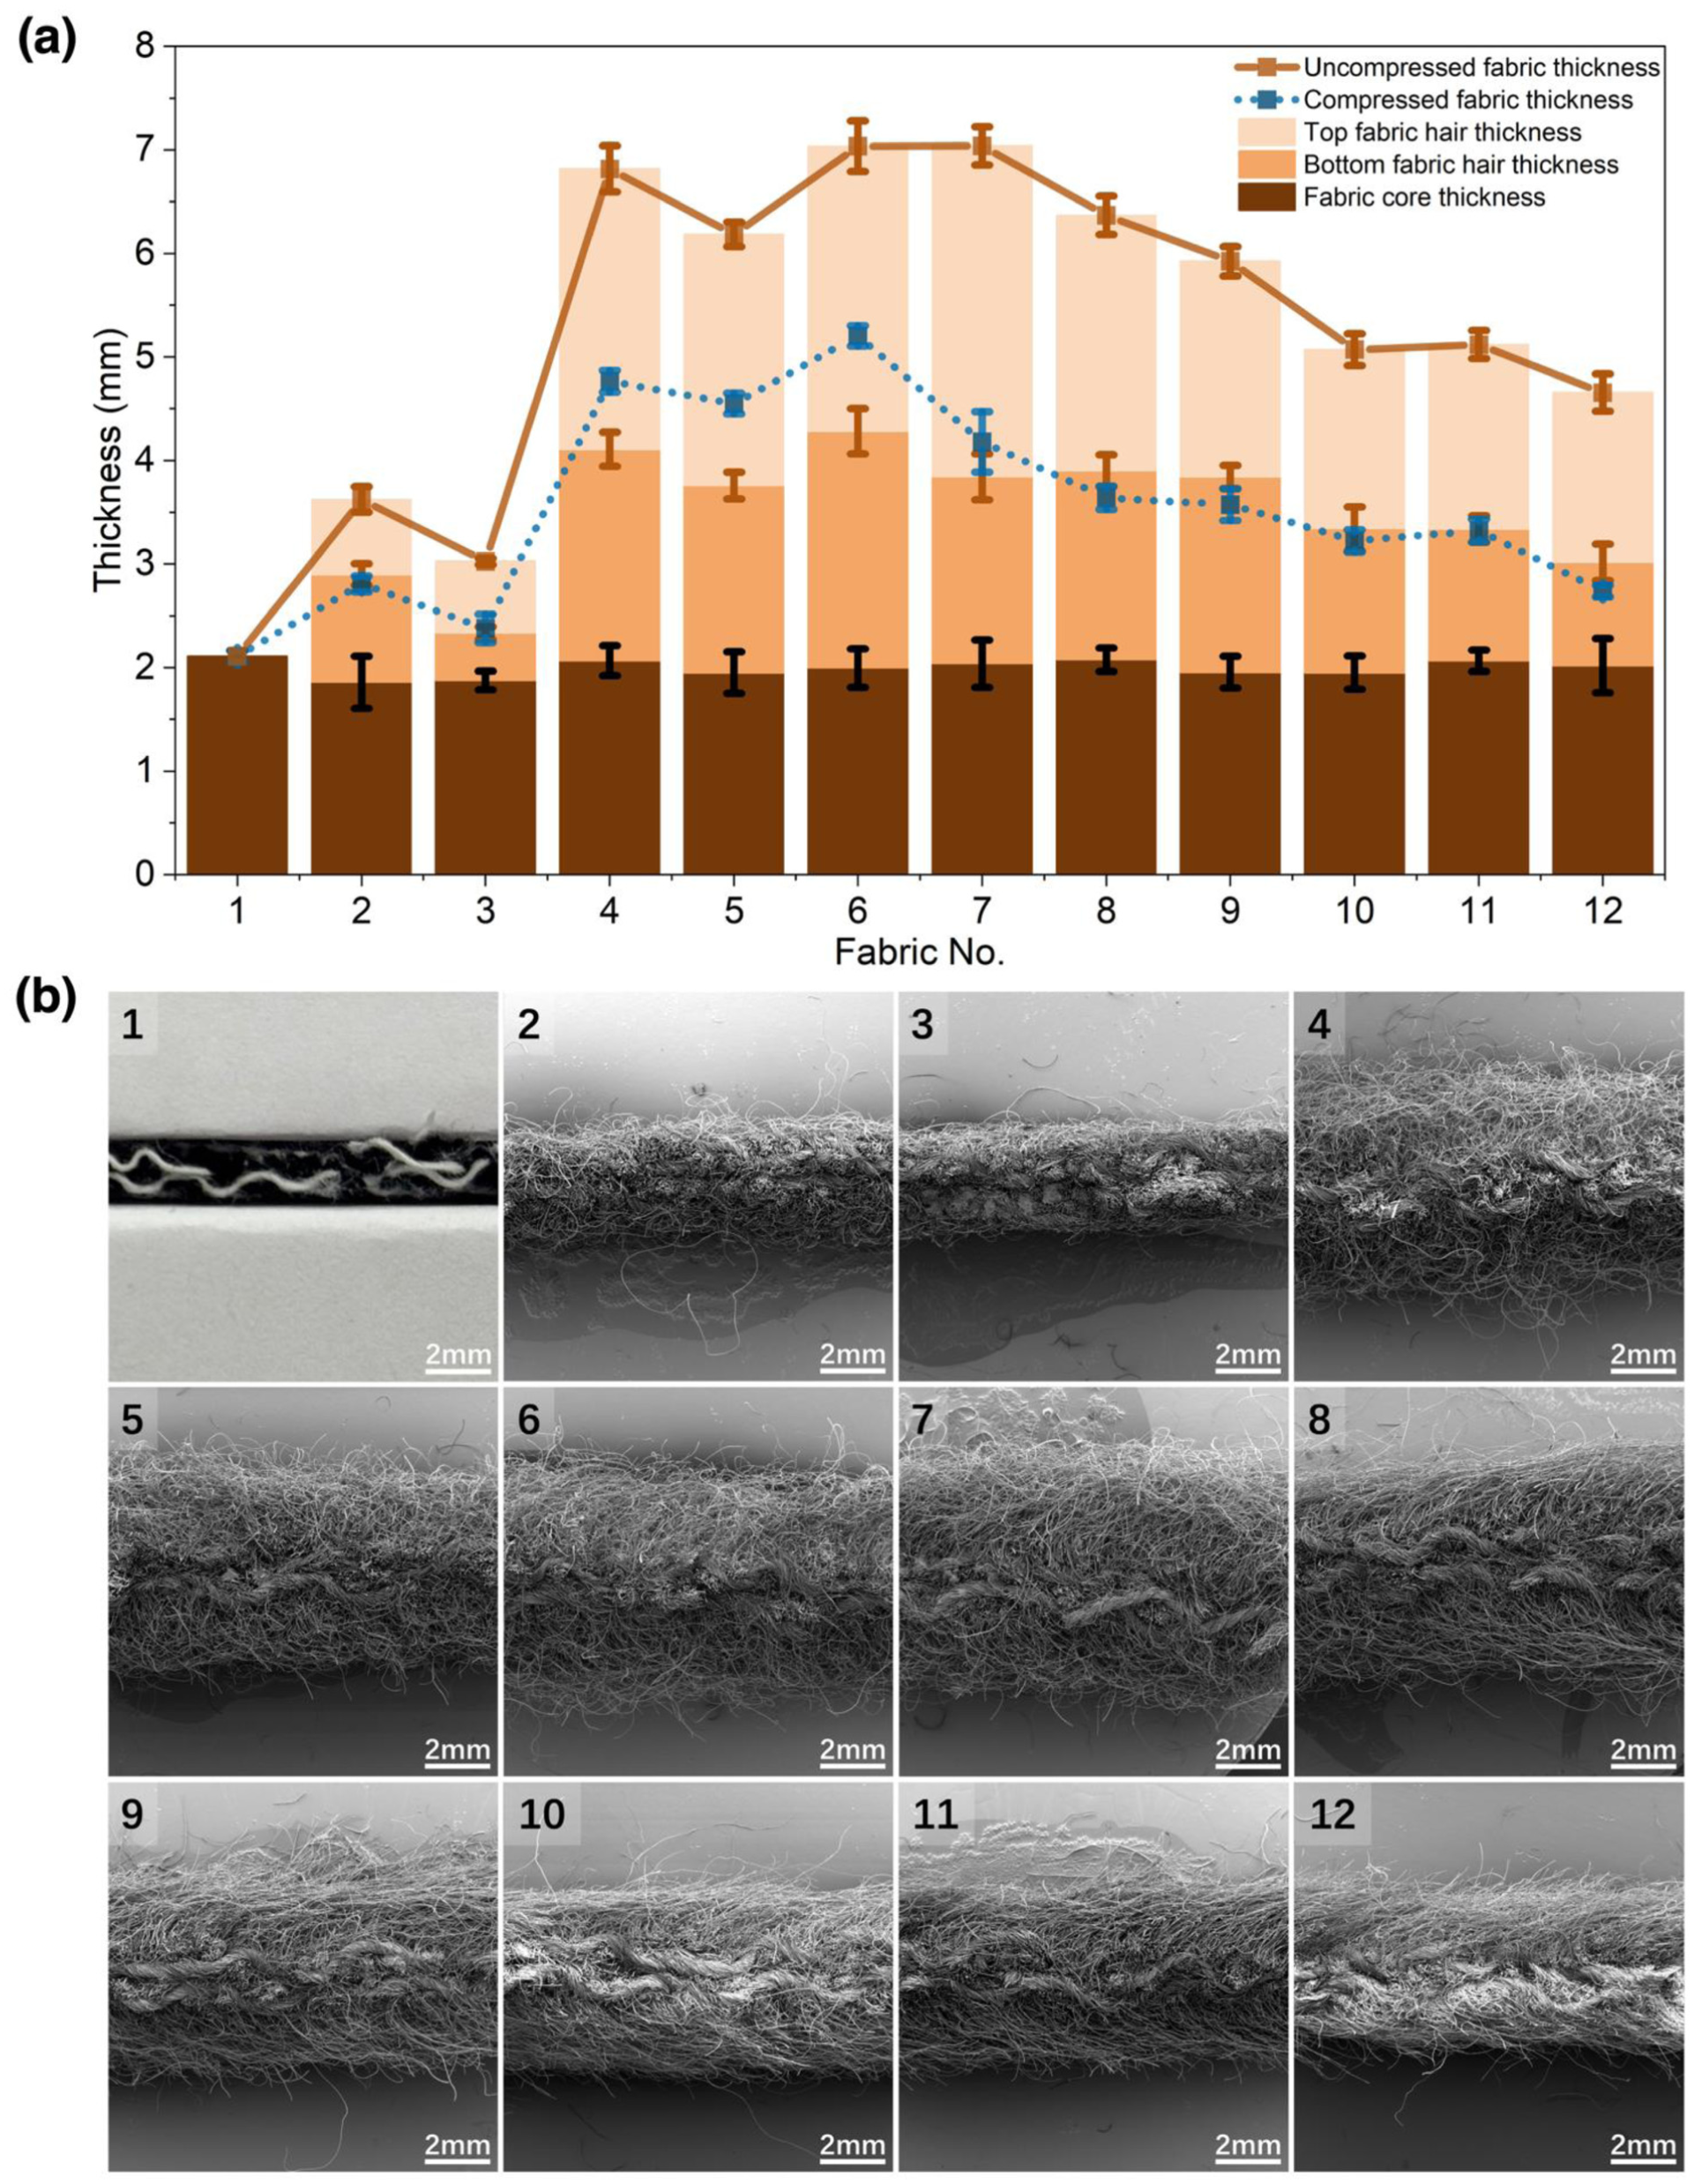
Structural evolution of fabrics across production process. (a) Variation of fabric thickness; (b) cross-sectional morphology of fabrics.
More specifically, the relatively limited thickness variation from Fabric 1 to 3 is likely related to the compacting effects of milling, scouring, and decatizing on the fabric structure. The maximum total fabric hair thickness was observed with Fabric 6, indicating the greatest raised-layer development after the second raising treatment. The subsequent smoothing mainly affected fiber surface properties, with little influence on the overall fabric structure or thickness. From Fabric 8 onwards, the repeated calendering and shearing treatments progressively reduced hair thickness and overall fabric thickness, while the final decatizing stage for Fabric 12 led to a further reduction through additional structural stabilization and compaction. Correspondingly, compressed fabric thickness also increased markedly from Fabric 4 to 6, reached its maximum for Fabric 6, and then gradually decreased from Fabric 7 onwards. This trend further suggests that repeated raising increased fabric bulkiness and compressibility, whereas the subsequent finishing treatments reduced structural looseness and enhanced dimensional stability.
Fabric surface structure changes during finishing processes
Figures 5–7 illustrate the surface morphological evolution of fabrics at different finishing stages observed through SEM. Representative samples Fabric 1 (Figure 5), Fabric 7 (Figure 6), and Fabric 12 (Figure 7) were selected to highlight key transformations in fiber arrangement and surface characteristics.
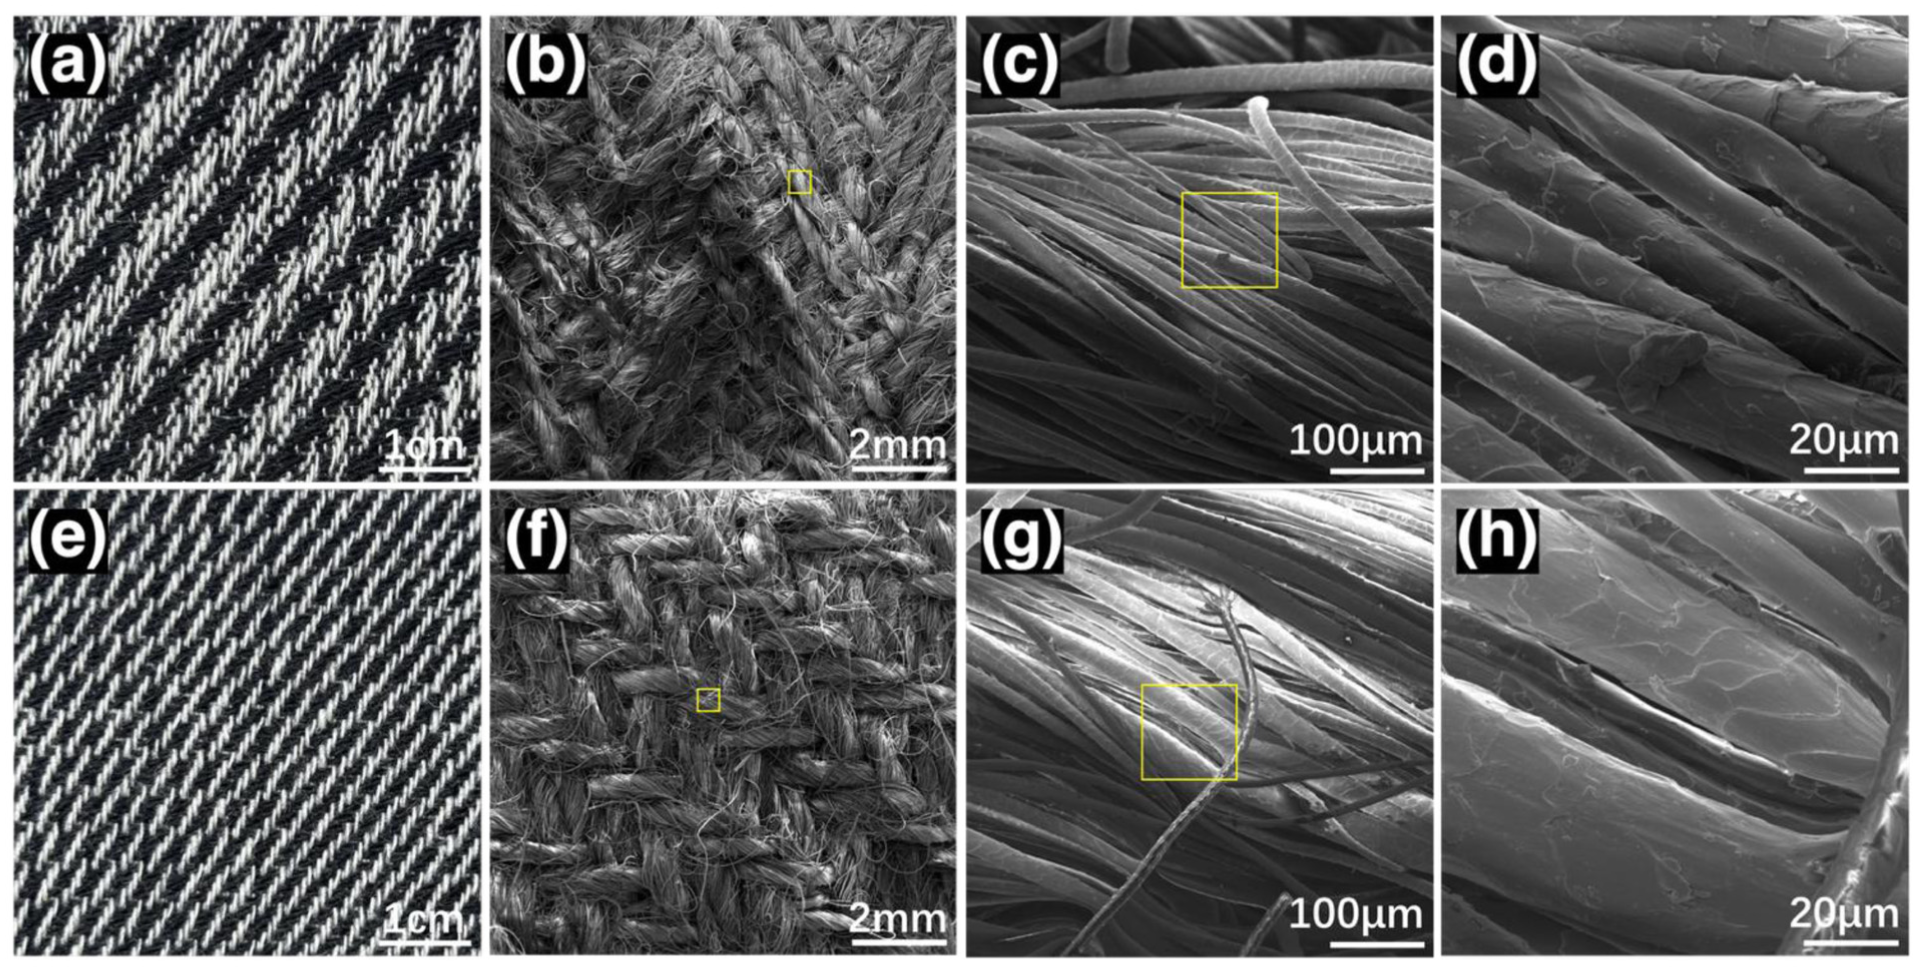
Surface morphology images for Fabric 1. Front: (a) field of view 5 cm; (b) field of view 1 cm; (c) field of view 500 µm; (d) field of view 100 µm. Back: (e) field of view 5 cm; (f) field of view 1 cm; (g) field of view 500 µm; (h) field of view 100µm. (Note: The macroscopic images (a) and (e) are provided to present the overall surface appearance only and do not have strict positional correspondence with the SEM images.)
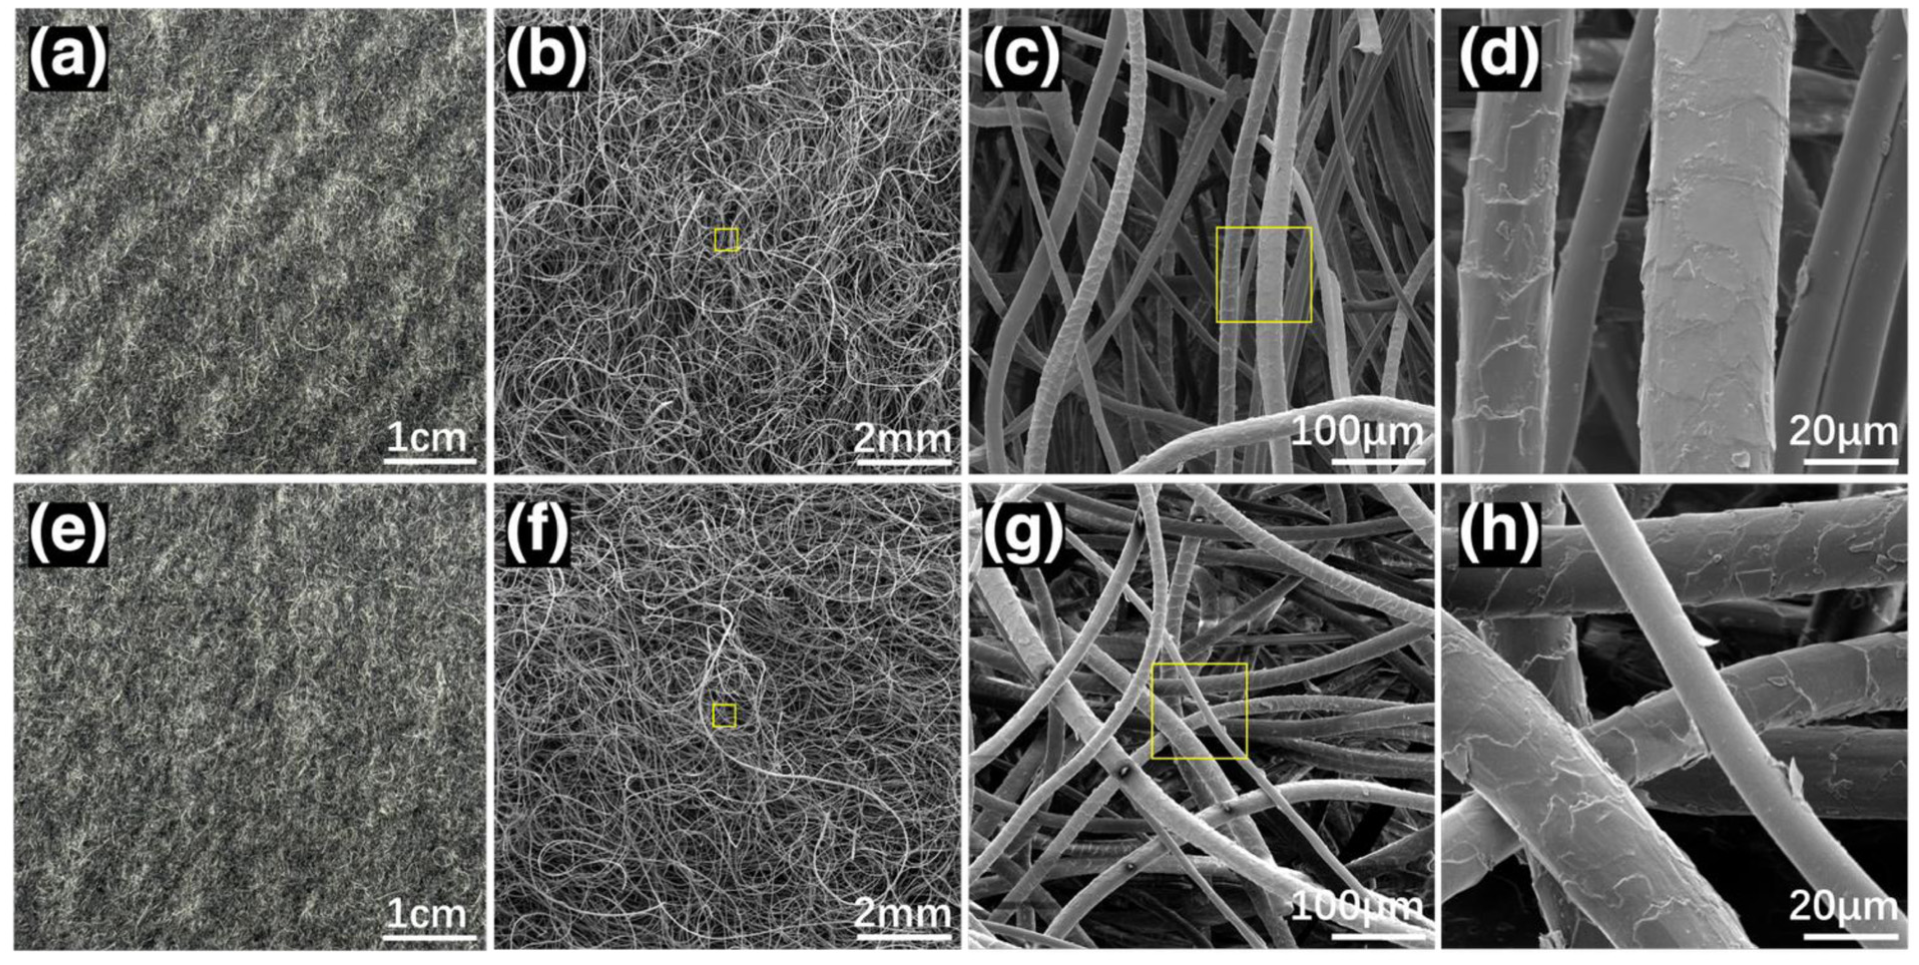
Surface morphology images for Fabric 7. Front: (a) field of view 5 cm; (b) field of view 1 cm; (c) field of view 500 µm; (d) field of view 100 µm. Back: (e) field of view 5 cm; (f) field of view 1 cm; (g) field of view 500 µm; (h) field of view 100 µm. (Note: The macroscopic images (a) and (e) are provided to present the overall surface appearance only and do not have strict positional correspondence with the SEM images.)
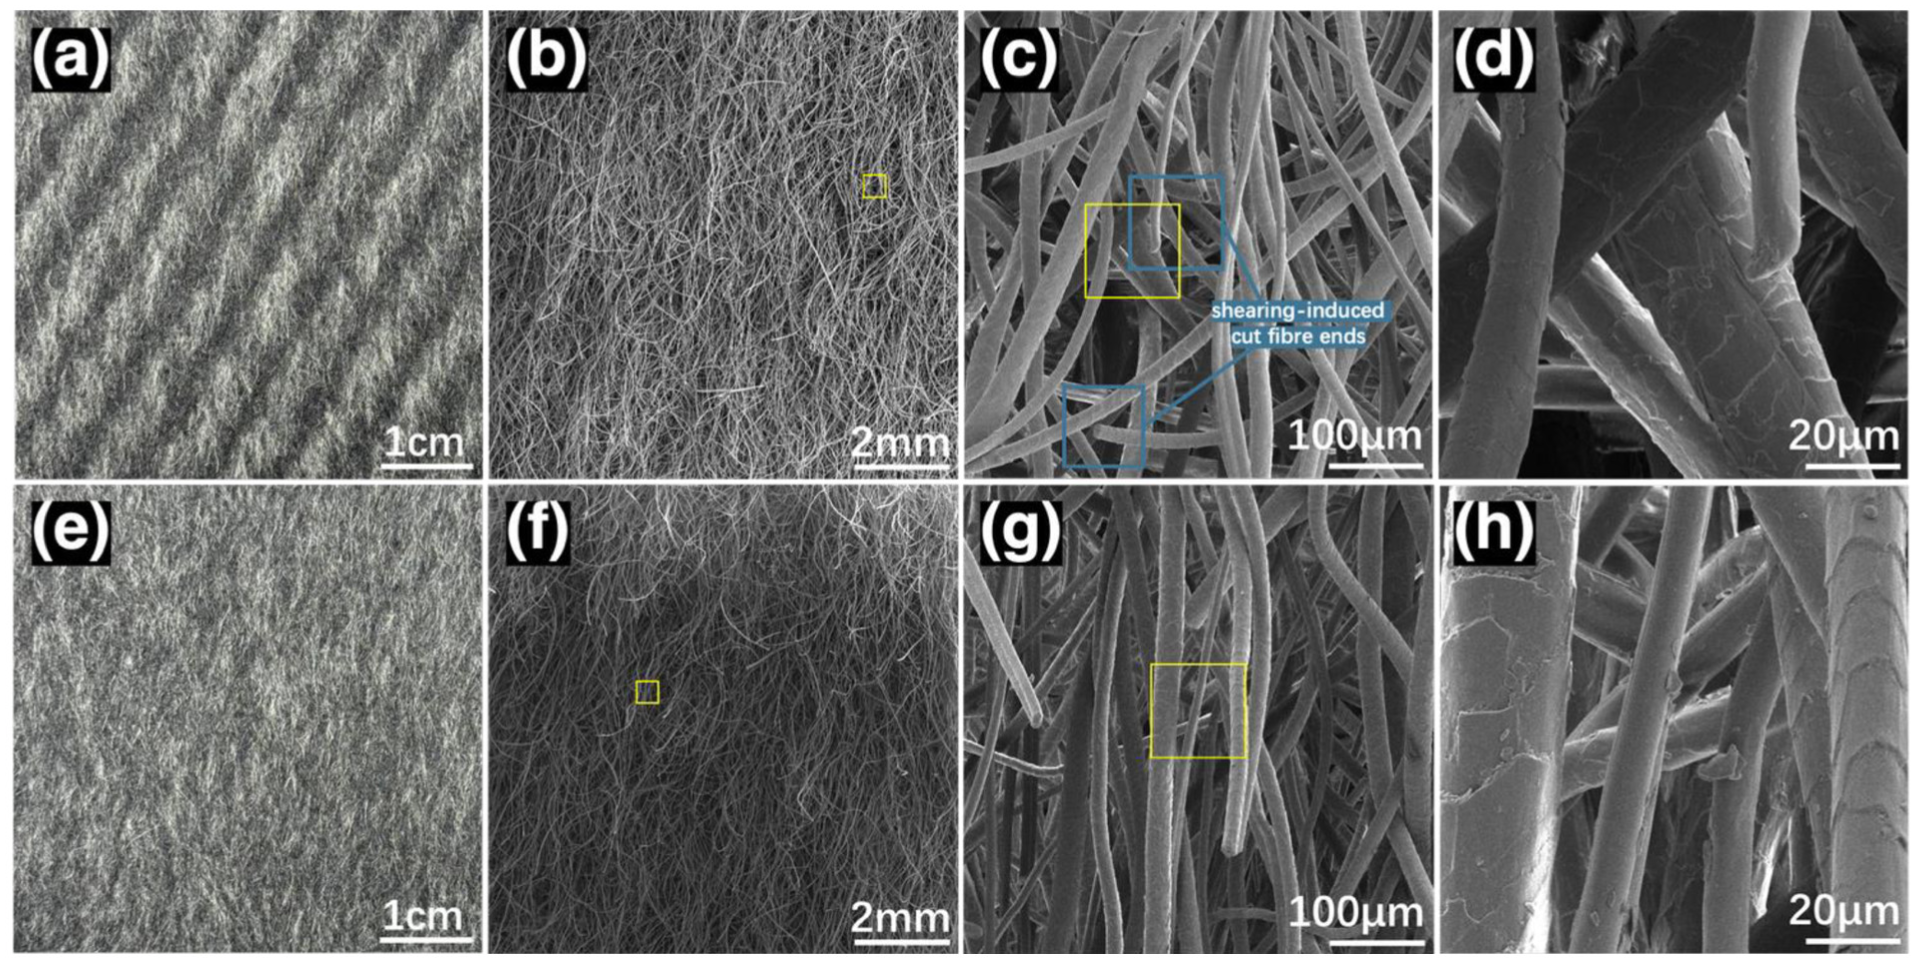
Surface morphology images for Fabric 12. Front: (a) field of view 5 cm; (b) field of view 1 cm; (c) field of view 500 µm; (d) field of view 100 µm. Back: (e) field of view 5 cm; (f) field of view 1 cm; (g) field of view 500 µm; (h) field of view 100 µm. (Note: The macroscopic images (a) and (e) are provided to present the overall surface appearance only and do not have strict positional correspondence with the SEM images.)
Fabric 1 is the gray fabric in the initial state before the finishing stages, and the images of it reveal a well-defined woven structure, with individual yarns maintaining their original alignment and compact arrangement. At higher magnifications, the fibers appear smooth and tightly packed, with minimal surface fuzziness or fiber protrusion.
Fabric 7 has undergone procedures including milling and scouring, heat-setting, decatizing, raising, shearing, and smoothing, and this can be seen as the intermediate stage of finishing. Compared with Fabric 1, Fabric 7 exhibits a significantly altered surface morphology, characterized by an increased presence of entangled, raised fibers. The woven pattern becomes less distinct, with more surface fuzziness and fiber loft due to the raising process. This reflects the combined influence of the earlier milling and scouring treatments, which disturbed the original compact structure, and the later raising treatment, which lifted additional surface fibers and enhanced the loose fiber layer. Higher-magnification images show that individual fibers appear more separated, forming a looser structure.
Fabric 12, representing the final product after all finishing procedures, exhibits a notably smoother and more compact surface morphology compared with Fabric 7. SEM images reveal a clear reduction in raised and disordered surface fibers, indicating that finishing stages from processes 8 to 12 have effectively enhanced fiber alignment and surface uniformity. This reflects the combined effects of calendering in flattening the surface, shearing in removing protruding fiber ends, and decatizing in stabilizing the final surface structure. At higher magnification, distinct fiber cross-sections are visible (Figure 7(c)), providing direct evidence of fiber ends being cleanly cut, which is likely to result from the shearing process. These structural changes collectively contribute to the orderly surface texture and refined appearance characteristic of the final fabric stage.
Overall, the SEM observations demonstrate a progressive transformation from a structured woven surface (Fabric 1) to a fuzzy texture (Fabric 7), and finally to a refined appearance (Fabric 12). These surface modifications correlate with changes in fabric hand and comfort performance, which are further examined in subsequent sections.
Figure 8 provides an overview of the changes in surface fiber alignment throughout the production process (Figure 8(a)), together with representative surface morphology images of the twelve fabrics (Figure 8(b)). The dispersion value increased markedly from Fabric 1 to 3, reached its highest level for Fabric 3, and remained relatively high from Fabric 4 to 7. In particular, an evident increase was observed from Fabric 1 to 2, suggesting that the early finishing treatments, especially milling and scouring, substantially disrupted the original surface fiber arrangement and increased the angular spread of surface fibers. The high dispersion values maintained from Fabric 4 to 7 are also consistent with the substantial development of the fabric hair layer during the raising-related stages.
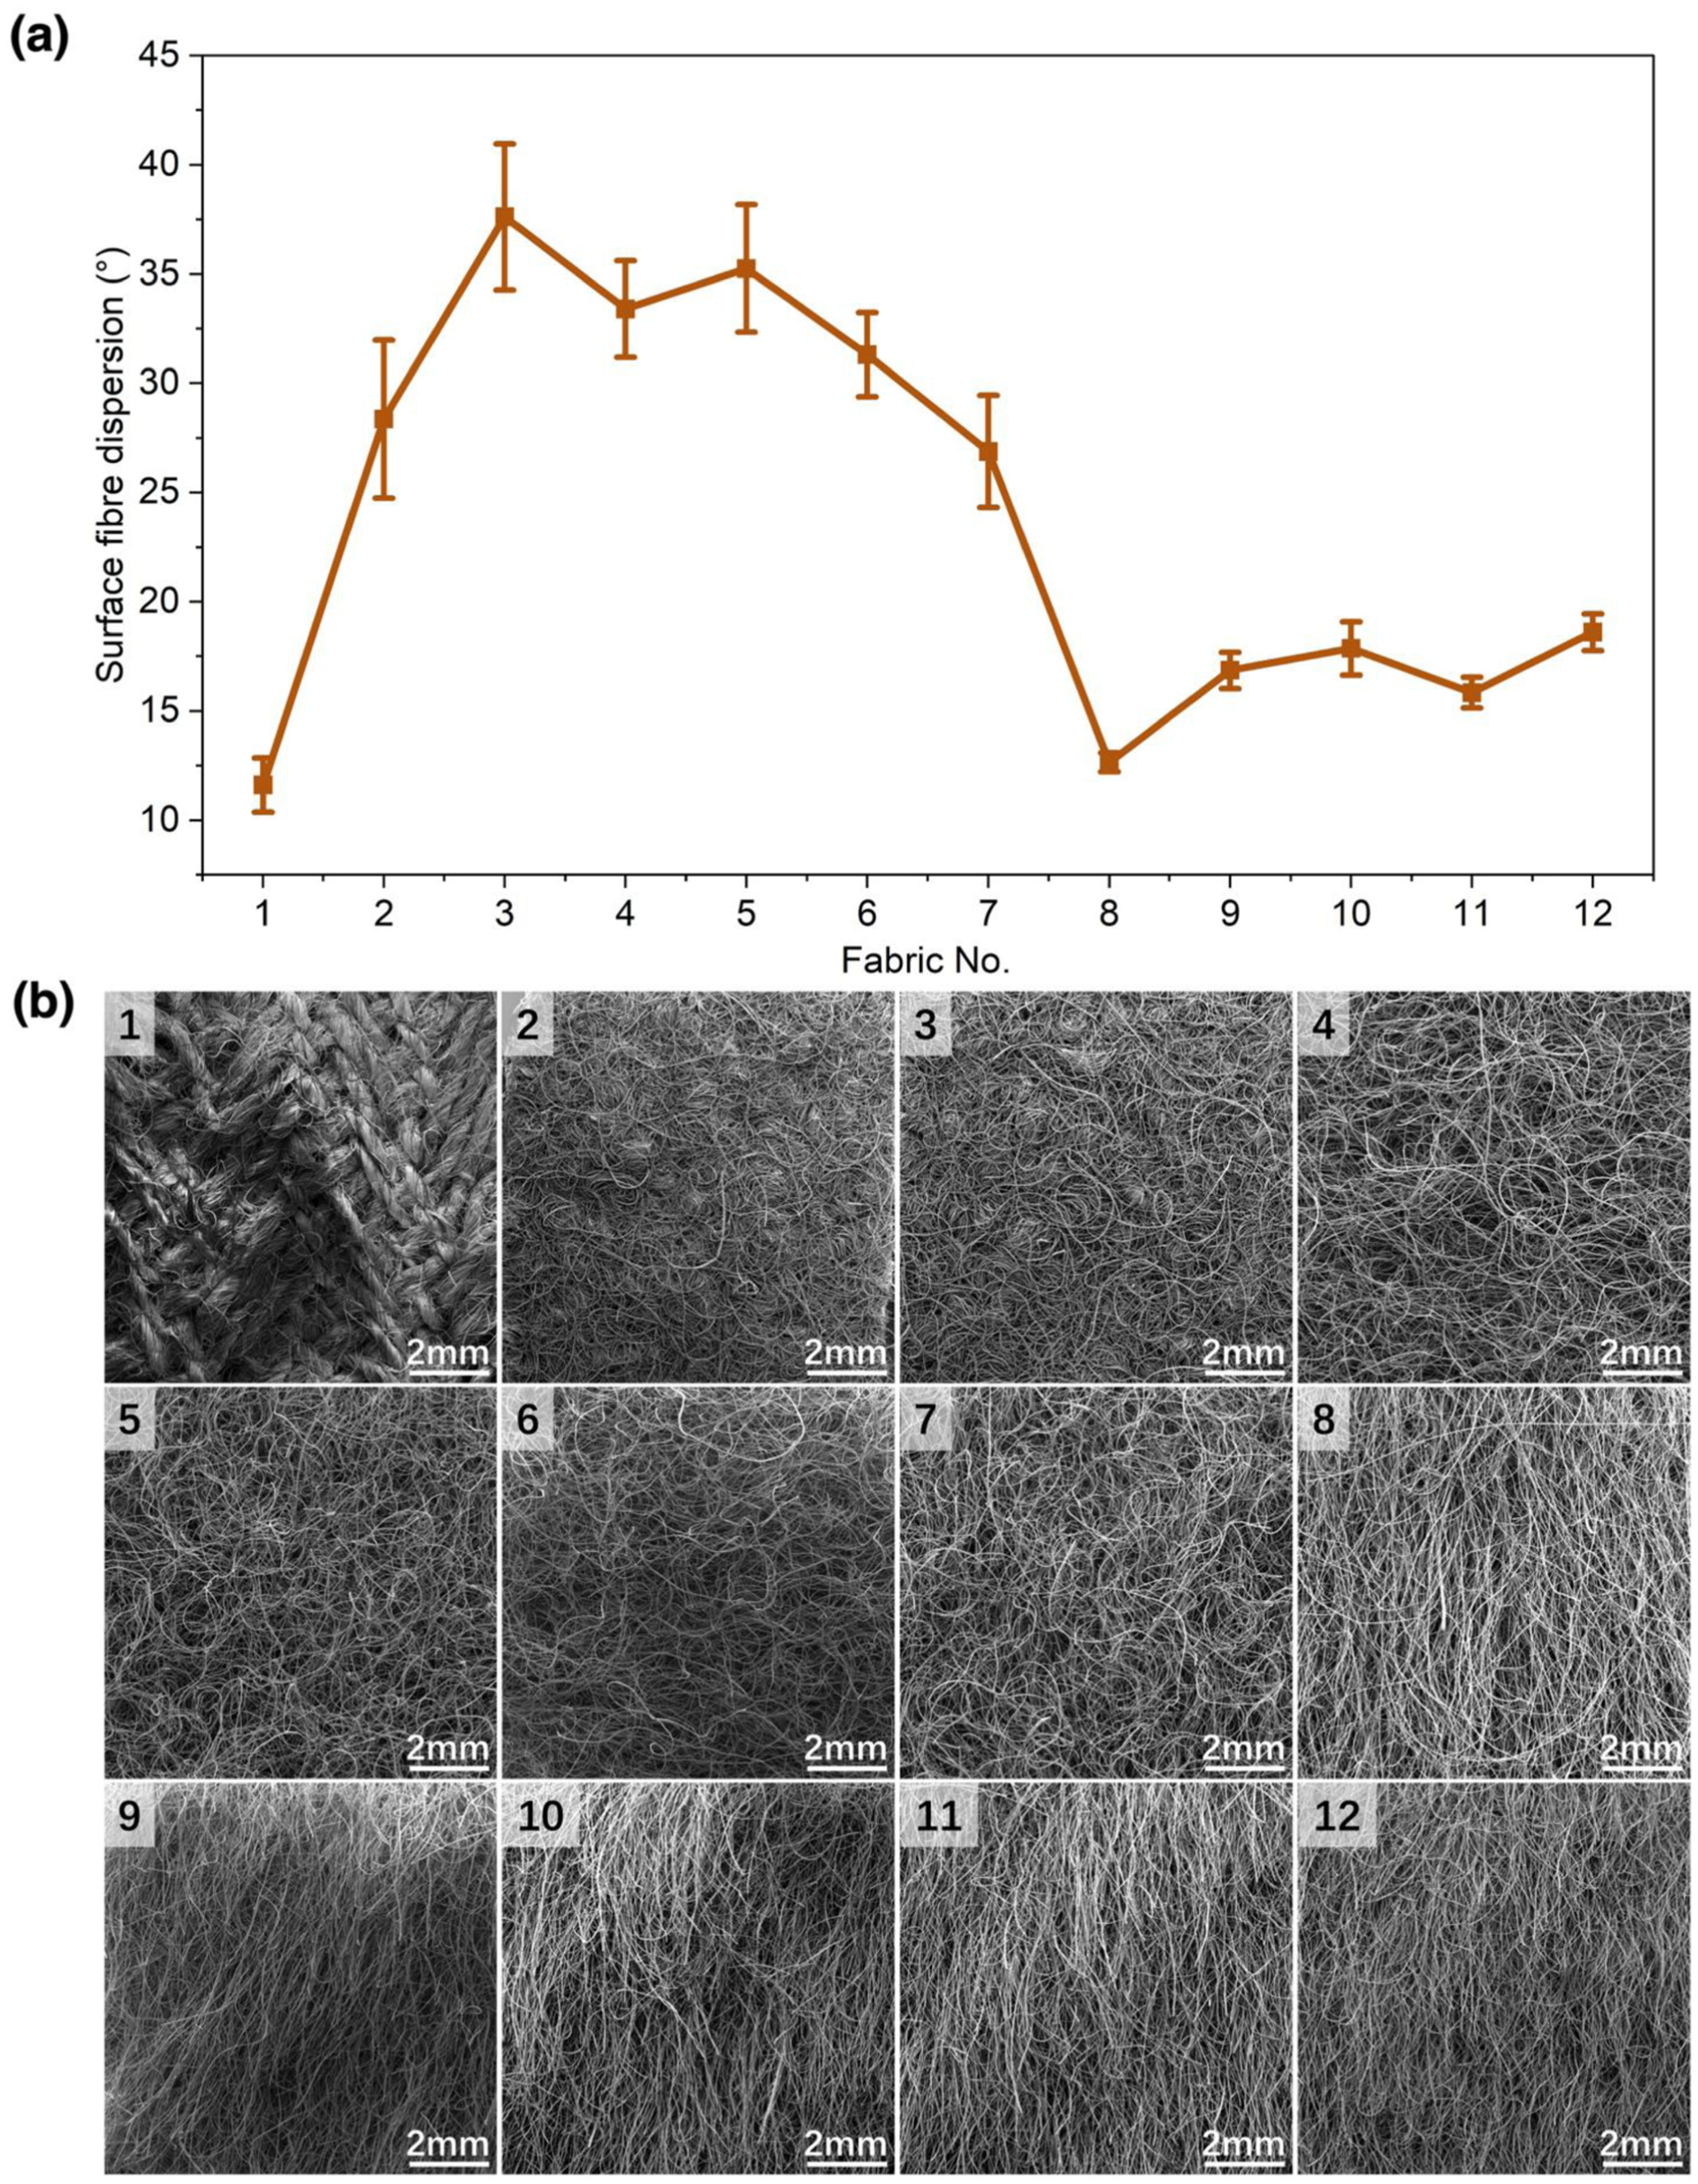
Fabric surface fiber alignment changes across production process. (a) Variation of surface fiber alignment dispersion; (b) surface morphology of fabrics.
By contrast, the most notable reduction occurred from Fabric 7 to 8, where the dispersion value dropped sharply to its lowest level. This result is consistent with the marked decrease in fabric hair thickness after the postraising stage, as well as the strong fiber reorientation effect introduced by calendering. The surface fiber layer, which was highly developed before Fabric 8, appears to have been flattened and aligned more uniformly by calendering, thereby significantly reducing the angular spread of fiber directions.
From Fabric 9 to 12, the dispersion values increased slightly but remained at a relatively low level overall. This minor increase may be related to the progressive emergence of the pronounced diagonal twill-like surface relief on the fabric face after repeated shearing, which became visually more apparent in the later-stage fabrics. Nevertheless, compared with the high-dispersion state before calendering, the overall reduction in dispersion after Fabric 8 remained substantial. These results suggest that calendering played a key role in lowering surface fiber alignment dispersion.
Fabric hand performance changes during finishing
Owing to the significant increase in bulk thickness and surface pile height after the raising process, Fabrics 4 to 7 exceeded the sample height limit of the FTT. As a result, only compression and thermal flux data were collected for these samples. Nevertheless, the effects of the later finishing processes on hand feel and skin comfort were systematically recorded to evaluate their influence on the final sensory performance
In terms of the smoothness index (Figure 9(a)), the index decreased noticeably from Fabric 1 to 3. This reduction is consistent with the structural disruption introduced by milling and scouring, which made the surface less regular than the original woven state. By contrast, from Fabric 8 to 12, the smoothness index showed an overall increasing trend. This trend reflects the progressive surface refinement caused by calendering, shearing, and decatizing, which reduced surface protrusions and improved uniformity. A distinct increase in smoothness occurred after the second calendering process (Fabric 9 to 10). This suggests that repeated calendering further flattened the surface and enhanced surface regularity. Notably, the smoothness index of the gray fabric (Fabric 1) was higher than that of the final finished fabric (Fabric 12), as well as all other measured fabrics. This may be related to the fact that Fabric 1 still retained its original woven surface structure after weaving and had not yet developed the raised surface hair layer observed in the later finishing stages.
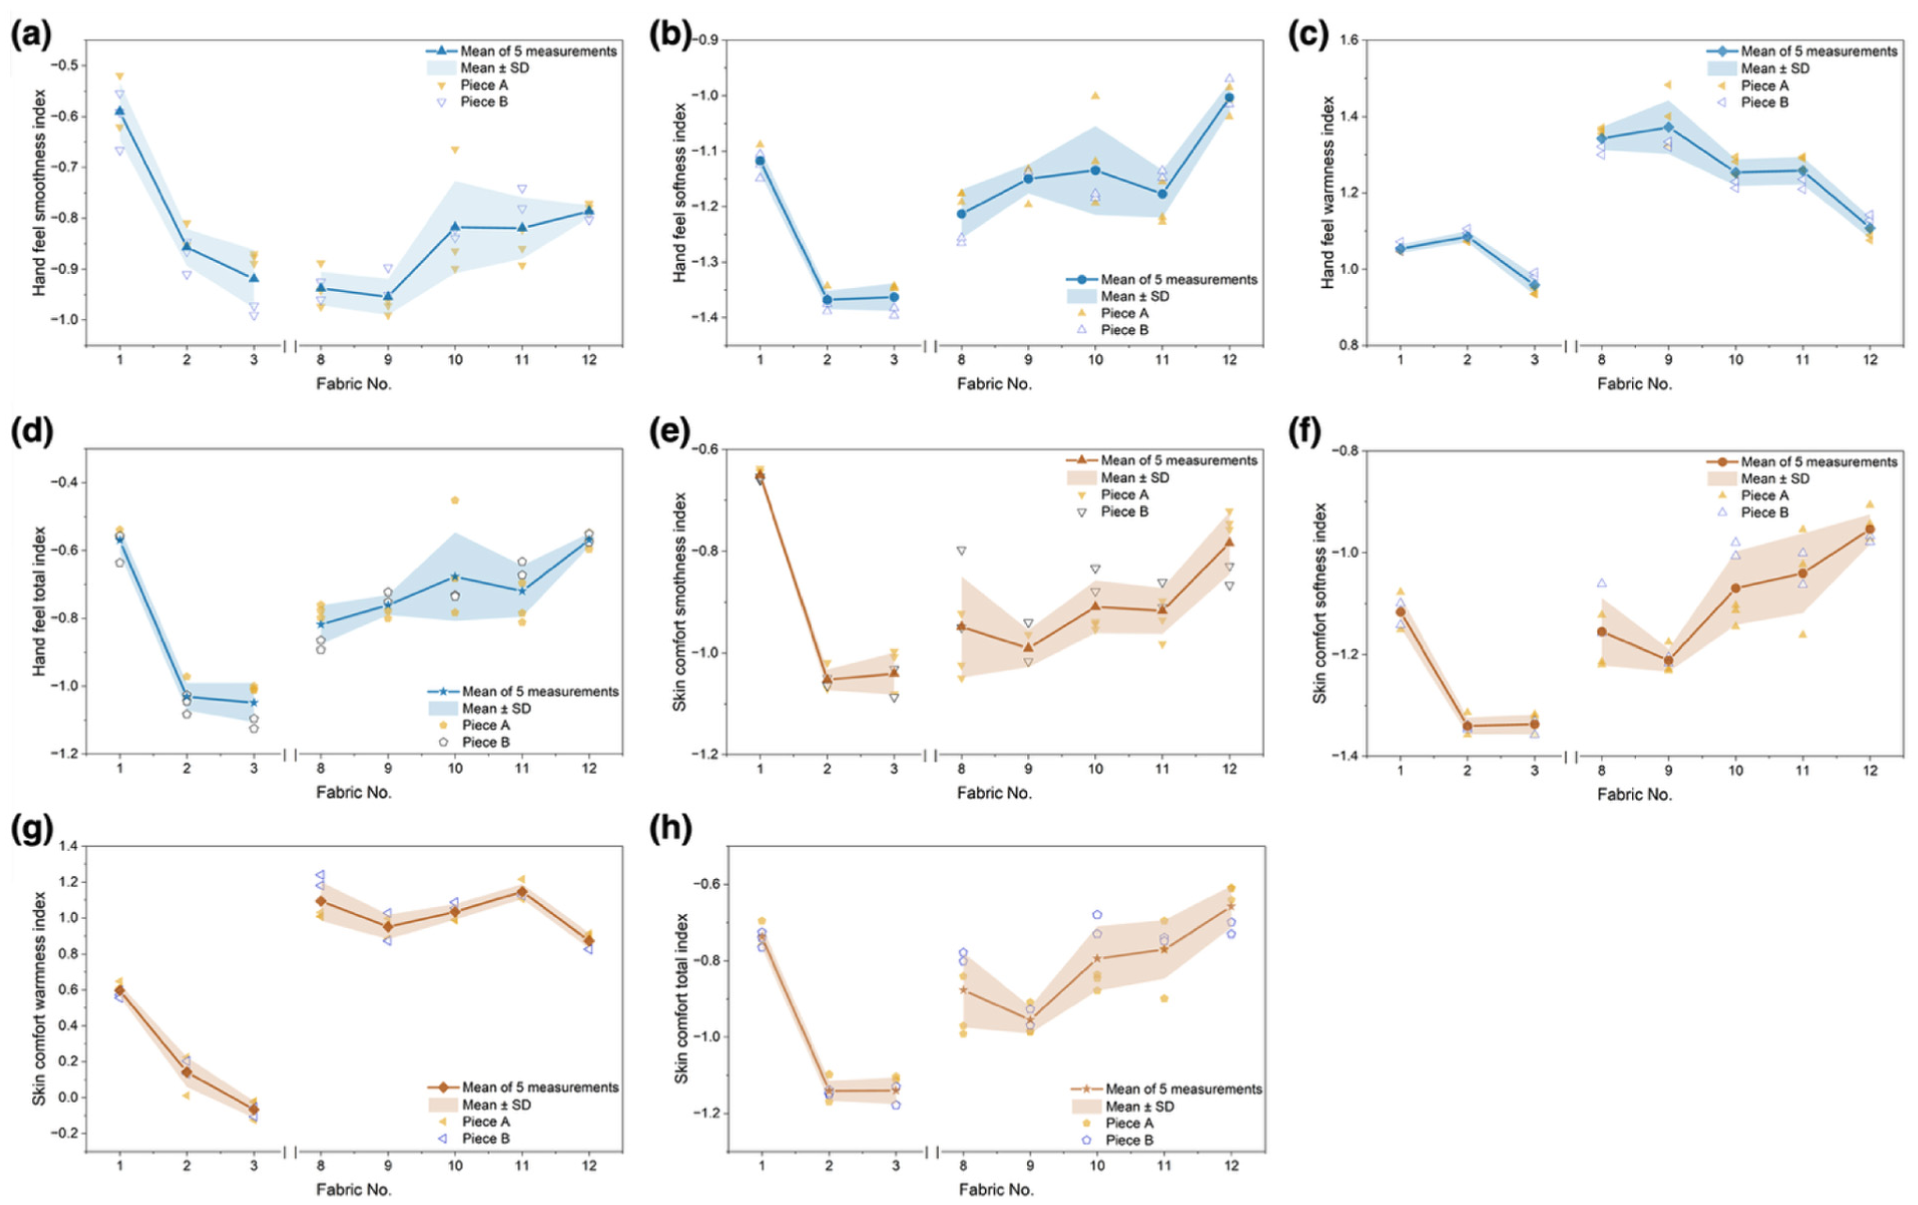
Primary sensory indices for fabric hand and skin comfort properties evaluated by the fabric touch tester. (a) Hand feel smoothness index, (b) hand feel softness index, (c) hand feel warmness index, (d) hand feel total index, (e) skin comfort smoothness index, (f) skin comfort softness index, (g) skin comfort warmness index, (h) skin comfort total index.
Unlike the smoothness index, the softness index (Figure 9(b)) of the finished fabric (Fabric 12) was the highest among all stages. In contrast, Fabrics 2 and 3 show a relatively lower softness index. A sharp decline was observed from Fabric 1 to 2, then a gradual upward trend was observed from Fabric 8 to 12. The low softness in the early finishing stages may be related to increased compaction and surface disorder after milling and scouring, whereas the later improvement suggests that successive surface modification and structural stabilization enhanced the perceived softness. A notable increase from Fabric 11 to 12 further highlights the effectiveness of decatizing in improving fabric softness at the final stage.
In terms of warmness (Figure 9(c)), the index remained relatively low from Fabric 1 to 3, reaching the lowest point after the first decatizing (Fabric 3). From Fabric 8 to 12, warmness indices exhibited a general downward trend. Notably, consistent with the result observed for Fabric 3, a substantial decrease in warmness was also recorded after the second decatizing treatment (Fabric 12). This suggests that decatizing and the subsequent calendering and shearing reduced the bulkiness and insulating effect of the surface fiber layer, thereby lowering the warmness sensation.
The hand feel total index (Figure 9(d)) exhibited a substantial decrease from Fabric 1 to 2, reaching its lowest level at Fabric 3. From Fabric 8 onward, the total hand index showed a general upward trend through Fabric 8 to 12. Overall, the substantial decline in total hand before raising was mainly related to the marked decrease in smoothness and softness after milling and scouring. In contrast, after raising and smoothing, the subsequent calendering, shearing, and decatizing stages progressively increased the smoothness and softness indices while lowering the warmness index, thereby contributing to an overall increase in the total hand index.
Skin comfort performance changes during finishing
In terms of the skin comfort smoothness index (Figure 9(e)), the index exhibited a notable decrease from Fabric 1 to 2, indicating a rougher backside surface after milling and scouring. The reduction at this stage was greater than that observed for the hand feel smoothness index. From Fabric 8 onward, the smoothness index showed a general upward trend. Overall, the trend was consistent with that of the hand feel smoothness index.
Consistent with the trend observed for the smoothness index, the skin comfort softness index (Figure 9(f)) exhibited a marked decline from Fabric 1 to 2, with Fabrics 2 and 3 recording the lowest levels across all stages. A general upward trend was observed from Fabric 8 to 12 as well, with the softness index reaching its peak at Fabric 12. In contrast with the smoothness index, the softness index exceeded that of the gray fabric (Fabric 1) after Fabric 10, indicating a notable improvement in softness following the second calendering and subsequent finishing treatments.
The skin comfort warmness index (Figure 9(g)) showed a declining trend from Fabric 1 to 3, reaching the lowest point after the first decatizing stage (Fabric 3). From Fabric 8 to 12, the index did not show a clear overall trend; however, a notable decrease was again observed after the second decatizing stage (Fabric 12). These results suggest that decatizing reduced the warmness sensation, as evidenced by the marked decreases observed after both decatizing stages. Compared with the hand feel warmness index, the skin comfort warmness index showed a less consistent trend during the later finishing stages. This difference may be associated with the double-faced structure of the fabric because the front and back surfaces developed different morphological features during finishing. The front showed a more pronounced textured relief after repeated shearing, whereas the back remained relatively less structured (see Figures 7(a) and 7(e)). These front-back differences may have contributed to the different warmness responses observed for hand feel and skin comfort.
In terms of the total skin comfort index (Figure 9(h)), the index decreased noticeably from Fabric 1 to 2, with Fabrics 2 and 3 showing the lowest levels among all measured fabrics. From Fabric 8 to 12, the total skin comfort index generally increased, despite a slight decline from Fabric 8 to 9. Overall, this trend was consistent with those observed for the smoothness and softness indices. Compared with the hand feel total index, the main divergence was observed at Fabric 9, corresponding to the shearing stage. Based on the previous structural analysis, this difference may be related to the development of a more pronounced textured surface relief on the front after shearing, whereas the back did not show the same morphology.
Correlation analysis
Figure 10 presents the Pearson correlation heat map for 33 variables, including eight structure-related variables, eight primary sensory indices, and 17 FTT-measured parameters. The color scale ranges from blue (positive correlation) to brown (negative correlation), corresponding to Pearson correlation coefficients (r) from 1 to –1. Asterisks indicate statistical significance (*p<0.05; **p<0.01; ***p<0.001). Overall, the fabric hair thickness variables were strongly associated with parameters in the compression and roughness modules, fabric core thickness was strongly associated with variables in the bending module, and surface fiber dispersion showed a moderate association with the surface roughness wavelength in the roughness module. Correspondingly, fabric hair thickness was highly related to the warmness indices, fabric core thickness was moderately related to the skin comfort softness and total indices, and surface fiber dispersion was associated with both the warmness and total indices.
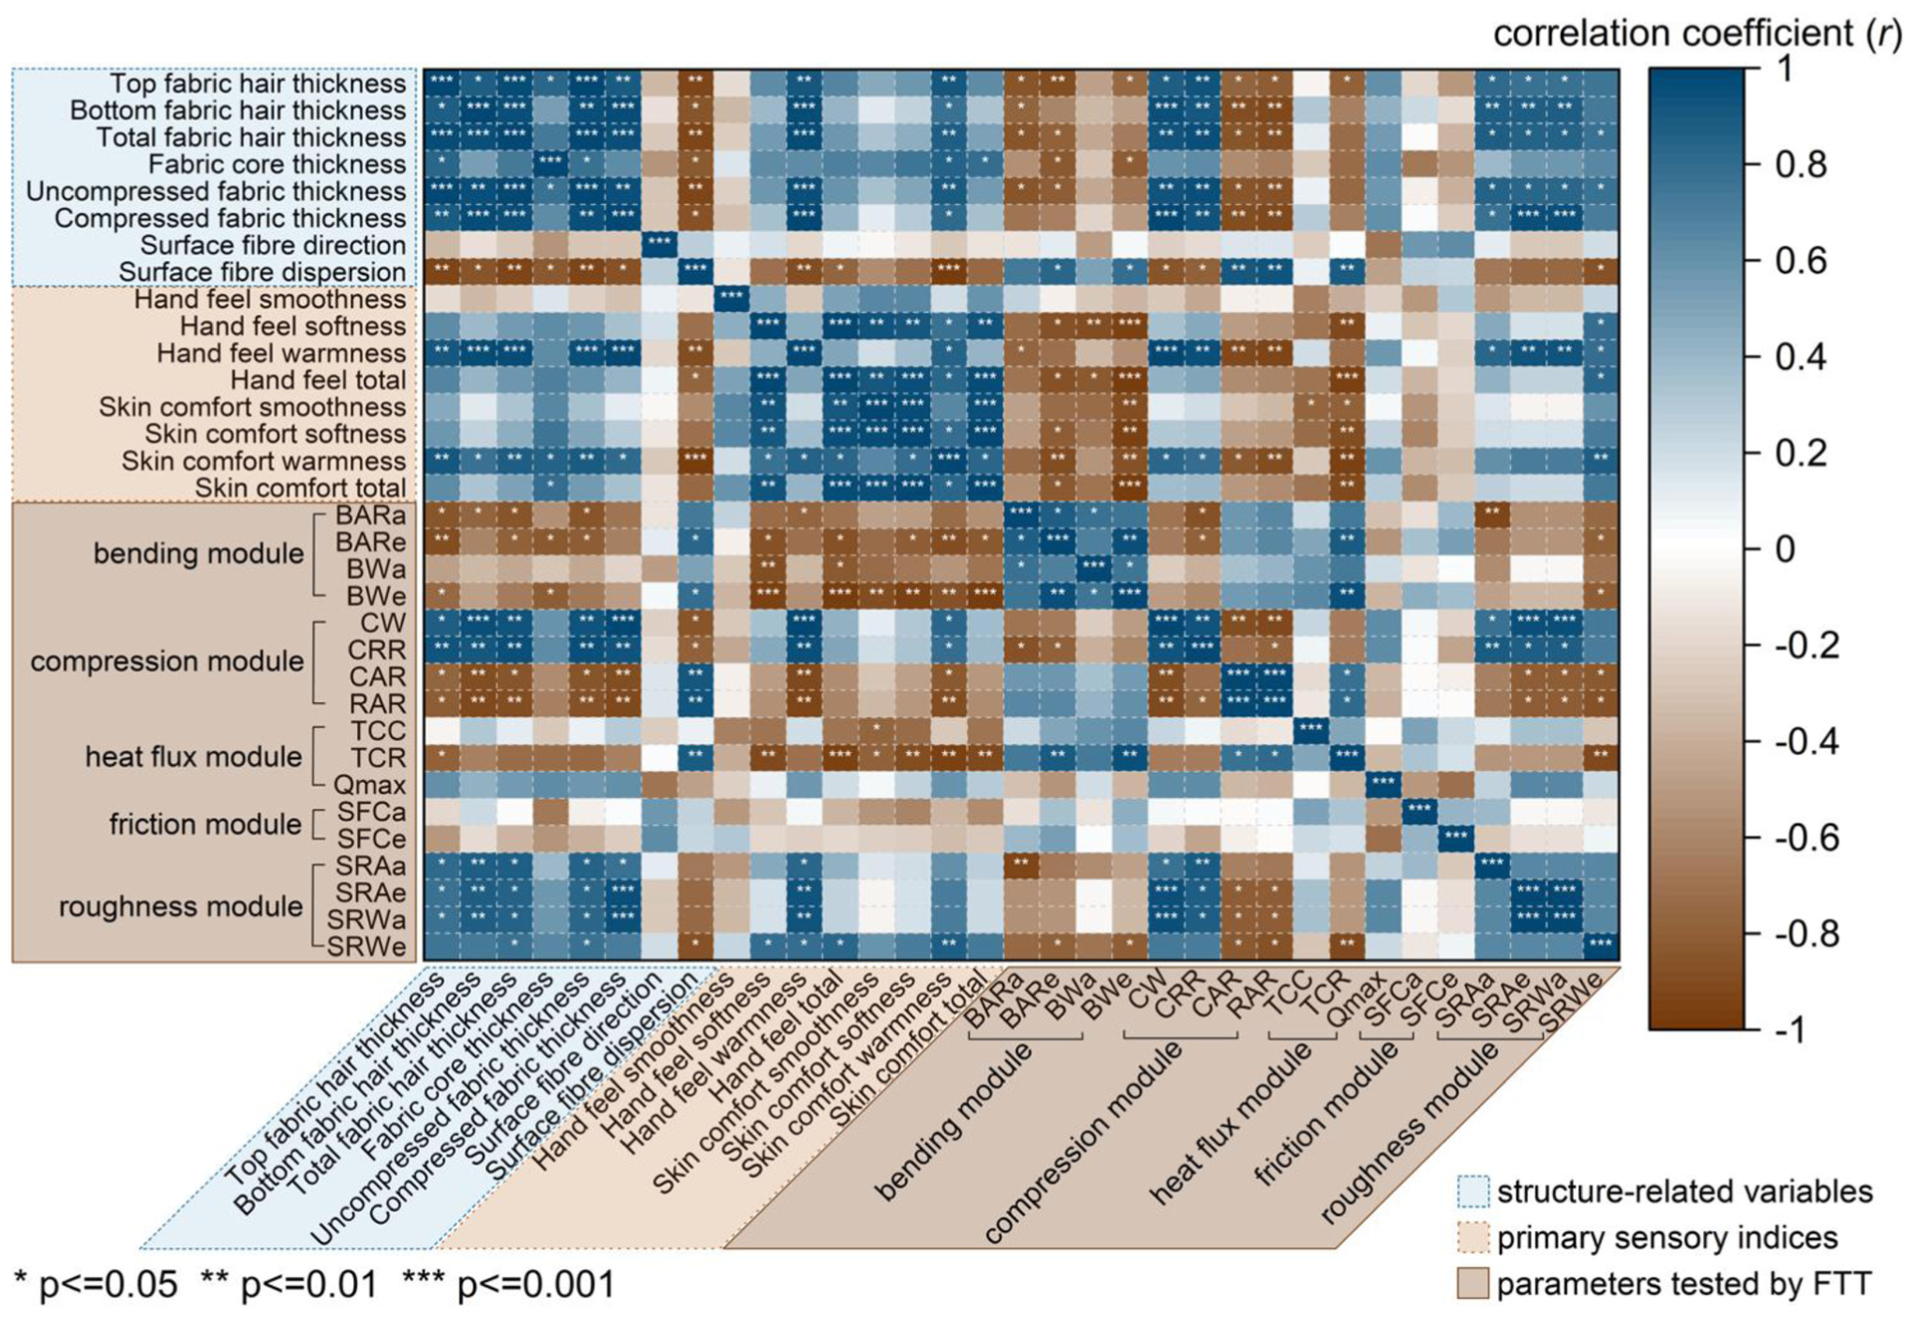
Pearson correlation heat map of fabric structural properties and performance parameters.
Based on the strongest associations observed in Figure 10, further regression analyses were conducted between selected structural parameters and FTT-evaluated indices, including total fabric hair thickness (
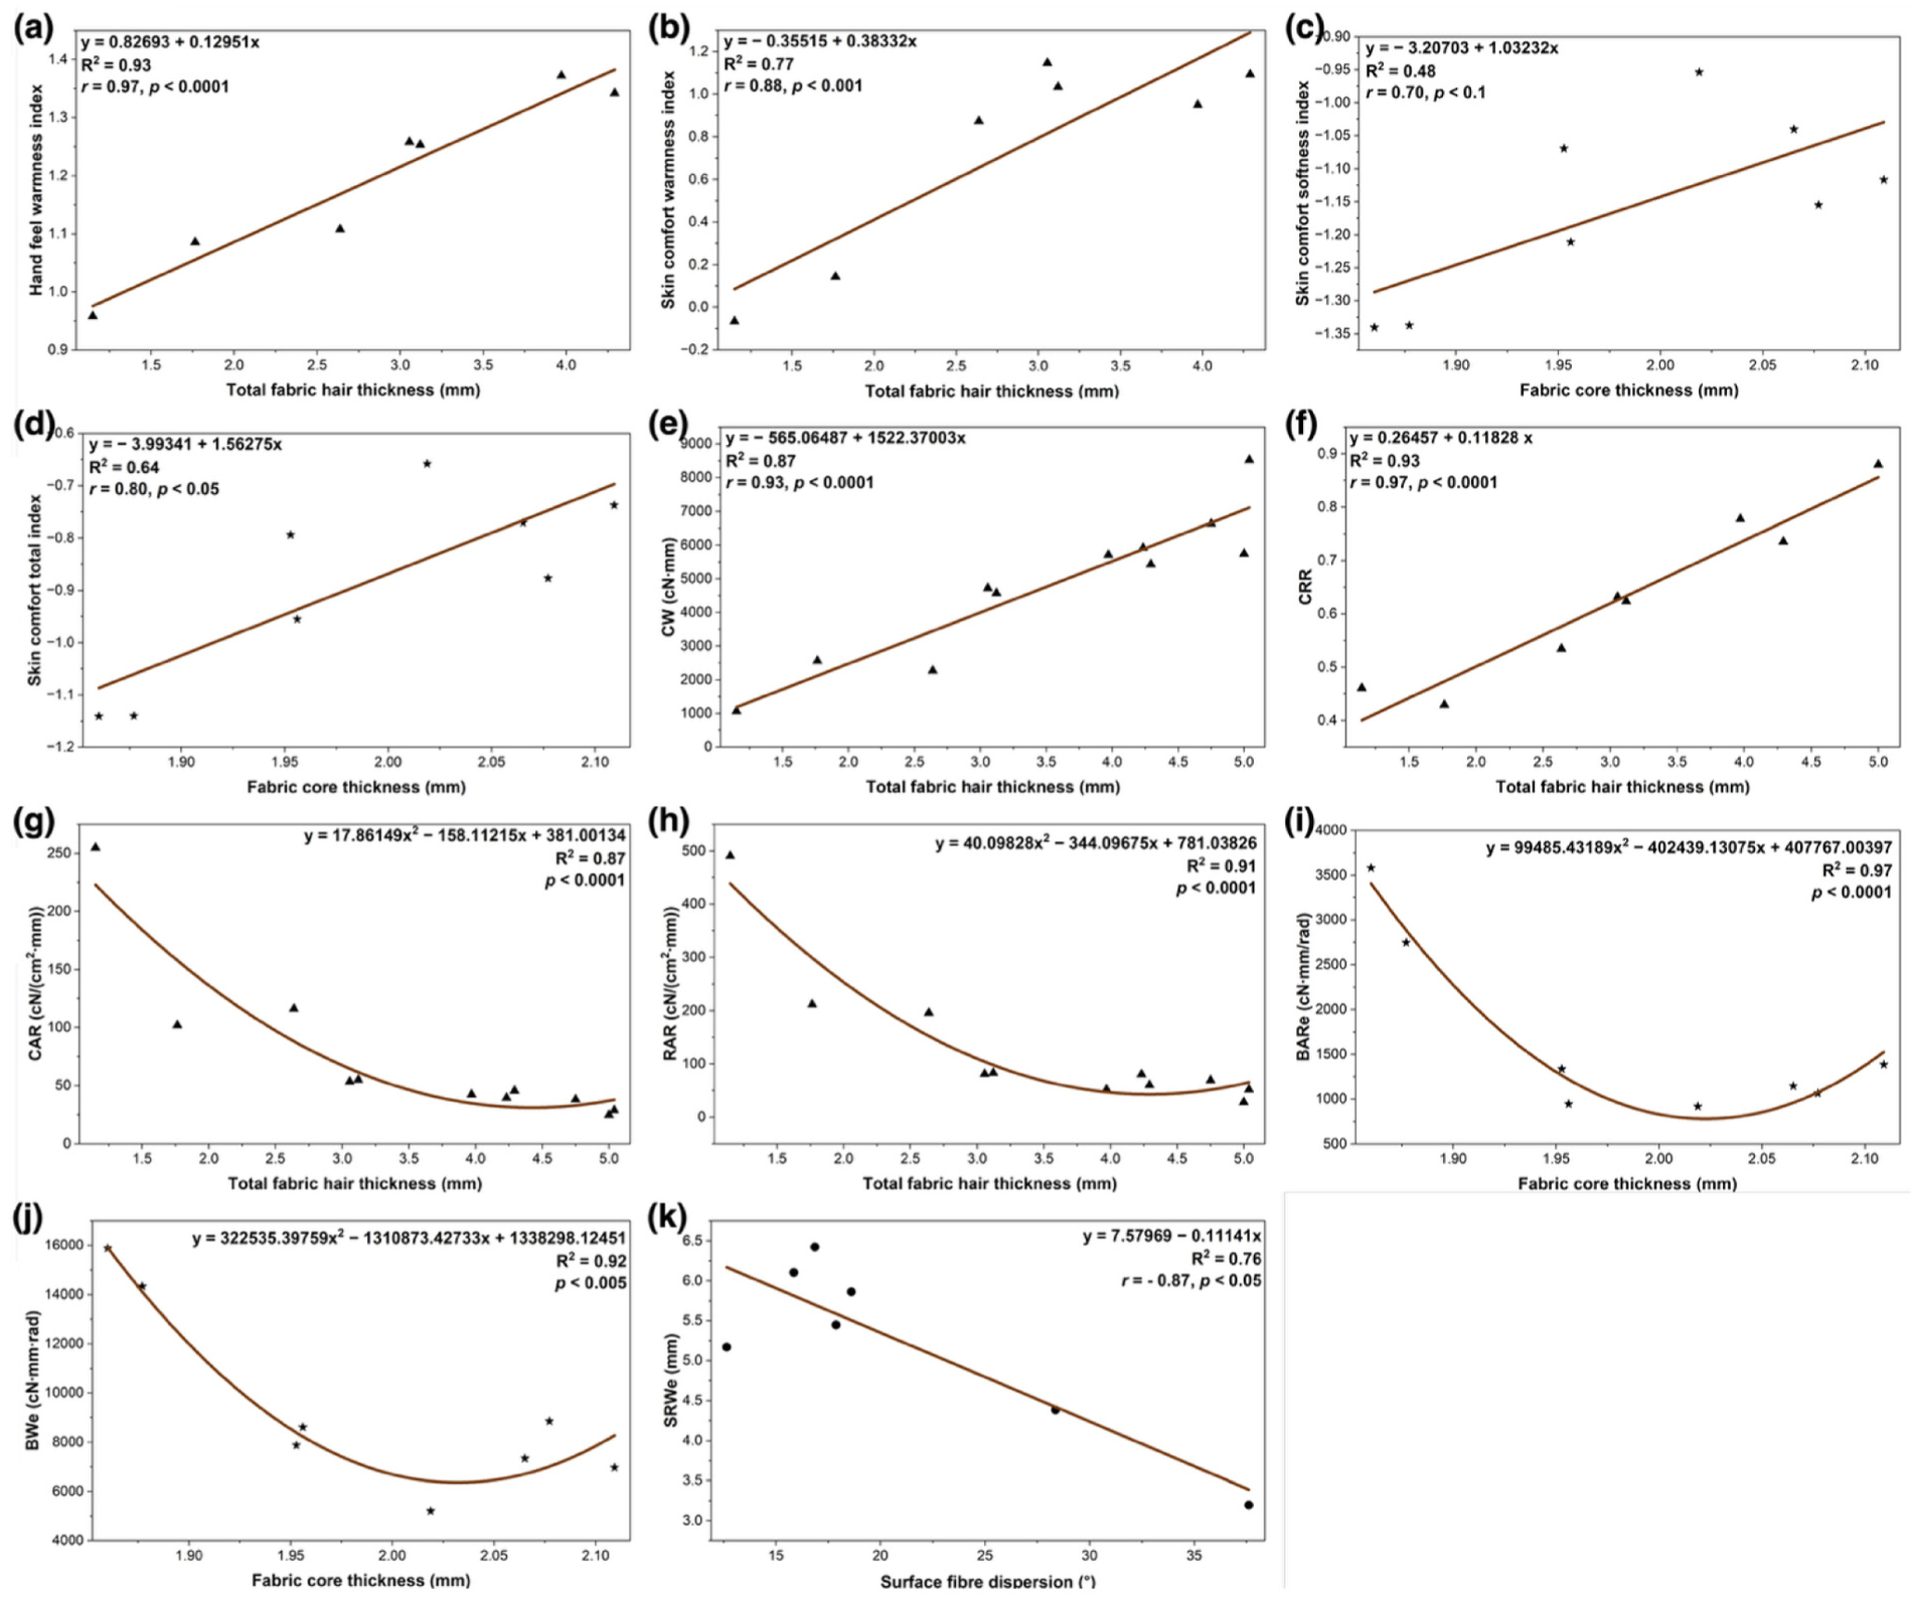
Correlation analysis between fabric structural parameters and indices evaluated by the fabric touch tester. (a) Total fabric hair thickness vs. hand feel warmness index; (b) total fabric hair thickness vs. skin comfort warmness index; (c) fabric core thickness vs. skin comfort softness index; (d) fabric core thickness vs. skin comfort total index; (e) total fabric hair thickness vs. compression work (CW); (f) total fabric hair thickness vs. compression recovery rate (CRR); (g) total fabric hair thickness vs. compression average rigidity (CAR); (h) total fabric hair thickness vs. recovery average rigidity (RAR); (i) fabric core thickness vs. bending average rigidity in the weft direction (BARe); (j) fabric core thickness vs. bending work in the weft direction (BWe); (k) surface fiber dispersion vs. surface roughness wavelength in the weft direction (SRWe).
Relationship between fabric structure and fabric hand performance
A statistically significant positive relationship was identified between total fabric hair thickness (
Relationship between fabric structure and skin comfort performance
Regression analysis was conducted to examine the relationships of total fabric hair thickness (
As illustrated in Figures 11(c) and 11(d),
Relationship between fabric structure and mechanical properties
Total fabric hair thickness and compression module parameters (CW; CRR; CAR; RAR)
Correlation analysis revealed that fabric hair thickness is significantly associated with all parameters within the FTT compression module.
The regression model for
Fabric core thickness and bending module parameters
A clear nonlinear relationship was identified between
In terms of BWe, a quadratic regression model was applied to examine its relationship with
Surface fiber dispersion and roughness
Based on the regression model of surface fiber dispersion against SRWe, a statistically significant negative relationship was observed (
Discussion
Fabric core thickness and its relationship with skin comfort properties
Fabric core thickness was highly associated with fabric bending properties in weft direction in this study. However, it is important to acknowledge that fabric rigidity is the result of multiple structural parameters acting in combination; factors such as pile layer thickness, surface fiber characteristics, yarn structure, fabric pattern and density may also contribute to variations in bending behavior, particularly in complex multilayered fabrics.34,48–50 Even so, the present study addresses a clear gap by quantifying the link between fabric core thickness, bending parameters, and subsequent skin comfort indices. Within the sampled set, variation in core thickness alone explained more than 90% of the variance in the weft-direction bending metrics, indicating that core thickness is a principal and measurable factor influencing tactile properties for this fabric type. Given the very strong associations between BARe and BWe and the primary sensory indices of skin comfort, particularly softness and the total index (Figure 10), core thickness is strongly associated with these perceptual outcomes through its effect on bending. Future studies may benefit from multivariate regression or structural equation modeling to isolate and quantify the contribution of additional variables, ultimately providing a more comprehensive understanding of fabric hand mechanics.
Effects of surface fiber alignment dispersion on hand feel properties
As shown in Figure 8, calendering markedly reduces the surface fiber alignment dispersion value of the fabric during finishing, indicating improved alignment of the surface fibers. This observation accords with prior reports that calendering flattens the fiber layer and enhances surface gloss by promoting a more uniformly oriented, lustrous surface. 27 By quantifying fiber alignment-related properties, the analysis suggests that lower alignment dispersion is associated with improved hand feel within the range studied. Improved alignment likely stabilizes the skin-fabric interface and limits microscale stick and slip, which in turn contributes a smoother hand feel.
The correlation analysis also indicates a significant negative association between surface fiber alignment dispersion and SRWe. However, this relationship should be interpreted within the specific structural context of the fabric studied here. The sampled double-faced semi-worsted wool fabric developed a distinctive surface morphology during finishing, characterized by a subtle twill-like surface relief (see Figure 7(a)) that became more apparent after repeated shearing and calendering. In this case, reduced dispersion was accompanied by a more regular and extended roughness wavelength in the weft direction, suggesting that the observed relationship reflects not only fiber alignment itself, but also the fabric-specific surface relief formed during finishing. Therefore, the linkage between dispersion and SRWe observed in this study is likely fabric-specific rather than universally applicable, and should be understood in relation to the structural characteristics and finishing route of this wool fabric.
Implications of tracking fabric structural changes for manufacturing operations
The structure of semi-worsted wool textiles changes dynamically during the manufacturing and finishing stages. The results of this study demonstrate a significant positive linear relationship between
After repeated shearing, the total fabric hair thickness tends to stabilize and may be approximated as follows:

where
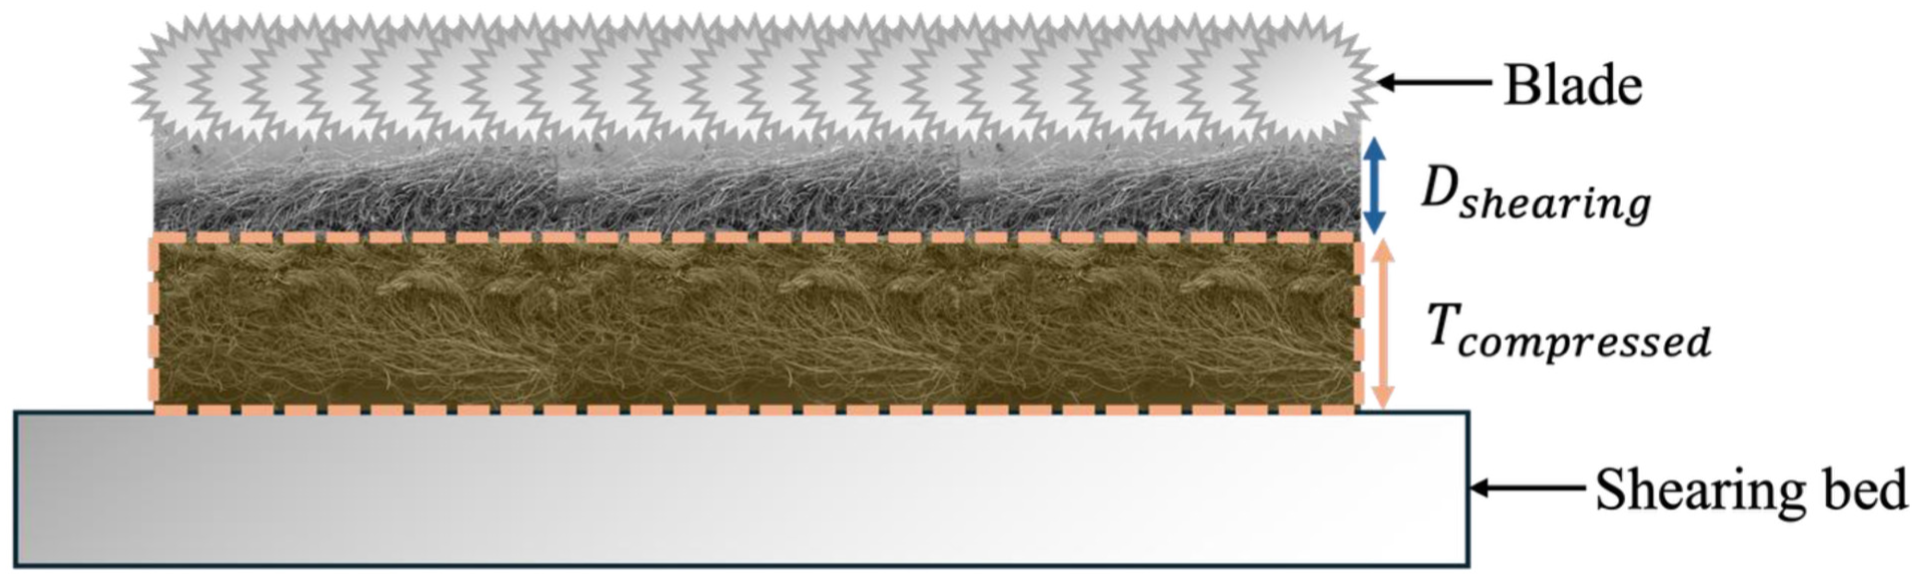
Schematic illustration of shearing depth and fabric structure.
Linear regression analysis showed a strong positive relationship between

where CW is the compression work (in centinewton millimeters), and
The relationship between CW and hand feel warmness (

where
By substituting equation (2) into equation (3), CW can be reformulated as

where CW is the compression work (in centinewton millimeters),
Substituting equation (5) into equation (4) gives an approximate formula for hand feel warmness as a function of structural and machine parameters:
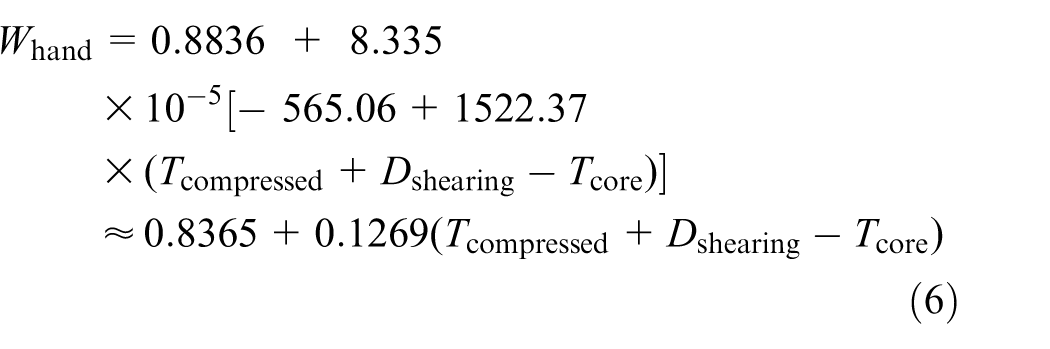
where
By integrating structural data with process parameters, manufacturers may achieve predictive control over fabric comfort performance. This makes it possible to design processing conditions according to target product properties, thereby reducing the risk of reprocessing caused by substandard quality. Such an approach can improve product consistency, reduce reliance on repeated physical testing, and support the objectives of the Ecodesign for Sustainable Products Regulation, which encourages the development of more energy-efficient products and the use of optimized equipment and processes to reduce energy consumption during production. 36 Ultimately, this methodology supports the transition towards digitalized, performance-driven manufacturing systems.
Conclusion
This study examined how structural changes during wool textile manufacturing and finishing influence fabric hand and skin comfort. In this study, fabric structural variation was described from two dimensions: cross-sectional structure (total fabric hair thickness and fabric core thickness) and surface structure (surface fiber alignment dispersion). These structural parameters showed systematic and interpretable links with both perceptual and instrumental outcomes. Total fabric hair thickness was positively associated with the warmness indices and strongly associated with the compression-module parameters measured by the FTT. Fabric core thickness was positively associated with the skin comfort softness and total indices within the studied range, and showed nonlinear relationships with BARe and BWe that were well captured by quadratic regression. By contrast, greater surface fiber alignment dispersion was associated with a reduction in the total hand feel index and showed a moderate association with SRWe. From a manufacturing perspective, the results suggest that integrating structural data with process parameters can support predictive control of comfort-related properties, guide target-based process design, reduce reprocessing, and improve consistency and energy efficiency. In this way, the study contributes not only by converting visible structural features into quantitative variables and linking them to predictive relationships between structure, hand feel, and skin comfort, but also by demonstrating a practical approach for tracking structural evolution during finishing. By combining SEM observation, image-based analysis, and FTT evaluation, the study systematically reveals how both cross-sectional and surface structures change across the finishing sequence.
However, the present study should be regarded as an initial step only. It was carried out on a single double-faced semi-worsted wool fabric with one material composition and one fabric construction, tracked across different manufacturing and finishing stages. Therefore, the applicability of the conclusions has clear boundaries, and the identified relationships should not be directly generalized to fabrics with different raw materials, constructions, or surface morphologies. In addition, the sample size was limited, and the FTT could not capture the full set of hand-related parameters for fabrics thicker than 5 mm during the raising-related stages. Future work should extend the analysis to fabrics with different fiber compositions, weave structures, and constructional characteristics in order to verify the robustness of the observed relationships. It would also be valuable to investigate the combined effects of multiple structural parameters and finishing variables to further refine predictive models for intelligent manufacturing and digital quality control.
