
Abstract
During the carbon fiber braiding process, stick–slip dynamics and impact loads induced by the carrier ratchet–pawl mechanism are key contributors to yarn tension instability. Conventional deterministic optimization approaches often neglect inherent parametric variability and time-dependent uncertainties, leading to optimal solutions that exhibit high sensitivity and limited robustness under manufacturing tolerances and environmental disturbances. To enhance tension stability in slider-type carriers, this study proposes a reliability-oriented structural parameter optimization framework that explicitly incorporates parametric uncertainty. Based on a nonlinear tension dynamic model, the stochastic characteristics of spring stiffness and friction coefficients are statistically quantified. A composite performance metric is formulated using the mean and dispersion of peak tension, and a sequential optimization strategy is implemented within a predefined computational budget. The optimized design achieves a 16.3% reduction in peak tension and a 3.9% decrease in tension standard deviation under nominal operating conditions. In 1000 Monte Carlo validation simulations, the width of the 95% confidence interval is reduced by 28.2%, the standard deviation of peak tension decreases by 31.8%, and the coefficient of variation is lowered by 17.6%. No yarn slackening failure is observed in the validation tests. Further analysis reveals a two-stage stiffness coordination mechanism, characterized by an initial low-stiffness energy-absorption phase followed by a high-stiffness support regime. These findings provide a theoretical foundation for reliability-oriented carrier design and tension stability optimization.
Carbon-fiber-reinforced polymer composites have been widely used in fields such as aerospace, 1 advanced equipment, 2 and energy engineering 3 due to their excellent specific strength, specific stiffness, corrosion resistance and designability. 4 With the continuous improvement of structural complexity and service requirements, composite components have been proposed with higher requirements for fiber integrity and structural consistency during the prefabricated manufacturing stage.5–7 Among various preform forming technologies, three-dimensional braiding technology has become an important means to prepare high-performance composite structures because it can achieve continuous penetration reinforcement of fibers in the thickness direction and effectively improve interlayer properties.8–10
During the three-dimensional braiding process, maintaining the stability of yarn tension is very important for producing high-performance composite preforms.11–13 Excessive tension can easily cause carbon fiber monofilament breakage, 14 fluffing, and other damages, 15 while too low a tension may lead to yarn relaxation and uneven braiding density, thereby forming geometric defects or local weak areas. 16 Therefore, studying the formation mechanism and regulation method of yarn tension during the braiding process has always been an important research direction in the field of composite braiding equipment.
As the core execution unit in the three-dimensional braiding machine, the yarn carrier is responsible for the functions of yarn storage, release, and passive tension adjustment. Its dynamic characteristics directly determine the time domain response behavior of the yarn tension. Scholars have carried out systematic research on the structure of the yarn carrier and its tension control mechanism.17–19 Ma et al. 20 established a dynamic model of the carrier tension system of a braiding machine, analyzed the influence of spring stiffness and geometric parameters on yarn tension changes, and revealed the basic force characteristics of the carrier system during the braiding cycle. Kyosev 21 in his monograph described the yarn feeding mechanism of leveraged and sliders conveyors. The lever and slider allow the carrier to have a certain amount of yarn storage and maintain the tension of the yarn through the action of the spring. van Ravenhorst and Akkerman 22 considered yarn friction, established a mathematical model considering yarn interaction, and solved the problem of large braiding angle deviation during variable cross-section braiding. Zhang et al. 23 proposed a new solution to improve the structure of the yarn carrier, guiding the fiber through a pulley system to reduce the friction between the fiber and the guide hole of the yarn carrier, so as to achieve the goal of reducing tension fluctuations. Hu et al. 24 conducted an in-depth study of the operating mechanism of the lever-type yarn carrier and established a mathematical model of yarn tension based on this. The model describes the relationship between fiber release length, lever angle, and yarn tension. The authors used the ant colony algorithm to systematically optimize the key structural parameters of the yarn carrier, such as lever angle, lever length, spring elastic coefficient, and spring precompression. The goal was to reduce tension fluctuations, optimize friction performance, and avoid pilling. This type of research provides an important theoretical basis for understanding the tension formation mechanism of the yarn carrier.
As the systematic research on the working mechanism of the yarn carrier continues to deepen, Du et al. 25 showed that its operation is generally accompanied by nonlinear dynamic responses caused by frictional contact, intermittent meshing, and impact. Due to the introduction of intermittent meshing mechanisms such as ratchets and brake blocks, the yarn carrier often exhibits complex dynamic phenomena such as segmented stiffness switching, transient separation and re-engagement impact during operation.26–28 This type of behavior is essentially a typical friction-induced stick–slip dynamics problem and has been widely studied in mechanical systems. From the perspective of nonlinear dynamics, Leine et al. 29 proposed a friction modeling method that can describe stick–slip vibration behavior, which provides an important tool for the dynamic analysis of systems containing friction and contact. Relevant studies have shown that in systems with friction and contact switching, small parameter changes can lead to significant changes in system response.30–32
Despite the current extensive research into yarn carrier dynamics and structural optimization, some key challenges remain. Most existing studies implicitly assume that the system parameters of yarn carriers remain constant during manufacturing and service processes. However, in practical engineering environments, yarn carriers are typical multifriction-pair mechanical systems,33–35 whose key parameters are inevitably influenced by manufacturing tolerances, assembly errors, material fatigue, and lubrication state variations, exhibiting significant stochastic characteristics. For strongly nonlinear dynamic systems involving frictional contact and impact coupling, such uncertainties are often amplified, leading to noticeable degradation in performance and reliability of designs optimized under nominal conditions, and even posing risks of failure in actual operation. Therefore, relying solely on deterministic modeling and optimization strategies makes it difficult to ensure stable yarn tension under real working conditions. Furthermore, existing optimization approaches mainly focus on nominal performance and lack a unified framework to simultaneously regulate both the mean response and its variability. This limitation becomes more pronounced in systems characterized by hybrid nonlinear dynamics and high computational cost, where efficient robustness-oriented optimization methods remain scarce.
In order to solve these problems, this study proposes a robust Bayesian optimization method for slider-type yarn carriers under parameter uncertainty. First, a nonlinear lumped parameter dynamic model incorporating discontinuous shocks, piecewise stiffness switching, and stick–slip behavior is established to capture the fundamental hybrid dynamics of the carrier system. Second, by combining experimental statistical characteristics with engineering prior knowledge, an uncertainty quantification scheme is developed, enabling probabilistic modeling of key parameters such as spring stiffness and friction coefficient. On this basis, a robust performance-driven optimization formula is constructed, which takes into account both the expectation and the dispersion of peak tension. By combining a Gaussian process surrogate model with a Bayesian sequential optimization strategy, the proposed method is able to efficiently explore the design space and identify robust optimal solutions under limited simulation budgets. Compared with traditional deterministic or single-objective optimization methods, the proposed framework achieves coordinated suppression of tension peaks and fluctuations while explicitly accounting for uncertainty propagation effects. Furthermore, this study reveals a mechanically interpretable stiffness coordination strategy for impact mitigation, providing new guidance for reliability-oriented structural design of yarn carriers. The proposed method provides a generalizable paradigm for robust optimization of complex nonlinear dynamic systems in composite braiding equipment.
Dynamics modeling and characterization of parameter uncertainty
Working principle of the slider-type yarn carrier
The slider-type yarn carrier, as the core executive unit of three-dimensional braiding equipment, undergoes frequent reciprocating intertwining and abrupt tension fluctuations during high-speed braiding operations, which exacerbates its wear. Thus, higher demands are imposed on the tension control capability of the yarn carrier. Its structure is illustrated in Figure 1(a).
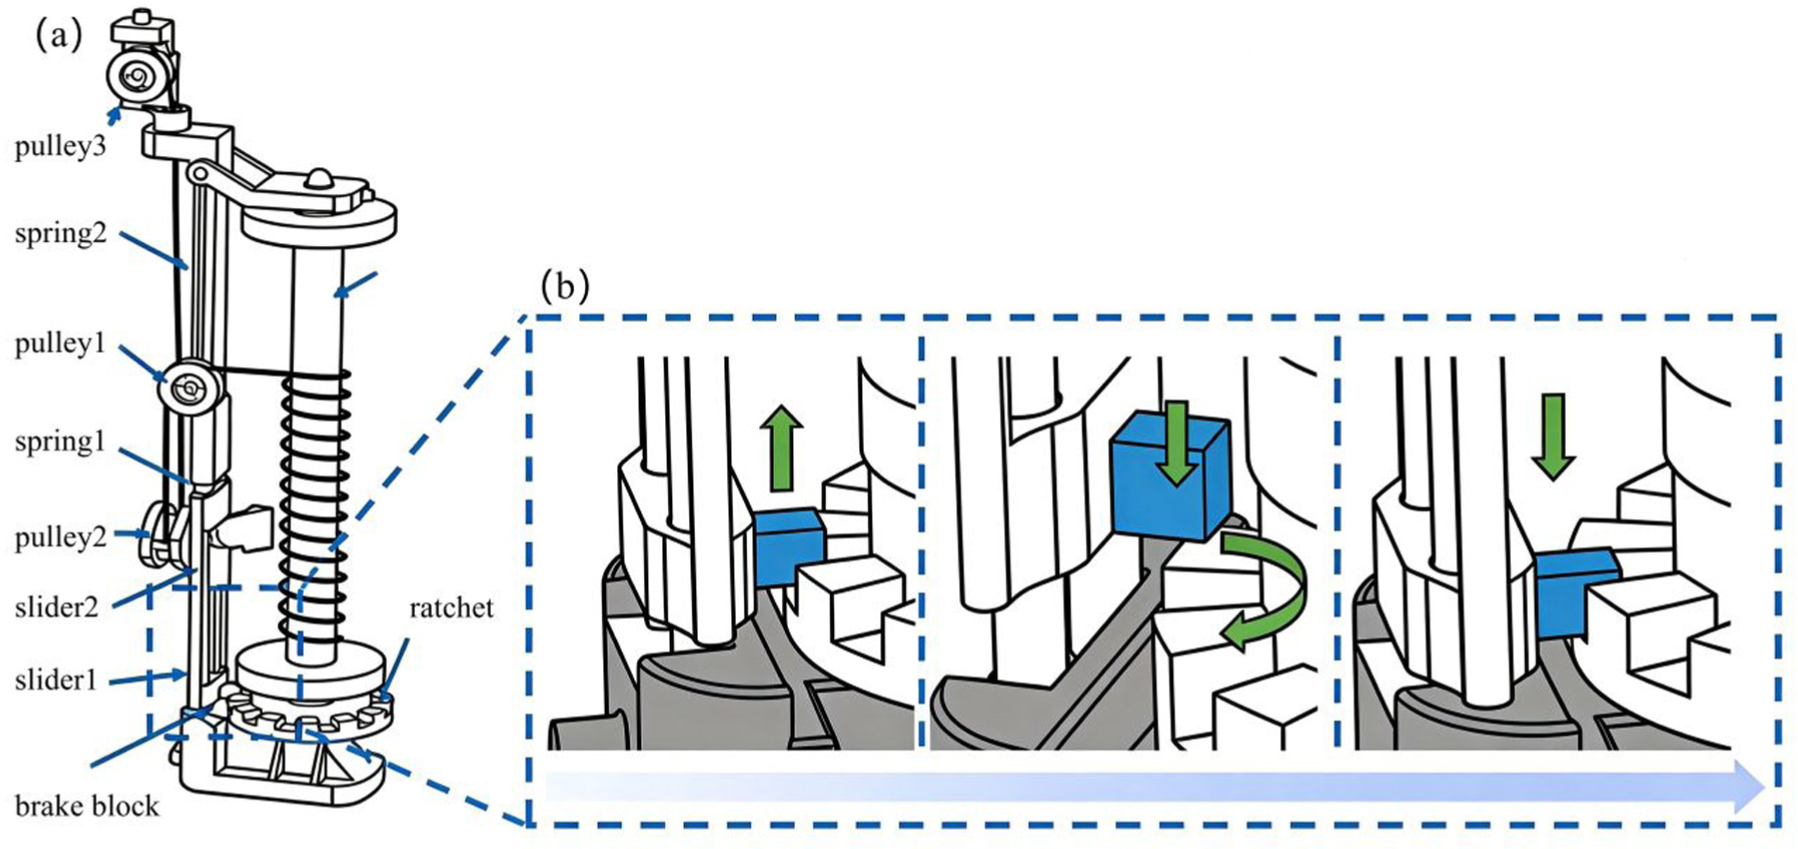
Structural configuration and working principle of the slider-type yarn carrier: (a) structural layout; (b) working process.
Its full work cycle can be decoupled into the following continuous physical processes. As shown in Figure 1(b), when the yarn carrier initially works, the yarn tension is zero. At this time, the bobbin and the ratchet are in an engaged state and are locked together by the brake block. As the braiding work begins, the yarn begins to be transported. Pulley 2 and slider 2 move upward, and spring 1 is gradually compressed. At this time, the brake block remains stationary. When the pulley 2 and the slider 2 continue to rise and contact the slider 1, the spring 2 begins to be compressed, and the brake block fixed at the slider 1 rises at the same time. When the spring 2 is compressed to a certain extent, the bottom of the brake block is higher than the upper surface of the ratchet teeth, and the spool and the ratchet begin to operate under the action of yarn tension. As the ratchet rotates, the spool releases a certain length of carbon fiber yarn, and the speed of yarn release is much greater than the crimping speed. When the required length is reached, pulley 2, slider 1 and slider 2 move downward until the brake block re-engages with the ratchet in the lower notch. Once the two are engaged, the spool stops, stopping yarn release.
Lumped parameter dynamics model
The yarn carrier exhibits obvious nonlinear contact effects and variable topology characteristics under high-speed operating conditions. In order to characterize the dynamic behavior of tension response under different contact or constraint states, this section establishes a lumped parameter model including segmented stiffness, mixed state switching, and energy dissipation mechanisms. This model divides the tension evolution within a working cycle into three consecutive stages: quasi-static energy storage, transient release, and impact load according to the physical mechanism, and provides a calculation model of the full-cycle tension response based on this, which can be used for performance evaluation in subsequent uncertainty analysis and structural parameter optimization. Figure 2(a) shows the tension system model.
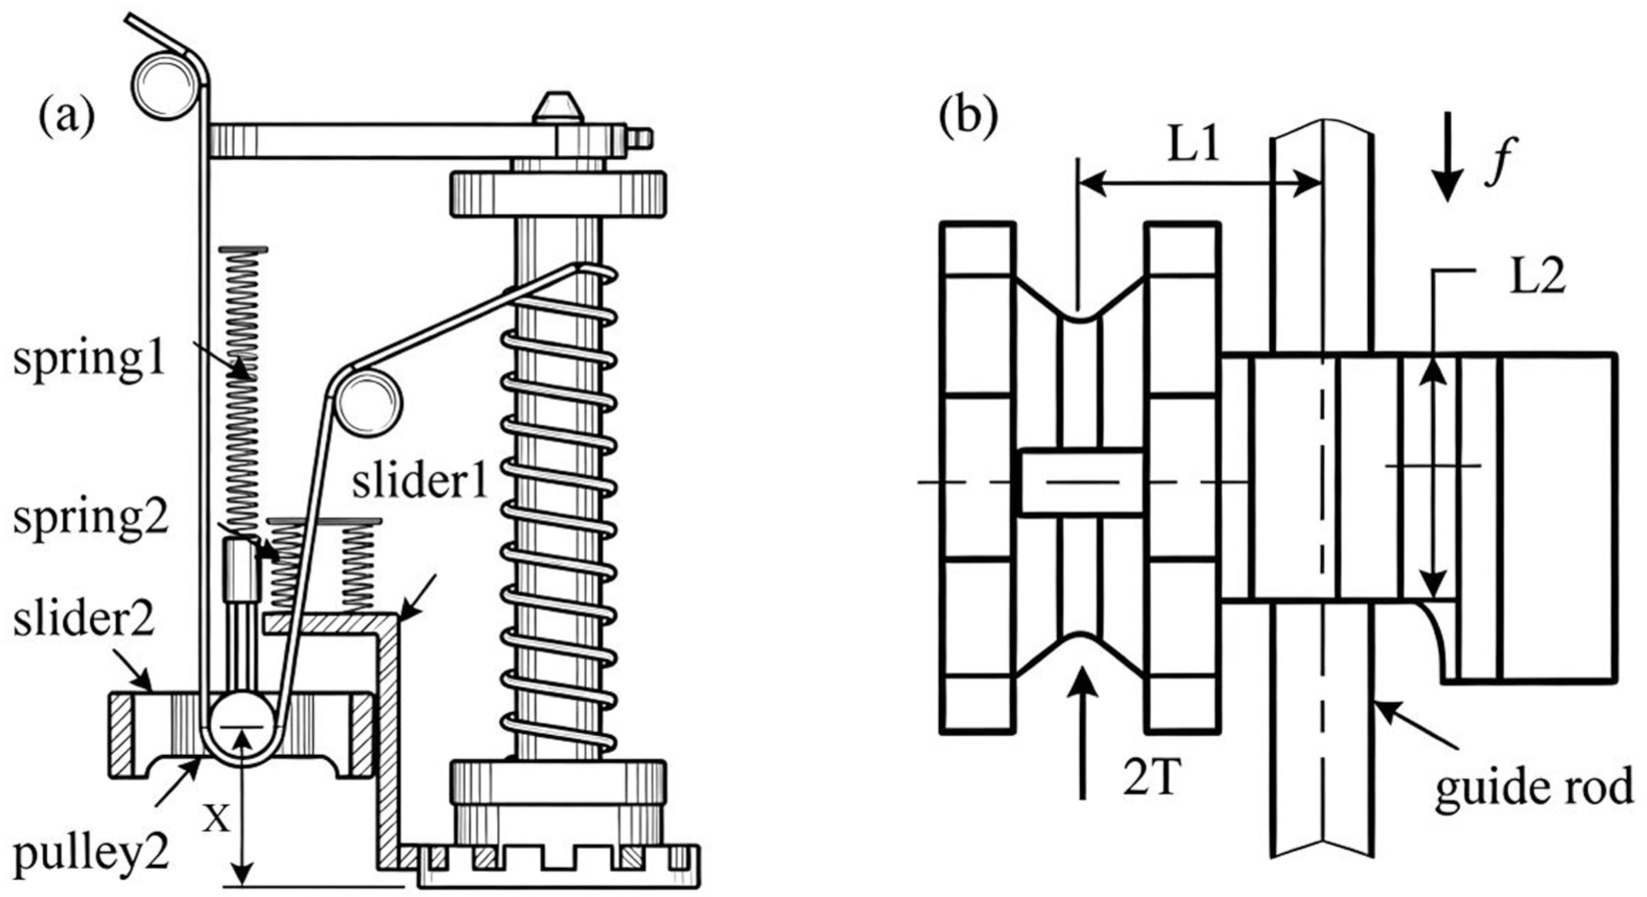
(a) Tension system lumped parameter model. (b) Friction mechanism analysis.
Physical modeling and fundamental assumptions
In order to capture the main dynamic behavior of the yarn carrier under high-speed operation with limited computational cost of the simulation, this paper adopts an appropriately simplified model. In this framework, the modeling assumptions are summarized as follows.
The slider assembly, ratchet, and guide rail are treated as rigid bodies, while the springs and yarn are regarded as the primary deformable components. The system response is therefore governed mainly by the deformation of the yarn and springs, whereas the main structural components (e.g., slider, pulley, and ratchet) serve as force transmission paths. Due to their much higher stiffness, their elastic deformation under typical operating loads is negligible and has little influence on the overall tension response.
The yarn is modeled as a linear elastic element within the operating range considered. Under typical conditions, the deformation is small and the tension–strain relationship can be approximated as linear. Although nonlinear effects such as interfilament friction and fiber rearrangement may exist, their influence is secondary, and a linear approximation is therefore adopted.
Energy dissipation is mainly attributed to dry friction between the slider and the guide rail, while other damping mechanisms are not explicitly modeled. For numerical stability, the Coulomb friction term is treated equivalently based on the principle of virtual work and incorporated into the tension transfer formulation, enabling a consistent description of the full-cycle tension response.
Quasi-static energy storage stage
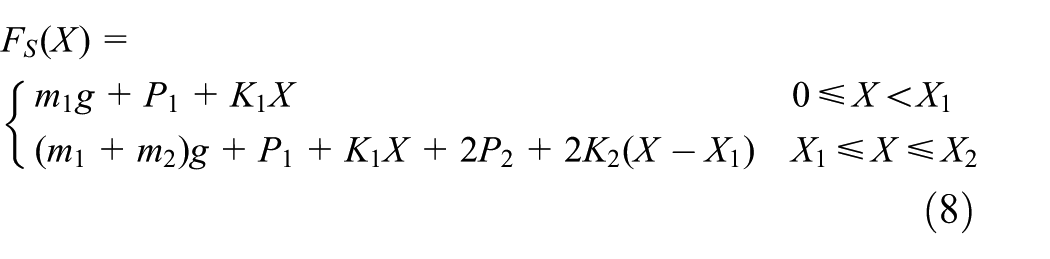
Since the mechanical configuration of the system evolves during operation, a segmented stiffness modeling approach is adopted. During the ratchet locking phase, the system remains in a quasi-static equilibrium state, while its effective stiffness exhibits piecewise linear characteristics depending on the contact condition of the slider assembly and the displacement X. In the initial stage (0 < X < X1), only slider 2 is active, and the system response is governed by the primary spring. When the displacement of pulley 2 exceeds the threshold X1, slider 1 becomes engaged and the secondary spring begins to participate in load bearing. This engagement leads to a discontinuous change in the effective stiffness due to the altered constraint conditions and load transfer paths. Consequently, the stiffness cannot be accurately represented by a single continuous function. Instead, a piecewise linear formulation is employed to capture the stiffness switching behavior associated with contact activation, ensuring both physical interpretability and computational efficiency in describing the system dynamics.
The first-level stiffness dominates the regime (0 < X < X1). At this time, the slider 2 moves independently and only compresses the first-level spring. The yarn tension T1 needs to overcome the gravity of the slider 2, the pulley 2, the spring 1, the primary spring elastic force and the friction resistance of the guide rail. Taking into account the directionality of friction and its impact on the efficiency of the pulley block, the tension model
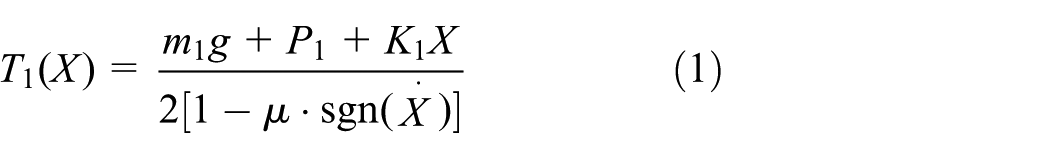
where m1 is the total mass of slider 2, pulley 2, and spring 1, P1 and K1 are the preload force and stiffness coefficient of the primary spring, respectively, X is the height of pulley 2 from the initial position, and μ is the equivalent friction coefficient. The function
In the secondary stiffness coupling zone (X1≤X≤X2), when the displacement exceeds the contact threshold X1, the slider 2 and the slider 1 are mechanically coupled, and the secondary spring intervenes. The equivalent stiffness of the system jumps and the tension increases
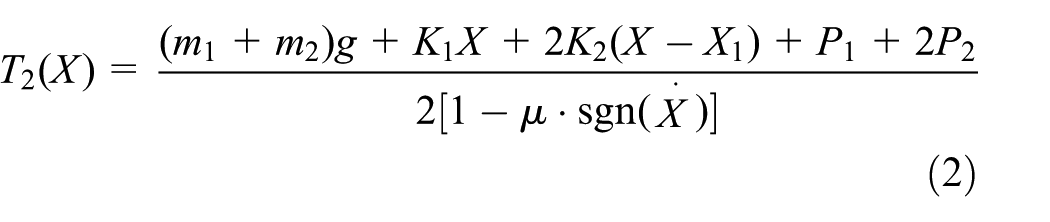
where m2 is the mass of the slider 1 and a pair of springs 2, and P2 and K2 are the preload force and stiffness coefficient of the secondary spring, respectively.
Transient release and separation kinetics
When the displacement reaches the threshold X2, the ratchet teeth break away from the brake block and trigger the yarn release. The system at this stage exhibits typical hybrid dynamics.
The bobbin accelerates and rotates driven by the yarn tension torque, and its angular acceleration

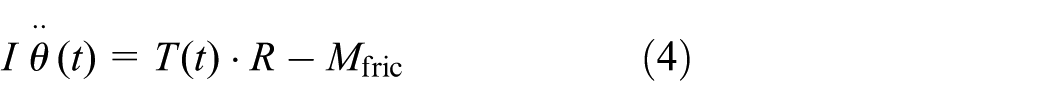
where
According to geometric constraints, the relative displacement acceleration of the movable pulley
Due to the extremely large angular acceleration at the moment when the spool is released, the falling acceleration of slider 2 exceeds slider 1 due to the geometric constraints of the ratchet tooth back, and the two sliders undergo transient separation. At this time, the system topology instantly degenerates into a single spring mode, causing a discontinuous sudden drop in the driving force. This sudden switch in stiffness
Impact load model based on energy dissipation
As the ratchet re-engages, the separated slider 1 accelerates to fall under the action of gravity, and has an inelastic collision with the slider 2, inducing a transient impact load in the yarn tension response.
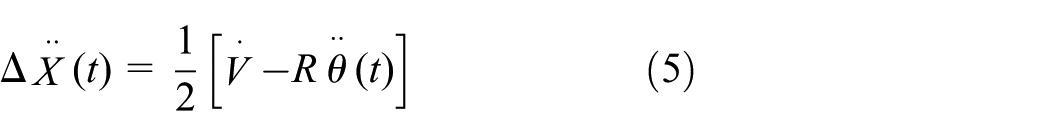
At the moment of collision, the velocities of the two sliders change abruptly according to the conservation of momentum. The equivalent impact kinetic energy is expressed as
In the equation,
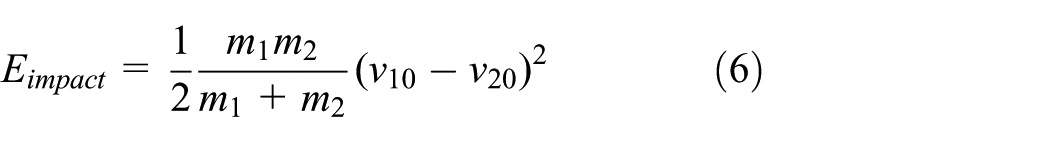
To establish a physically interpretable relationship between the impact process and the resulting tension increment, an equivalent lumped-parameter representation is introduced. In the following equation, the impact
where
Full-cycle nonlinear tension response
In order to construct a mathematical model suitable for numerical simulation, this paper uses the time domain splicing method to fuse the quasi-static driving component and the transient impact component. Considering the rapid attenuation characteristics of high-frequency impact loads under the action of internal viscoelastic damping of the yarn, the impact attenuation time constant τ is introduced to establish a unified expression for the full-cycle tension response
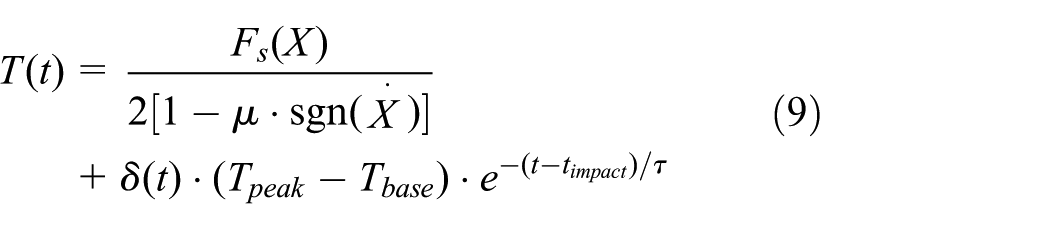
where
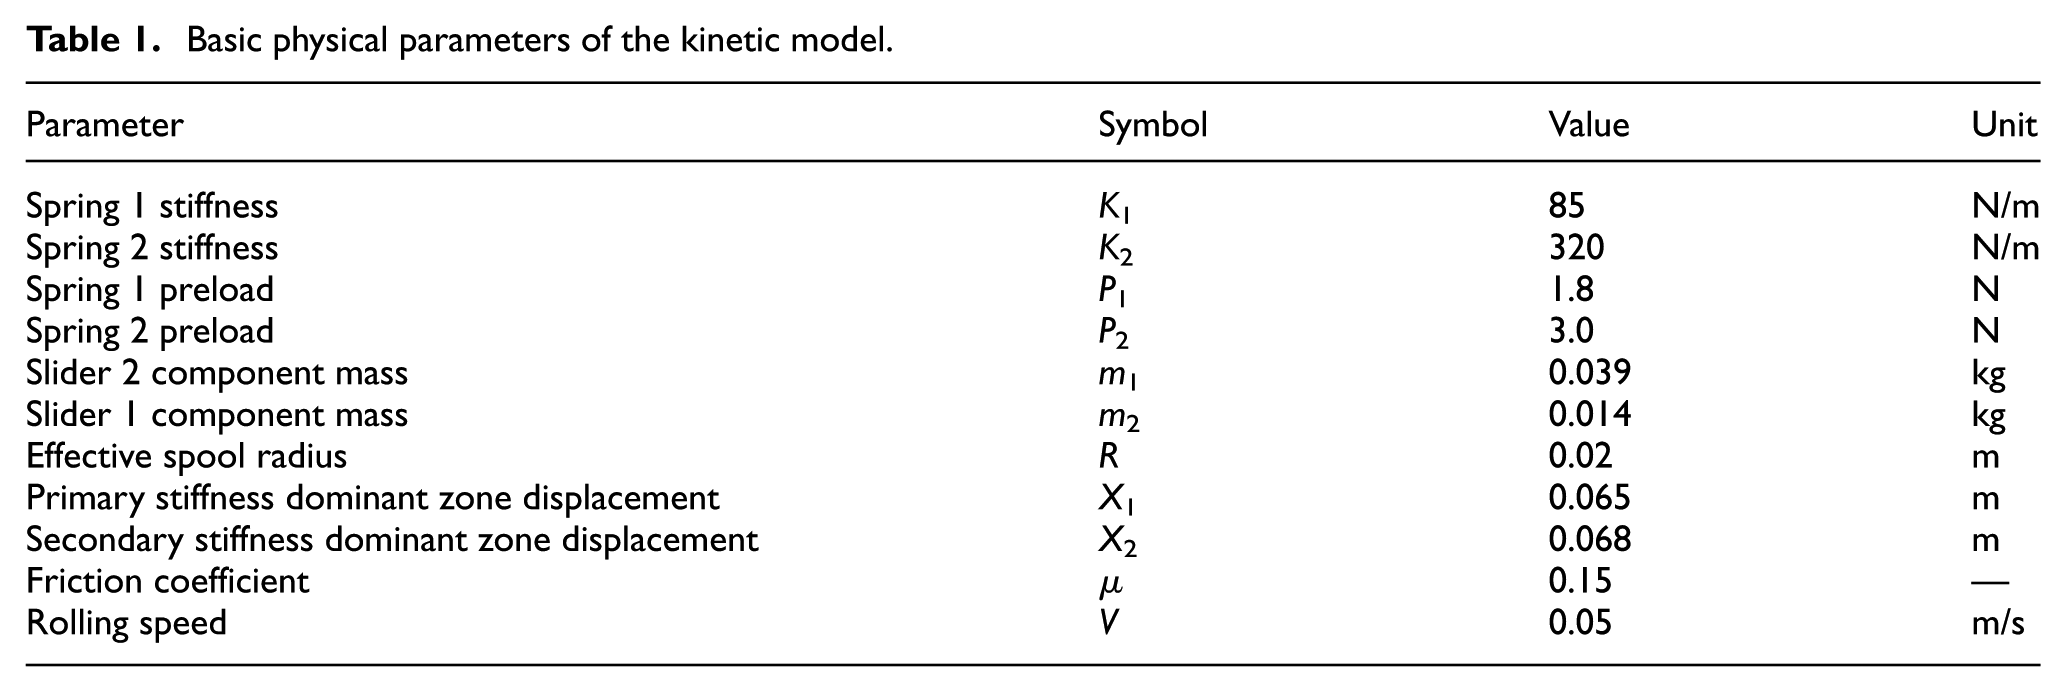
The basic physical parameters used in the dynamic model in this study are summarized in Table 1.
Basic physical parameters of the kinetic model.
Characterization of parameter uncertainty based on experimental statistical characteristics
In the robust design of yarn carriers, reasonable characterization of parameter discreteness introduced by manufacturing tolerances and service environments is a prerequisite for ensuring the credibility of dynamic analysis. Due to the difficulty of nondestructive measurement technology in directly measuring the internal friction coefficient and spring stiffness in the assembly state, this paper proposes an inverse uncertainty quantification strategy based on macroscopic mechanical response.
To this end, a static release force test platform as shown in Figure 3 was built. The tension testing platform consists of a slider yarn carrier (Xuzhou Henghui Weaving Machinery Co., Ltd.) and a handheld digital display dynamometer spring tension and thrust meter (range 50 N, resolution 0.01 N). Fifty independent repeatable measurements were performed on the physical prototype. This experiment uses the critical release force at the moment when the ratchet-brake block is unlocked as the observation variable. This indicator comprehensively maps the coupling effects of spring stiffness drift, friction pair state evolution and assembly error, and can effectively characterize the inherent uncertainty level of the system.
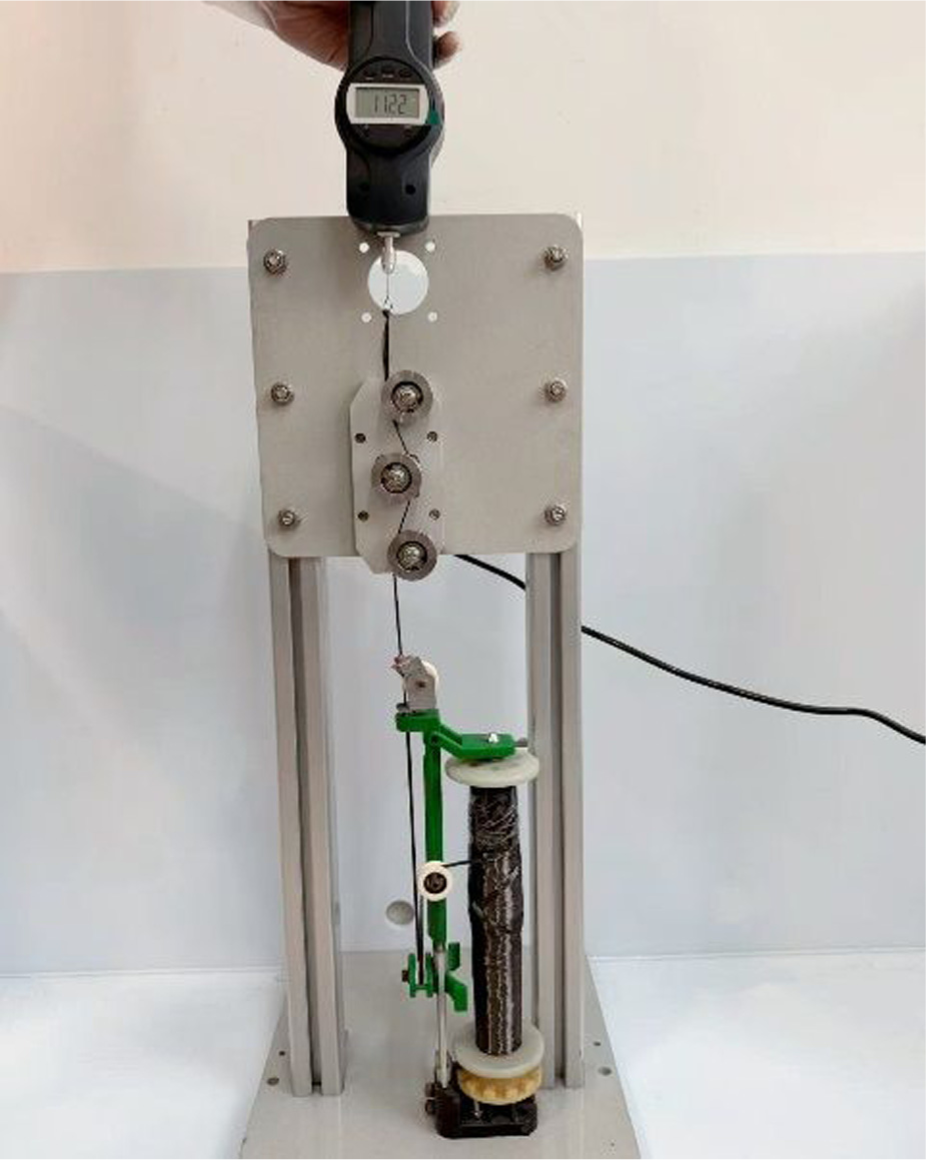
Experimental platform for static release force measurement.
The experimental statistical results are shown in Figure 4. The static release force sample shows good concentrated distribution characteristics, with a mean value of 10.50 N, a standard deviation of 0.31 N, and a corresponding coefficient of variation of 2.98%. The Shapiro–Wilk normality test was further used to statistically test the distribution characteristics of the experimental data. The obtained P value was 0.392, which was higher than the significance level threshold of 0.05, indicating that the null hypothesis that the sample data obeys the normal distribution was followed in a statistical sense. Therefore, there is a reasonable statistical basis for using Gaussian distribution to describe the uncertainty of system response in subsequent stochastic modeling.
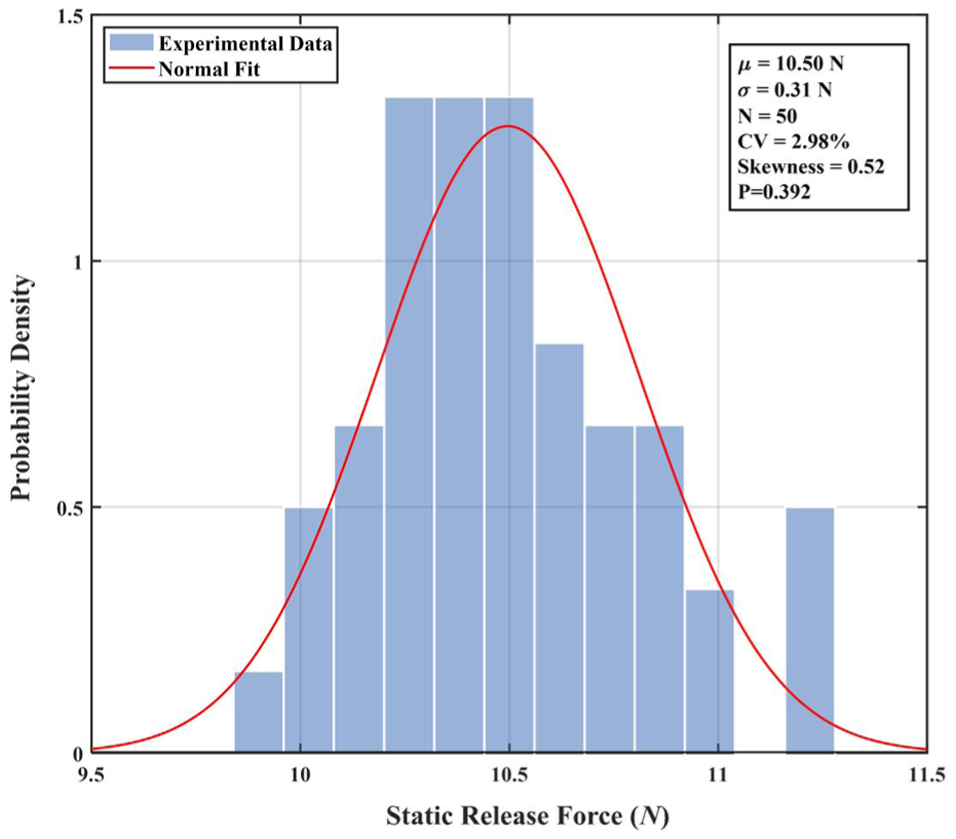
Measured release force histogram and normal distribution fitting.
Under the experimental benchmark and model boundary, the randomness of the system can be mainly attributed to two types of key parameters: one is the initial discreteness of the spring stiffness introduced by manufacturing and assembly errors, and the other is the fluctuation of the friction coefficient caused by changes in wear and lubrication conditions during the service process; the two correspond to the main sources of random disturbances in the manufacturing stage and service stage, respectively. Since it is difficult to stably distinguish the contributions of stiffness dispersion and friction fluctuation based only on the statistical distribution of release force (there is a certain degree of parameter indiscernibility), this paper introduces manufacturing tolerances and engineering experience to impose a priori constraints on the parameter dispersion level to reduce the feasible parameter space. With reference to the typical manufacturing consistency level of industrial compression springs and combined with assembly statistical experience, the variation coefficient of spring stiffness is taken as CV = 3% as a conservative prior; under this setting, the statistical characteristics of the release force output by the dynamic model are consistent with experimental observations through calibration, and the corresponding friction coefficient variation level is taken to be approximately 5%, which is used for subsequent uncertainty analysis and optimization calculations.
Parameter identification and model calibration
In order to evaluate the ability of the lumped parameter model to characterize the stick–slip dynamic behavior of the yarn carrier, and to calibrate the parameters related to impact peak and energy dissipation, this study selected published experimental results for the same type of yarn carrier as a reference benchmark. In the study by Du et al., 25 a representative full-cycle yarn tension waveform under the same operating condition was reported, together with statistical peak-tension values; therefore, the reported waveform is adopted as a qualitative reference for model calibration and comparison. Because the original high-resolution time-series data are not publicly available, direct point-wise waveform comparison is not feasible. Accordingly, a feature-oriented validation strategy was adopted, focusing on the reported peak tension and the post-impact attenuation characteristics. These quantities represent the dominant physical features governing the impact response and tension stability of the yarn carrier system, and therefore provide a physically meaningful basis for model validation. Under the standard braiding speed of 50 mm/s, the average peak value of tension reported in the literature is 19.84 N. It should be pointed out that due to the influence of the sampling frequency and signal conditioning process of the test force measurement system, the published waveform shows a certain degree of smoothing characteristics in the impact section. Considering that the ratchet-brake pad contact process may contain high-frequency transient components, this paper takes the peak level and post-impact response attenuation characteristics as the main alignment targets during the calibration process, and uses an energy equivalent method to characterize the effect of the impact load on the tension extreme value and subsequent nonlinear attenuation, thereby forming a dynamic evaluation model for subsequent uncertainty analysis and parameter optimization.
Since some microscopic contact parameters are difficult to measure directly, this paper adopts a parameter calibration strategy based on feature quantity anchoring. Under this strategy, a nonlinear least squares problem is constructed with the peak tension as the target, and the average peak tension value of 19.84 N reported in the literature experiment under the 50 mm/s working condition is used as a reference to calibrate the lumped impact-response coefficient
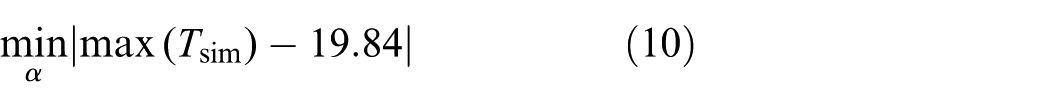
where
It should be noted that the least squares here does not fit the full time domain waveform point by point, but matches the safety-related feature quantities (peak tension) in the feature space to reduce the impact of sampling and high-frequency transient differences on the calibration process. From the solution of this inverse problem, the lumped impact-response coefficient
Due to the highly transient and dissipative nature of the re-engagement process, only a limited portion of the impact excitation contributes to the macroscopic yarn-tension peak, while the remainder is dissipated through friction, inelastic contact, and local structural interactions. This behavior is typical of impact-contact systems, where the effective transfer to macroscopic response is inherently limited.
The relatively small calibrated value of
The comparison results are shown in Figure 5. Quantitatively, the simulated response reproduces the reported peak tension level under the calibration condition. Qualitatively, the simulated transient response exhibits a waveform profile comparable to the representative experimental curve reported in the literature, particularly in terms of the overall impact-response pattern. Under the present modeling assumptions and available benchmark information, the model is therefore considered capable of capturing the main peak-response characteristics of the yarn carrier and can serve as a dynamic evaluation model for subsequent uncertainty analysis and robust optimization.
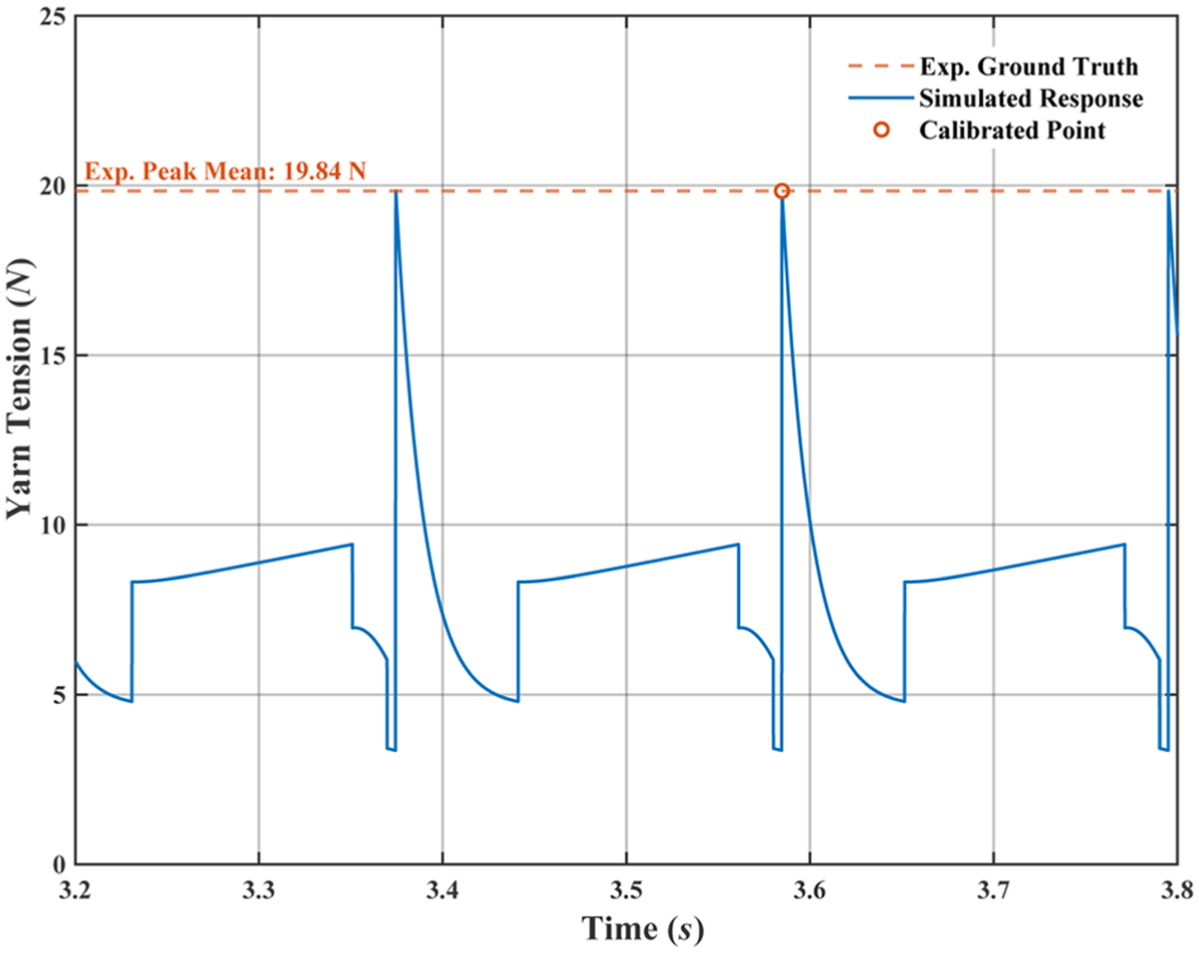
Peak-tension calibration and qualitative comparison of transient response with experimental benchmark.
Robust Bayesian optimization method oriented to parameter uncertainty
Robust optimization model
Design variables and uncertainty modeling
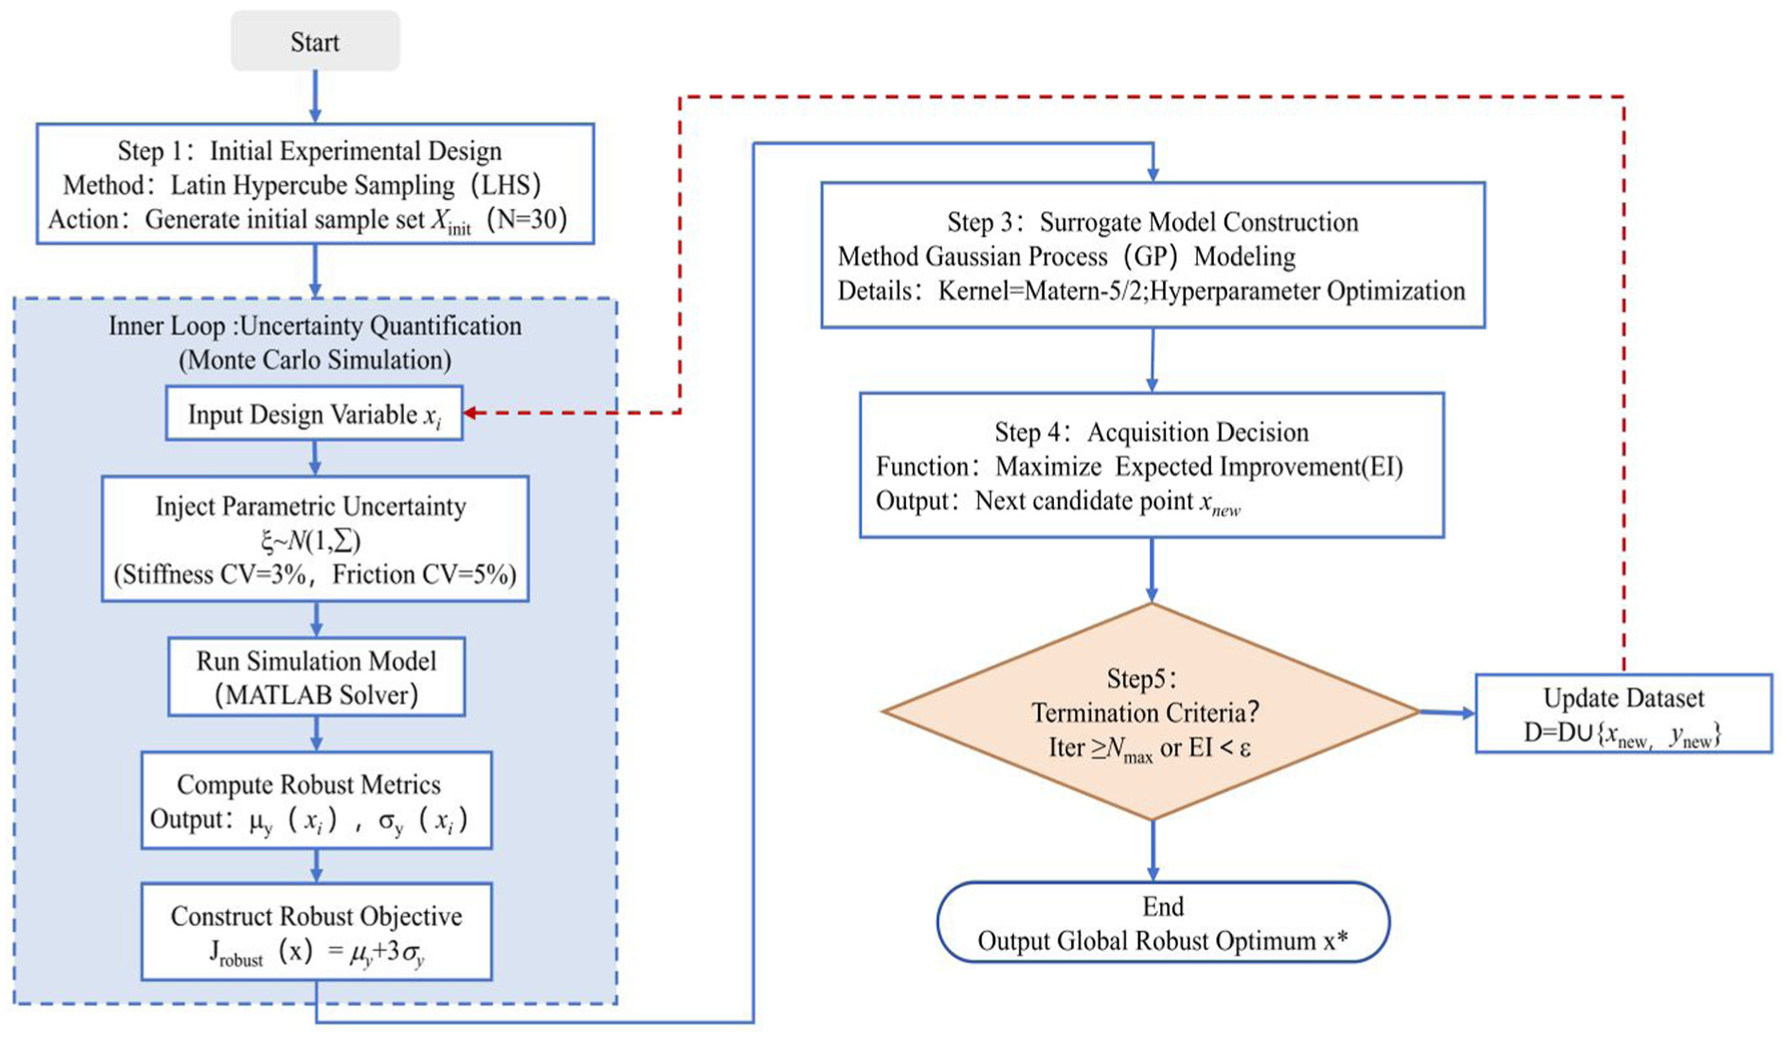
This paper selects four key physical parameters that affect the nonlinear stiffness topology of the system as design variables
The definition is as follows:


Here,
Construction of robust objective function based on 3σ criterion
Traditional deterministic optimization aims to find performance extremes under ideal working conditions, but it can easily fall into a high-performance–low-reliability solution under parameter perturbations. To this end, this paper introduces the 3σ robust design criterion to construct a composite objective function
The definition is as follows:
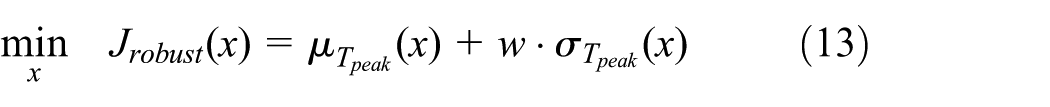


where
It should be noted that
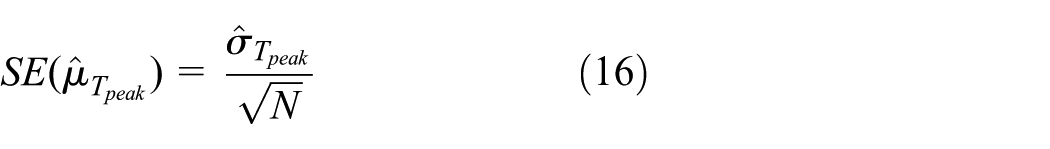
The sampling error of the estimated standard deviation can be approximated as
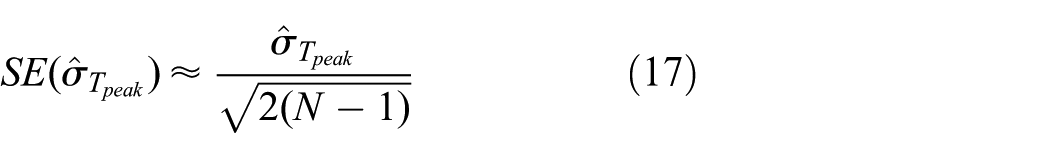
These expressions indicate that the Monte Carlo estimation error decreases with increasing sample size and is of order
Gaussian process surrogate model
Since the hybrid dynamic simulation requires small integration steps and repeated state-switching judgments, direct evaluation of the robust objective is computationally expensive. A Gaussian process (GP) surrogate is therefore employed to approximate the mapping from the design variables to the robust performance metric.
The robust objective evaluated at each design point is obtained from finite Monte Carlo sampling and therefore contains finite-sampling error. In this study, the Monte Carlo sample size is fixed for all design points to ensure a comparable level of estimation uncertainty. Under this setting, the evaluated responses are treated as numerical approximations of the underlying robust response function, and a standard GP model without an explicit observation-noise term is adopted.
This choice is made considering the limited simulation budget and the objective of maintaining stable hyperparameter estimation. Introducing an additional observation-noise hyperparameter would increase the complexity of the GP model and may lead to unstable noise identification when the number of expensive dynamic evaluations is limited. The possible influence of residual Monte Carlo sampling error is therefore assessed through the agreement between surrogate predictions and direct simulation-based evaluations during the optimization process.
Kernel function selection and hyperparameter adaptation
Assume that the observation data set is where
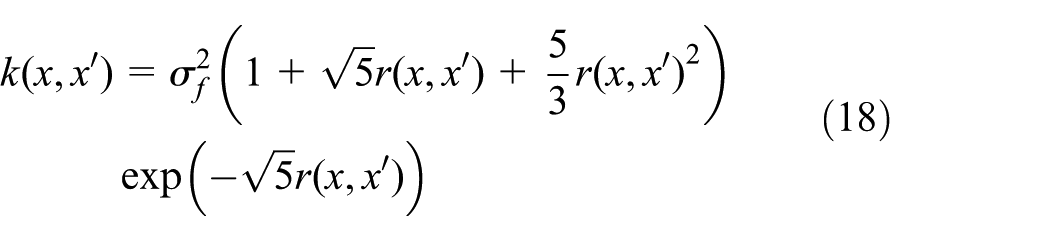
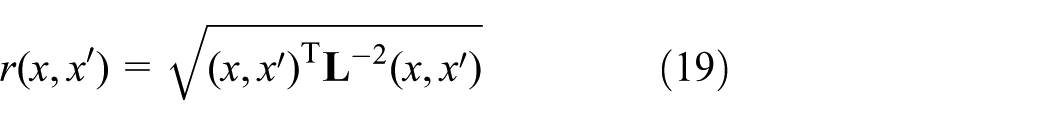
where
Bayesian sequential optimization strategy
In order to efficiently search for the global robust optimal solution within a limited computing budget, this paper constructs a Bayesian sequence optimization framework and uses the acquisition function to dynamically balance exploration and development.
Expectation improvement acquisition function based on exploration balance
This paper chooses the improved expectation improvement criterion to maximize the expected improvement of the current optimal solution. Its analytical form includes two parts, the expected improvement acquisition function
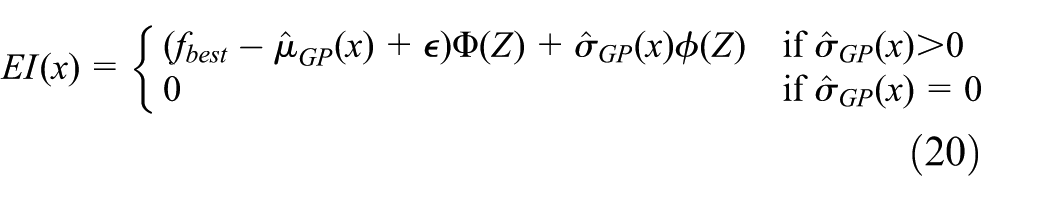
Here,
Algorithm flow and convergence criteria
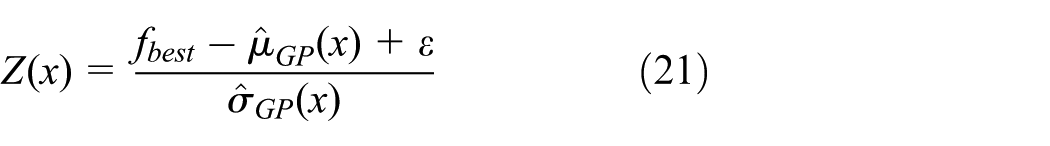
The overall workflow of the robust Bayesian optimization framework is illustrated in Figure 6. It integrates uncertainty propagation, surrogate modeling, and sequential decision-making steps. The key steps are as follows.
Robust Bayesian optimization algorithm flow chart.
Initial space filling: Latin hypercube sampling is used to generate 30 groups of initial sample points in the design space
Uncertainty propagation solution: For each sample point xi, inject 100 sets of random parameter noise consistent with the
Surrogate model training: train the GP model based on the data set
Sequence sampling decision: maximize the EI function to solve the next set of candidate points
Convergence determination and iteration: If the maximum number of iterations is reached or the EI value of the expected improvement criterion is lower than the convergence threshold, the optimization will be terminated; otherwise,
Results and discussion
Convergence analysis of optimization process
Based on the surrogate model sequential optimization method given in the previous section, this paper carries out robust parameter optimization for the key structural parameters spring stiffness
Design variables and optimization boundaries.
Figure 7 shows the change process of the robust objective function with the number of iterations. The results show that within the limited calculation budget of no more than 100 dynamics evaluations, the objective function value generally decreases and gradually becomes stable, reflecting a good convergence trend. The initial decline mainly occurs after the initial sample set is established, and then the objective function continues to decrease in a staged improvement manner, and the curve shows a steplike evolution characteristic. The convergence process shows that sequential sampling contributes to the exploration and local refinement of the design space at different iteration stages, allowing the optimization process to continuously produce performance improvements and obtain better robust solutions.
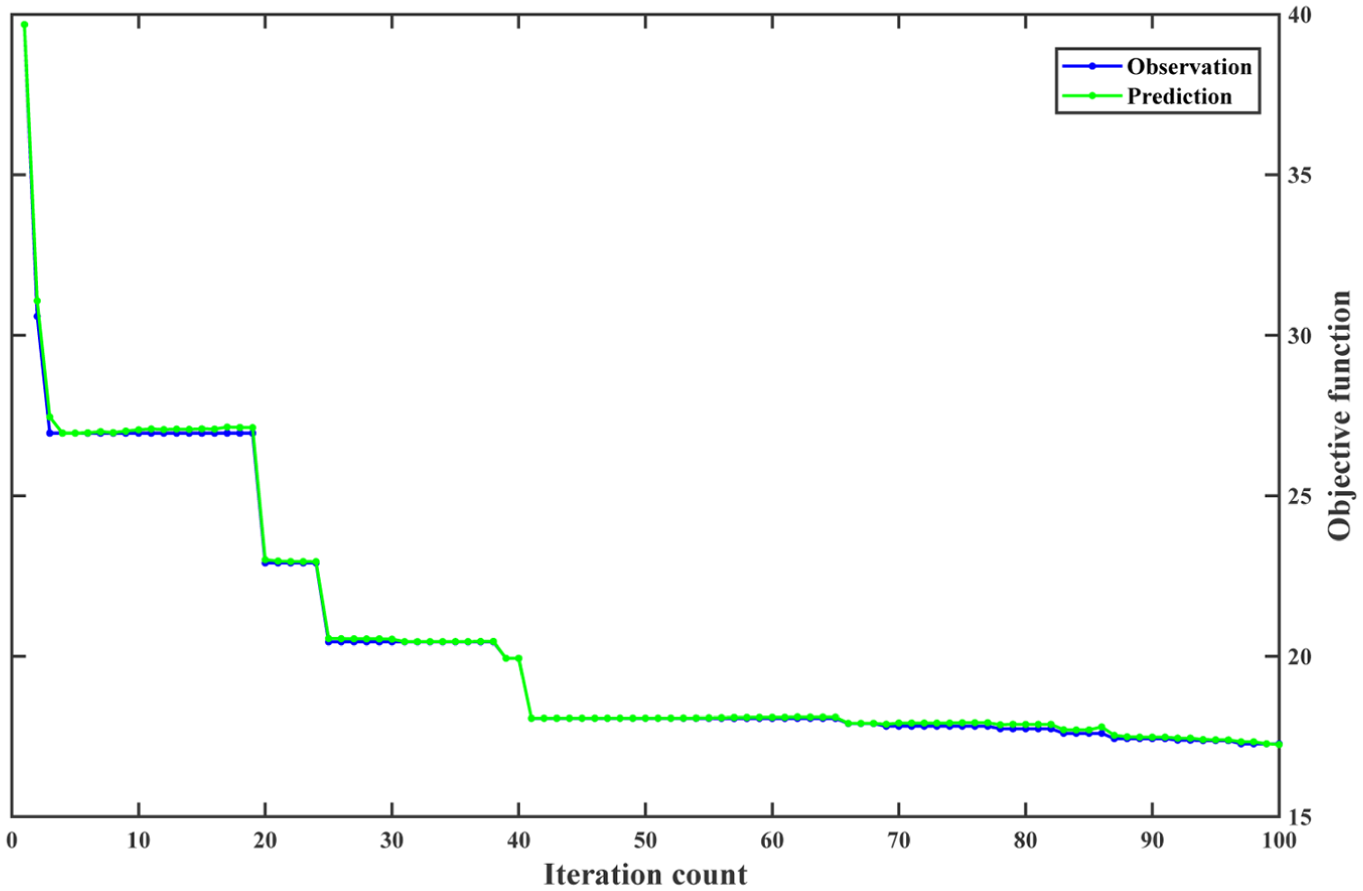
Iterative convergence process of the robust objective function and verification of the prediction accuracy of the surrogate model.
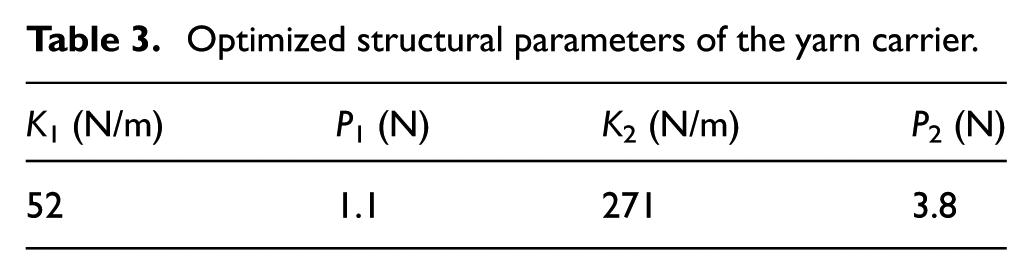
The surrogate-model predictions are in good agreement with the direct simulation-based evaluations, indicating that the Matérn-5/2 kernel is suitable for representing the nonsmooth response characteristics of the hybrid dynamic system. More importantly, the agreement between the predicted and evaluated objective values suggests that the GP surrogate captures the dominant variation trend of the robust objective, rather than merely following isolated fluctuations caused by finite Monte Carlo sampling. Therefore, within the adopted computational budget and sampling setting, the residual Monte Carlo estimation error does not appear to noticeably degrade the surrogate-model accuracy or the convergence behavior of the optimization process. The robust optimization procedure yields the optimal structural parameters summarized in Table 3.
Optimized structural parameters of the yarn carrier.
Analysis of topological characteristics of design space response surface
In order to further examine the impact of parameter uncertainty on system performance stability, in this section, under the condition that the preload parameters P1 and P2 are fixed to the robust optimal values, the segmented stiffness parameters K1 and K2 are sliced and scanned in their neighborhoods, and the three-dimensional response surface of the robust objective function is obtained in Figure 8.
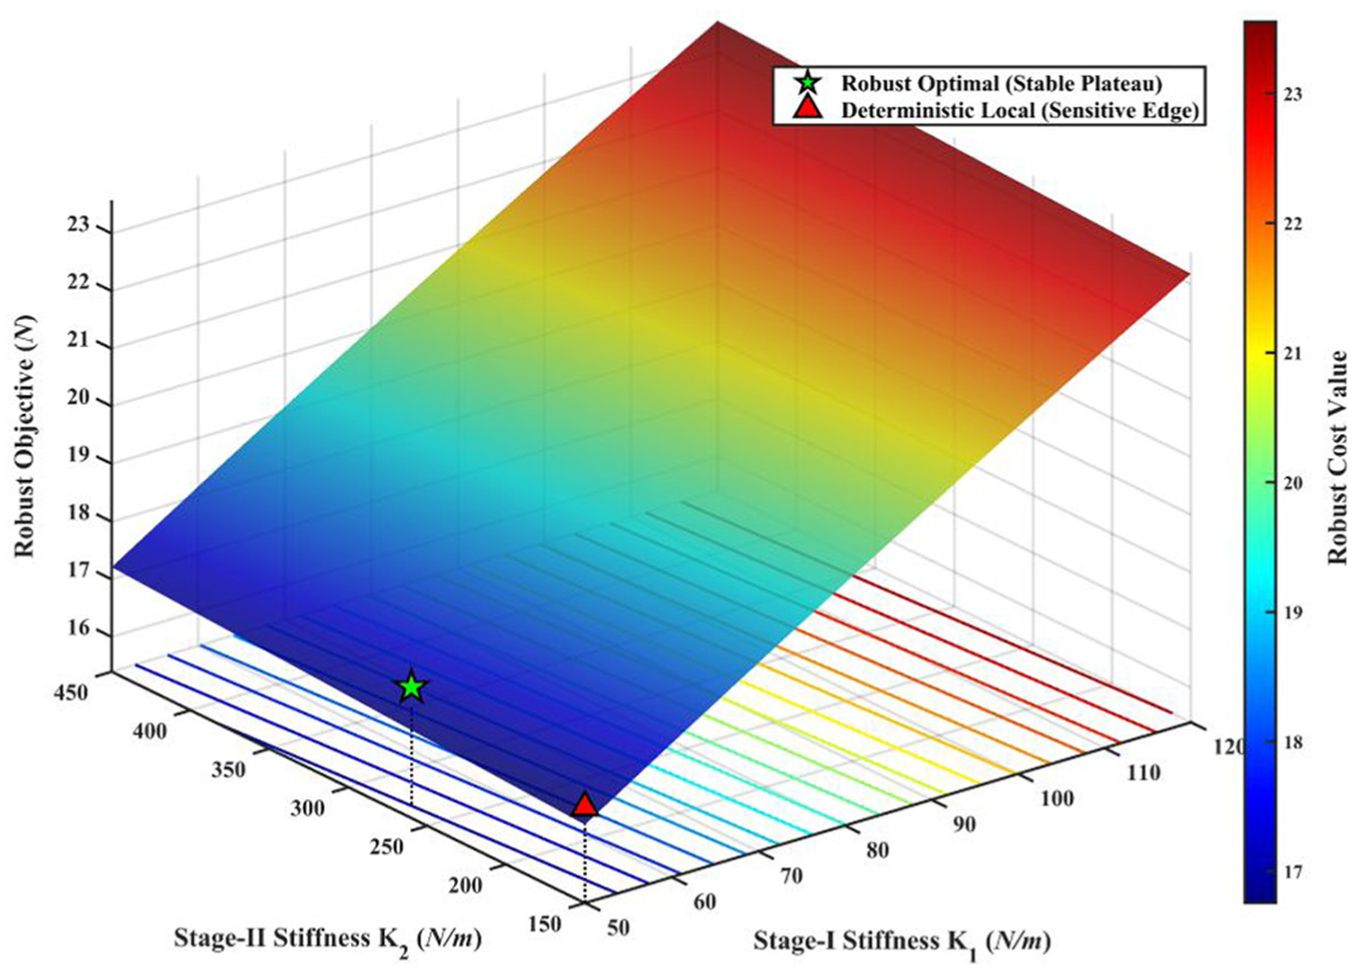
Three-dimensional response surface topology of robust objective function.
The red triangle in the figure is the optimal solution of the nominal working condition obtained within the current design window. It can be observed that the nominal optimal point is located at the lower boundary of the design space and is in an area with dense contours and a steep local gradient. This position corresponds to a lower objective function value under nominal parameters, but is more sensitive to disturbances in K1 and K2: when the spring stiffness deviates due to manufacturing tolerances or changes in working conditions, the objective function may fluctuate significantly and be closer to the high-cost area.
In contrast, the robust optimal solution shown by the green star in the figure migrates to a region of high stiffness and low sensitivity, and the objective function changes slowly in its neighborhood. This phenomenon shows that under the uncertainty description used in this study (the fluctuation range characterized by ±3σ), the objective function near the robust optimal solution is relatively less sensitive to parameter perturbations and can maintain a relatively stable performance level within a certain fluctuation range. Although the robust optimal solution is also close to the design lower bound on the K1 coordinate, the local topological characteristics of the area where it is located are different from the area near the boundary of the nominal optimal solution: the former corresponds to a flatter objective function terrain, and the latter is closer to the gradient mutation zone. This difference reflects that sequential optimization tends to choose solutions far away from steep boundaries when weighing nominal performance and disturbance sensitivity, thereby reserving a certain buffer space for parameter shifts caused by manufacturing tolerances and reducing the sensitivity risk of deterministic designs near the boundaries.
Comparative analysis of deterministic tension response and robustness with respect to model parameters
In order to evaluate the performance of the optimal solution under nominal working conditions, Figure 9(a) compares the time domain tension response of the baseline design and the robust optimization design during the complete braiding cycle. The relevant key performance indicators are summarized in Table 4.
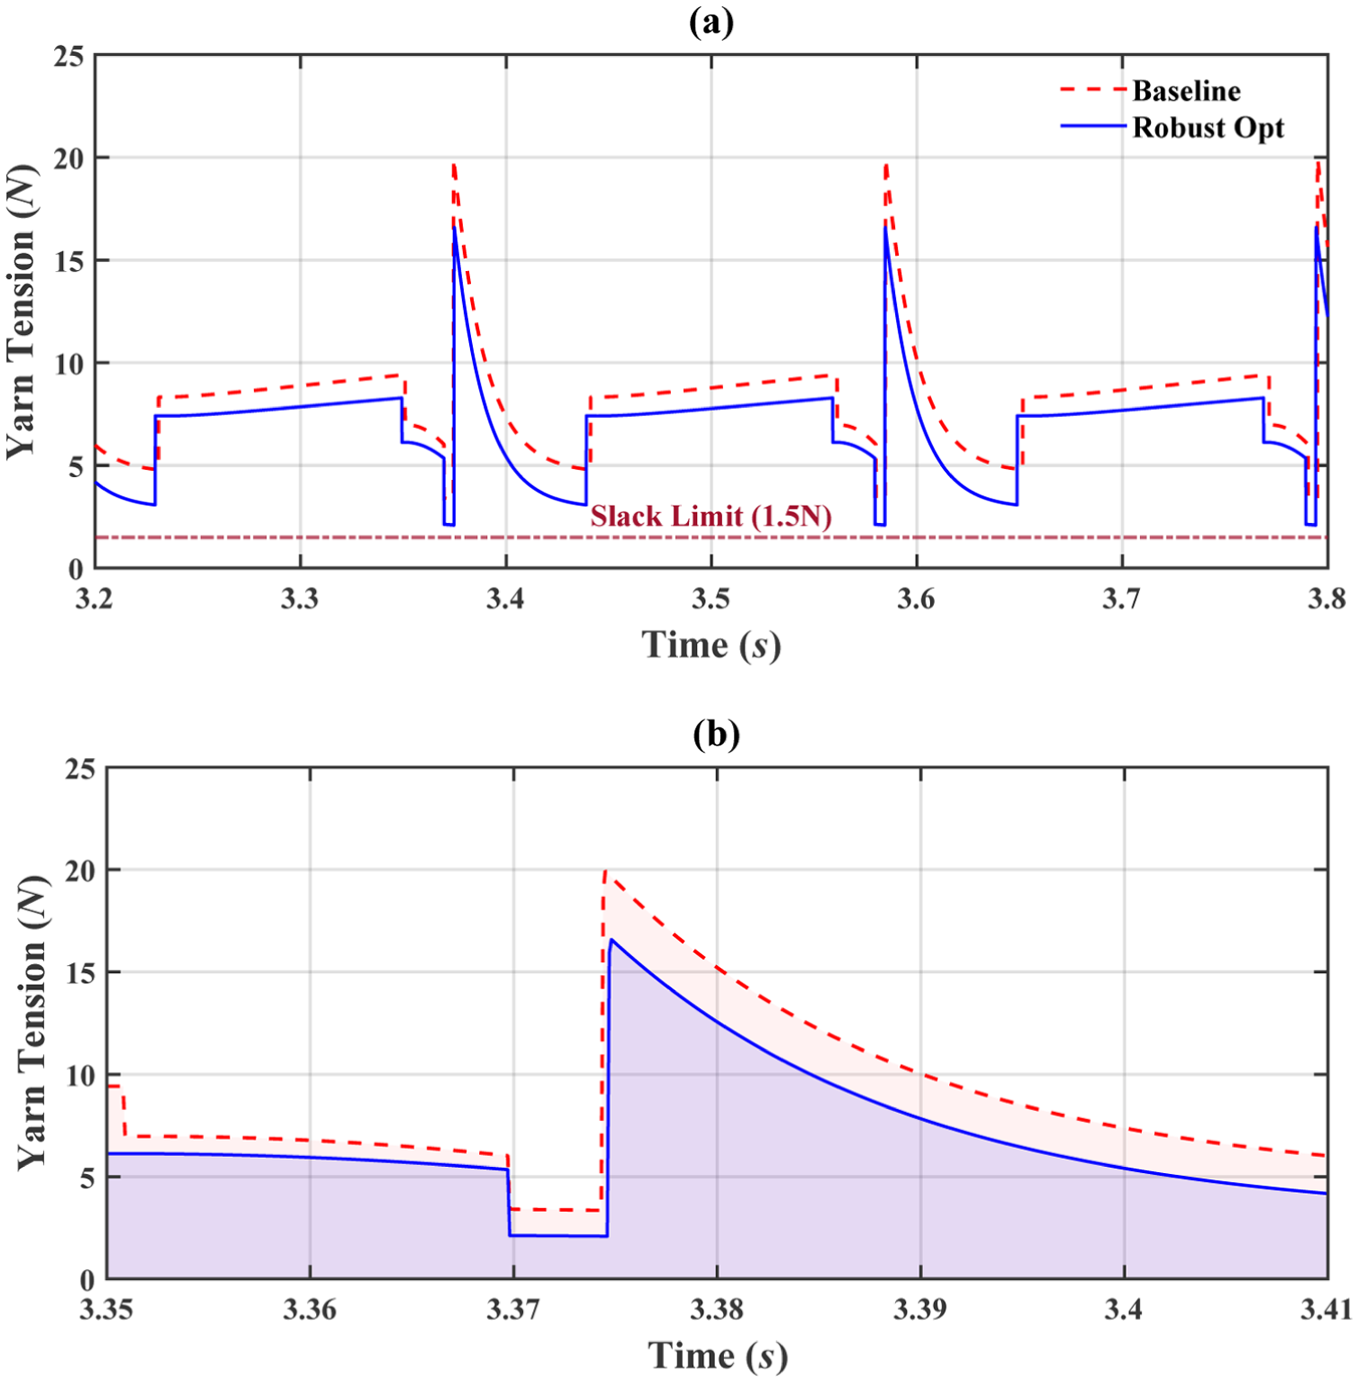
(a) Full-cycle yarn tension response. (b) Local transient impact response.
Deterministic working condition performance indicators.
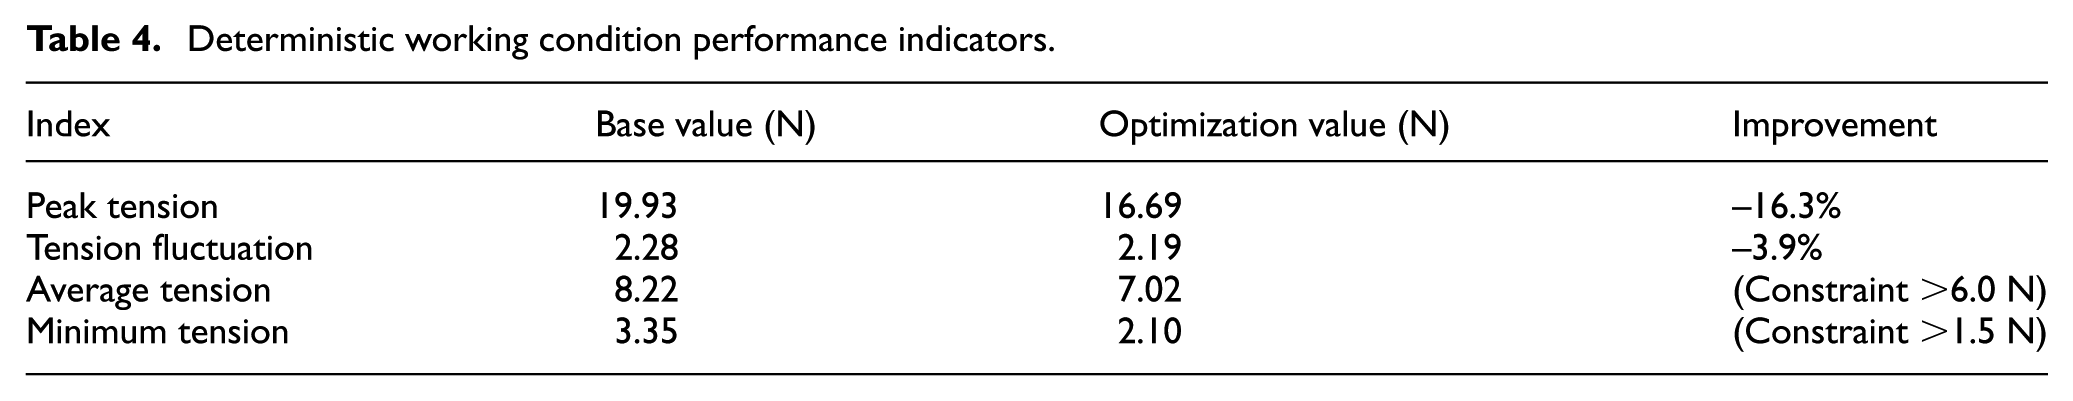
Macroscopic response analysis results show that the robust optimization design shows better load stability characteristics than the baseline solution under the premise of strictly satisfying the process mean constraint of greater than 6 N and the no-relaxation bottom line condition Tmin > 1.5 N. Compared with the baseline design, the optimization plan reduces the peak impact tension by 16.3%, thereby reducing the risk of carbon fiber monofilament breaking due to instantaneous overload. At the same time, the standard deviation of the tension decreased by 3.9%, indicating that the uniformity of the yarn's force during transmission has been improved to a certain extent.
To further discuss the possible sources of peak differences, Figure 9(b) locally enlarges the transient response during the single release phase. After the shock is triggered, the baseline scheme presents a higher transient peak value and is accompanied by a longer high tension duration; in contrast, the robust optimization scheme has a lower peak level and a more rapid decay process. This response characteristic is consistent with the segmented stiffness matching rule of the two-stage spring soft start energy absorption and hard support guarantee: the lower equivalent stiffness in the first stage is beneficial to the energy input after the slow release of impact excitation, while the second stage provides necessary support to take into account the process mean constraints and avoid relaxation. It can be seen that even under nominal parameter conditions, the robust optimization solution still shows a tendency to reduce the impact peak while satisfying process constraints.
To further assess the robustness of the above performance improvement with respect to model parameters, a sensitivity analysis of the lumped impact-response coefficient α is conducted. The coefficient
Sensitivity analysis of the impact-response coefficient
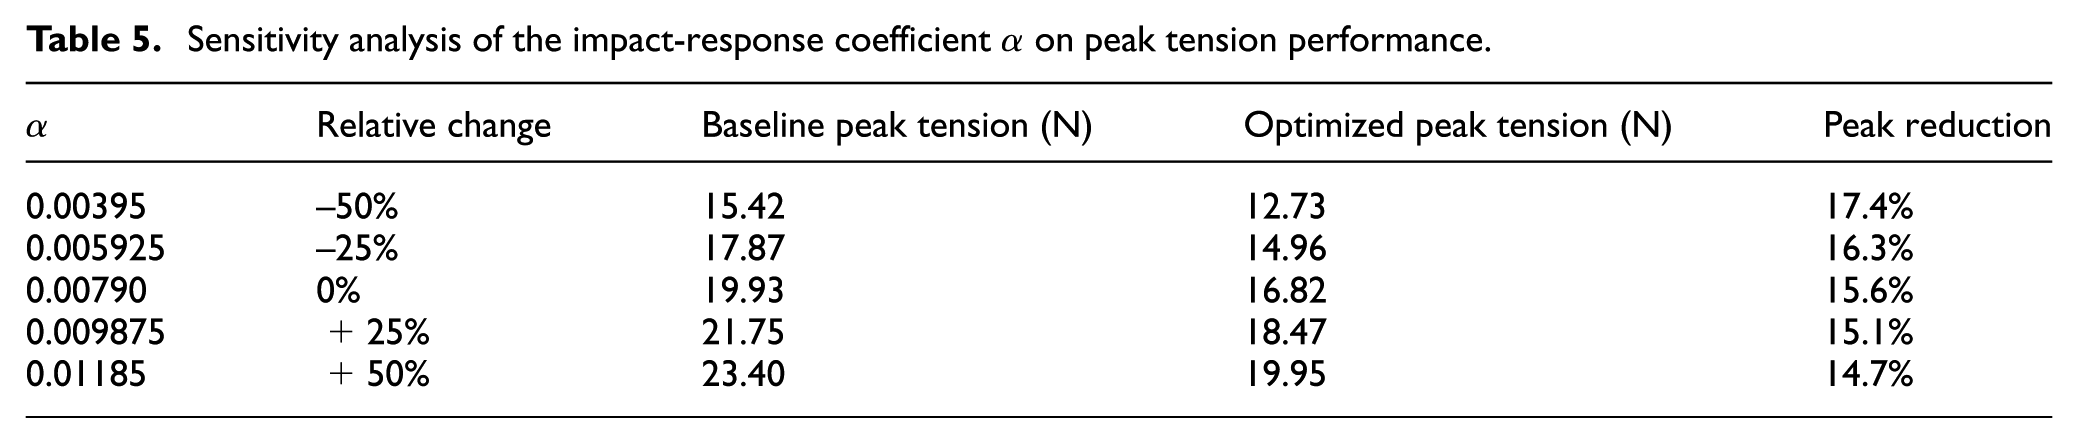
The results show that, as
These findings demonstrate that the relative performance advantage of the optimized design is not sensitive to the exact value of
Robustness verification under random operating conditions
In order to verify the stability of the design scheme under discrete parameter conditions, 1000 Monte Carlo random simulation experiments were carried out based on the previously determined parameter uncertainty distribution: spring stiffness variation coefficient 3%, friction coefficient variation coefficient 5%.
The random response envelope is shown in Figure 10. Compared with the wide discrete band shown by the baseline design, the response envelope of the robust optimization design shows more convergent characteristics. Statistics confirm that the width of the 95% confidence interval during the full cycle has shrunk from 0.85 to 0.61 N, a decrease of 28.2%. Under the random settings in this paper, this change corresponds to a smaller time domain fluctuation scale, indicating that the sensitivity of the optimized design to parameter perturbations is relatively reduced.
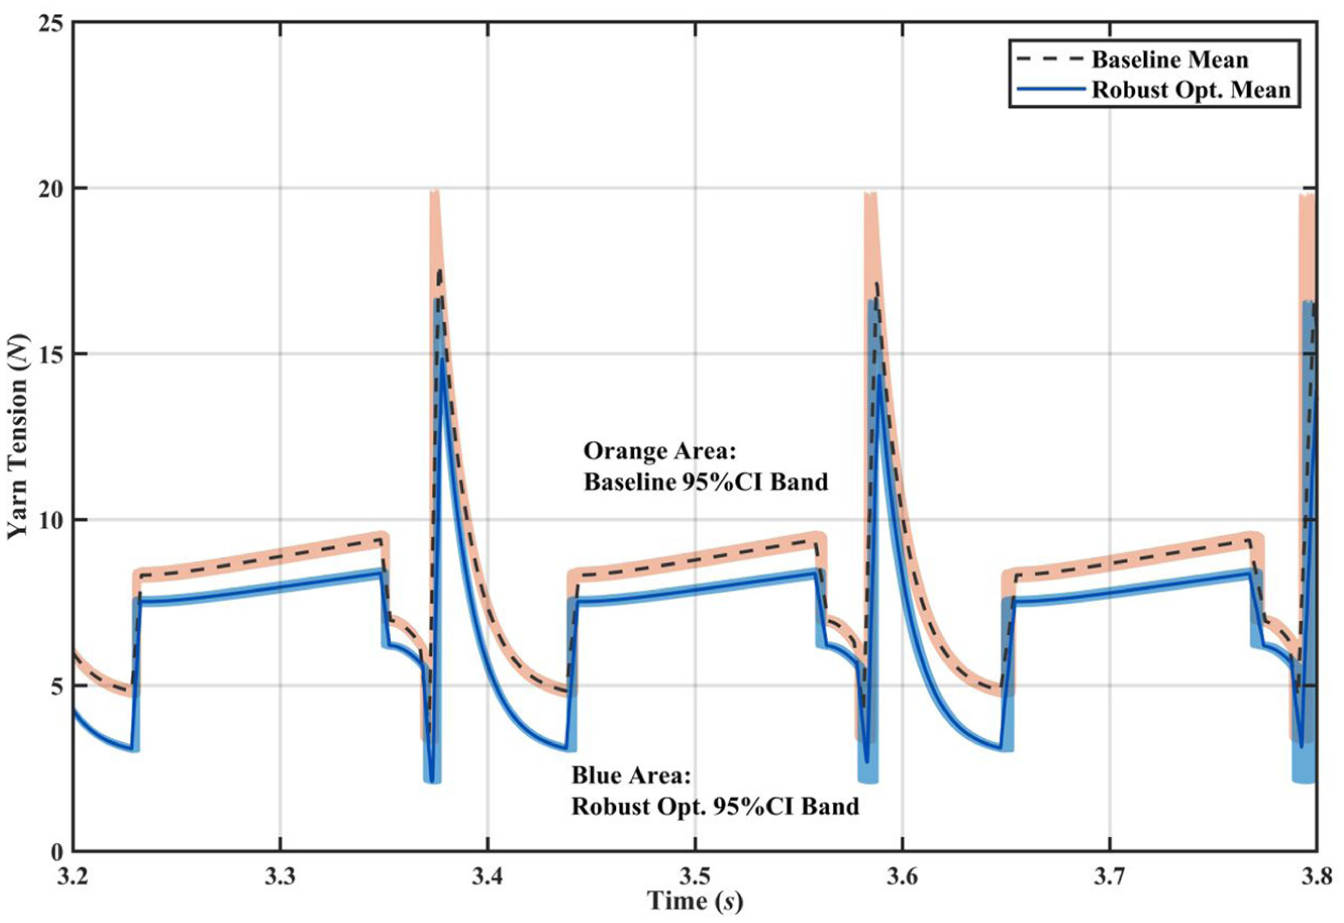
Random response statistical envelope diagram.
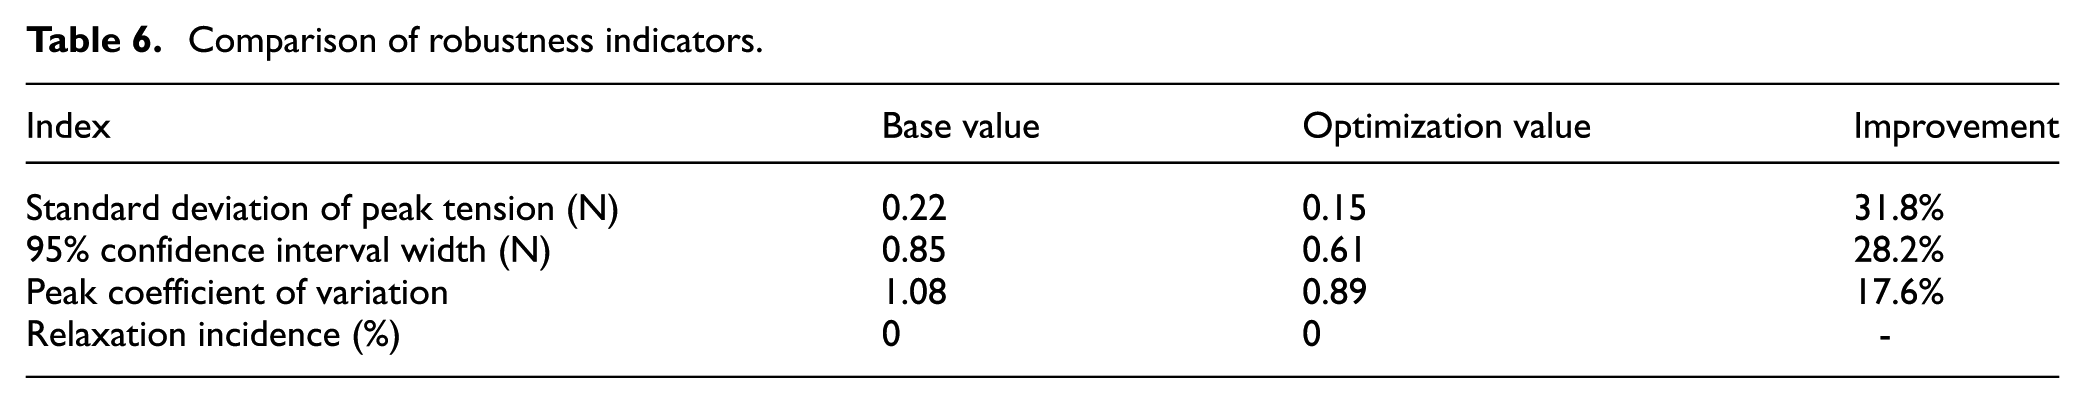
Further, the probability distribution results are shown in Figure 11. In Figure 11(a), due to the effective compensation of the low stiffness characteristics by the higher preload force P2 = 3.8 N of spring 2, the system successfully avoided the risk of triggering relaxation failure due to the decrease in the mean value, and achieved a 0% tension relaxation failure rate in all 1000 random tests. At the same time, Figure 11(b) reflects that the standard deviation of the peak tension decreased from 0.22 to 0.15 N, a decrease of 31.8%, which reflects the characteristics of the optimized solution located in the robust platform area of the design space, making the performance degradation trend relatively gentle when the design parameters fluctuate slightly. A detailed quantitative comparison of the robustness metrics between the baseline design and the optimized design can be found in Table 6.
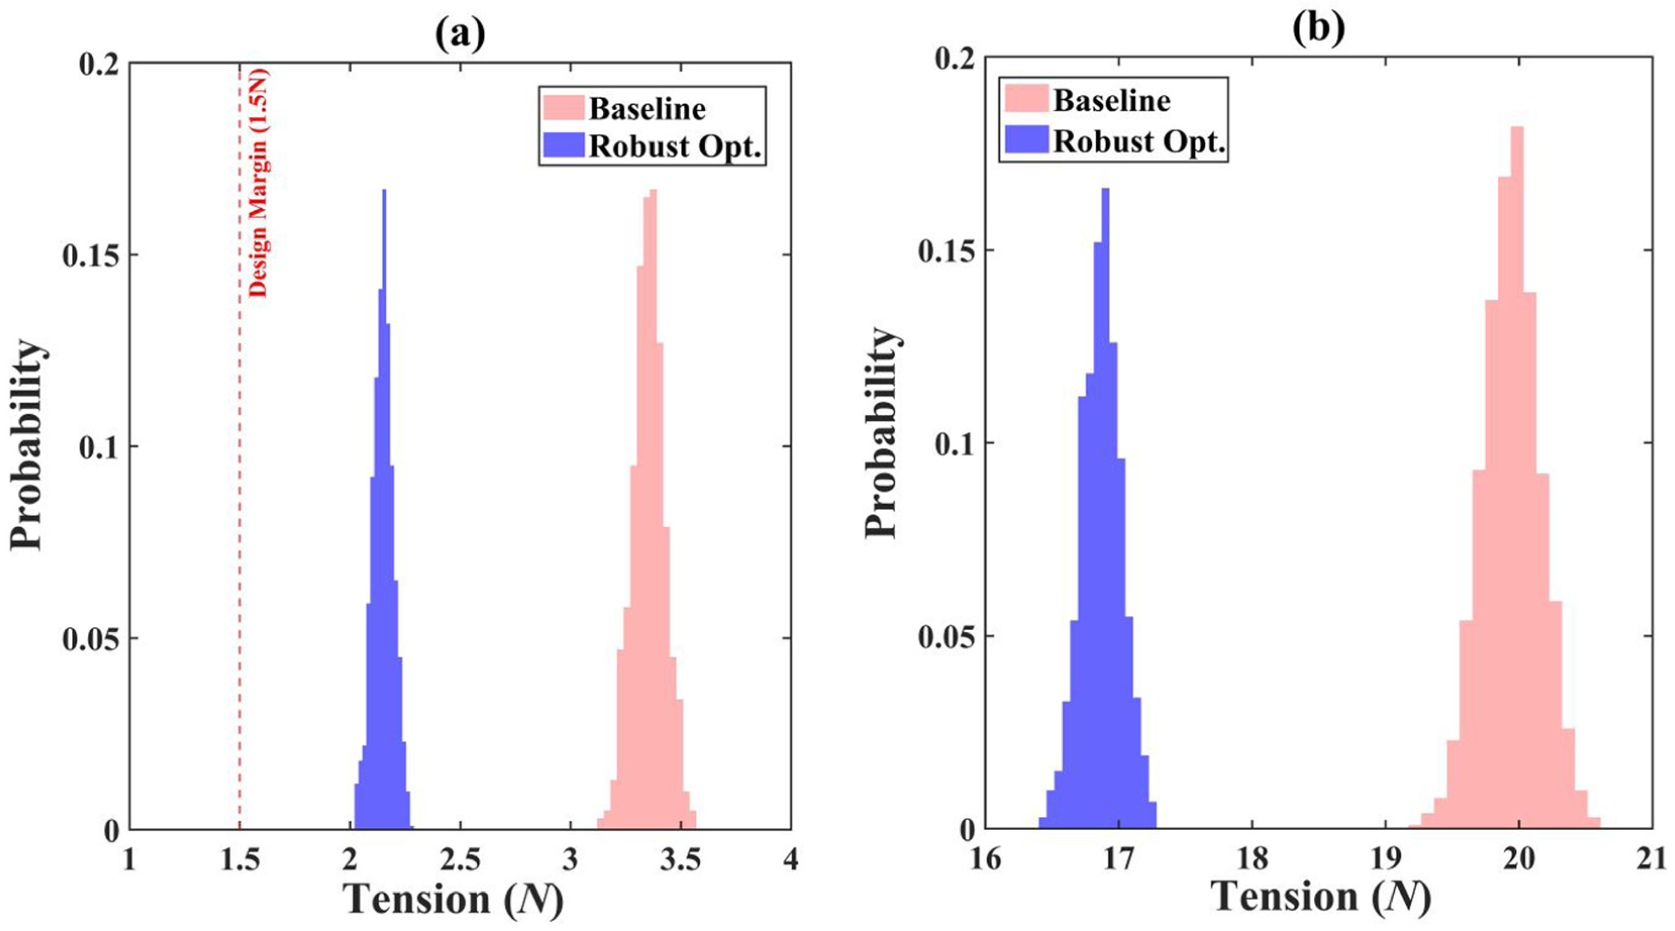
Performance indicator probability distribution histogram: (a) minimum tension; (b) peak tension.
Comparison of robustness indicators.
Parameter coupling mechanism and nonlinear stiffness matching analysis
In order to provide a unified explanation for the aforementioned design space topography, time domain response differences and stochastic robustness results, this section carries out parameter collaborative feature analysis on the near-optimal solution set obtained during the optimization process. Figure 12 shows the distribution of near-optimal samples collected in the sequential optimization iteration in the four-dimensional design space, and the samples are divided into two categories: Tier 1 (better) and Tier 2 (suboptimal) according to the value of the robust objective function.
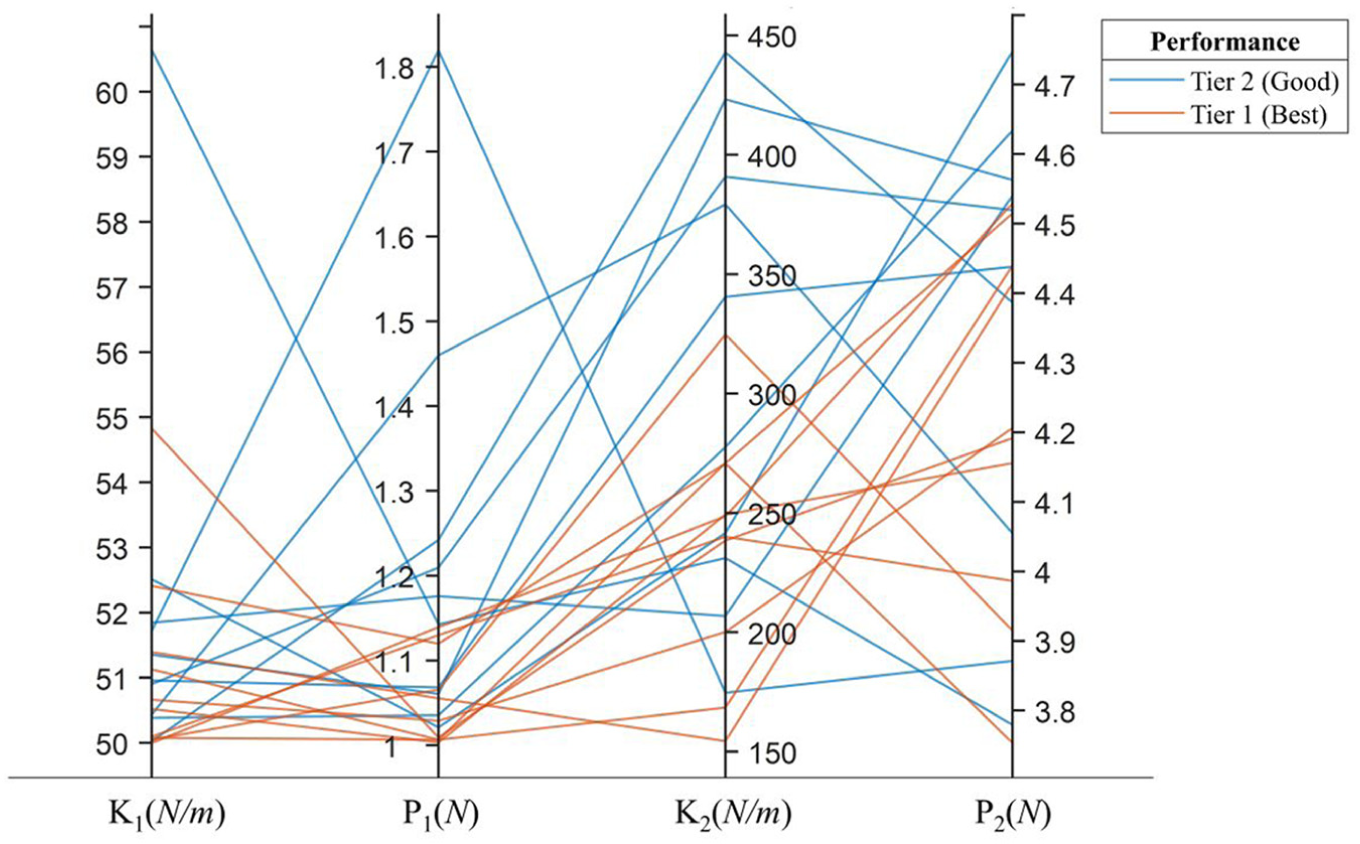
Parallel coordinate diagram of the optimized solution set.
It can be observed from the distribution of Tier 1 samples that the first-level parameters show an obvious aggregation trend in the K1 and P1 directions: K1 is mostly located near the design lower bound, and P1 also tends to be at a lower level. This distribution feature suggests that the first-stage parameters have a strong correlation with the sensitivity of impact-related indicators; under the setting of this model, lower initial stiffness and preload force correspond to a gentler starting process, making the energy release process at the moment of contact more spread out in time, which is consistent with the response characteristics of reduced impact peaks.
Different from the first-level stage, the Tier 1 sample does not show a single point convergence in the second-level stiffness K2 direction, but presents a relatively dispersed distribution in the range of about 150–350 N/m. This phenomenon can be understood as follows: when K2 meets the conditions for providing necessary hard support, the specific value of K2 has a relatively limited effect on the robust objective function within a certain range, which corresponds to the result of a flatter area along the K2 direction in the aforementioned topological analysis. At the same time, the secondary preload force P2 in Tier 1 shows a trend of concentrating towards the mid-to-high range of 3.8–4.5 N, indicating that P2 is more directly related to the maintenance of process constraints and the satisfaction of anti-relaxation constraints; under the constraint setting of this study, a higher P2 helps to compensate for the displacement effect caused by the primary soft start and reduces the possibility of the tension dropping to near the relaxation threshold (1.5 N).
To sum up, the identified two-stage stiffness coordination mechanism provides a physically interpretable and practically applicable guideline for yarn carrier design under parameter uncertainty. Specifically, a relatively low primary stiffness and preload (K1, P1) facilitate a compliant energy-absorption phase, effectively attenuating impact-induced load peaks by extending the deformation duration and reducing high-frequency tension fluctuations. In contrast, a sufficiently high secondary stiffness and preload (K2, P2) ensure stable load-bearing capacity after re-engagement, thereby preventing excessive tension drop and avoiding slack-related defects. This coordinated stiffness distribution achieves a balance between impact suppression and tension stability. In practical parameter tuning, the primary-stage parameters should be preferentially adjusted to control impact sensitivity, while the secondary-stage parameters should be calibrated to satisfy process constraints and reliability requirements, enabling an efficient decoupled design strategy. Furthermore, the reduction in peak tension and fluctuation amplitude directly lowers the risk of carbon fiber filament breakage and surface damage by suppressing transient overload and stabilizing force transmission. Importantly, these design insights are derived within a robustness-oriented framework that explicitly accounts for parameter uncertainty, thereby improving their applicability under manufacturing tolerances and operational variability.
Conclusion
This study has proposed a robust Bayesian optimization method to improve the stability and reliability of the yarn tension response during the three-dimensional carbon fiber braiding process. The main research conclusions are as follows.
Aiming at the strong nonlinear tension response problem caused by segmented stiffness switching, friction hysteresis, and impact contact coupling in the slider yarn carrier, a research method integrating lumped dynamics modeling, parameter uncertainty quantification, and robust Bayesian optimization was constructed to achieve collaborative optimization of the mean and discreteness of the tension response under a limited computing budget.
Based on the parameter uncertainty model, the robust optimization design reduced the peak tension by 16.3% under deterministic working conditions, reduced the standard deviation of the peak tension by 31.8%, reduced the width of the 95% confidence interval by 28.2%, and reduced the peak variation coefficient by 17.6% in 1000 Monte Carlo random verifications. It also avoided yarn relaxation failure in all samples, indicating that this method can effectively suppress the amplification effect of manufacturing tolerances and operating disturbances on the tension response.
Through the parameter correlation analysis of the robust optimal solution set, it is found that the primary spring stiffness and preload force dominate the impact sensitivity and determine the energy release capability, the secondary stiffness shows a higher design tolerance, and the secondary preload force plays a key role in maintaining process tension and inhibiting relaxation. The above results show the nonlinear stiffness matching rule of the first-level soft start energy absorption and the second-level hard support guarantee, and provide interpretable physical basis and engineering reference for the reliability-oriented design of the yarn carrier structural parameters.
Footnotes
Authorship contribution statement
Chunlei Wei: Conceptualization, Methodology, Investigation, Writing – original draft. Yuxin Wang: Formal analysis, Data curation, Visualization. Xulong Chen: Software, Validation. Liwen Zhang: Resources, Investigation. Yu Zhang: Writing – review & editing, Supervision. Zhonglong Wang: Conceptualization, Supervision, Project administration, Funding acquisition.
Declaration of conflicting interests
The authors declared no potential conflicts of interest with respect to the research, authorship, and/or publication of this article.
Funding
The authors disclosed receipt of the following financial support for the research, authorship, and/or publication of this article: This work was supported by Shandong Provincial Natural Science Foundation (grant number ZR2022ME185).