
Abstract
Fabric shape retention is a critical property that directly determines the functional performance and aesthetic quality of textile products; existing numerical simulation methods have limitations in simultaneously capturing the geometric deformation and internal stress distribution of fabrics during shape retention processes. This paper proposes a yarn-scale finite-element simulation model specifically designed for fabric shape retention detection, which covers three sequential stages of fabric shape change: the lifting and arching process, the compression process, and the release and recovery process. Three common fabric types were tested under different compression durations to verify the model’s applicability. To ensure the reliability of the proposed simulation model, an image-based verification method was developed. This method introduces crease image technology into yarn-scale simulation validation, representing an innovative application. Results confirm high simulation accuracy and mechanical reliability. Pearson correlation coefficients between simulated and experimental curvature values are 0.967 (cotton), 0.978 (polyester), and 0.969 (linen), with all fabrics showing satisfactory fitting precision (P < 0.01). Stress analysis reveals distinct gradient distributions in the crease regions. Cotton exhibits the highest residual stress, reaching 37 MPa under 90-second compression. Residual stress increases nonlinearly with arching duration. The yarn-scale simulation model integrated with the image-based validation method enables internal stress evaluation without physical crease tests. This provides key theoretical support for fabric structure optimization and high-performance textile development.
Keywords
With the rapid advancement of computer technology, finite-element analysis methods have been increasingly applied in the textile field.1,2 As a multiscale and multicomponent flexible composite material, the shape retention of fabrics directly determines the appearance, wearing comfort, and service durability of final products. It is one of the core evaluation indicators in textile product design and performance optimization. However, the shape retention of fabrics is affected by the coupling of multiple factors, such as yarn structure, fiber properties, and weaving technology. 3 Traditional experimental methods are time-consuming, labor-intensive, and costly. Moreover, it is difficult to accurately capture the microdeformation mechanism and stress transfer process at the yarn level. Thus, they cannot provide effective theoretical support for the precise control of fabric shape retention. Against this background, the finite-element simulation technology based on the yarn scale has emerged. By establishing the microgeometric and mechanical models of yarns, it simulates the mechanical response of yarns under loading and deformation. Furthermore, it reveals the internal relationship between yarn structure and fabric shape retention.
Yarn-scale characterization of fabric properties can be traced back to 1959. Munden demonstrated that under minimum energy conditions, the dimensional and weight properties of knitted fabrics are uniquely determined by yarn length. 4 For other fabric properties, Özdemir and coworkers investigated the effects of structural parameters on mechanical properties and special functionalities. These include tensile, 5 impact properties twill derivative woven fabric, 6 impact strengths of cellular woven fabrics, 7 and impact strengths of diced woven fabrics. 8 To achieve a unified characterization of multiscale fabric deformation, Lomov et al. measured the full field strain of fabrics. 9 In finite-element simulations, measurements of key parameters include not only mechanical experiments but also image-based measurements. Pierce et al. measured fabric shear deformation using image processing techniques for drape characterization. 10 Yarn geometries obtained by image processing approximate the real geometric appearance of fabrics. Related studies have confirmed that image-assisted techniques enable high-precision simulation of fabric appearance.11-14
In the research area of fabric shape retention properties, Xiao et al. 15 developed a novel mechanical testing system for fabric shape retention (MTS-FSR). Through force–displacement curve fitting, eight characteristic indicators related to fabric wrinkling were determined, and a fabric smoothness appearance prediction model was established based on decision tree algorithms. Experimental results demonstrated that this system provides a feasible and effective measurement method for objectively evaluating fabric smoothness appearance, exhibiting good accuracy and resolution.
Conventional testing methods for fabric shape retention, such as the cantilever beam method and fabric crease elasticity test, impose stringent technical requirements on operators and involve relatively complex operational procedures. To address these limitations, our laboratory has independently developed a novel fabric shape retention testing apparatus that achieves automated measurement of fabric shape retention through image detection technology. Compared with conventional testing methods, the apparatus offers advantages of simplified operation and high automation level. This testing apparatus operates by employing a mechanical clamping system to lift fabric specimens to a preset height via lifting and arching, then releasing the clamping force to allow the fabric to fall naturally under gravity during the release and recovery phase. 16 The apparatus captures real-time deformation profiles of the fabric throughout the falling process using high-precision image sensors and extracts key geometric parameters through image processing algorithms. The maximum curvature of the fabric after falling serves as the evaluation criterion for shape retention properties. Compared with conventional testing methods, this apparatus offers advantages of simplified operation, excellent reproducibility, and high automation levels.
However, during actual testing procedures, directly installing force sensors on the fabric surface or testing apparatus to obtain stress distribution information would inevitably alter the stress state of the fabric, thereby affecting the natural deformation behavior and preventing accurate shape retention test results from being obtained.17,18 This measurement interference problem renders traditional experimental approaches incapable of simultaneously acquiring both geometric deformation information and internal stress distribution states of fabrics.
Therefore, this study employs yarn-scale finite-element analysis to establish a numerical simulation model for the fabric shape retention detection process. A complete finite-element model is built to simulate the fabric’s lifting, arching, compression, release, and recovery inside the detector. This allows stress distribution over the entire detection process to be obtained without interfering with actual tests. Meanwhile, the validity and accuracy of the numerical simulation were verified by comparing the maximum curvature of the fabric after the release and recovery process obtained from simulation with experimental test results. This approach, combining numerical simulation with experimental validation, not only compensates for the deficiencies of traditional detection methods in stress measurement but also provides crucial theoretical support for the mechanism analysis of fabric shape retention and the optimization design of testing apparatus. 19
The main contributions of this article are as follows.
A yarn-scale finite-element simulation model for fabric shape retention detection.
Image-based verification method for the yarn-scale simulation model.
Application of crease image technology in simulation validation.
Image-aided solution for fabric shape retention measurement.
Fabric model establishment and shape retention process parameter calculation
Fabric structure analysis
As one of the most fundamental and widely used woven structures, plain weave fabric exhibits high representativeness in the study of textile geometry and mechanical behavior. 20 Featuring a regular interlacing pattern with equal intervals between warp and weft yarns, plain weave serves as a typical prototype for understanding the structural characteristics of general woven materials. Due to its simple yet stable geometric configuration, plain weave is often adopted as a preferred research object to establish basic modeling methods and verify theoretical models. Therefore, plain weave fabric is selected as the research object in this work, aiming to provide a reliable and universal modeling framework that can be further extended to other complex woven structures. In the three-dimensional modeling process of plain weave fabrics, it is essential to establish reasonable modeling principles and fundamental assumptions to simplify the complex fabric structure while ensuring the geometric accuracy and physical authenticity of the model. 21 In this study, plain weave fabric was treated as a three-dimensional structure formed by the interlacing of warp and weft yarns according to specific patterns. 22 The modeling process followed a micro-to-macro approach, first constructing the geometric morphology of individual yarns, then realizing the construction of the overall fabric structure through mirroring and array operations. 23
Yarns are produced from fibers via the spinning process, and their structural characteristics vary considerably with fiber type and forming methodology. Taking cotton yarn as a representative example, cotton fibers exhibit a natural helical structure. Under the torsional tension induced by twisting, individual cotton fibers undergo relative displacement and interlocking within the yarn assembly, resulting in a complex internal architecture. Given the extensive fiber entanglement present in cotton yarn, appropriate simplifications are essential for geometric modeling and numerical simulation to ensure efficient utilization of computational resources. Accordingly, the following fundamental assumptions are adopted.
Each yarn is treated as an independent continuous entity, with its geometric morphology determined jointly by the central axis and cross-sectional shape. The microscopic structural differences of fibers within the yarn are neglected, and the yarn is treated as a homogeneous continuous medium.
The specific arrangement patterns, twist angles, and interfiber interactions of individual fibers within a single yarn are ignored, considering only the macroscopic geometric morphological characteristics of the yarn.
Yarns strictly follow nonpenetration constraint conditions, where any two yarns cannot exhibit geometric overlap or mutual penetration. In yarn interlacing regions, elastic compression deformation of yarn cross-sections is permitted, typically manifesting as the transformation from circular to elliptical cross-sections.
Three-dimensional yarn modeling
Taking pure cotton plain weave fabric as an example, the yarn linear density was 14.6 tex, with warp and weft densities of 420 ends/10 cm and 350 picks/10 cm, respectively. The tightness calculation formula for pure cotton plain weave fabric is presented as follows: tex represents the fineness or linear density of yarn, defined as the weight in grams of 1000 meters of yarn under standard moisture regain conditions. Before geometric modeling, it is necessary to calculate the tightness of the fabric. The calculation formula are as follows:


where: E represents the total fabric tightness; Ej denotes the warp direction tightness; Ew represents the weft direction tightness; dj is the diameter of the warp yarn; pj is the center-to-center distance of warp yarns; dw is the diameter of the weft yarn; and pw is the center-to-center distance of weft yarns, as illustrated in Figure 1.

Schematic diagram of plain weave fabric tightness measurement.
Regarding the cross-sectional shape and bending path of yarns, a VHX-5000 ultra-depth-of-field microscope system was employed to observe the yarns. It was found that both warp and weft yarns exhibited elliptical cross-sections, which were therefore characterized using power-law elliptical equations. Consequently, the standard power-law elliptical equation was introduced:
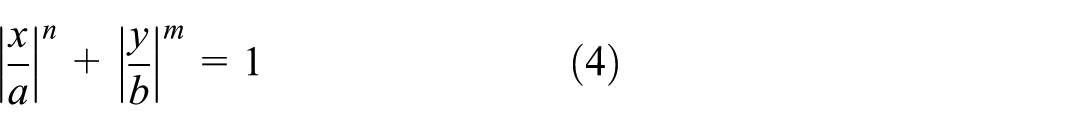
where a and b represent the semi-major and semi-minor axis lengths of the ellipse, respectively, and n and m are power exponents. To facilitate precise path construction in three-dimensional modeling software, the value 1 on the right-hand side of Equation (4) was rewritten as

where
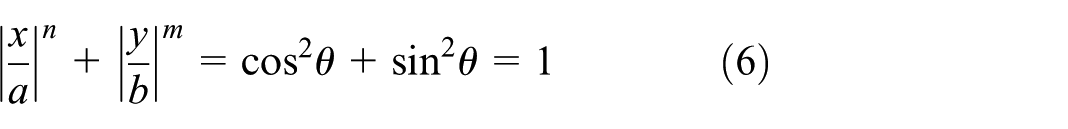
therefore, the elliptical cross-sectional equation of the yarn can be obtained as
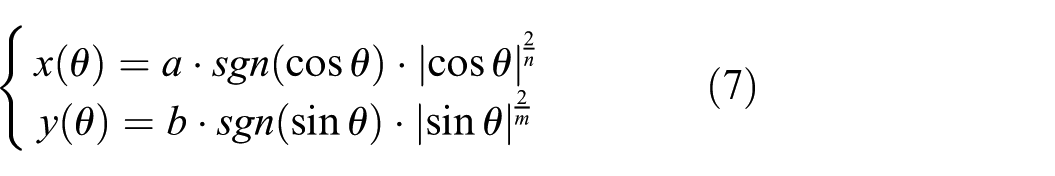
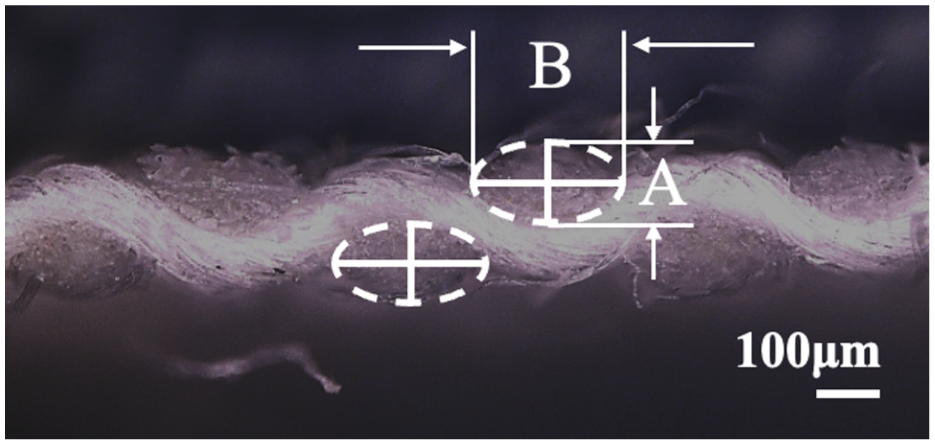
where sgn is the sign function, which ensures the continuity and symmetry of the equation across all four quadrants. Considering practical modeling requirements, the semi-axis lengths were expressed using measured fabric parameters:
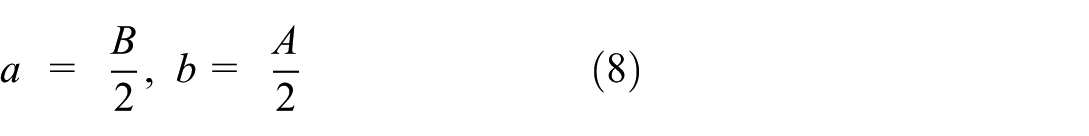
Here, the parameters B and A correspond to the lengths of the major and minor axes of the yarn cross-section, respectively. As illustrated in Figure 2, the bending path of an individual yarn can be constructed using third-order Bézier curves in SolidWorks. The third-order Bézier curve is expressed by
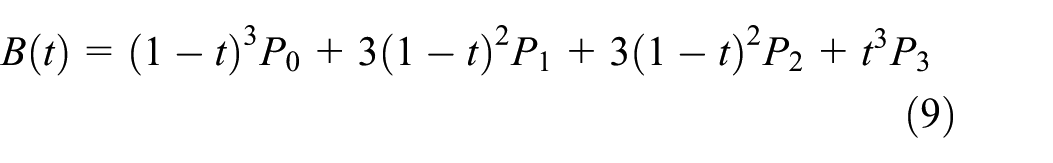
Yarn cross-sectional shape.
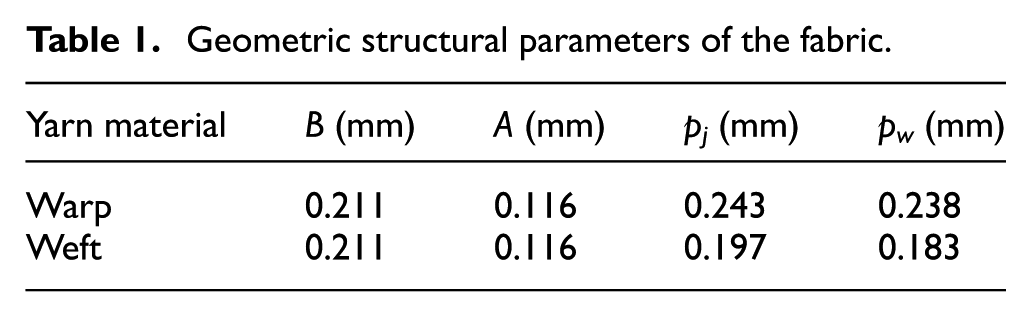
where P0 and P3 represent the starting and ending points of the curve, respectively, whereas P1 and P2 serve as intermediate control points. The geometric parameters of the fabric are presented in Table 1. The flexible adaptation to complex curvature variations can be achieved through positional adjustments of these control points, thereby enabling highly accurate fitting of yarn interlacing configurations.
Geometric structural parameters of the fabric.
Based on the aforementioned yarn cross-sectional equations and yarn crimp paths, modeling was conducted in SolidWorks. The modeling process involved first sketching the yarn cross-sections, then generating individual yarns through sweep operations. Subsequently, plain weave fabric with interlaced warp and weft yarns was constructed by arraying the individual yarns, as illustrated in Figure 3.
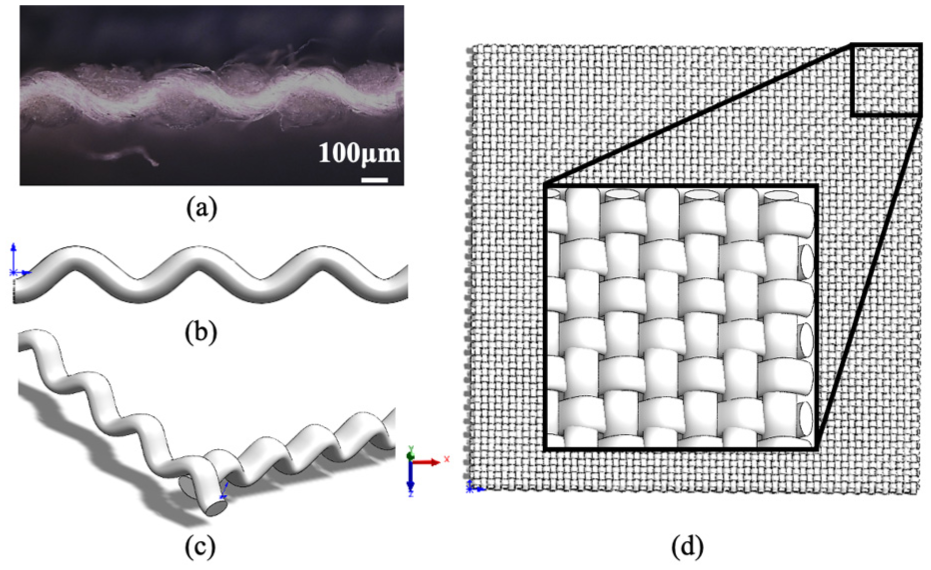
Construction of the 3D fabric model: (a) yarn buckling path; (b) single-yarn model; (c) first interlacing of warp and weft yarns; (d) completed plain weave fabric model.
Fabric shape retention testing process
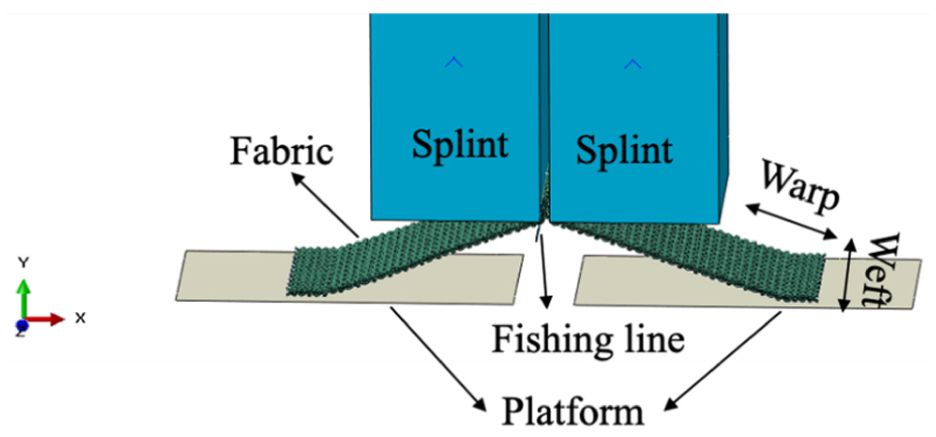
The working principle of the fabric shape retention testing apparatus employed in this study is illustrated in Figure 4. Prior to testing, fabric specimens were preconditioned for 24 hours in a controlled environment maintained at 20°C ± 2°C with a relative humidity of 65% ± 3%. The experimental apparatus consisted of a platform, splint, fishing line, and camera system for precise positioning of 150 mm × 50 mm fabric specimens. The fishing line lifted the fabric to a height of 60 mm, after which the splint applied a pressure of 40 N to the fabric. The imaging system continuously captured the deformation process at a frame rate of 8.60 fps with a pixel resolution of 1284 × 961. The experimental procedure consisted of three sequential phases, namely the lifting and arching process, the compression process, and release and recovery process, as depicted in Figures 4 and 5.
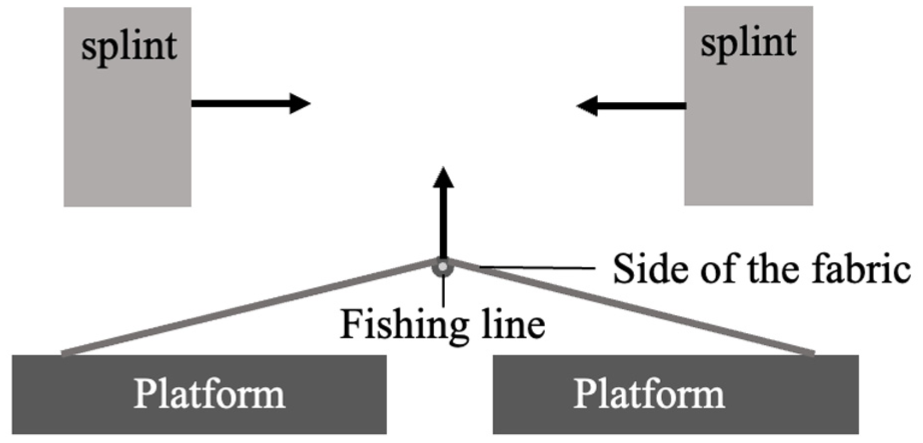
Schematic diagram of the fabric shape retention experiment.
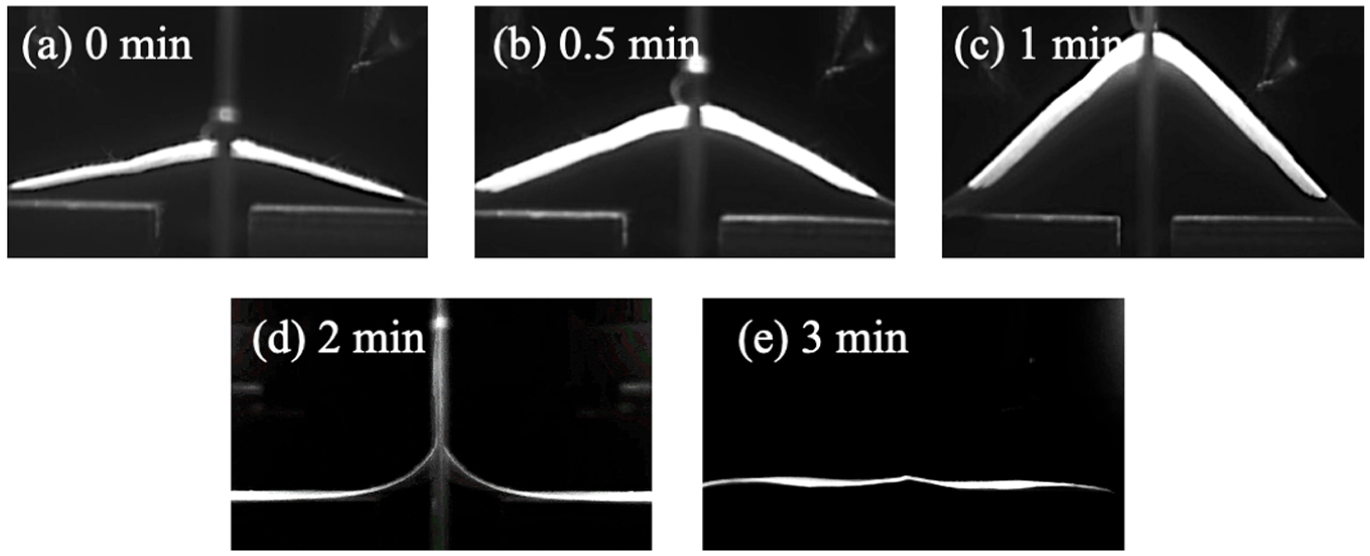
Experimental procedure for fabric formability testing: (a)–(c) the lifting and arching process; (d) the compression process; (e) the release and recovery process.
A linear calibration relationship of 0.0862 mm/pixel was established using a standard scale ruler, and the captured fabric images were subsequently processed to enhance the visibility of fabric curvature. Based on the symmetric characteristics of the fabric crease profile, the right-wing region was selected for curve fitting analysis. A rectangular coordinate system was established with the fabric's axis of symmetry as the y-axis and the top edge of the platform as the x-axis, as shown in Figure 6.
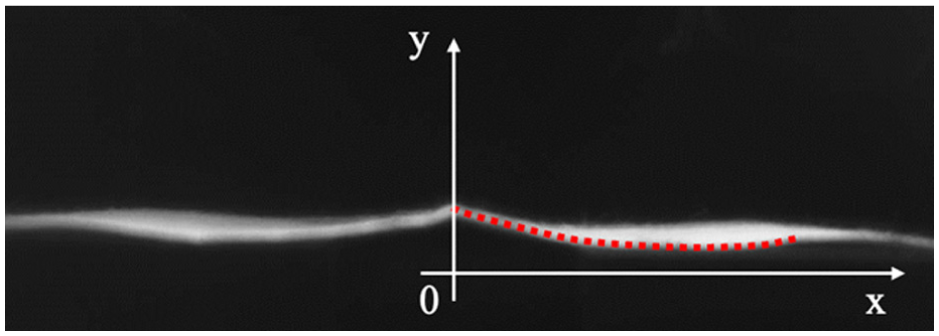
Coordinate axis setup for fabric crease fitting analysis.
Discrete points along the crease profile were fitted using a nonlinear function in Origin. The ExpDec2 model yielded the most comprehensive fitting results. The coefficient of determination (R2) reached 0.998. This is illustrated in Figure 7. The curve formula obtained from the fitting is
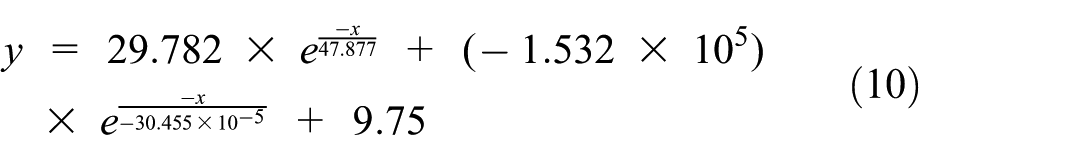
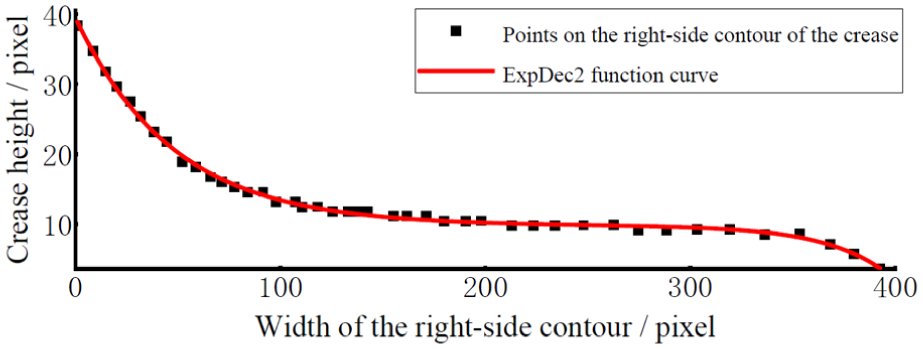
ExpDec2 image fitting results.
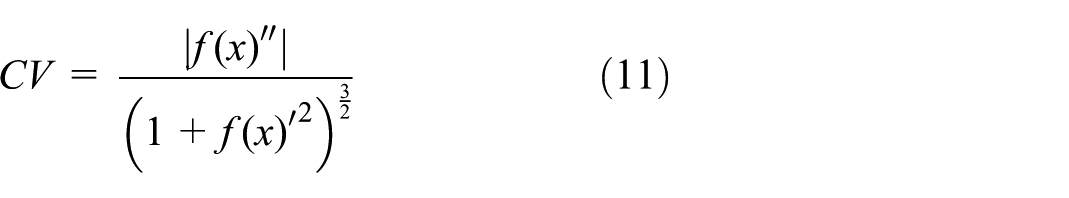
The maximum curvature of the fabric was subsequently calculated using the curvature formula, which served as the evaluation criterion for fabric shape retention performance:
Simulation parameter configuration for the draping process
To obtain the residual stress variations in fabric following the dropping phase during draping simulation and to validate the effectiveness of finite-element modeling, 24 this study employed the ABAQUS explicit dynamic solver for finite-element analysis of the fabric draping apparatus experimental process. 25
Geometric dimensions and material parameters of the model
The finite-element model was constructed based on the actual fabric draping apparatus. Considering computational resource optimization, a 1:10 scale model was adopted. Yarns, as the fundamental units of textile materials, exhibit significant nonlinear elastoplastic mechanical behavior. In ABAQUS finite-element analysis, accurate definition of yarn material properties requires consideration of their composite mechanical behavior. Yarns demonstrate progressive damage accumulation and stiffness degradation characteristics during tensile loading rather than instantaneous failure. This nonlinear response primarily stems from the coupling effect between elastic and plastic deformation. Therefore, an XL-2 yarn strength tester was employed to determine yarn mechanical parameters. Yarns were extracted from different positions in the warp and weft directions of plain weave fabric and prepared as 600-mm-long specimens. Experimental parameters were set as follows: gauge length of 500 mm, tensile speed of 250 mm/min, ensuring yarn failure under stable strain rates. Each experimental group consisted of no fewer than 10 repeated tests on yarns from the same batch to eliminate the influence of structural nonuniformity and potential defects in yarns. The experimental results are presented in Table 2. Material properties were measured experimentally. Based on actual measurements, the elastic modulus of polyester was calculated according to
Mechanical parameters of yarn.
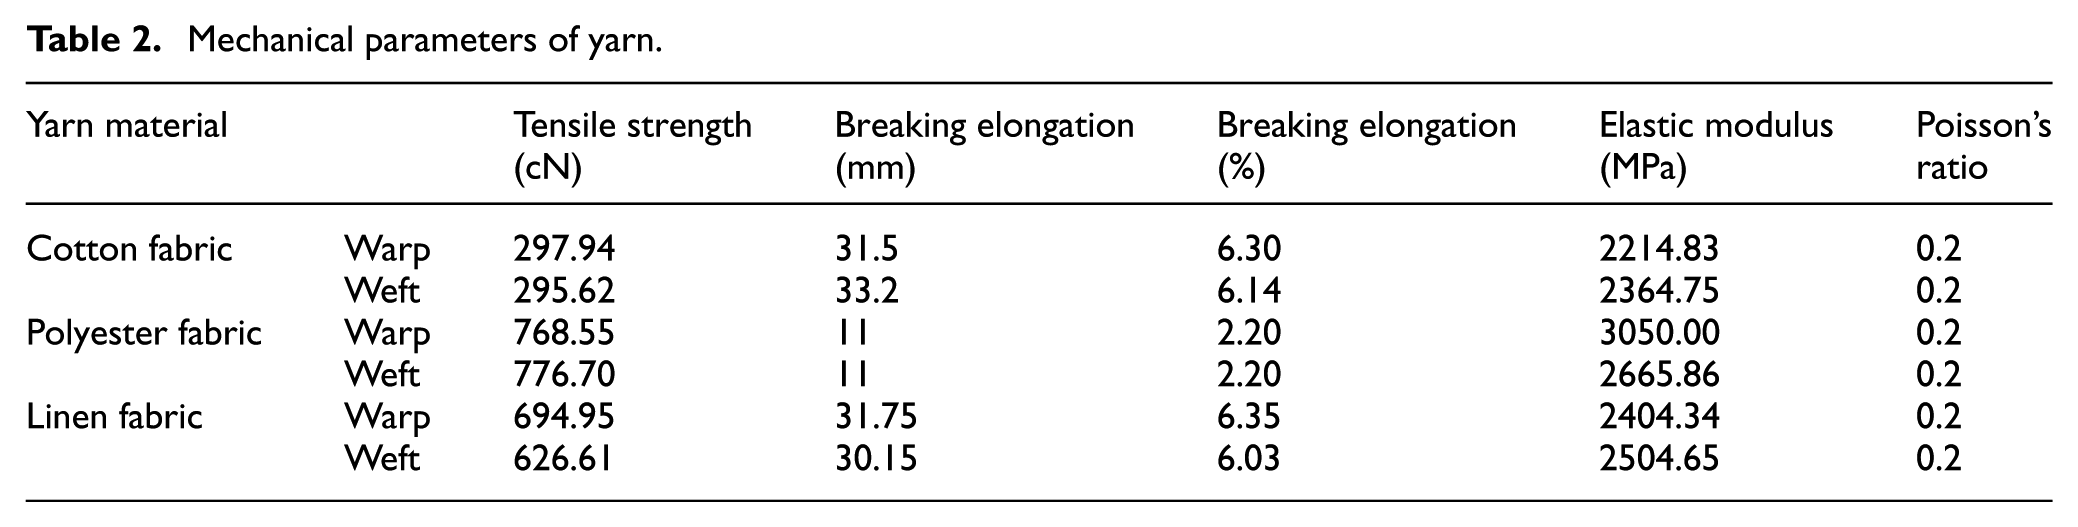
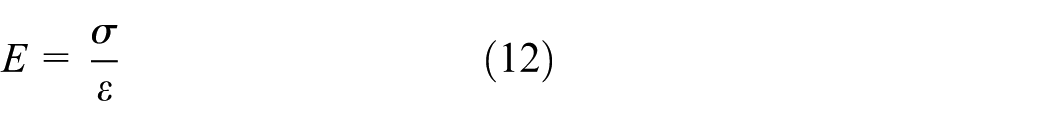
where E is the elastic modulus of the yarn, σ denotes stress, and ε denotes strain. Figure 8 shows the test results of yield strain for each fabric during compression.
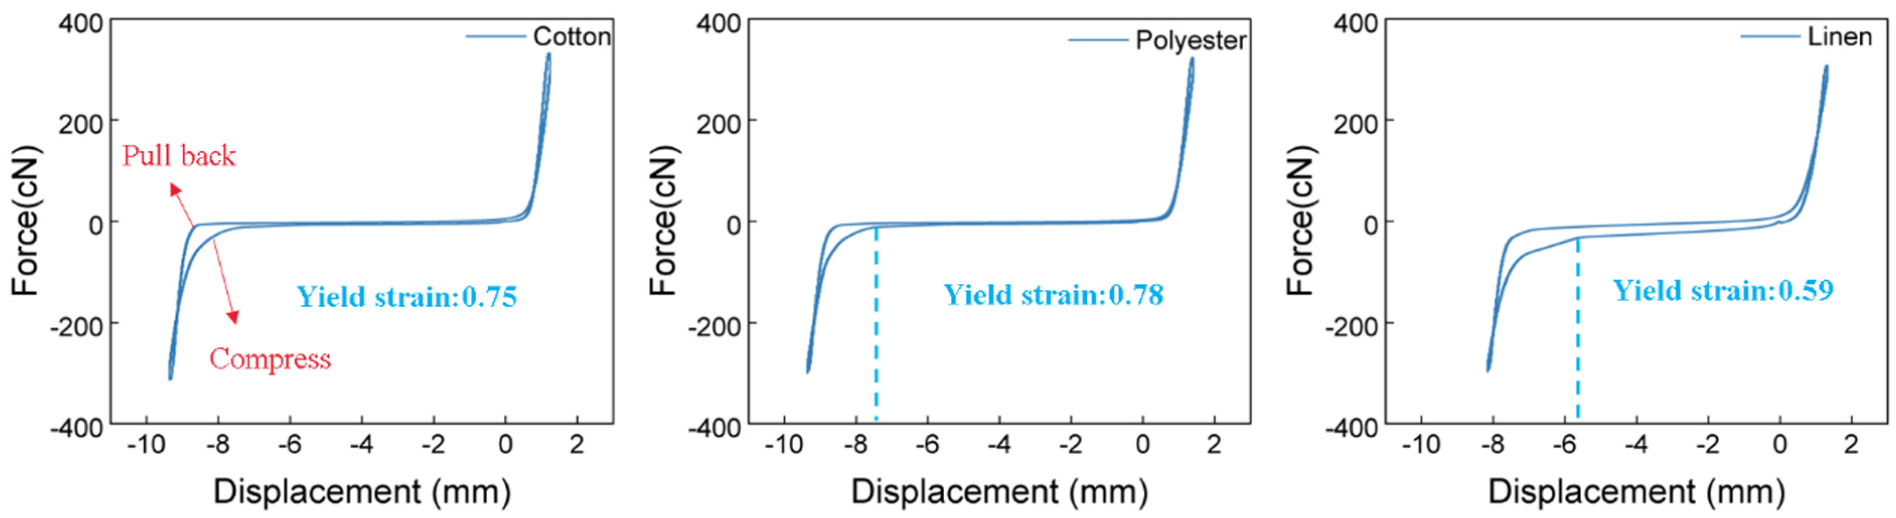
Yield strain of different fabrics during compression.
The initial gauge length for compression was set to 10 mm. The initial position was 0 mm. The compressive force applied to the fabric is negative. The nonlinear stress–strain relationship during compression indicates the plastic deformation of the fabric. The measured yield strain was input into the finite-element model to simulate the plastic behavior of fabric under compression. According to measurements, the yield strain of cotton fabric is 0.75, that of polyester is 0.78, and that of linen is 0.59. To simplify simulation calculations while ensuring structural stability, auxiliary structures such as the support platform and lifting device were defined as rigid bodies, meaning no specific material properties were assigned to them in the model.
Following the establishment of material properties in ABAQUS, assembly of the finite-element model was performed in accordance with the experimental setup. The resulting assembly configuration is shown in Figure 9.
Assembly of the finite-element model.
Changes in yarn mechanical parameters directly exert a significant influence on stress–strain behavior. Fluctuations in elastic modulus synchronously alter the stress magnitude at a given strain, representing the primary source of error in stiffness and deformation prediction. Breaking elongation governs the material’s ductile response, and its deviation directly affects the determination of ultimate strain and failure mode. Variations in Poisson’s ratio modify lateral contraction and further distort in-plane stress distribution, with errors becoming more pronounced under constrained boundary conditions. Neglecting warp/weft anisotropy results in substantial deviations in stress prediction under operating conditions such as oblique tension.
Contact, boundary conditions, and loading configuration
The analysis step settings, contact definitions, and boundary conditions in ABAQUS primarily involve the Step, Interaction, and Load modules. First, based on the actual fabric draping apparatus process, four explicit dynamic analysis steps were established under the ABAQUS Step module with geometric nonlinearity option enabled to capture the nonlinear behavioral characteristics of fabric during large deformation processes. Gravity loading was applied in the initial analysis step, followed by completion of the entire fabric deformation process through STEP1 to STEP4. In STEP1, the fishing line performed lifting operations on the fabric, elevating it to the predetermined target height. During STEP2, the splint applied pressure to the fabric and performed clamping operations. STEP3 was configured as the simultaneous withdrawal process of both fishing line and splint, where the fabric underwent free-fall motion under gravitational force alone. STEP4 analyzed the creases formed in the fabric during the compression process, observing the gradual recovery process of fabric creases.
In the Interaction module, contact relationships between model components were established. Contact types between yarn-to-yarn, yarn-to-platform, yarn-to-fishing line, and yarn-to-splint interfaces were set as “all with self” self-contact algorithm under General contact. The measurement process of the friction coefficient is shown in Figure 10.
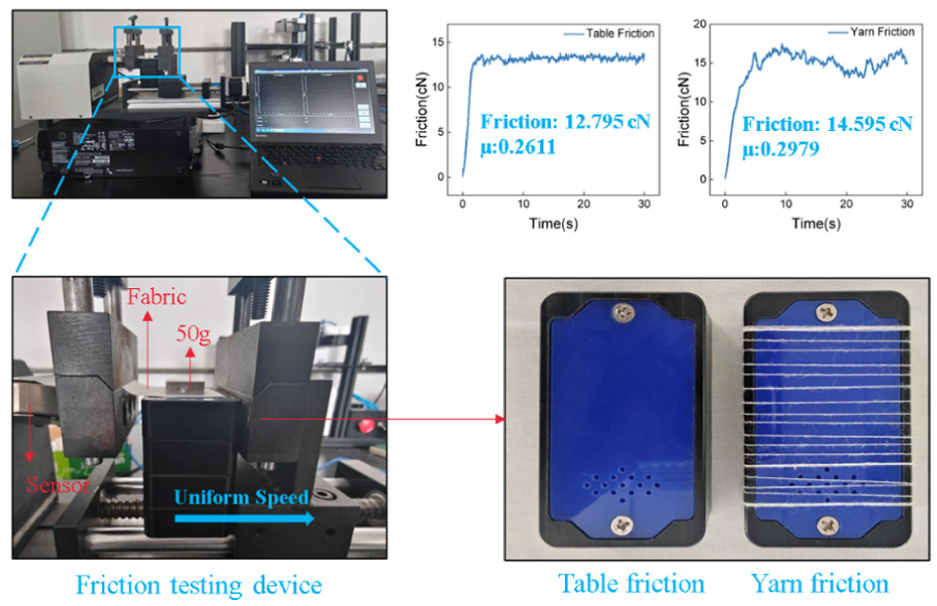
Determination of the friction coefficient.
Under uniform motion, the friction force is equal to the tensile force recorded by the sensor. The average tensile force from 10 to 30 seconds is calculated as the friction force. The friction coefficient μ is the ratio of the friction force to the normal pressure. The gravitational acceleration is taken as 9.8 N/kg. The calculated friction coefficient between yarns is 0.2979, and the friction coefficient between yarn and the desktop is 0.2611.
The deformation of auxiliary structures such as the platform and fishing line was minimal and not the focus of this study. Computing their stress or deformation would increase solution time; therefore, the platform and fishing line were configured as rigid bodies. All degrees of freedom of the platform were constrained with complete fixed constraint ENCASTRE, setting U1=U2=U3=UR1=UR2=UR3=0. Five degrees of freedom of the fishing line were constrained except for Y-axis motion, with displacement condition U2=6 applied during STEP1 to simulate lifting motion, and withdrawal motion in the negative Z-axis direction applied during STEP3. Five degrees of freedom of the splint were constrained except for X-axis motion, with displacement conditions for lateral compression motion applied during STEP2, and withdrawal motion toward both sides applied during STEP3.
Gravity loading was applied to the fabric, with appropriate gravitational acceleration values selected based on the physical characteristics of the fabric material. As the core object of simulation analysis, the fabric was subjected to gravity preloading in the initial analysis step, with gravity loading maintained constant throughout the subsequent four analysis steps.
Mesh generation and job submission
After determining the above model and boundary conditions, appropriate meshing strategies were selected. Mesh density settings and a scaling approach were also selected. The selection was based on the structural characteristics of the fabric during model discretization. Mesh generation techniques primarily include three types: structured, free, and sweep meshing. This study focuses on warp and weft yarn structures. These structures have relatively regular geometric characteristics. Thus, hexahedral elements were selected as the basic mesh element type. A uniform scaling approach was adopted. It was used to scale the fabric geometric model to a computational-friendly size. The scaling factor is 0.1. The scaling factor is 0.1. The scaling method adopts uniform linear scaling. To verify the 1:10 scaling does not affect the physical validity, we compared the maximum curvature of a full-scale model (using a coarse mesh) with the scaled model under identical gravity and pressure. The difference was 3.2%, confirming that scaling preserves the deformation behavior due to the dominance of gravity and contact forces.
The seed distribution of fabric instances was precisely controlled. The Seed Part Instance function was used for this control. Mesh density parameters were determined carefully. The determination was based on a balance between computational accuracy and efficiency. Specifically, fabric yarns have certain geometric dimensions and deformation characteristics. Accurate capture of stress distribution during deformation is critical. Therefore, the seed density parameter for the fabric yarn portions was set to 0.01. This fine mesh density ensures full capture of subtle stress changes. The changes occur in the yarns during the deformation process. Computational costs need to be controlled effectively. At the same time, calculation accuracy must not be compromised. Auxiliary structures include the splint and platform. They have minimal effect on the core stress analysis of the fabric. These structures were subjected to relatively coarser mesh processing. Their seed density was set to 0.8. The fishing line has a relatively small geometric volume. It also has limited influence on the overall analysis results. Its seed density was set to 0.05. This achieves a reasonable trade-off between detail and computational efficiency. The sweep technique was used for mesh generation. The fabric model ultimately generated 53,964 mesh elements. The “C3D8R” hexahedral element type was selected. It has excellent performance in simulating solid deformation. Figure 11 shows the mesh generation of the fabric model.
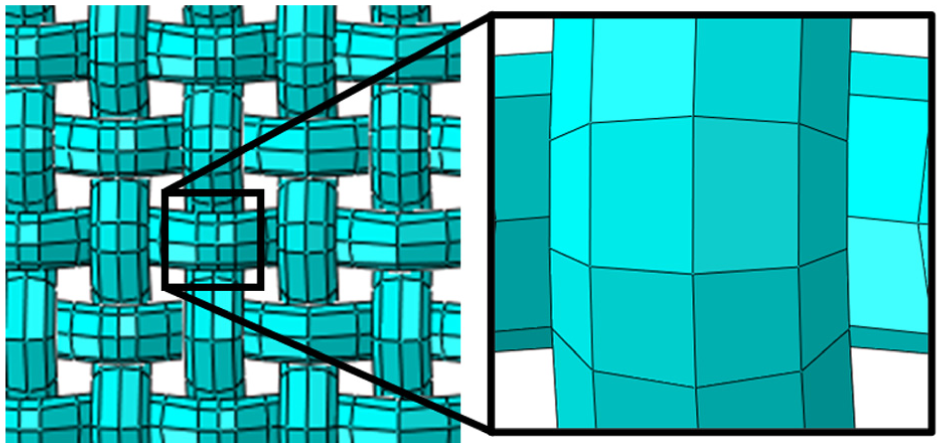
Fabric mesh generation.
Finally, a new job was created and submitted in the ABAQUS Job module. In the multiprocessor parallel computing configuration, the Multiple Process option was selected with the number of processor cores set to total computer cores minus 2, thereby fully utilizing computational resources to improve simulation efficiency while reserving necessary operational resources for the system to ensure overall computer performance stability.
Finite-element simulation verification for textile shape retention
This study investigated the shape retention behavior of three fiber materials (cotton, polyester, and linen) using finite-element modeling in ABAQUS. Three different pressing time conditions (30, 60, and 90 s) were established to examine the effects of different materials and pressing conditions on textile shape retention. Following pre-processing setup, mesh generation was conducted and numerical solutions were obtained to determine stress distributions and deformation responses of textiles under various conditions.
To validate the effectiveness of finite-element simulation, a dynamic tracking analysis method was employed to systematically investigate the curvature evolution patterns of plain cotton fabric throughout the complete cycle. The study object underwent three distinct phases: the lifting and arching process, the compression process, and the release and recovery process. Following the fabric's return to the platform during the release and recovery process, a 3-minute deformation recovery observation period was established. Origin software was utilized to fit the curves and calculate the maximum curvature values.
Lifting and arching process
As illustrated in Figure 12, qualitative observation of the morphological evolution of cotton fabric demonstrates a high degree of consistency between the numerical simulation results and the experimental observations. During the lifting and arching process, four critical time points (15, 30, 45, and 60 s) were selected for comparative morphological analysis. It was clearly observed that, in the initial stage of the gradual upward movement of the lifting device, the fabric deformed from its initial flat configuration, initiating deformation at the central region and developing into an arched geometry. The central area of the fabric underwent bending deformation first, followed by progressive propagation of the deformation toward both sides, eventually forming a smooth arched profile. This deformation propagation pattern was precisely reproduced in the numerical simulation, indicating that the established finite element model is capable of accurately capturing the nonlinear large-deformation behavior of the fabric material.
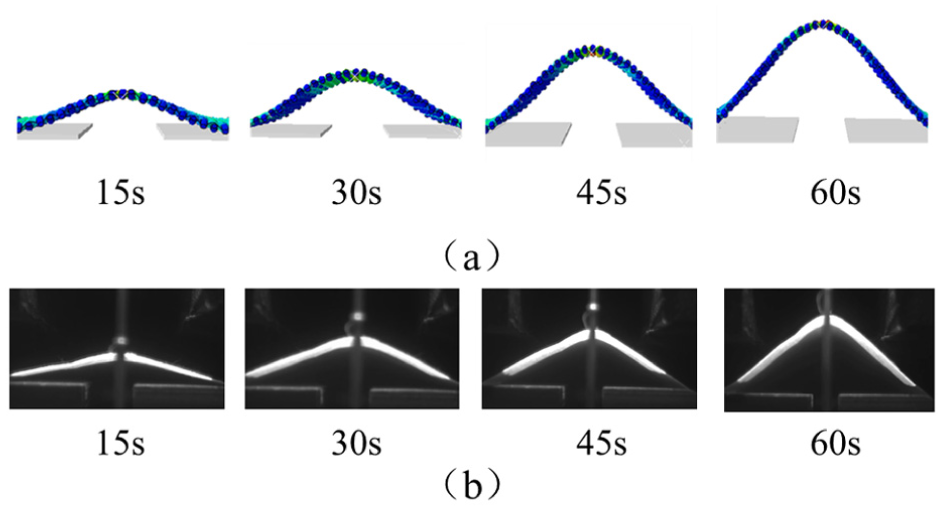
Comparison between simulation and experimental results of cotton fabric during the lifting and arching process.
Similarly, for polyester and linen fabrics, as shown in the corresponding Figure 13, the experimentally observed fabric morphologies exhibited a high level of agreement with the finite-element simulation results in terms of arch curvature, bending degree, and overall profile. With the continuous increase in lifting height, the arch curvature of the fabric gradually increased, and the geometric profile of the arch progressively approached a stable arc shape. When the lifting device reached the predetermined height and maintained a stationary position, the arch curvature of the fabric tended to stabilize, and the fabric entered a quasi-static equilibrium state.
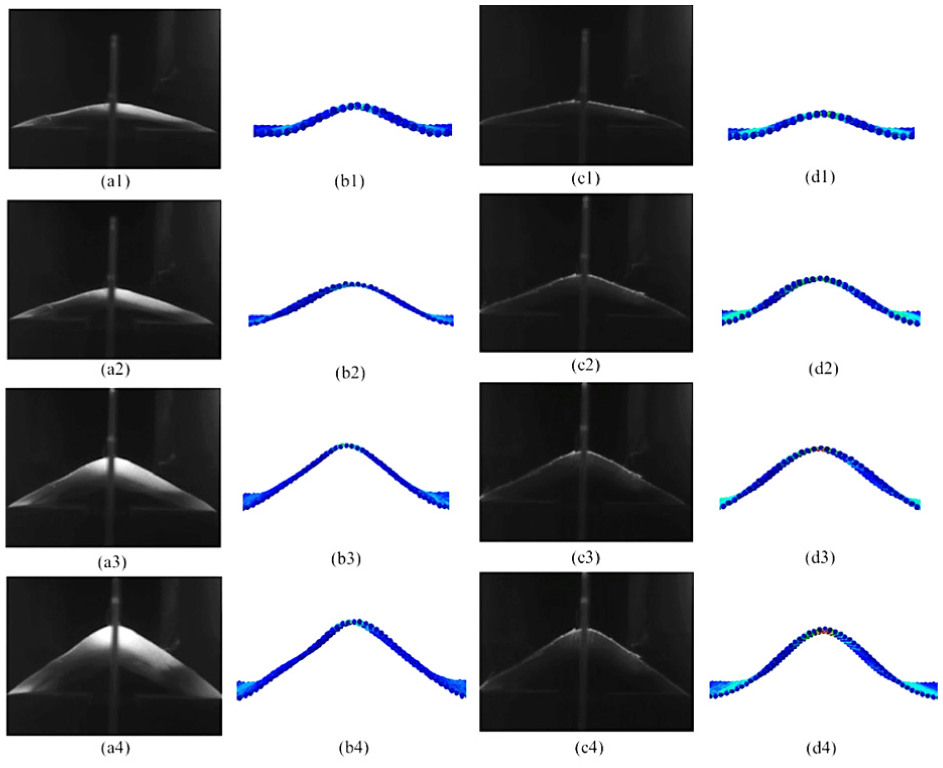
Comparison between simulated and actual lifting–arching of fabrics: (a1)–(a4) actual lifting–arching process of polyester fabric; (b1)–(b4) simulated lifting–arching process of polyester fabric; (c1)–(c4) actual lifting–arching process of linen fabric; (d1)–(d4) simulated lifting–arching process of linen fabric.
Quantitative comparative analysis between simulation results and experimental data was conducted by measuring fabric curvature values at different lifting heights, establishing quantitative correspondence between numerical simulation and actual experiments, as illustrated in Figure 14. For plain weave cotton fabric during the lifting phase, comparative analysis of fabric arch curvature changes over time indicated that experimental curves and simulation curves demonstrated high consistency in both trend and magnitude. Both curves stabilized after 45 s, with experimental curvature values fluctuating within the simulation curvature ±0.05 rad/cm error range during the dynamic deformation phase. Although linen fabric showed slightly higher simulated curvature values compared to actual experimental values during the initial lifting phase, this discrepancy may be attributed to insufficient discretization accuracy in finite element mesh regions with large local strain gradients during the early fabric deformation stage. Polyester fabric maintained consistently small deviations between simulated and experimental curvatures throughout the entire lifting process. The mean squared error of crease height for cotton fabric is 0.016, for polyester fabric is 0.021, and for linen fabric is 0.019.
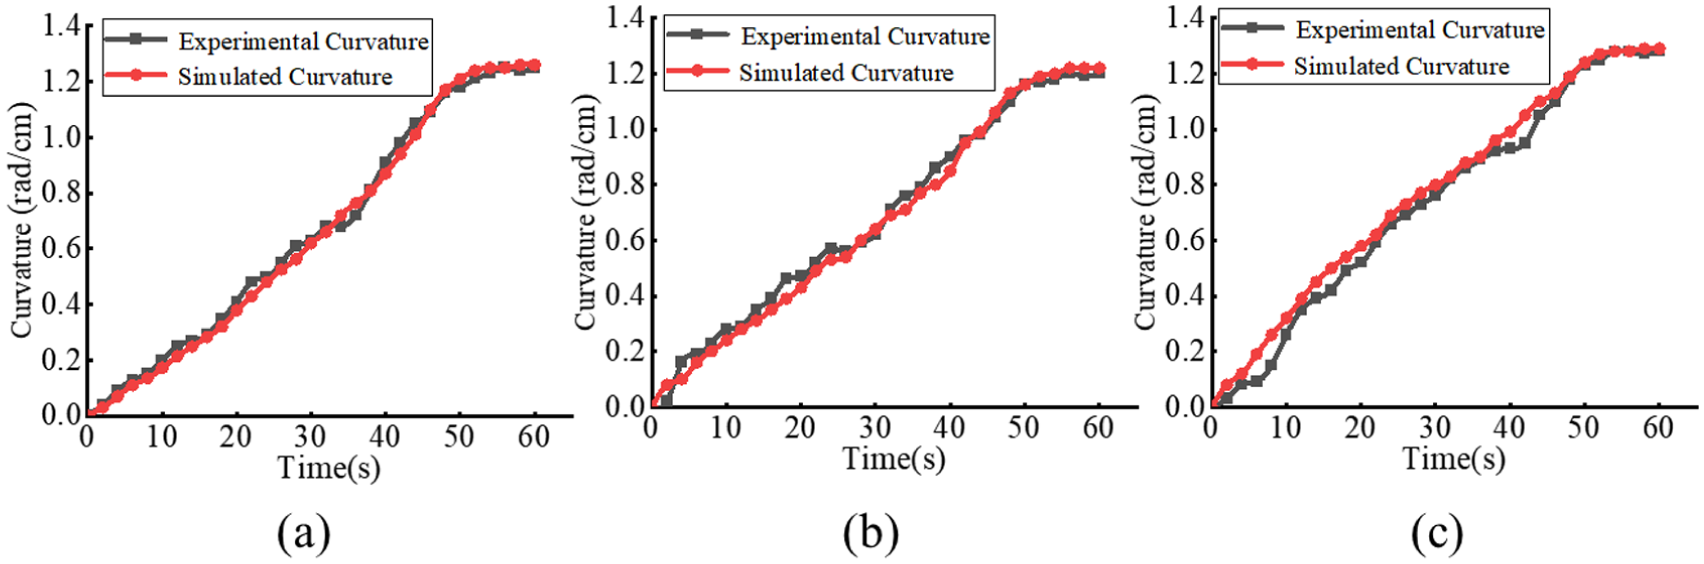
Comparison of curvature between lifting–arching simulation and actual experiment: (a) cotton fabric; (b) polyester fabric; (c) linen fabric.
Curvature data were collected and analyzed at multiple time points throughout the lifting process for all three fabrics, with Pearson correlation analysis performed between simulated curvature and experimentally measured curvature. Calculation results showed correlation coefficients of r = 0.967 for cotton fabric with bilateral testing P < 0.01, reaching extremely significant levels and confirming significant positive correlation between experimental and simulation results. The correlation coefficient between simulated and experimental curvatures for polyester fabric reached 0.978. The Pearson correlation coefficient between actual experimental curvature and numerical simulation curvature for linen fabric was 0.969, similarly indicating extremely strong correlation and further confirming the reliability of numerical simulation. Based on the aforementioned qualitative morphological comparison, quantitative statistical analysis, and statistical correlation testing, it can be confirmed that finite-element numerical simulation of fabric during the lifting and arching phase possesses excellent validity and reliability.
Release and recovery process
Following comparative verification of fabric lifting morphology and curvature during the lifting phase, further comparative analysis was conducted on the morphological characteristics of the three fabrics after falling back to the support platform following pressure application. As shown in Figure 15, the overall morphology of simulated fabric after falling during the falling phase was highly similar to actual experiments, particularly at key locations where creases formed. Experimental fabrics exhibited slight asymmetry due to dynamic effects and pressure variations, while simulation results showed more regular symmetry due to idealized boundary conditions. Despite minor morphological differences, overall deformation patterns and stress distribution characteristics remained highly consistent. All three fabrics demonstrated increasingly significant deformation degrees with increasing pressing time, with this trend showing good consistency across all specimens. Specifically, the crease height formed in clamped sections gradually increased, and maximum curvature showed an increasing trend from visual observation.
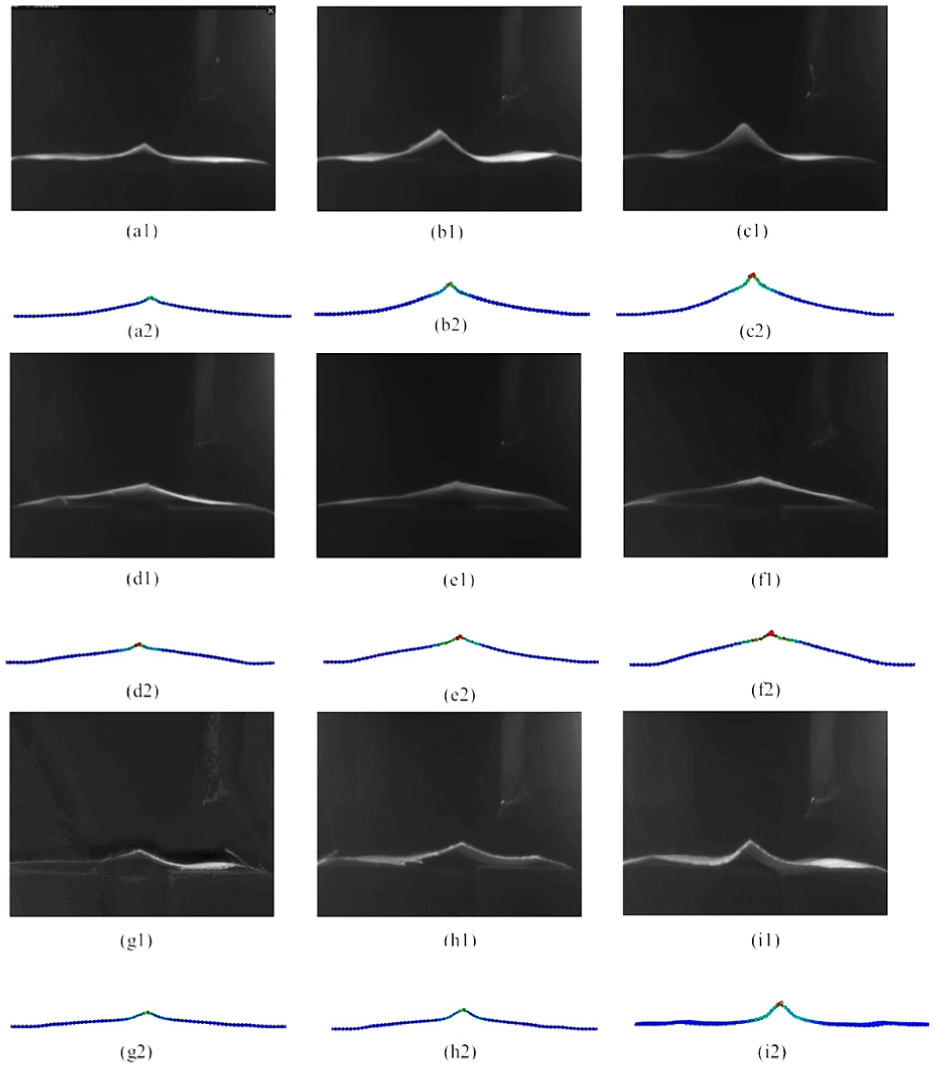
Comparison of fabric shape during simulated and actual release and recovery process: (a)–(c) cotton fabric release and recovery after 30, 60, and 90 s of loading; (d)–(f) polyester fabric release and recovery after 30, 60, and 90 s of loading; (g)–(i) linen fabric release and recovery after 30, 60, and 90 s of loading.
Through separate analysis of falling morphologies of different textile materials, it was found that various fabrics exhibited deformation behavior closely related to their yarn characteristics. Cotton fabric, due to cotton fiber's relatively low elastic modulus and breaking strength, formed the most pronounced creases under identical pressing conditions, with limited deformation recovery capability in crease regions. Polyester fabric, being relatively stiff with higher elastic modulus, exhibited unique deformation patterns after crease formation: except for the central crease region, areas on both sides of the crease differed significantly from the completely downward concave morphology shown by cotton and linen fabrics, with polyester fabric maintaining nearly straight states on both sides of creases, reflecting the strong bending rigidity characteristics of polyester fibers. Linen fabric, possessing higher tensile strength and relatively good elastic recovery performance, also formed creases under pressure loading and clamping, but its deformation degree was significantly less than cotton fabric, showing better morphological recovery trends after load removal.
Upon returning the fabric to the platform, a 3-minute deformation recovery observation period was implemented to acquire stable and reliable measurement data. Fabric morphological changes were continuously monitored throughout this interval. The fabric was deemed to have attained a relatively stable equilibrium state when the recovery rate of creases slowed to a near-plateau with no appreciable further changes. Using cotton fabric pressed for 60 s as an example, after 3 minutes of falling, through data processing methods of multiple repeated experiments and averaging, finite-element simulation yielded a maximum average curvature value of 0.36 rad/cm, while experiments yielded 0.35 rad/cm, with a relative error of only 2.8%, falling within acceptable precision ranges for engineering practices in textile material mechanical property testing. Similarly, analysis of polyester and linen fabrics showed that simulated maximum curvatures were within the error ranges of experimental maximum curvatures, thereby validating that finite-element simulation methods could accurately predict the deformation behavior of all three fabrics during the falling phase as shown in Figure 16.
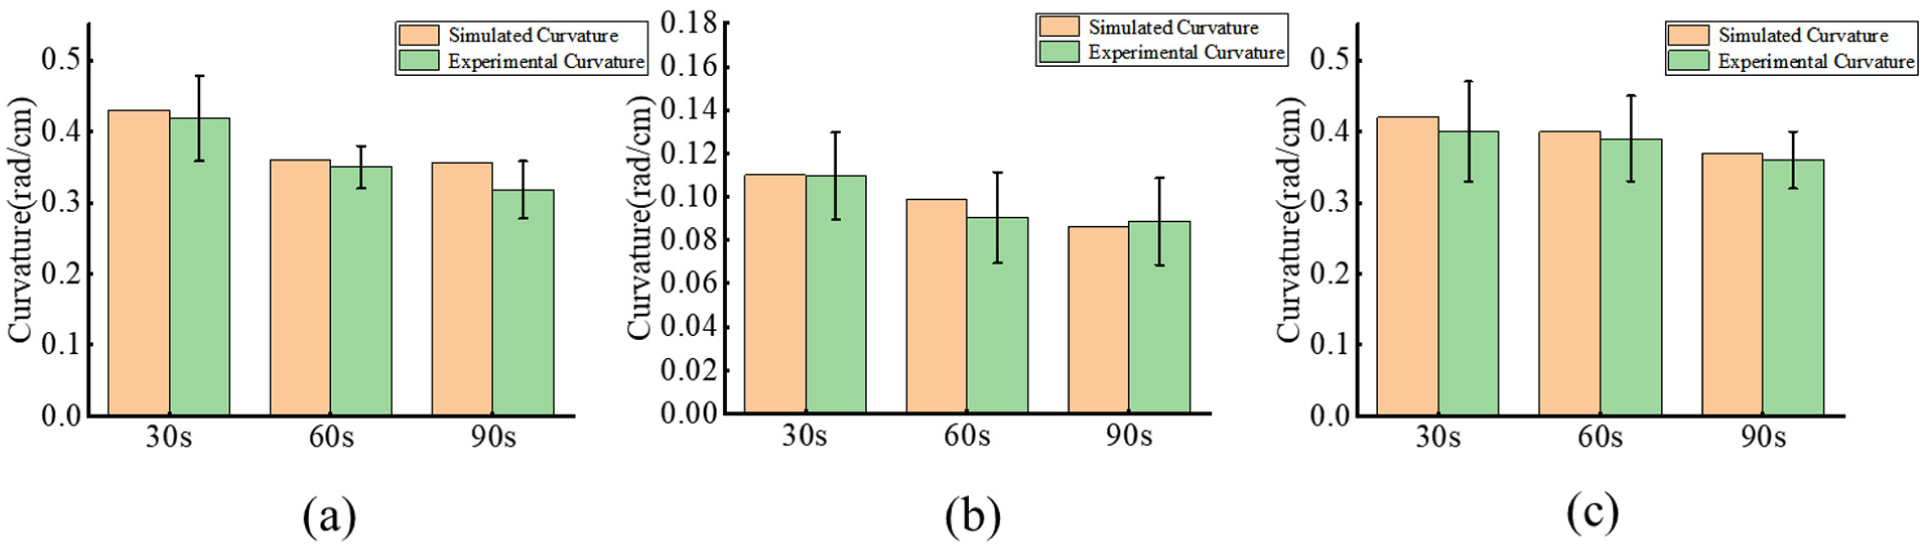
Comparison of maximum curvature during release–recovery process between actual and simulated experiments for different fabrics: (a) cotton fabric; (b) polyester fabric; (c) linen fabric.
Based on the aforementioned qualitative morphological comparison, quantitative statistical analysis, and statistical correlation testing, it can be confirmed that finite-element numerical simulation in textile shape retention experiments possesses excellent validity and reliability, proving the rationality and effectiveness of finite-element modeling methods and computational parameter settings.
Having validated the effectiveness of textile shape retention finite element simulation, further discussion was conducted on stress variations in the three fabrics under different pressing times during shape retention experiments. Figure 17 presents stress contour distributions for cotton, polyester, and linen plain weave fabrics under different pressing time conditions. Results indicated that with increasing pressing time, all three materials exhibited similar stress evolution patterns: stress values in fabric crease regions increased significantly, with increasingly pronounced geometric morphological changes. Stress spatial distribution analysis revealed distinct stress gradient characteristics in the crease regions, gradually decreasing from crease centers outward. This distribution pattern was consistent with results under cotton fabric 60 s pressing conditions, indicating that crease regions sustained maximum compressive stress loads in the system, producing cumulative deformation effects under sustained mechanical action. The red high-stress concentration phenomenon at crease centers resulted from technical limitations in numerical simulation, primarily caused by stress distortion due to rigid material property discontinuities and contact condition setting limitations. Therefore, when quantitatively analyzing actual fabric stress conditions, such distorted stress data must be reasonably excluded to ensure result accuracy.
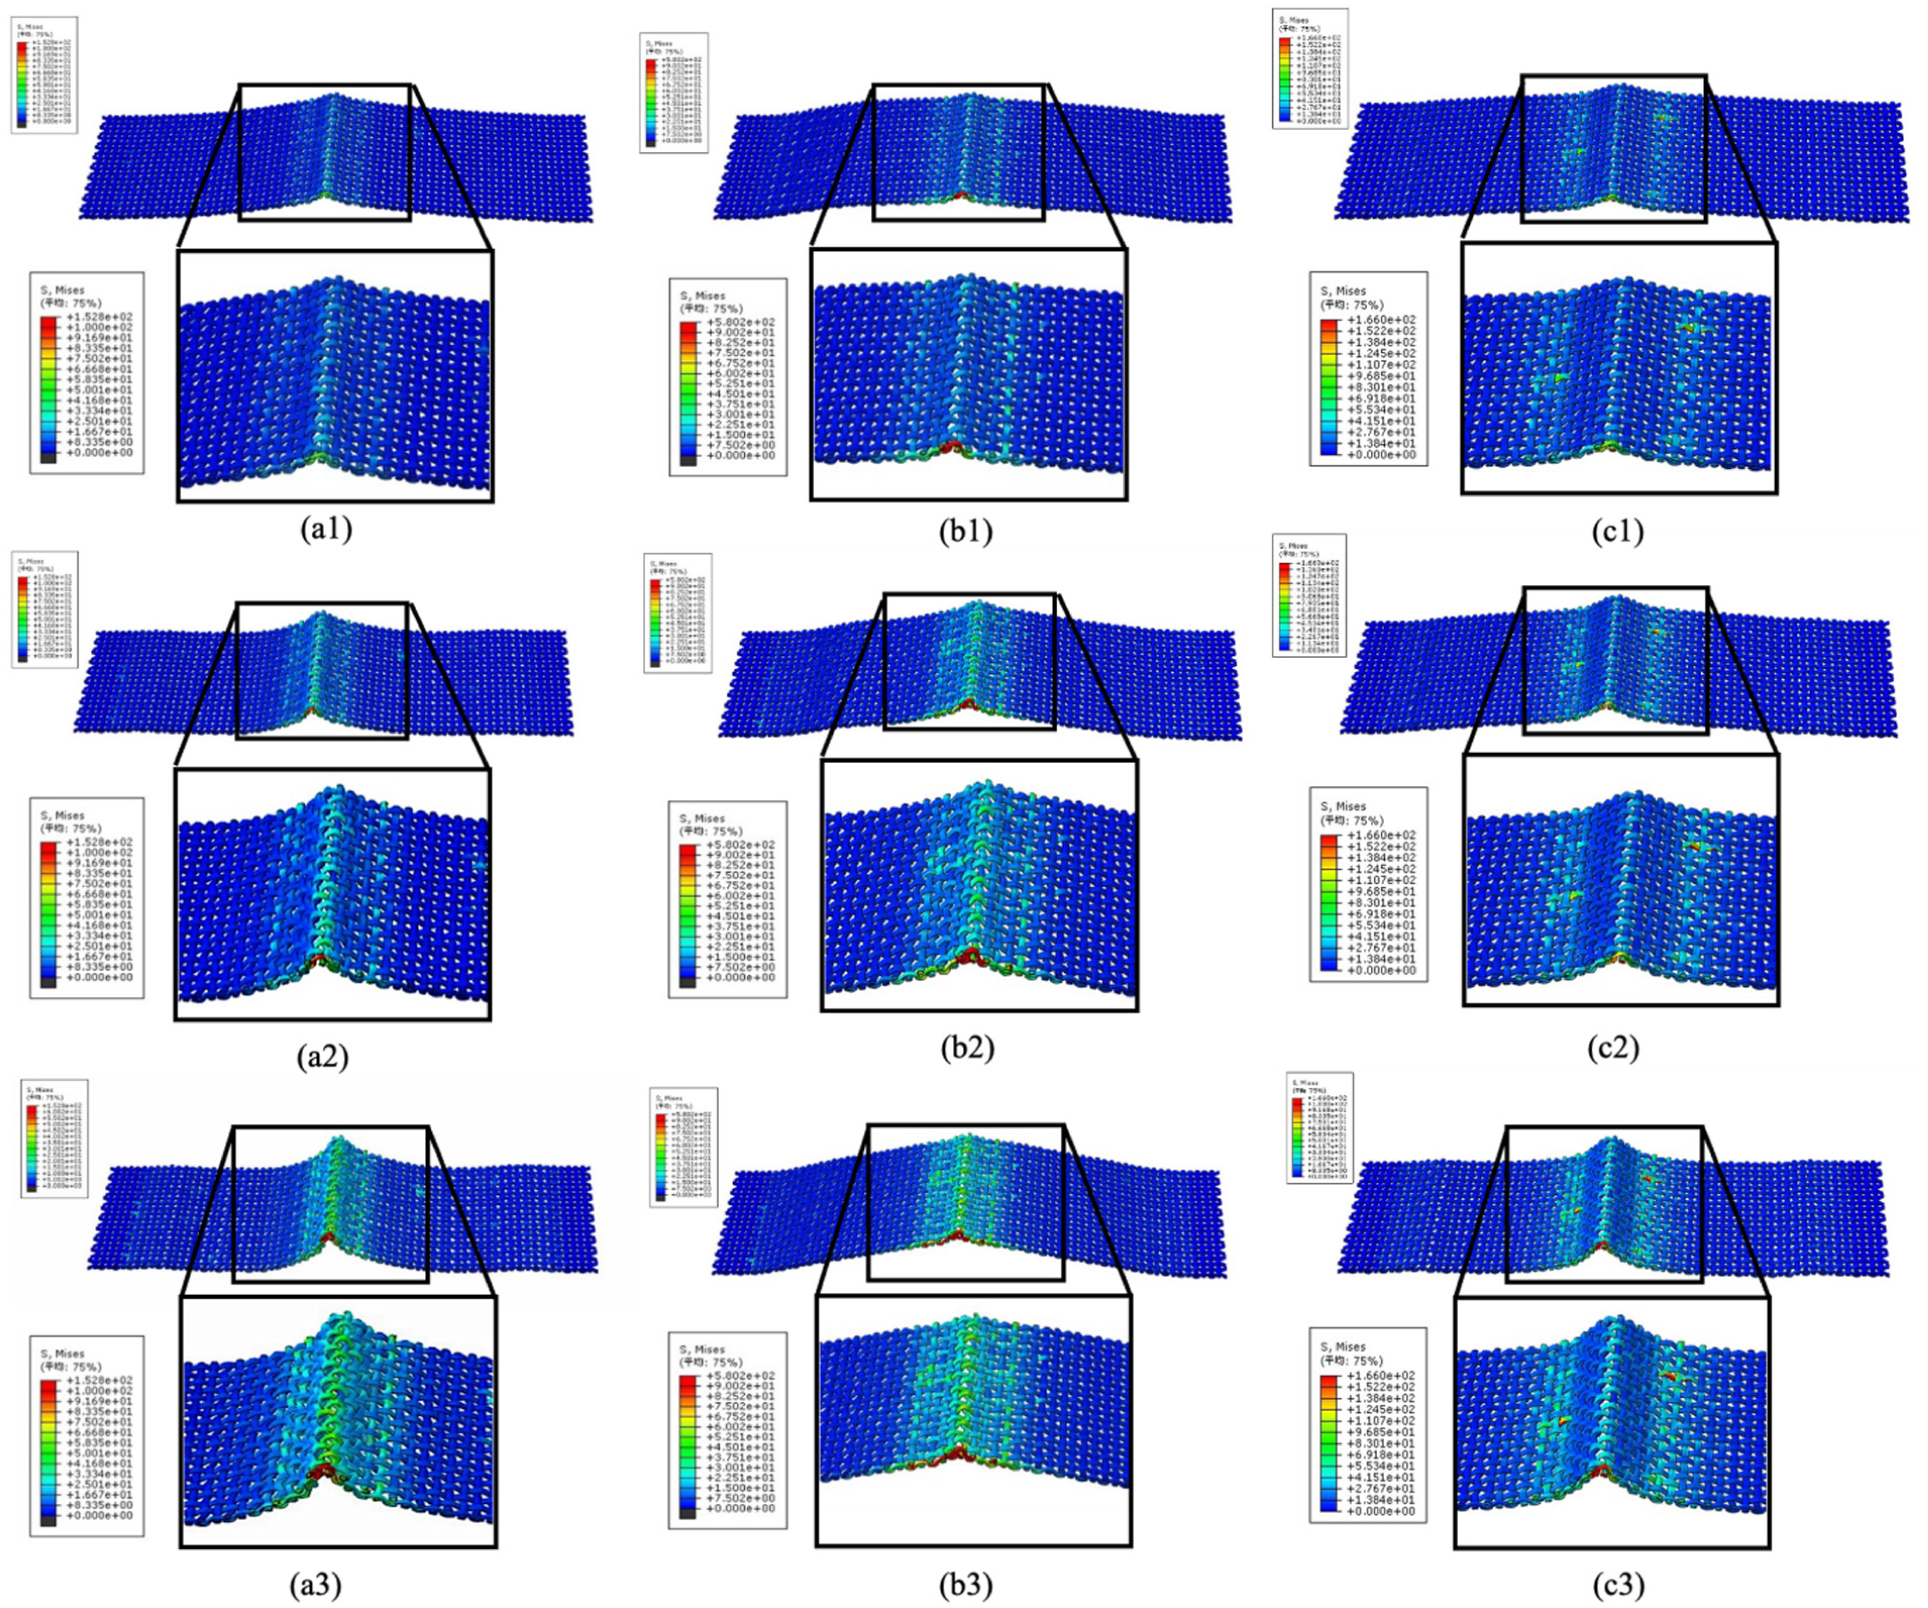
Stress cloud diagrams for different fabrics under various experimental conditions: (a1)–(a3) cotton fabric after 30, 60, and 90 s of loading; (b1)–(b3) polyester fabric after 30, 60, and 90 s of loading; (c1)–(c3) linen fabric after 30, 60, and 90 s of loading.
Effects of different materials on textile shape retention stress variations
Figure 18 presents falling stress variation patterns for the three fabrics under identical pressing times. Simulation results demonstrated that fabrics of different fiber materials all exhibited stress residual phenomena at crease locations during the falling phase, but residual stress magnitudes showed significant differences.
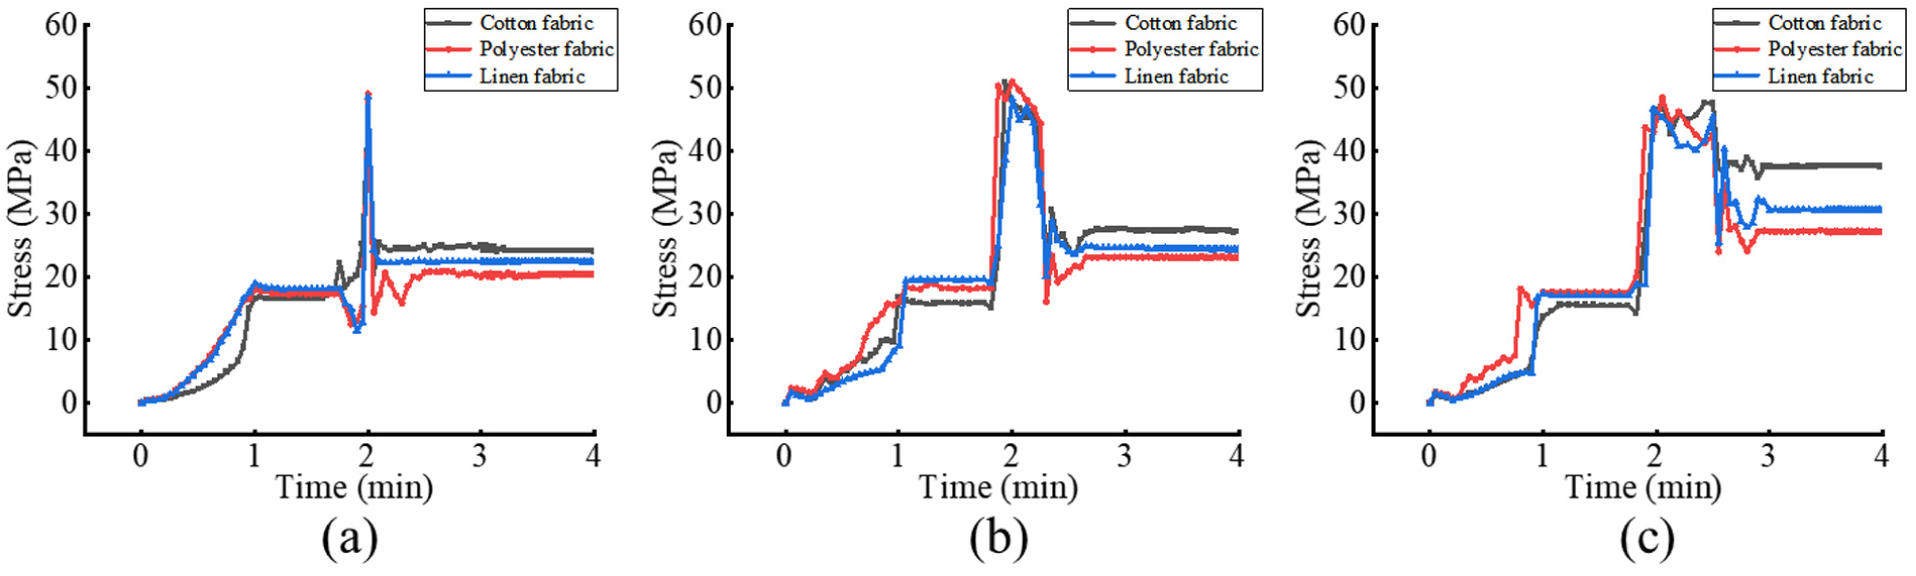
Stress comparison of fabrics made of different materials: (a) stress at 30 s loading; (b) stress at 60 s loading; (c) stress at 90 s loading.
From residual stress values, cotton fabric exhibited the highest residual stress levels, polyester fabric the lowest, and linen fabric intermediate values. Under 30 s pressing, residual stresses for all three materials concentrated around 22 MPa with relatively small differences. As pressing time extended to 60 s, stress differentiation phenomena began to appear among fabrics, with linen fabric residual stress gradually approaching polyester fabric levels while cotton fabric remained significantly higher. When pressing time extended to 90 s, cotton fabric residual stress reached a peak value of 37 MPa, significantly exceeding the other two materials.
This phenomenon can be attributed to intrinsic mechanical property differences among different fiber materials: polyester fibers possess higher breaking strength and good elastic recovery performance, enabling better geometric morphology recovery after external force removal, thus exhibiting relatively smaller residual stresses. Although linen fibers have higher cellulose crystallinity and fiber strength, their elastic recovery performance is relatively poor, with hysteresis effects during deformation-recovery processes. Cotton fibers have relatively lower breaking strength, making them more susceptible to plastic deformation during sustained pressing, resulting in limited stress relaxation and maintenance of higher residual stress states.
Effects of compression time on textile shape retention stress variations
Stress comparison for fabrics with different loading durations is shown in Figure 19. The pressing time significantly influenced residual stress levels after fabric falling. Quantitative data showed: residual stress was approximately 24 MPa under 30 s pressing; increased to 27 MPa at 60 s; and significantly rose to 37 MPa at 90 s. Comparison revealed that stress increase from 30 to 60 s was only 3 MPa, while increase from 60 to 90 s reached 10 MPa, exhibiting obvious nonlinear accelerated growth characteristics.
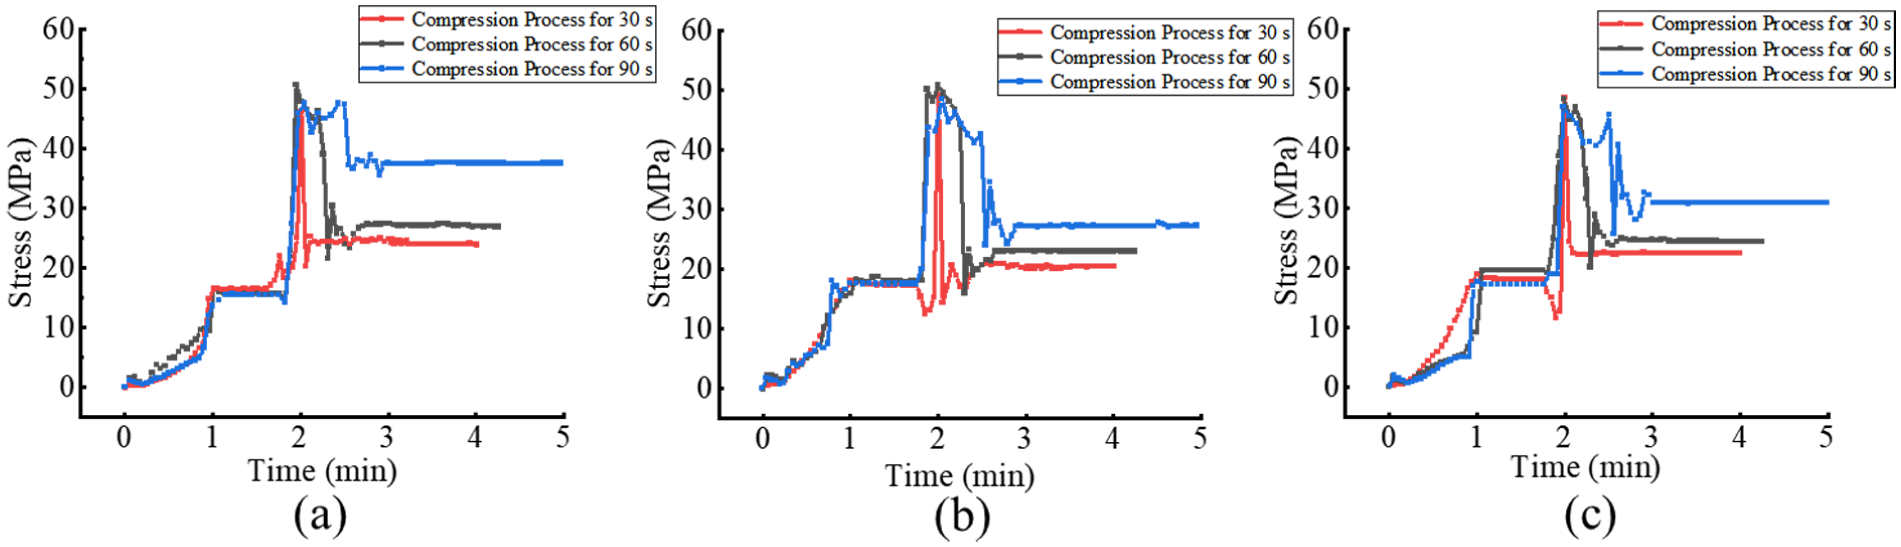
Stress comparison for fabrics with different loading durations: (a) cotton fabric; (b) polyester fabric; (c) linen fabric.
This phenomenon indicated significant time accumulation effects in textile materials under long-term sustained loading conditions. During initial loading stages, fabrics primarily absorbed external forces through relative sliding between yarns, mainly through reversible elastic deformation. As loading time extended, friction resistance and contact compressive stress between yarns gradually increased, yarn local tensile degree strengthened, ultimately leading to rapid residual stress increases.
Polyester and linen fabrics showed similar trends but with different stress increase magnitudes: polyester fabric showed the smallest increase, linen fabric was intermediate, and cotton fabric was most significant. This closely related to differences in yarn breaking strength and elastic modulus among the three materials. From a material viscoelastic perspective, fabrics exhibited creep effects under long-term loading. Although gradual recovery occurred after external force removal, due to viscous damping effects, some internal stresses could not be completely released, forming stable residual stress distributions.
Conclusions
Based on systematic analysis of finite-element numerical simulation research on smart textile shape retention in this study, the following conclusions can be drawn.
The proposed finite-element model achieves high accuracy and reliability in simulating fabric deformation, with strong numerical–experimental consistency (Pearson coefficients: 0.967 for cotton, 0.978 for polyester, and 0.969 for linen). It effectively reproduces time-dependent stress distributions under compression. Stress concentrates in crease zones and decays outward.
Fiber materials differ significantly in stress behavior: cotton has the highest residual stress, and polyester the lowest. Residual stress increases nonlinearly with compression time, showing obvious time-dependent creep. This method enables quantitative internal stress analysis and provides a theoretical basis for textile design and performance prediction.
Due to the complex fiber distribution within the yarn, the yarn material is considered as an isotropic solid module to simplify the construction of the yarn model in the fabric. This study validates a high-precision finite-element modeling approach for fabric shape retention. Future work will focus on finite-element analysis at the fiber scale for twill and satin woven fabrics, particularly investigating the shape retention of the fabrics.
Footnotes
Declaration of conflicting interests
The authors declared no potential conflicts of interest with respect to the research, authorship, and/or publication of this article.
Funding
The authors disclosed receipt of the following financial support for the research, authorship, and/or publication of this article: This research work is supported by the Textile Vision Basic Research Program (grant number J202109) and the National Natural Science Foundation of China (grant numbers 61802152 and 61976105).