






Abstract
Over half of the white school-aged population attends private schools in New York City, compared to less than 9% of Black and 7% of Hispanic students. We explore how between- and within-sector enrollment differences influence overall NYC school segregation. We find that nearly one-quarter of NYC's school segregation is attributable to segregation between the public and private sectors, 60% is due to within-public-sector segregation, and the remaining 16% is explained by within-private-sector segregation. While New York City is in some ways a unique case, these patterns likely extend to other major cities experiencing neighborhood gentrification and demographic change.
Roughly 4.7 million K–12 students attend private schools in the United States, representing almost 9% of total enrollments (National Center for Education Statistics, 2023). Stark demographic differences distinguish the public and private school sectors, with white students over-represented among those attending private schools, and Black and Hispanic students under-represented (Irwin et al., 2022; National Center for Education Statistics, 2024). Our focus in this paper is the potentially segregating influence of private schools within already stratified educational contexts. We explore the issue within New York City, which hosts not only the Nation's largest public school district, but also its most complex private school sector, with over 200,000 students attending one of almost 800 private schools (NYC Independent Budget Office, 2025; ProPublica, 2025). Of central importance is the striking racial/ethnic imbalance between New York City's public and private schools. Over half of New York's white school-aged population attends private schools, compared to less than 9% of Black students and 7% of Hispanic students (Domanico, 2020). Put another way, one-third of private school students are non-white, yet the City's public schools are almost 84% non-white.
In the sections below, we begin with a discussion of national trends in private school enrollments, highlighting empirical findings regarding the role of the private sector in overall school segregation. We then describe the New York City private school landscape and the considerable demographic heterogeneity that exists among schools within the private sector. After describing our data and methods, we contrast the racial/ethnic compositions of NYC public and private schools and compare compositional differences among types of private schools. Our primary analyses then leverage large-scale quantitative data—including the Private School Survey (PSS), New York State Education Department (NYSED) private school enrollment data, and the Common Core of Data (CCD)—to examine the role private schools play in New York City's school segregation. We estimate the degree of segregation in the public and private sectors and examine how these between- and within-sector differences influence overall NYC school segregation. We also explore trends in these relationships over the past several decades, a particularly important task given the City's demographic shifts. We close with a discussion of potential policy alternatives and directions for future research.
Background
We can conceptualize demographic differences across school sectors using two distinct metrics: enrollment composition and within-group enrollment rates. The first approach, which contrasts private and public school demographics, indicates that national private school enrollments are disproportionately white compared to public school enrollments (65% vs. 45%), while private schools serve smaller proportions of Black and Hispanic students compared to those in the public sector (9% vs. 15%, and 12% vs. 28%, respectively; National Center for Education Statistics, 2024). Representation across sectors is relatively balanced for Asian, multiracial, and Native American/Alaskan Native student populations. The second metric calculates the percentage of students within racial/ethnic groups that attend private schools. Here, 11% of white students attend a private school, compared to 5% of Black students, and 3% of Hispanic students (Murnane & Reardon, 2018).
Central to our focus on historic patterns of segregation is the extent to which these cross-sector enrollment differences have changed over time. Again, it is important to consider both enrollment composition and enrollment rates. Reflecting broader demographic shifts, three out of four private school students in the United States were white in 1996 compared to two in three by 2016. While the proportion of Black students in private schools was stable during this period, the proportion of Hispanic private school students grew by almost 25% (Ee et al., 2018). Although a meaningful increase, the Hispanic public-school population grew by 80% during the same period. This highlights the importance of examining within-group enrollment rates, particularly in the presence of overall racial/ethnic change. Indeed, over the last several decades, the private school enrollment rate among Hispanic students actually declined from 13% to 3% (Murnane & Reardon, 2018). In other words, although private school students are more likely to be Hispanic, Hispanic students are increasingly less likely to attend a private school. The private school enrollment rate for white students has declined somewhat, from 16 to 11%, while the proportion of Black students attending private schools increased slightly, from 3% to 5% (Murnane & Reardon, 2018).
Theoretical Framework
These enrollment differences across sectors flow from a complicated mix of historic and contemporary forces. The most basic explanation is the costs associated with private school attendance and racial/ethnic disparities in household income. Average tuitions in Catholic schools and non-Catholic religious schools are roughly $10,000, and almost $20,000 in non-religious private schools (U.S. Department of Education, 2023). Annual tuitions among the more-selective private schools associated with the National Association of Independent Schools (NAIS) are now over $30,000 per year (Hanson, 2024). Based on 2024 income estimates (Kollar & Scherer, 2025), Catholic school tuition for one student represents roughly 11% of pre-tax earnings for the average white household, but almost 18% for the average Black household, and 15% for the typical Hispanic household. This suggests that the economic burden of attending a private school is not equally distributed across families by racial/ethnic background.
However, the ability to obtain a market good does not fully explain why privileged families would necessarily do so. One explanatory framework argues that disparities in economic resources can allow dominant groups to engage in “opportunity hoarding”—the mechanisms through which privileged groups maintain access to valuable and limited resources (Tilly, 1998). Private schools represent a way for families to potentially ease the transmission of their own status to subsequent generations. Two factors facilitate the process. First, there is a perceived scarcity of high-quality educational options—a condition present in New York City, where middle-class families view only a handful of the City's schools as viable (Sattin-Bajaj & Roda, 2020). Second, the policy structures in place enable disproportionate access for privileged groups by way of time-consuming admissions requirements and priority systems based on residence—again, conditions that characterize the NYC context (Posey-Maddox et al., 2025; Sattin-Bajaj & Roda, 2020; Shmoys et al., 2026).
Beyond issues of power and status, another key point is that most private schools are religious (National Center for Education Statistics, 2023). While families may select private religious schools for secular reasons (e.g., they represent another venue for opportunity hoarding), many families seek contexts that preserve and promote religious cultures and traditions (Cohen-Zada, 2006; Cohen-Zada & Sander, 2008). Though religious transmission may seem disconnected from stratification processes, such enrollment decisions can nevertheless contribute to segregation. To the extent that religious and racial/ethnic identities overlap, religious schools may have segregative effects.
Within- and Cross-Sector Segregation
While sector differences in student demographics are clear, their influence on segregation within and across sectors is more nuanced. Even though private schools enroll far higher proportions of white students, lower levels of segregation within the private sector could counterbalance its influence on overall school segregation (Coleman et al., 1982a). The degree of segregation within the public and private sectors, however, has changed considerably over the past several decades. Early national studies reported lower levels of private compared to public school segregation (Coleman et al., 1982a, 1982b; Taeuber & James, 1982). More recent analyses leveraging data from the 1990s and early 2000s suggest that private school segregation was more pronounced compared to that found among public schools (Reardon & Yun, 2002; Saporito & Sohoni, 2006; Sohoni & Saporito, 2009; Yun & Reardon, 2005). This increase in private sector segregation was driven in part by a decline in Catholic school enrollments (Ospino & Weitzel-O’Neill, 2016), which were generally more diverse (Irwin et al., 2022), and the departure of many Catholic working- and middle-class families of color for suburban communities and schools (Koeth, 2025).
One force with unclear implications for segregation is neighborhood gentrification, the inflow of higher socioeconomic status residents and increased capital investment into previously disinvested areas, often accompanied by increases in the proportion of white residents and corresponding decreases in the proportion of Black and Latino residents (Brown-Saracino, 2017; Mordechay & Ayscue, 2024; Pearman, 2020; Sutton, 2020; Zuk et al., 2018). In cities with at least one million residents, nearly one-quarter of schools were in neighborhoods that gentrified between 2000 and 2014. New York City is an extreme case, with roughly 40% of all neighborhoods gentrifying by 2014 (Pearman, 2020). In these gentrifying NYC neighborhoods, the proportion of white school-aged children increased from 11% to 29% between 2000 and 2016, while the proportion of Black or Latino school-aged children decreased from 86% to 62% (Mordechay & Ayscue, 2024). However, shifting neighborhood demographics do not always translate to shifts in school demographics (Billingham, 2015; Green et al., 2022). While case studies of several NYC public schools document a substantial influx of white students (Roda, 2023), in aggregate NYC neighborhoods experiencing the highest degree of gentrification exhibited only modest decreases in segregation within public schools (Mordechay & Ayscue, 2020, 2024). The discrepancy largely reflects middle- and high-SES white families’ propensity to leverage both public school choice and private schools to avoid what they perceive as academically inferior and lower-status schools (Kimelberg & Billingham, 2012; Mann & Rogers, 2025; Pearman & Swain, 2017). Given both the high degree of gentrification in New York City and the tendency for gentrifying families—particularly white gentrifying families (Pearman & Swain, 2017)—to opt out of neighborhood public schools, one might expect substantial changes in New York City's private school segregation, rendering prior work outdated.
The NYC Private School Landscape
In the sections below, we describe three broad categories of NYC private schools, each of which has the potential to differentially influence within- and between-sector segregation. One unique facet of the NYC private school mosaic is the large number of private Jewish schools, which grew their enrollments by over 46% between 2001 and 2019, from under 80,000 to almost 120,000 students (Domanico, 2020). Jewish schools are now the largest segment of the private school sector, enrolling over 40% of all private school students in NYC. This growth has been driven largely by increasing numbers of orthodox Jewish students attending Brooklyn-based yeshivas—traditional Jewish schools focused on religious study. Overall, almost 90% of Jewish 5–17-year-olds living in Brooklyn attend private Jewish schools, and over 95% do so in particular Brooklyn neighborhoods, such as Williamsburg and Borough Park. Conversely, only 30% of Jewish students living in Manhattan—where a smaller proportion of Jewish families are Orthodox—attend Jewish schools, with 45% in non-Jewish private schools, and 25% in public schools (Beck et al., 2012). Private Jewish schools have a particularly unique effect on NYC school segregation, given that virtually all their students are white (Domanico, 2020).
Catholic schools represent the next largest group of NYC private schools, serving roughly 30% of private school students. Following national trends, NYC Catholic school enrollments have dropped dramatically over the past several decades, falling by almost half between 2001 and 2019, from roughly 150,000 to under 80,000 students (Domanico, 2020). This trend will continue into the foreseeable future, as the Archdiocese closed 12 schools in 2023 (Archdiocese of New York, 2023). These declining enrollments have important implications for segregation both within and between sectors, as Catholic schools are the most racially/ethnically diverse NYC private schools, having no racial/ethnic majority, with enrollments that are one-third Hispanic and roughly one-third Black (Domanico, 2020). There is also tremendous diversity in Catholic school missions and student clientele. By design, some serve low-income students of color and have annual tuitions as low as $8,000. Others, however, aim to enroll more affluent students whose families can afford tuitions over 5 times that high (Archdiocese of New York, 2024).
The third largest group of private schools includes those associated with the National Association of Independent Schools (NAIS). These elite schools are typically the most selective, with lower admissions rates and K–12 tuitions that now top $65,000 per year (Hudson, 2025). Whereas NYC public school enrollments are roughly 15% white (New York City Public Schools, n.d.), many NAIS enrollments in the City are over 50% white (ProPublica, 2025). Several of these schools trace their histories back to the 19th and even 18th centuries, with their campuses disproportionately located in Manhattan (Niche, n.d.).
Understanding the stratifying role of private schools is important. If private schools do in fact provide more economic and social opportunities for their students (Lee et al., 1998; Neal, 1997), then they represent a key link in the chain of multi-generational social reproduction (Murnane & Reardon, 2018). This phenomenon is particularly salient in urban intensive spaces—densely populated areas home to one million or more people (Milner, 2012)—many of which are experiencing declining residential segregation but persistent public-school segregation (Billingham, 2015; Elbers, 2024). Private school enrollment may help explain this disconnect, functioning as a mechanism through which families with sufficient resources exit the public school system and, in doing so, reinforce the stratification that residential trends alone would predict as diminishing. Our current paper examines the degree to which private schools exacerbate or moderate New York City's already stratified educational landscape. More specifically, our analyses address the following questions:
To what extent do racial/ethnic compositions differ between the NYC public and private sectors, and between different types of private schools? How do the levels of segregation within the public and private sectors compare? What influence do these between- and within-sector differences have on overall NYC school segregation? How have these relationships changed over the past several decades, given the City's demographic shifts?
Data and Methods
We focus on segregation at school entry and employ school-level indicators of kindergarten racial/ethnic composition. Roughly 19% of all NYC kindergarteners attend private schools (U.S. Census, 2020). We select kindergarten because the demographic shifts that we detail above are first apparent in younger age groups (Frey, 2025). Nationally, primary (ages 5–11) school-aged children are slightly more likely to be Hispanic, Asian, or multiracial, while secondary (ages 12–18) school-aged children are slightly more likely to be white or Black. However, these differences are all within a few percentage points across age bands (Annie E. Casey Foundation, 2025). Focusing on kindergarten, therefore, captures emerging demographic patterns while remaining representative of broader school-age trends.
Data
We include all NYC public and private schools that offered kindergarten instruction in any year from 1997 to 1998 through 2019 to 1020. The total school sample sizes reported here are thus larger than those captured in any single academic year. Our analyses leverage data from three sources. The Common Core of Data (CCD), organized by the National Center for Education Statistics (NCES), provides grade-level information about public school (n = 1,811 schools) racial/ethnic enrollments beginning in 1998. Because the CCD includes only school-level information for 1997, for that year, we calculate kindergarten racial/ethnic composition assuming that it is proportional to that of the school. For data on NYC private schools, we draw from NCES’ Private School Survey (PSS) for 1997 through 2011 (n = 1,246 schools) and data from the New York State Education Department (NYSED) for 2013 through 2019 (n = 726 schools). We use NYSED data for the more recent years as NYSED provides annual data, while PSS is biannual. However, NYSED published private school demographics starting in only 2013, whereas PSS spans earlier years. Both NYSED and PSS provide only school-level demographics and grade-level enrollment, so we again use the same proportionality assumption for private school kindergarten demographics.
As population demographics have shifted and the social construction of race/ethnicity has evolved, the racial/ethnic categories on which schools are asked to report has shifted as well. We examine demographic trends over time and thus aim to use categories that remain as stable as possible. We use the following six racial/ethnic categories: Asian, Black, Hispanic, multiracial, Native American, and white. We do not include a Native Hawaiian/Pacific Islander category but rather group these students with Asian students, given that private schools were consistently asked to report on Native Hawaiian/Pacific Islander enrollments starting in 2009, while public school reporting began in 2016. The Native Hawaiian/Pacific Islander category was listed in 2011 and 2013–2015 for public schools as well, although no NYC public schools reported on this category in 2013–2015. However, given the substantial growth in NYC's multiracial population (NYC Planning, n.d.), we include multiracial as its own category even though private and public schools began reporting on it only in 2009 and 2011, respectively.
We use two methods of imputation to address missing data. For public schools in 2016 through 2019, there is substantial missingness of enrollment data for specific racial/ethnic groups. For these years, CCD is missing over half the Native American kindergarten enrollment counts, almost one-third of Asian kindergarten enrollment counts, approximately one-fifth of white kindergarten enrollment counts, and nearly half of multiracial kindergarten enrollment counts. For these schools, we estimate kindergarten demographics from whole-school demographics and total kindergarten enrollment. Even with this approach, substantial missingness remains for 2016. For this year, we compute means using the bookend years (2015 and 2017). Some schools are also completely missing demographic data for certain years. Roughly 3% of public schools and 12% of private schools are missing between bookend years; for example, a school might be listed in the data in 2013 and 2015 but not in 2014. Here, we again use the average of the neighboring years to impute the missing information, in this case for all racial/ethnic groups. Our final sample is missing less than 1% of kindergarten demographics at the school level.
To understand the role private schools play in overall NYC school segregation, we conduct analyses using a combined public/private sample, as well as separate public and private school samples. We divide private schools into four types: schools associated with the National Association of Independent Schools (NAIS), Catholic schools, Jewish schools, and other private schools. There is some overlap between NAIS schools and a small subset of elite NYC Jewish and Catholic schools. Specifically, in our contemporary sample, six Jewish schools and eight Catholic schools were also NAIS members. In our analyses, we group these schools with the NAIS schools, given that the socioeconomic backgrounds of the families they serve typically differ from their non-NAIS Jewish and Catholic school counterparts.
Methods
We use Theil's H (Reardon et al., 2000; Reardon & Yun, 2001; Theil, 1972) to measure segregation. Like the Dissimilarity Index and the Gini Coefficient, H measures evenness rather than exposure. That is, H reflects the extent to which racial/ethnic groups are spread equally among schools, rather than the extent to which students in one racial/ethnic group are in the same schools as students from different racial/ethnic groups. We use a measure of evenness rather than of exposure because measures of evenness are not dependent on the overall racial/ethnic composition of a given population (An & Gamoran, 2009; Reardon & Owens, 2014; Reardon & Yun, 2001). While we rely on H specifically, measures of evenness tend to be closely related, with correlations of approximately 0.9 (Reardon & Yun, 2001).
In this study, H indicates the extent to which racial/ethnic groups are evenly distributed across NYC kindergartens. A lower H indicates less segregation, with a minimum value of 0 reflecting no segregation, and a maximum value of 1 reflecting complete segregation (i.e., all schools are racially homogenous). Following Reardon and colleagues (2000), we first calculate an entropy score (E) (see Figure 1), which measures the total variation in racial/ethnic groups of NYC kindergarten students. The greater the number of racial/ethnic groups present and the more equally the population is divided among those groups, the greater the E. From E, we can then calculate our measure of segregation, H (Figure 2). One advantage of H as a measure of segregation is that it allows for the decomposition of overall segregation (see Figure 3). We can then separate segregation between units (e.g., between the public and private sectors) and within those units (separately among public schools and among private schools; Reardon et al., 2000).

Equation to calculate entropy (E).
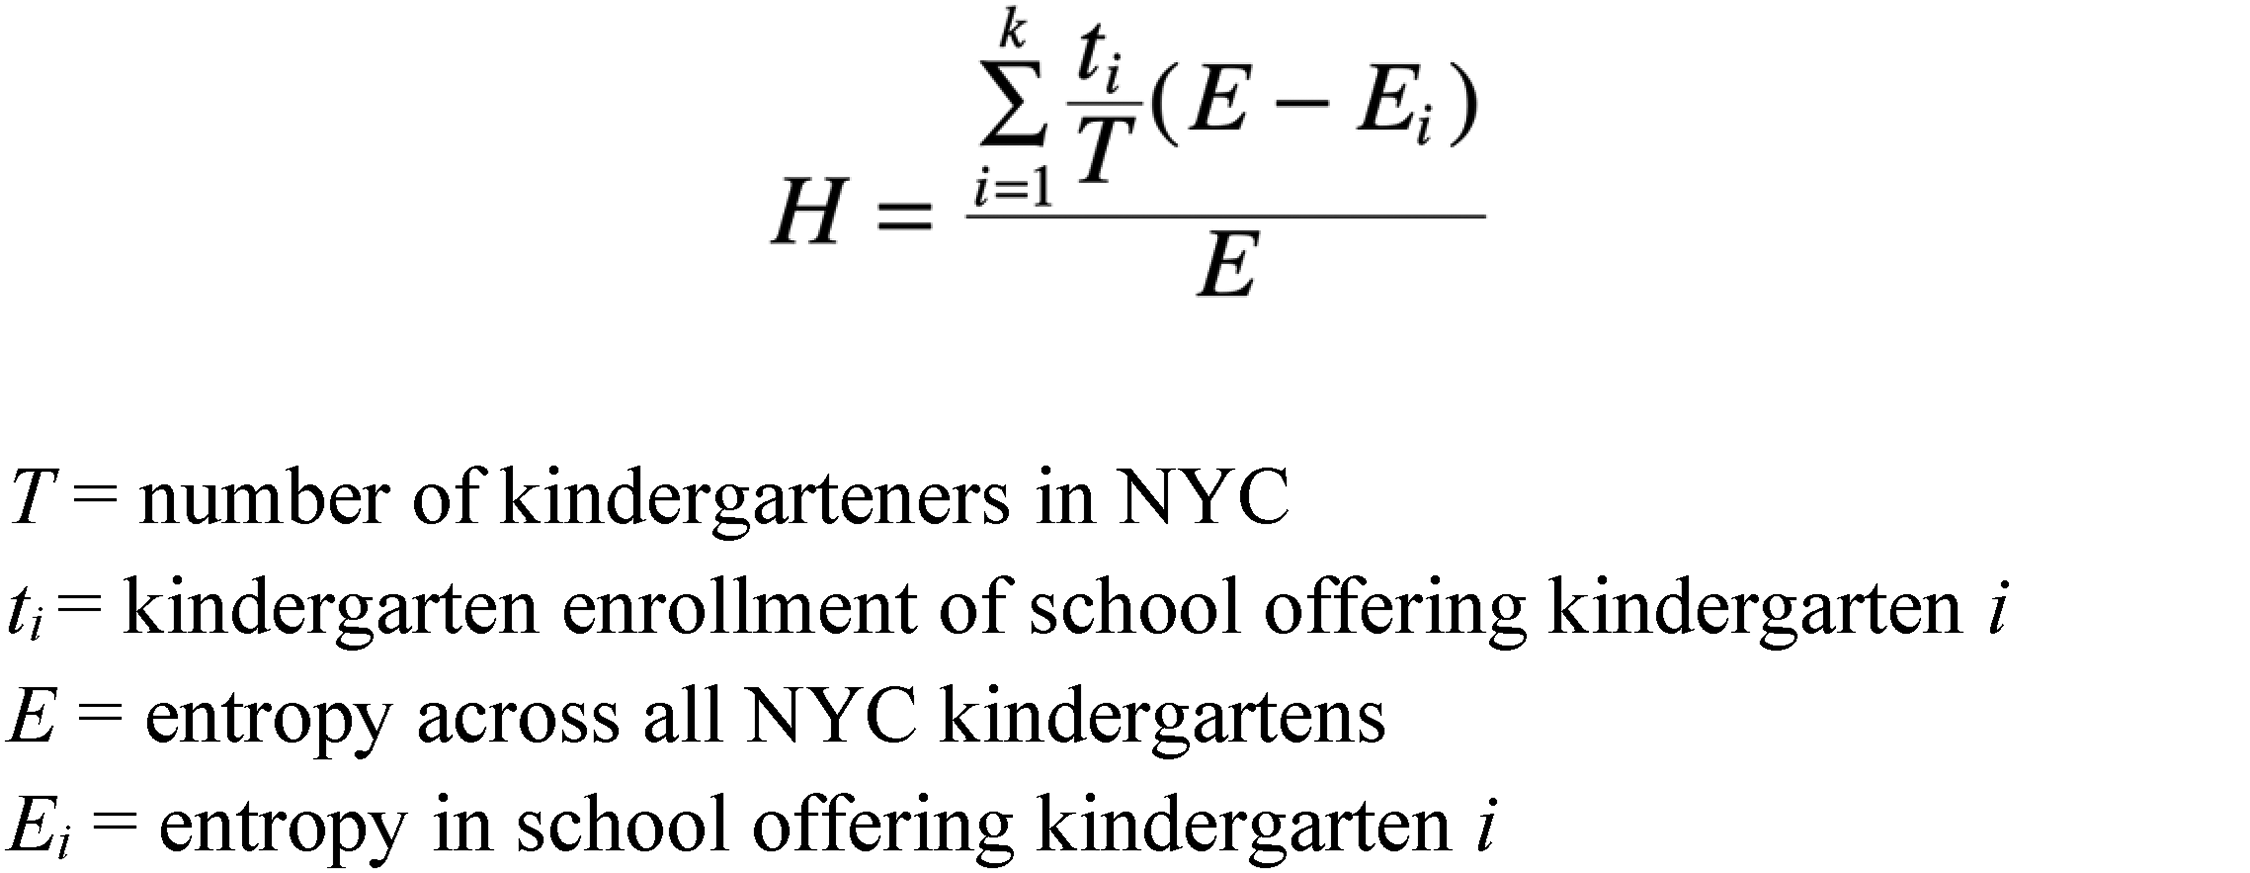
Equation to calculate segregation (H).
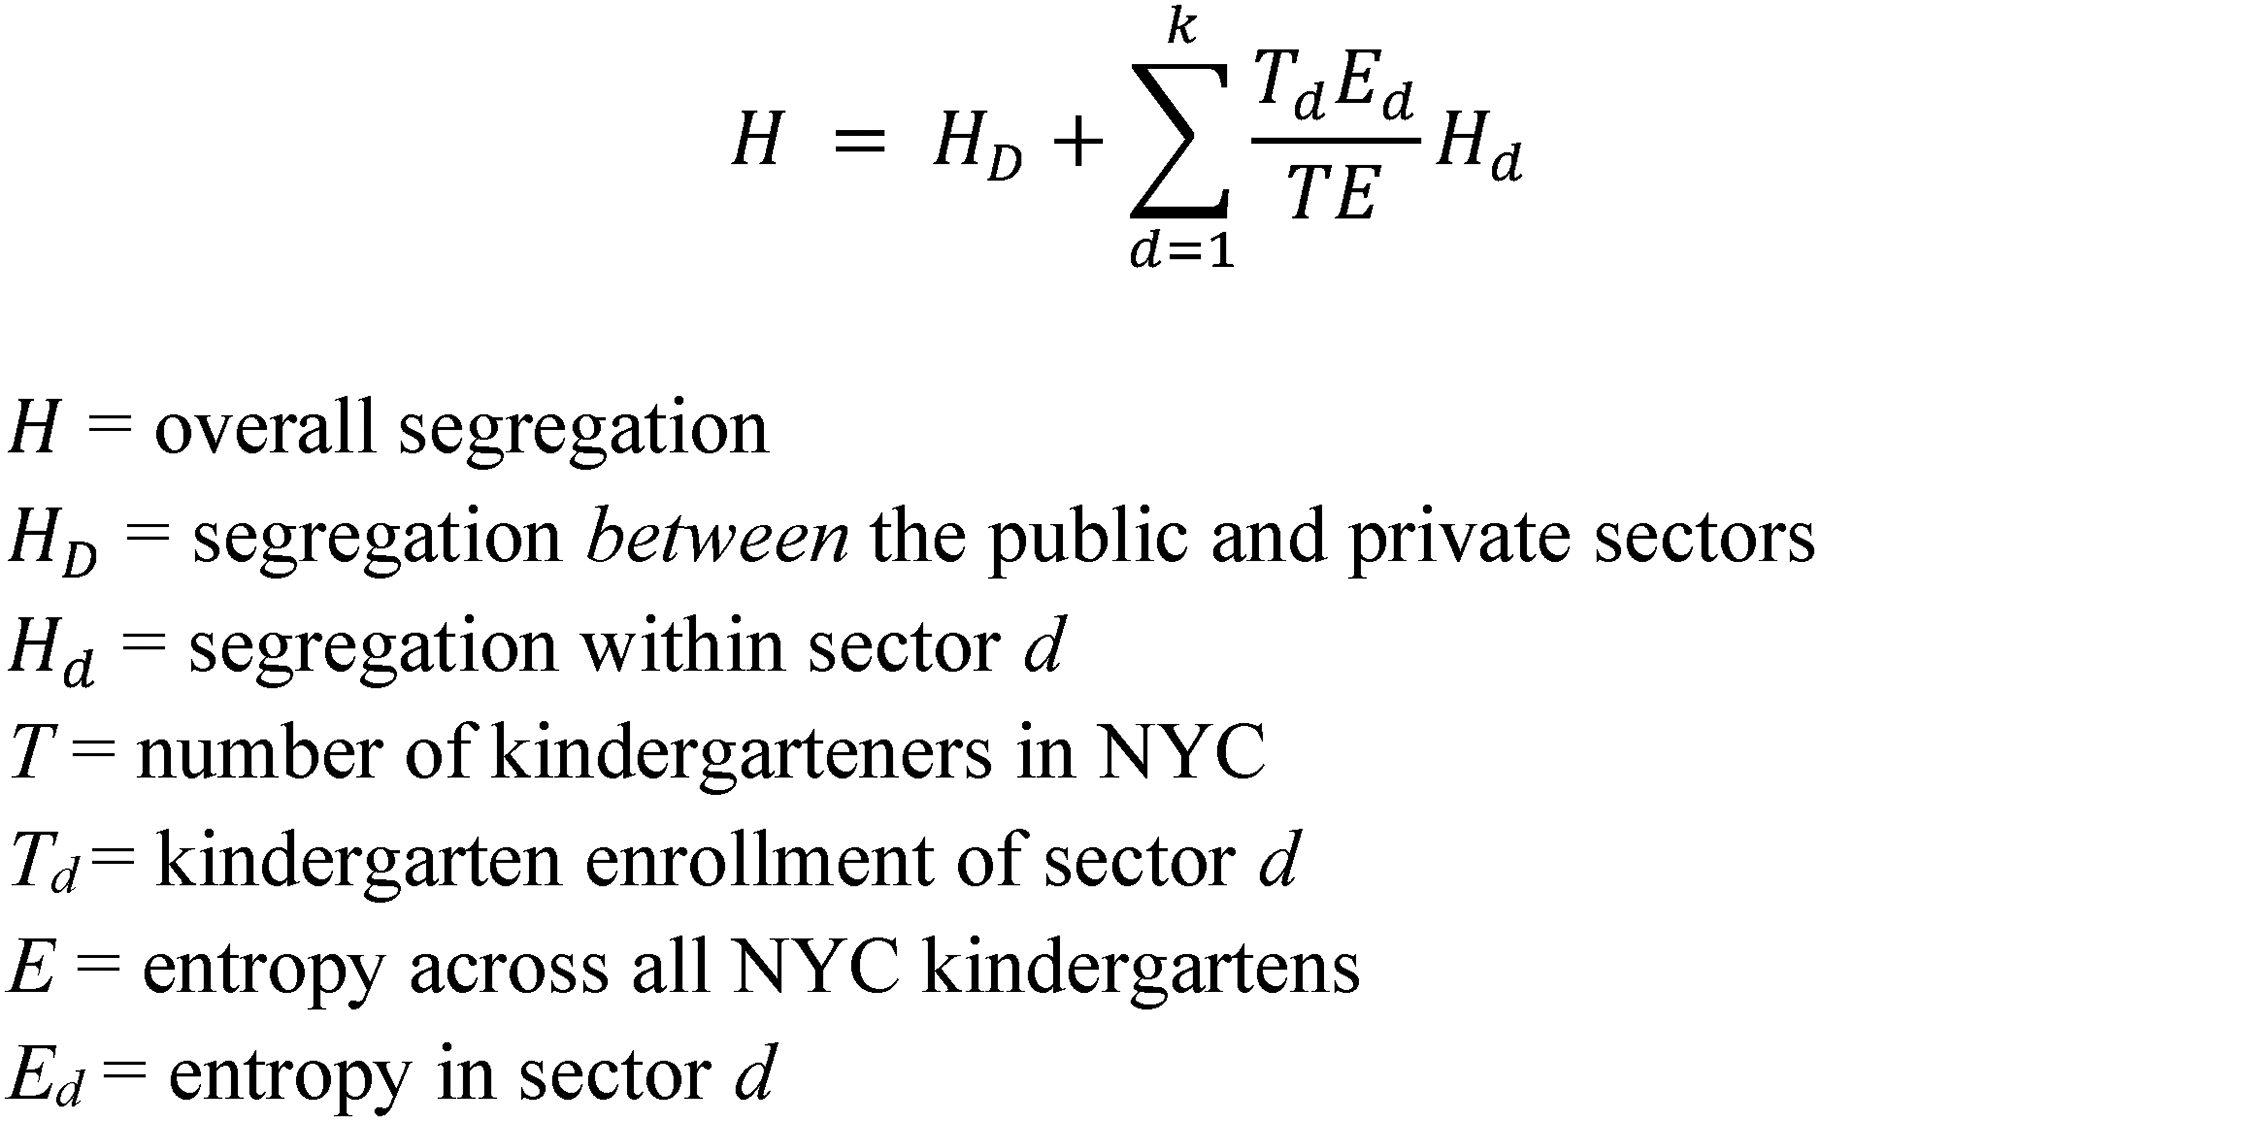
Equation to decompose H into between- versus within-sector segregation.
Researchers’ Positionality
The research team is embedded in the New York City context. One author has two school-aged children who have attended both public and private schools in the City. While we are a gender- and religion-diverse group, all three of us are white, drawn to this work in part because of our first-hand experience with the promise and challenge of integrated schooling. Two of the three of us taught in racially diverse public schools, while the other two of the three of us attended racially diverse public schools.
Results
Between-Sector Differences
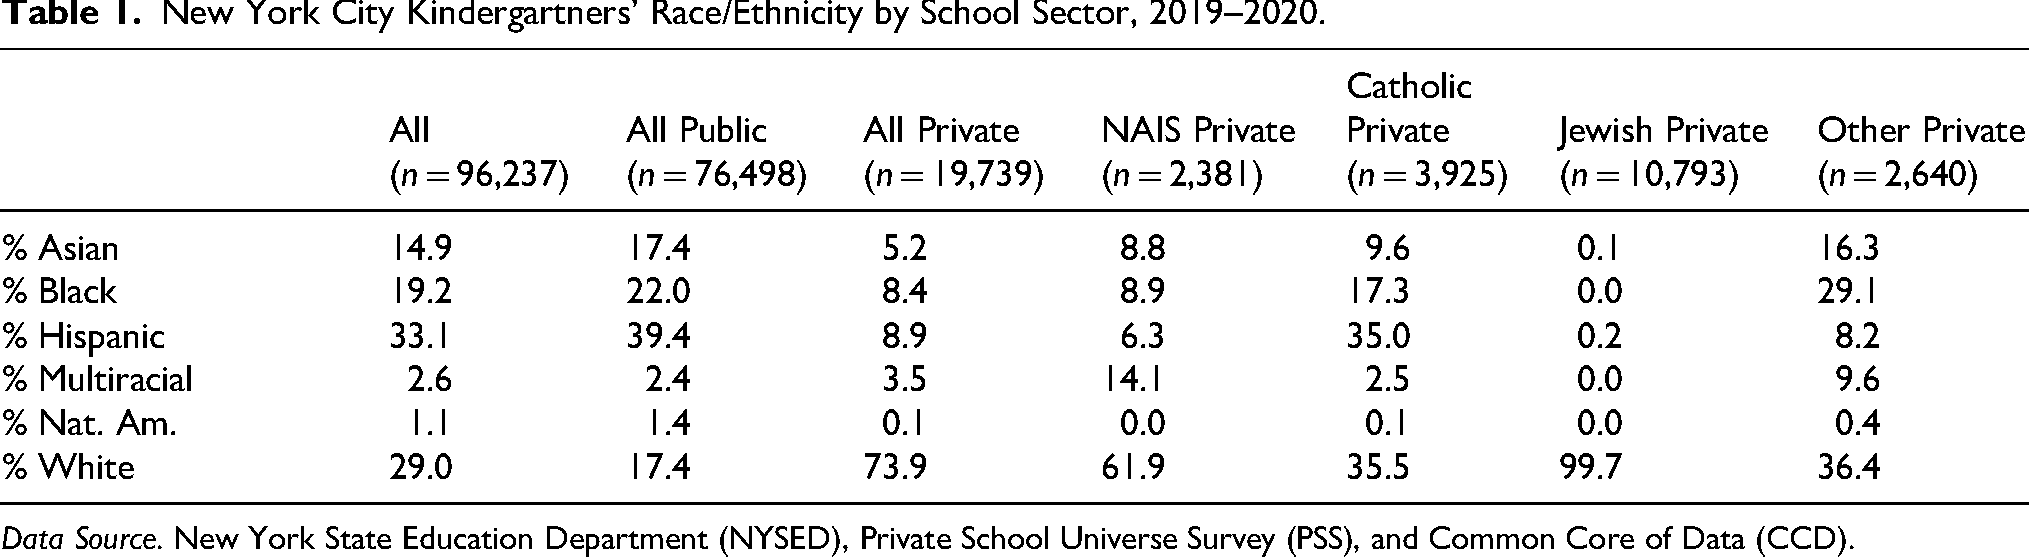
We begin by describing the racial/ethnic backgrounds of the over 96,000 kindergarteners attending NYC public and private schools in Fall 2019, the final academic year prior to the disruptions associated with the COVID-19 pandemic (see Table 1). The striking finding here is that of the almost 20,000 private school kindergarteners, nearly three-quarters were white, while white students represent only 17% of public-school kindergarteners. Conversely, Black and Asian children were roughly one-third as likely to be enrolled in private compared to public schools, and the proportion of Hispanic kindergarteners in private schools was only one-fifth of those in public schools. This disproportionality is perhaps not surprising, given NYC's dramatic racial/ethnic inequalities in both wealth and income. However, it is clear that to some extent, between-sector differences in enrollment are exacerbating overall segregation.
New York City Kindergartners’ Race/Ethnicity by School Sector, 2019–2020.
Data Source. New York State Education Department (NYSED), Private School Universe Survey (PSS), and Common Core of Data (CCD).
While these between-sector demographic differences are important, NYC private schools are a heterogeneous group, with disparate missions, histories, and, as we report here, student populations. We describe the racial/ethnic compositions across four types of NYC private schools. Kindergarten enrollments in NAIS schools, which are typically the most selective, are nearly two-thirds white. We find much greater diversity among Catholic schools, many of which serve lower-income families and generally have much more affordable tuitions. Note especially that Hispanic students represent over one-third of Catholic school enrollments. Evidence of the unique NYC context, a majority of all NYC private-school kindergarteners attend Jewish schools, which serve an almost exclusively white student clientele. The demographic composition of other private schools is similar to that found in Catholic schools, with no racial/ethnic majority, but higher proportions of white and Black students, and fewer Hispanic students.
Contemporary School Segregation
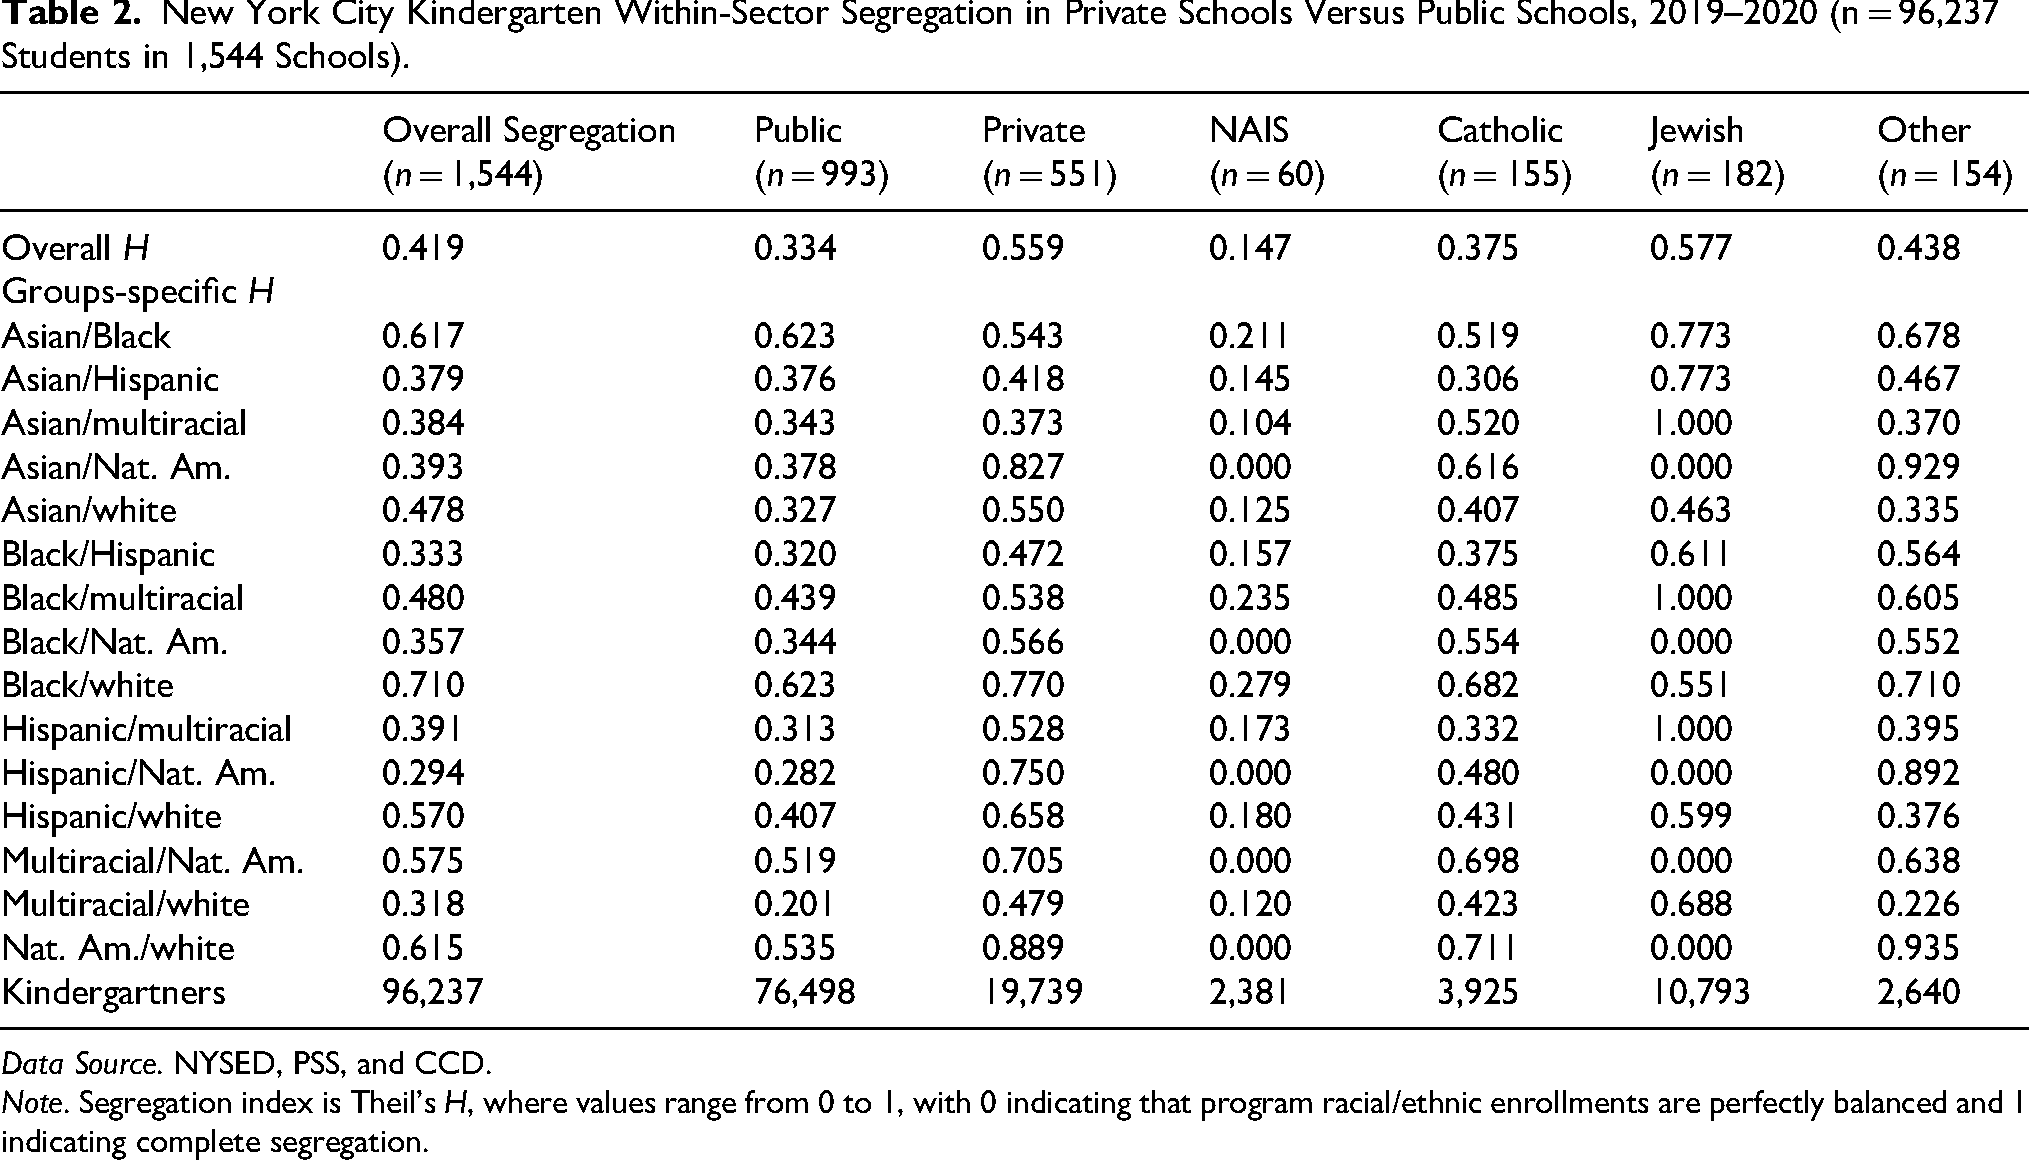
Overall segregation. Our primary analyses of private and public-school segregation begin with Table 2. Recall that with Theil's H, a value of 1 indicates complete segregation and a value of 0 indicates no segregation. The value of 0.419 at the top of the far-left column, which indicates the total extent of segregation across all public and private schools and between all racial/ethnic groups, suggests that the level of racial/ethnic school diversity is, on average, 42% below the level of overall kindergarten racial/ethnic diversity. We interpret this as a moderately high level of segregation. The remainder of the first column displays the degree of segregation between specific subgroups. Notable is the extreme Black/white segregation (0.710), indicating that Black/white school diversity is, on average, less than one-third of that found in the NYC kindergarten population as a whole. Black/Asian segregation is also quite high (0.617). Conversely, Hispanic segregation with all other racial/ethnic groups (except whites) is considerably lower.
New York City Kindergarten Within-Sector Segregation in Private Schools Versus Public Schools, 2019–2020 (n = 96,237 Students in 1,544 Schools).
Data Source. NYSED, PSS, and CCD.
Note. Segregation index is Theil's H, where values range from 0 to 1, with 0 indicating that program racial/ethnic enrollments are perfectly balanced and 1 indicating complete segregation.
Within- and between-sector segregation. The next two columns in Table 2 calculate segregation separately for public and private schools. We find that overall segregation among private schools (0.559) is considerably more severe compared to that found among public schools (0.334). These estimates support the more recent reports of increased segregation levels within the private compared to the public sector (e.g., Sohoni & Saporito 2009). Segregation among specific subgroups is also more pronounced among private school kindergarteners, particularly between Hispanic and white children in private (0.658) versus public schools (0.407), and between Asian and white children in private (0.550) versus public schools (0.327). The elevated level of public school compared to private school Black/Asian segregation is a notable departure from this trend.
In the final four columns of the table, we examine segregation within each private school type, finding substantial variation. Despite enrolling nearly exclusively white students (recall Table 1), the few students of color enrolled in the Jewish sector are concentrated in a small subset of its schools, driving up segregation (0.577). This pattern is even more extreme when considering specific subgroups: only one of the 182 Jewish private schools enrolls multiracial students, leading to complete segregation between multiracial students and all other students of color (1.000). While Catholic (0.375) and Other (0.438) private schools' segregation levels are closer to public-sector segregation levels, they too are more segregated. Interestingly, though, within the NAIS subset, segregation is notably lower (0.147). While NAIS schools over-enroll white students compared to public schools (again recall Table 1), within the NAIS subset, racial groups are much more evenly distributed across schools.
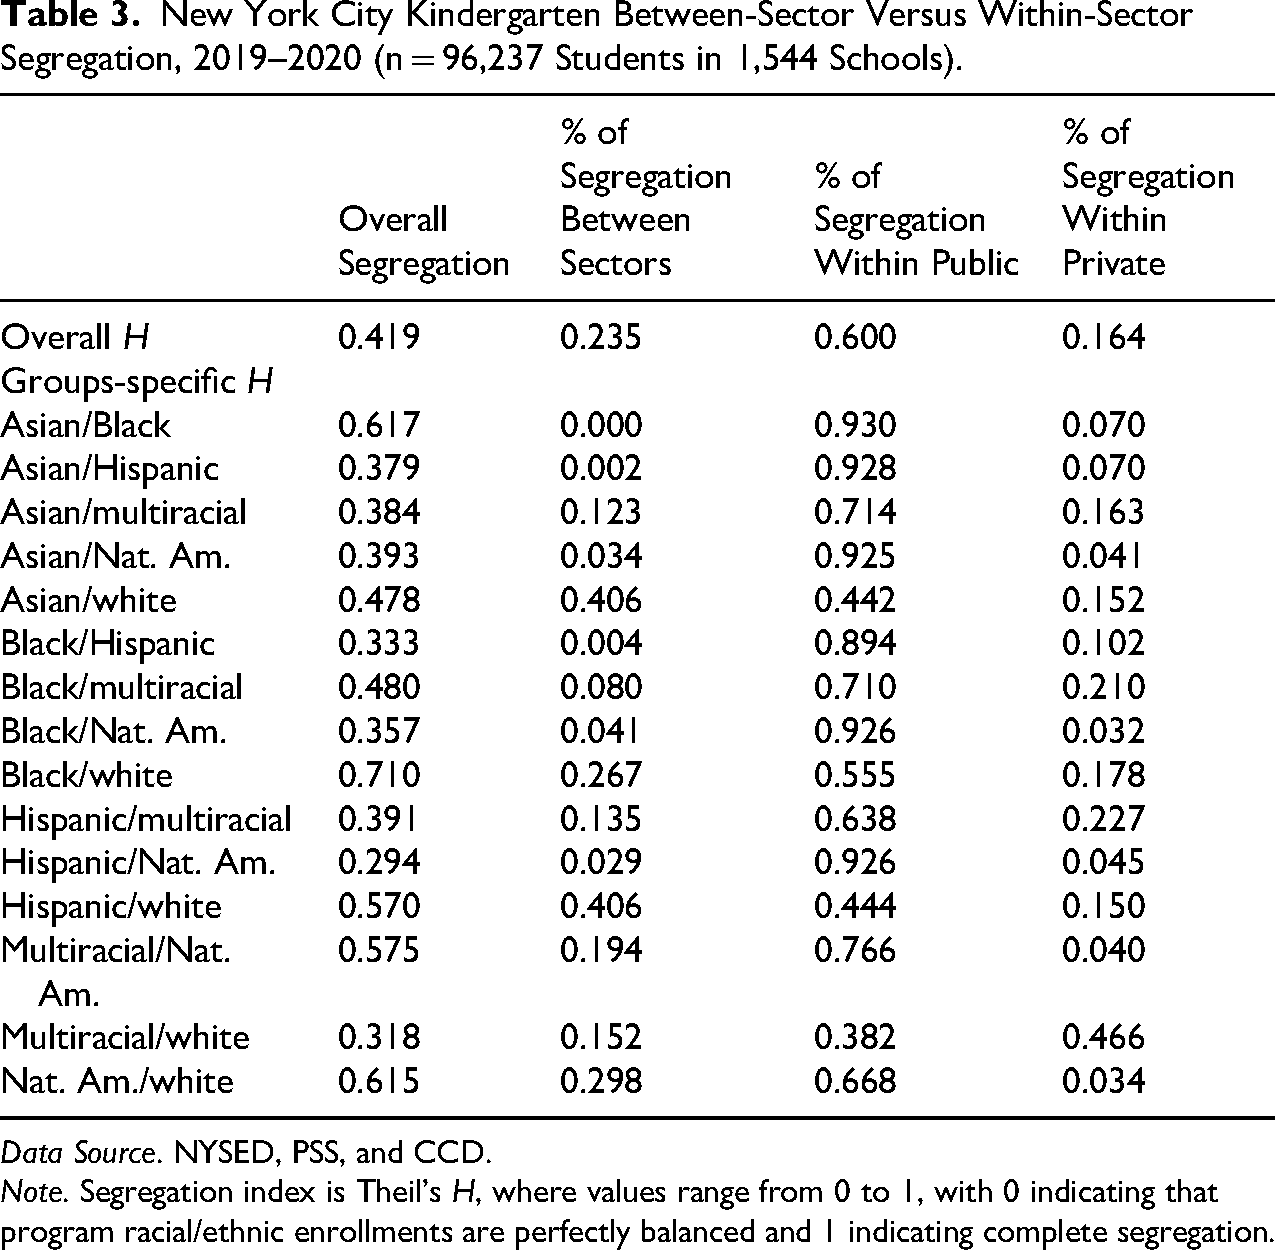
Our next set of analyses partitions segregation into the proportion within and between the public and private sectors. As indicated in Table 3, nearly one-quarter of overall segregation among NYC's kindergarteners is attributable to between-sector segregation, while 60% is due to within-public sector segregation and the remaining roughly 16% is attributable to within-private sector segregation. In other words, after eliminating all segregation from within the private and within the public sector, almost one-quarter of segregation would remain. Note that within-private sector segregation contributes relatively less than within-public sector segregation even though within-private sector segregation is higher (recall Table 2). The lower contribution from within the private sector reflects both the relatively smaller population enrolled in the private sector and the private sector's greater homogeneity.
New York City Kindergarten Between-Sector Versus Within-Sector Segregation, 2019–2020 (n = 96,237 Students in 1,544 Schools).
Data Source. NYSED, PSS, and CCD.
Note. Segregation index is Theil's H, where values range from 0 to 1, with 0 indicating that program racial/ethnic enrollments are perfectly balanced and 1 indicating complete segregation.
Importantly, the overall level of between-sector segregation is being driven largely by segregation between white kindergarteners and all other racial/ethnic groups. Just over 40% of overall Asian/white and Hispanic/white segregation, and over 25% of Black/white segregation, exists between public and private schools, while the remaining proportion lies within the public and private school sectors. Conversely, segregation between other groups is almost exclusively a within-sector phenomenon—school sector explains virtually none of the segregation between many other groups (e.g., between Asian and Black or Hispanic or Native American students). This makes perfect sense, given that the largest enrollment disparities between sectors is found among white kindergarten, who are vastly overrepresented among private school students (see Table 1). This within-sector segregation is disproportionately driven by within-public sector segregation across all but multiracial/white segregation. Again, this pattern largely reflects smaller enrollment and greater homogeneity within the private sector.
Role of geography in segregation. An important question is the extent to which this elevated between-sector segregation reflects underlying residential segregation. Given the extreme residential segregation in New York City (Operti et al., 2022), it is possible that private schools are disproportionately located in neighborhoods with predominantly white families, and these private schools are no more segregated than public schools in the same neighborhood. To investigate this possibility, we map all private schools onto a neighborhood-level New York City map (see Figure 4). We find that NAIS private schools are concentrated on Manhattan's Upper East Side, while Jewish private schools are concentrated in Brooklyn's Borough Park (both outlined in red).
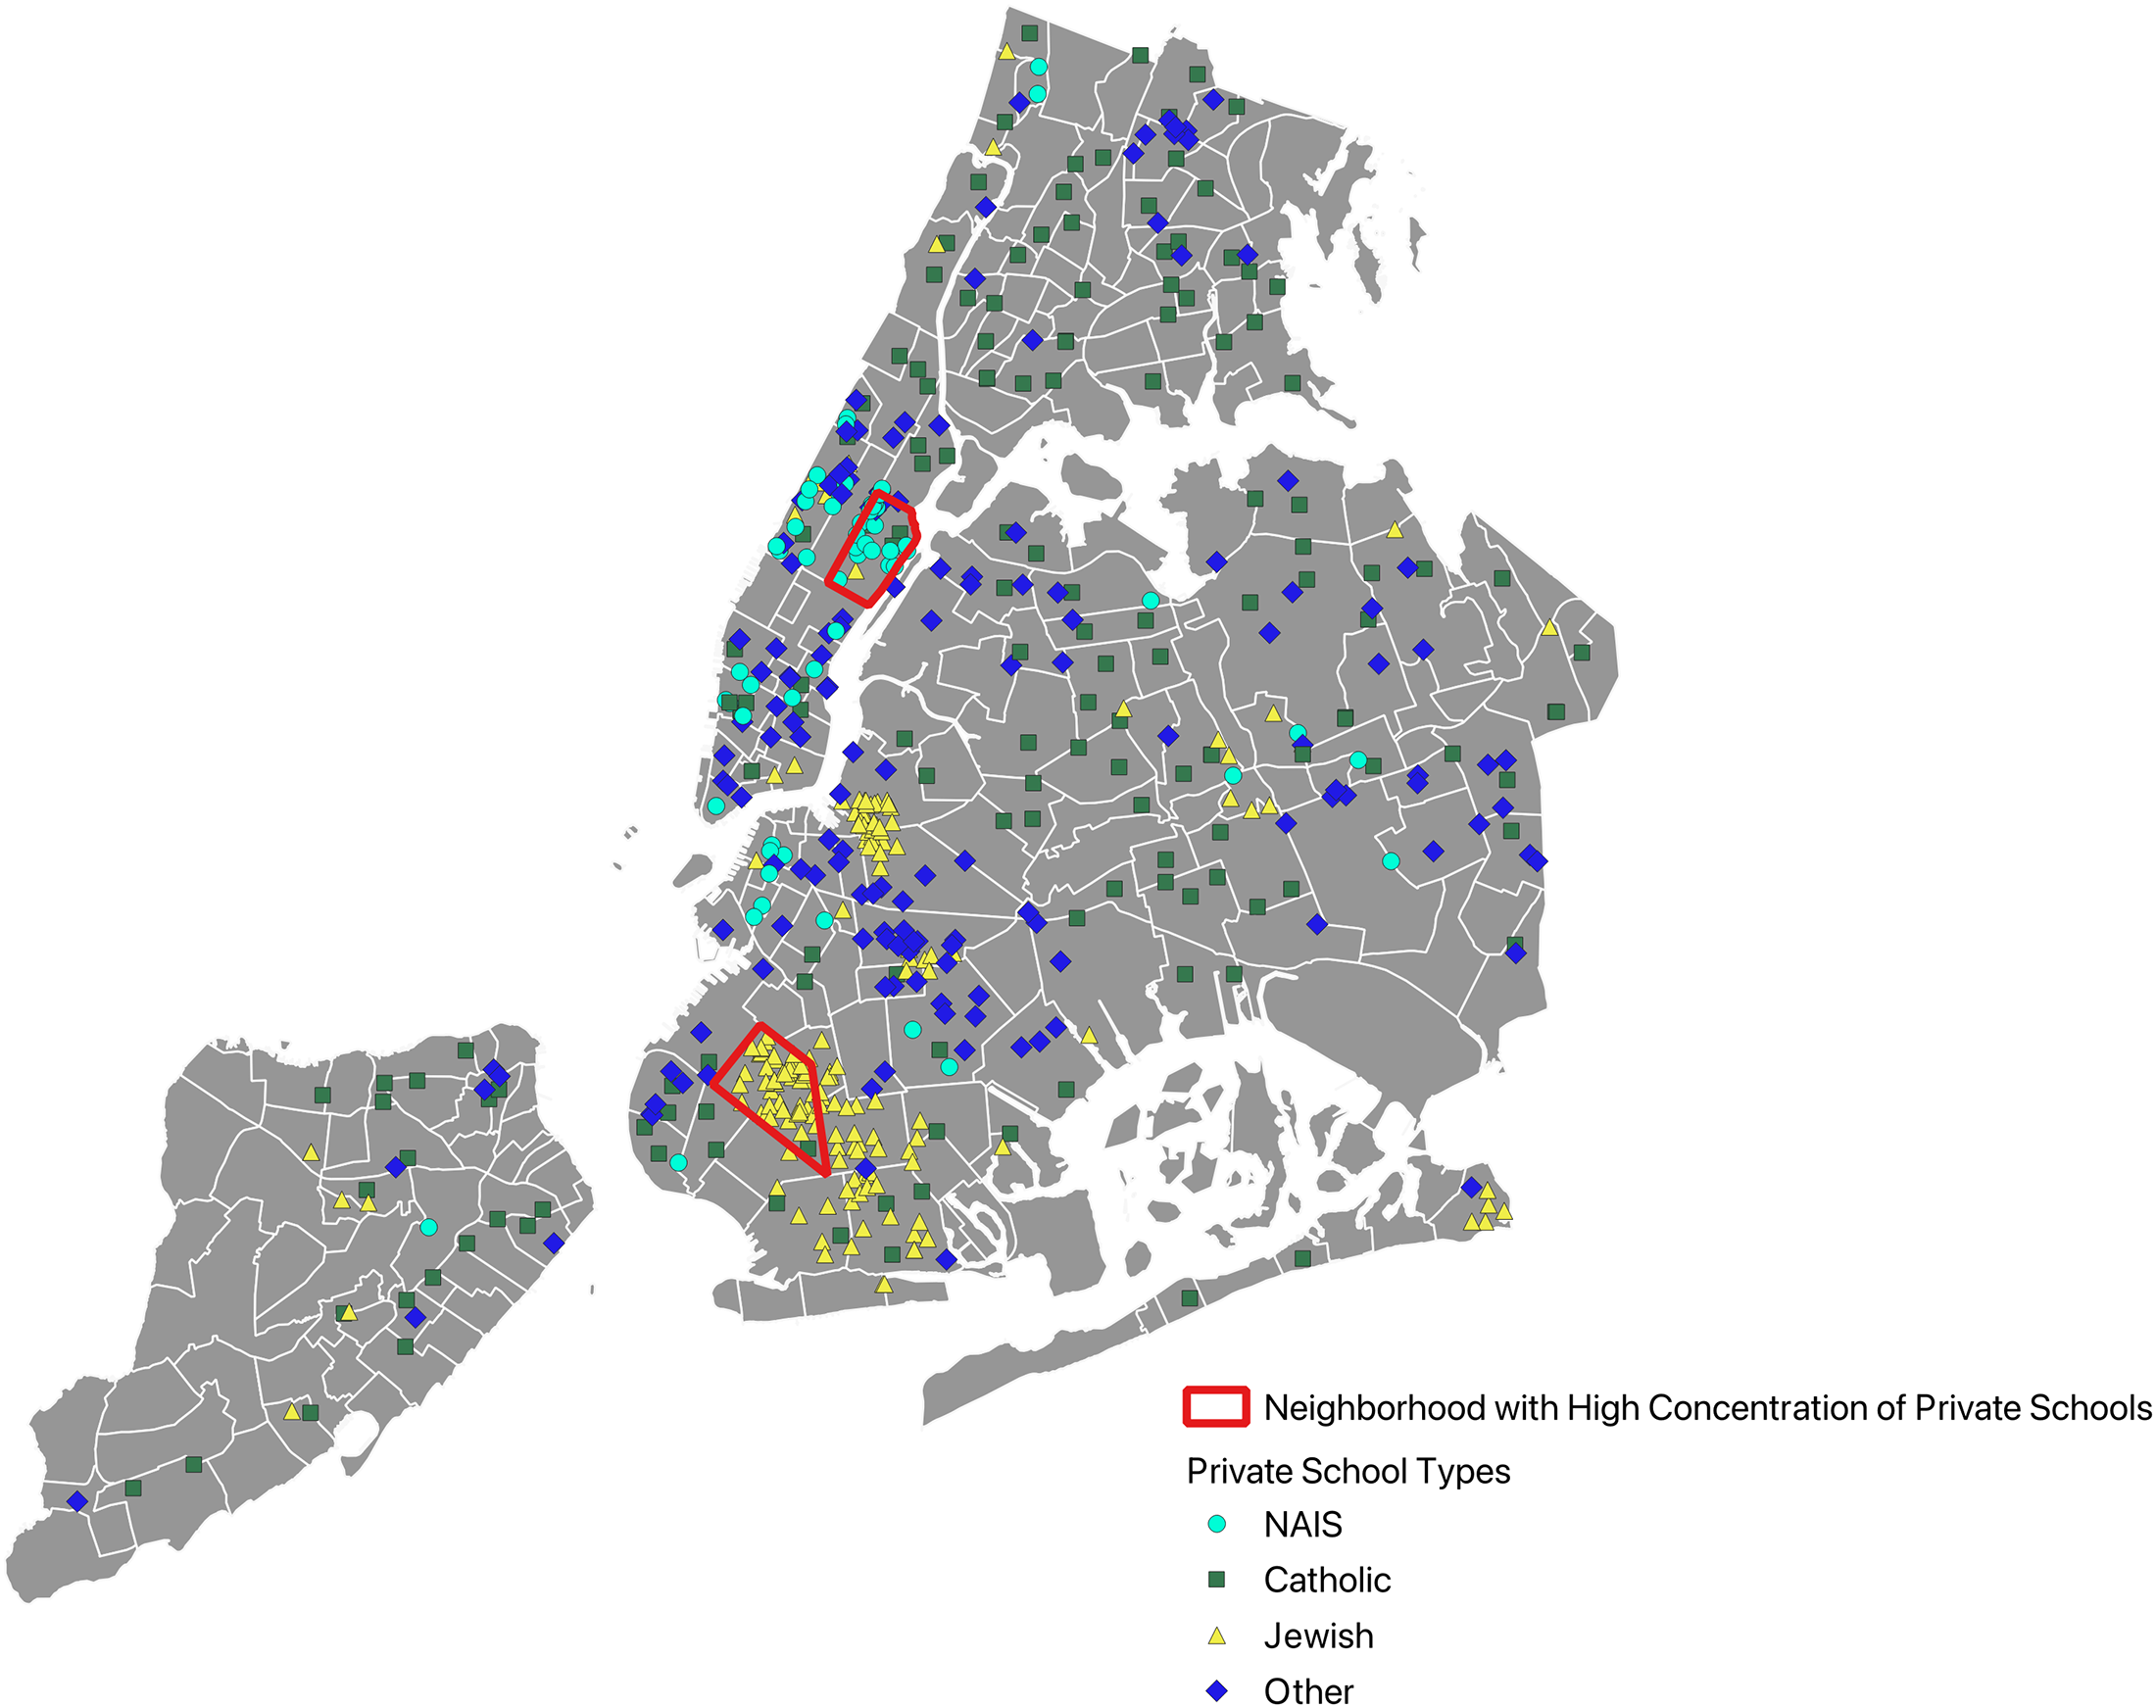
Geographic location by private school type.
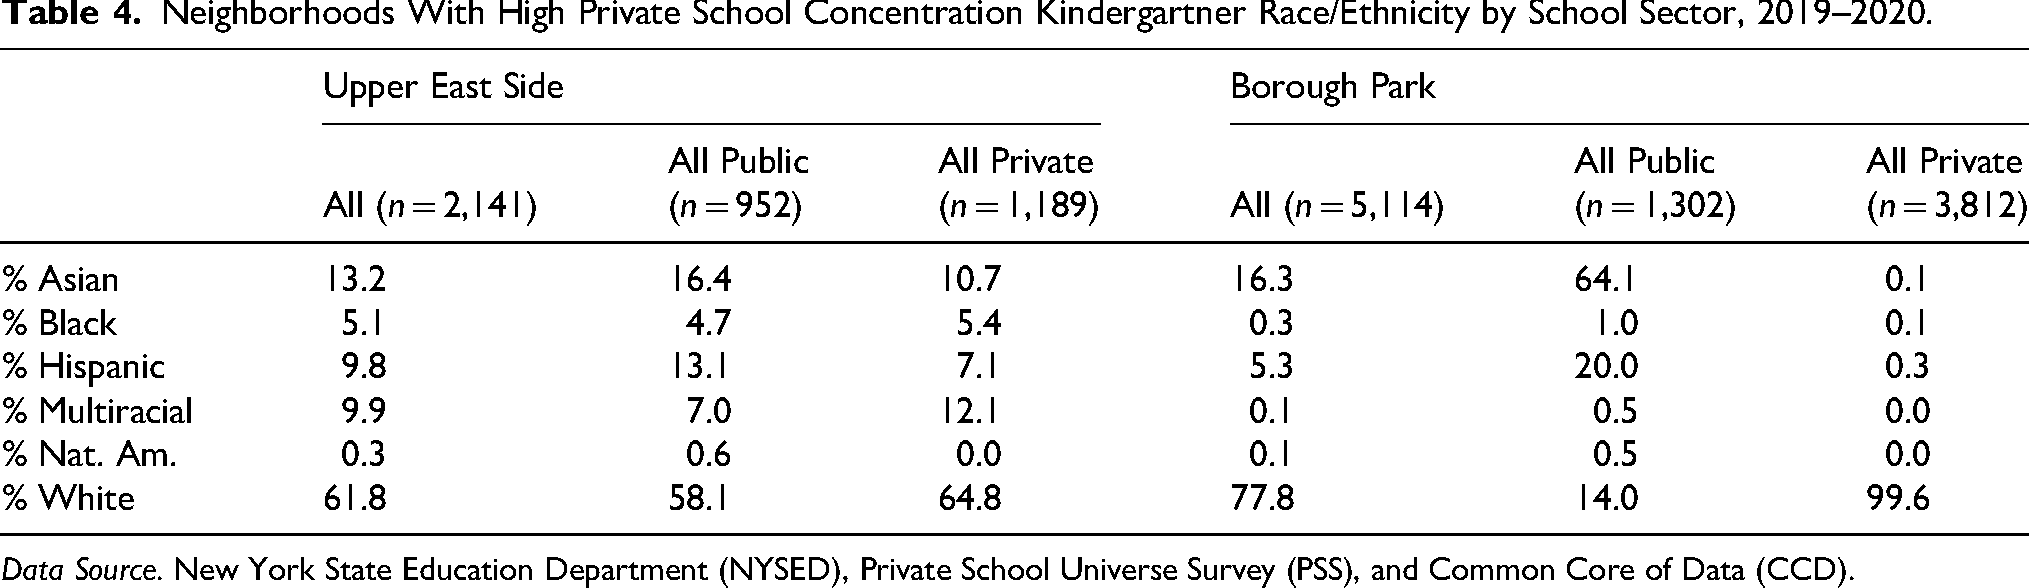
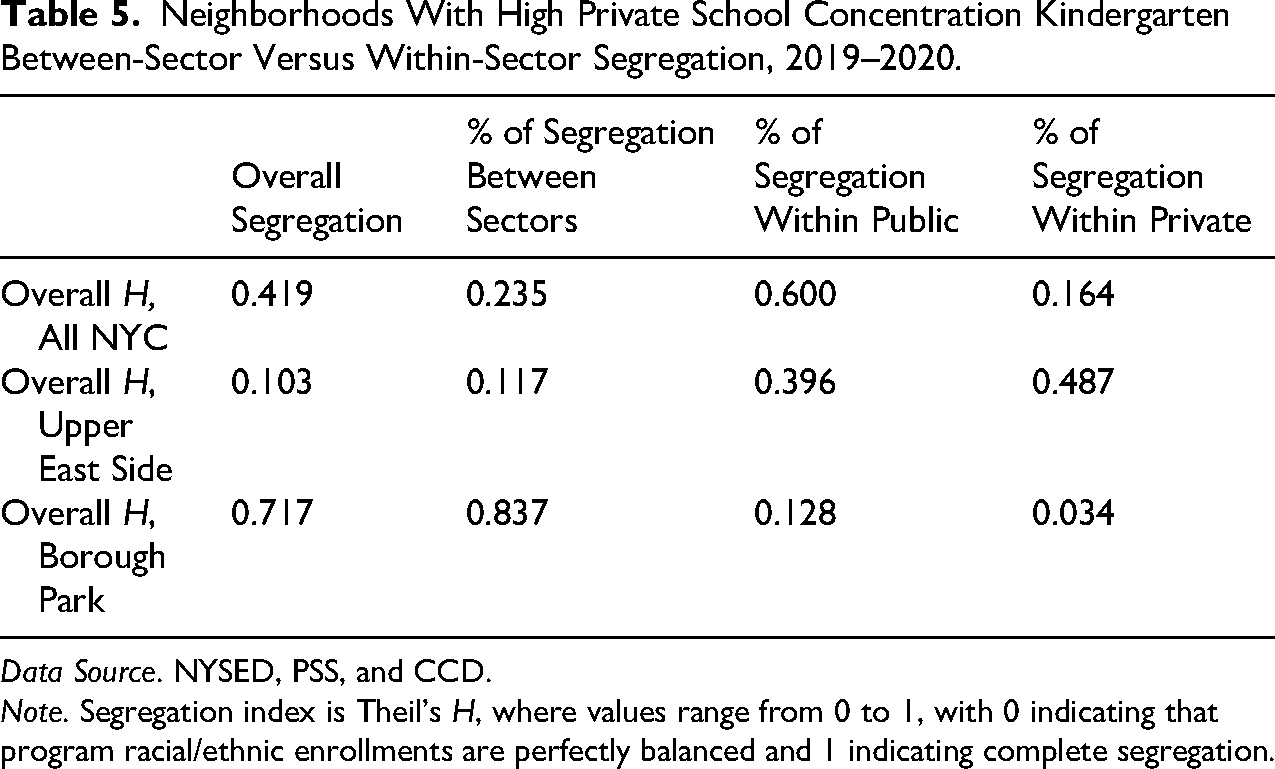
To determine the extent to which residential segregation explains between-sector segregation, we then examine both enrollment and segregation only within these two neighborhoods (Tables 4 and 5). On the Upper East Side, we find that private schools slightly overenroll white and multiracial students, while slightly underenrolling Asian and Hispanic students. However, the gaps between private and public-school enrollment are no more than 10 percentage points for any racial/ethnic group. Overall segregation within the Upper East Side is low (0.103), well below overall segregation in New York City and roughly 25% less than segregation within NAIS schools (recall Table 2). The segregation that remains is largely attributable to within-private and within-public sector segregation, with just over 10% attributable to segregation between the public and private sectors. This suggests that, for NAIS schools, geography plays a substantial role in school segregation.
Neighborhoods With High Private School Concentration Kindergartner Race/Ethnicity by School Sector, 2019–2020.
Data Source. New York State Education Department (NYSED), Private School Universe Survey (PSS), and Common Core of Data (CCD).
Neighborhoods With High Private School Concentration Kindergarten Between-Sector Versus Within-Sector Segregation, 2019–2020.
Data Source. NYSED, PSS, and CCD.
Note. Segregation index is Theil's H, where values range from 0 to 1, with 0 indicating that program racial/ethnic enrollments are perfectly balanced and 1 indicating complete segregation.
In Borough Park, however, the story is strikingly different. Over 99% of private school students are white. In contrast, the public schools in Borough Park serve nearly two-thirds Asian students and one-fifth Hispanic students, with under 15% of enrolled students identified as white. These between-sector differences drive the exceptionally high overall level of segregation in Borough Park (0.717), more than 80% of which is attributable to between-sector segregation. For Jewish schools, between sector differences cannot be explained by underlying residential segregation.
Changes in School Segregation Over Time
Although the cross-sectional snapshot provided above is central to our understanding, the nature of NYC private school enrollments has changed quite dramatically over the past several decades (see Figure 5). In the late 1990s, Catholic school students, typically the most racially/ethnically diverse, represented a plurality of all private school students. Since then, Catholic school enrollments have declined by half. Conversely, enrollments in Jewish schools, which enroll almost exclusively white students, have increased by more than half. As noted above, enrollment in Jewish schools now constitutes the clear majority of NYC private school enrollments. Enrollments in the more elite NAIS schools, in which students are also disproportionately white, have grown only slightly, while enrollment in other private schools, which are similarly diverse to Catholic schools, have also experienced consistent (though less dramatic) enrollment declines.
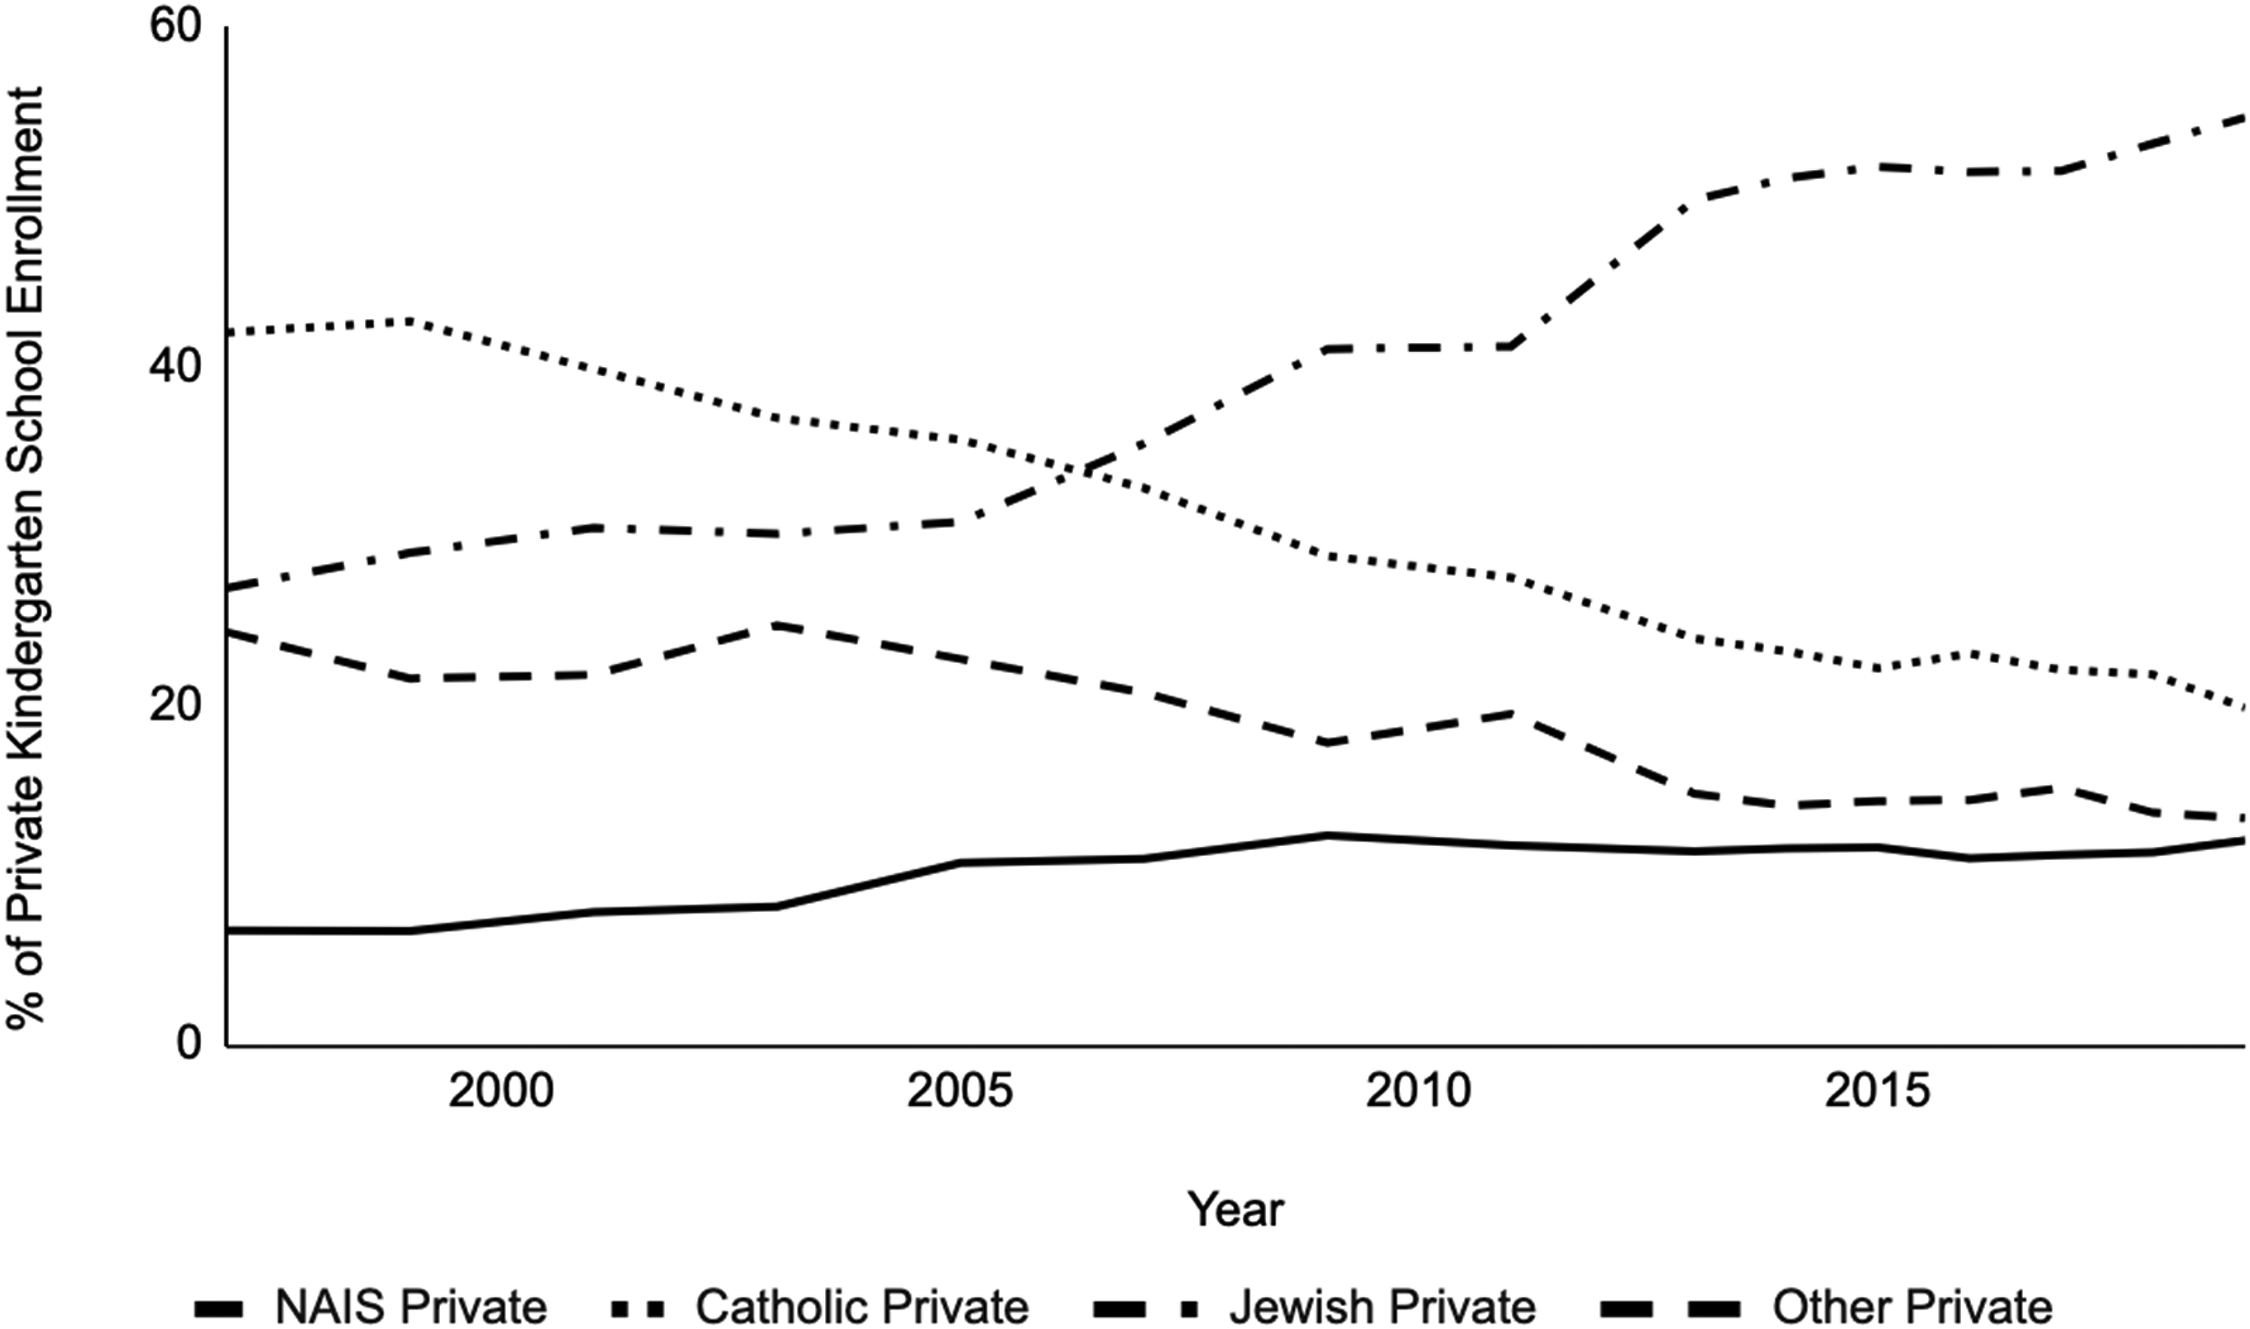
New York City private school kindergarten enrollments by type, 1997–2019. Data Source. New York State Education Department (NYSED) and Private School Universe Survey (PSS).
The implication of the decrease in Catholic and other private enrollments, and the increase in Jewish and NAIS school enrollments, for overall private school racial/ethnic compositions is apparent in Figure 6. Most notably, the proportion of white private school kindergarteners, which stood at just over 50% in the late 1990s, increased to nearly 75% by 2019. This change was accompanied by proportionate decreases in both Black and Hispanic private school kindergartener enrollments. As indicated in Figure 7, demographic changes have been subtler among public school students, with some proportional growth in Asian and multiracial kindergartener enrollments, relatively stable proportions of Hispanic and white kindergarteners, and proportional declines in Black student enrollments.
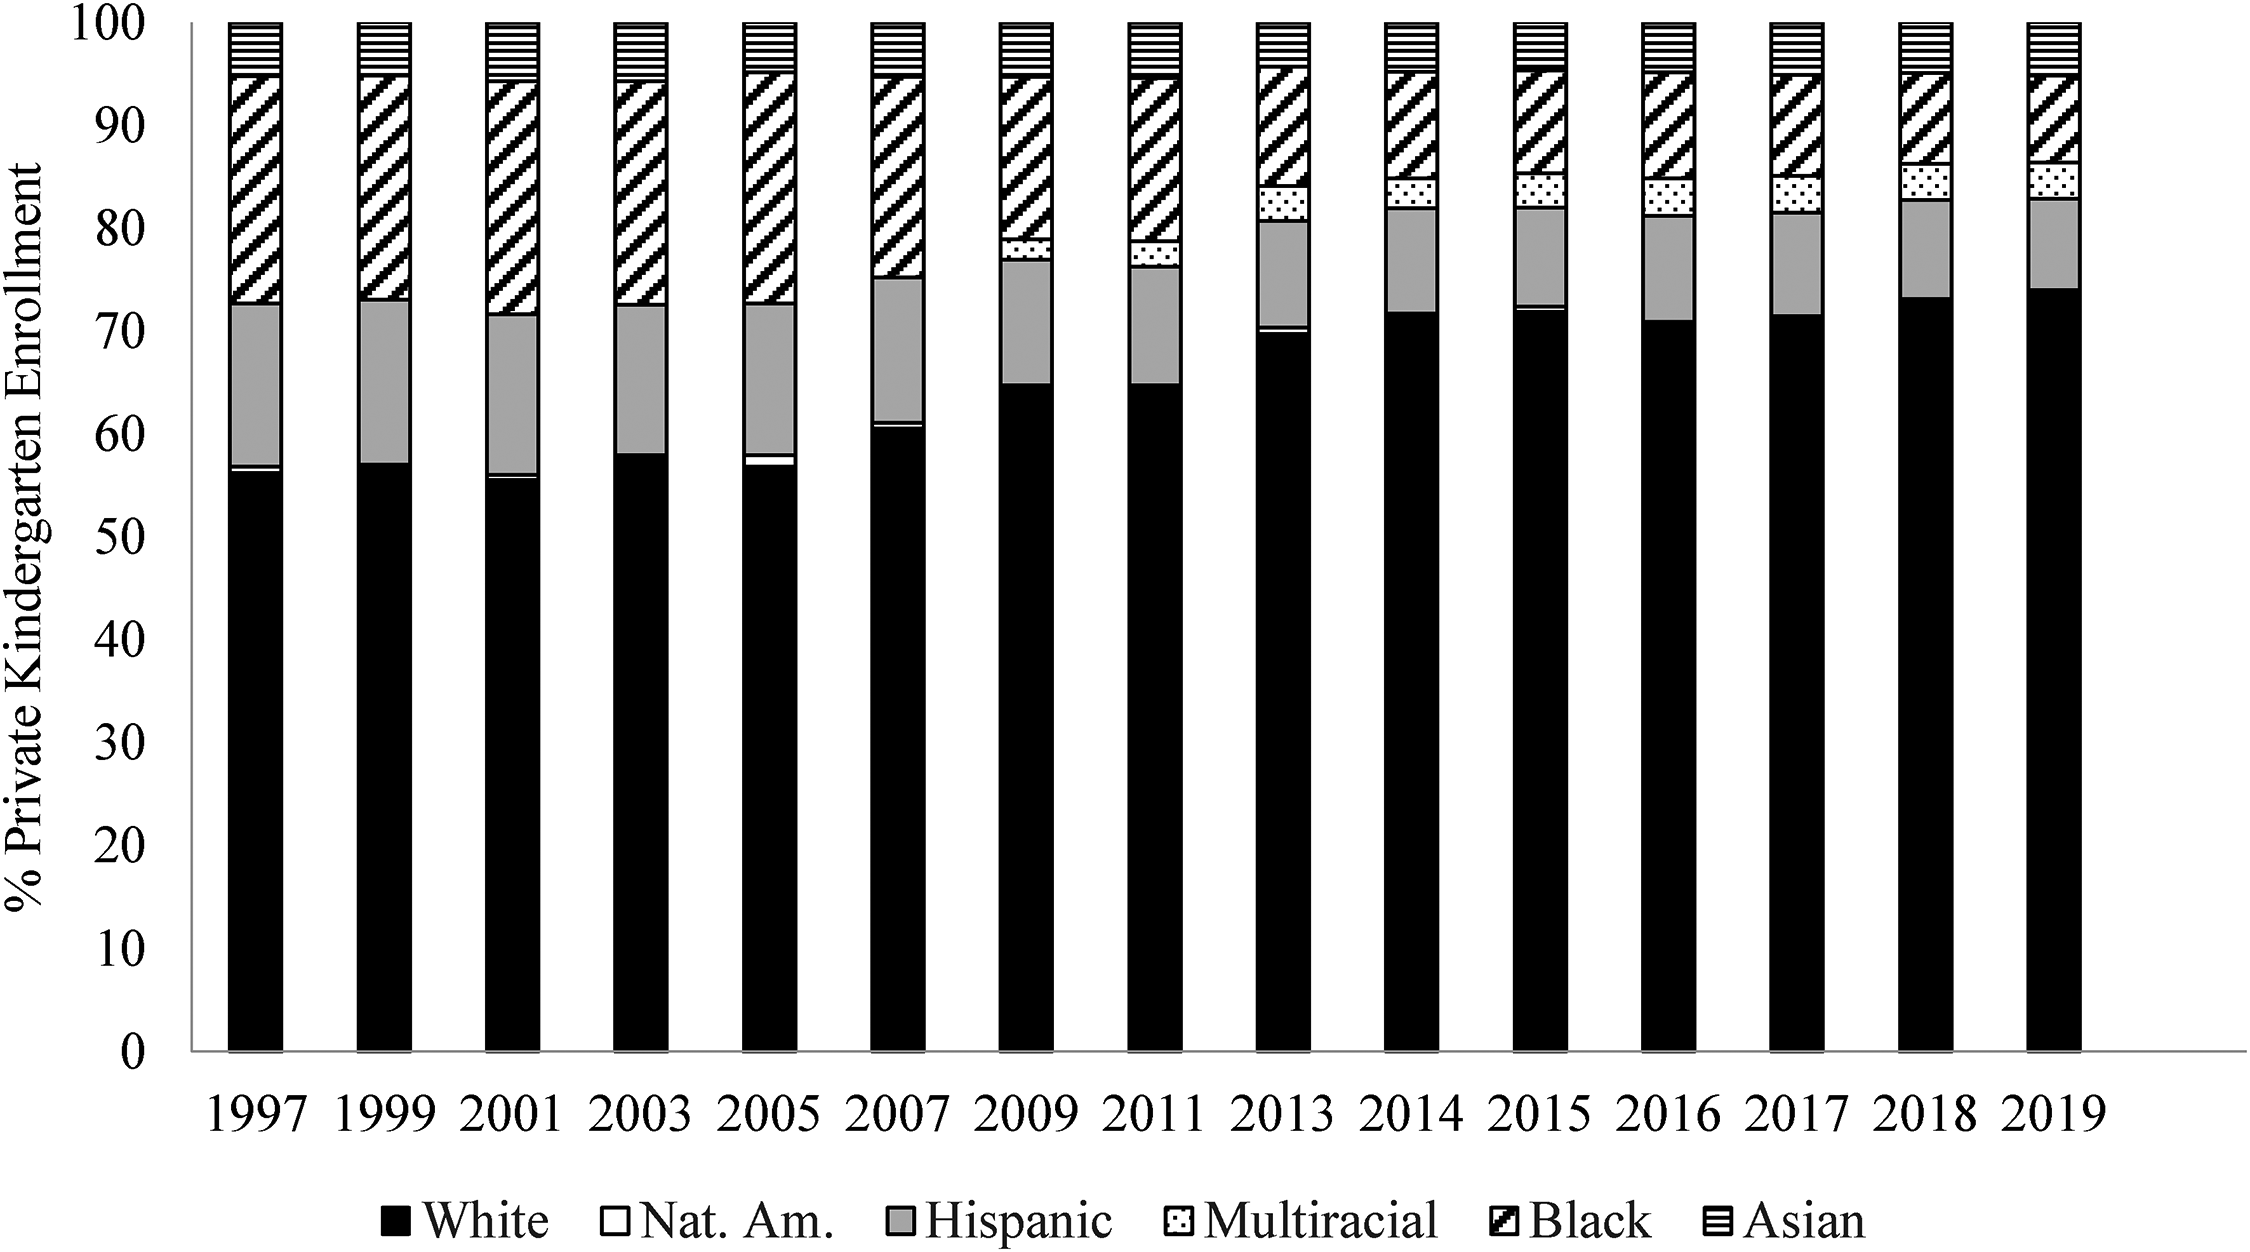
New York City kindergarten private school racial/ethnic enrollments, 1997–2019. Data Source. New York State Education Department (NYSED) and Private School Universe Survey (PSS).
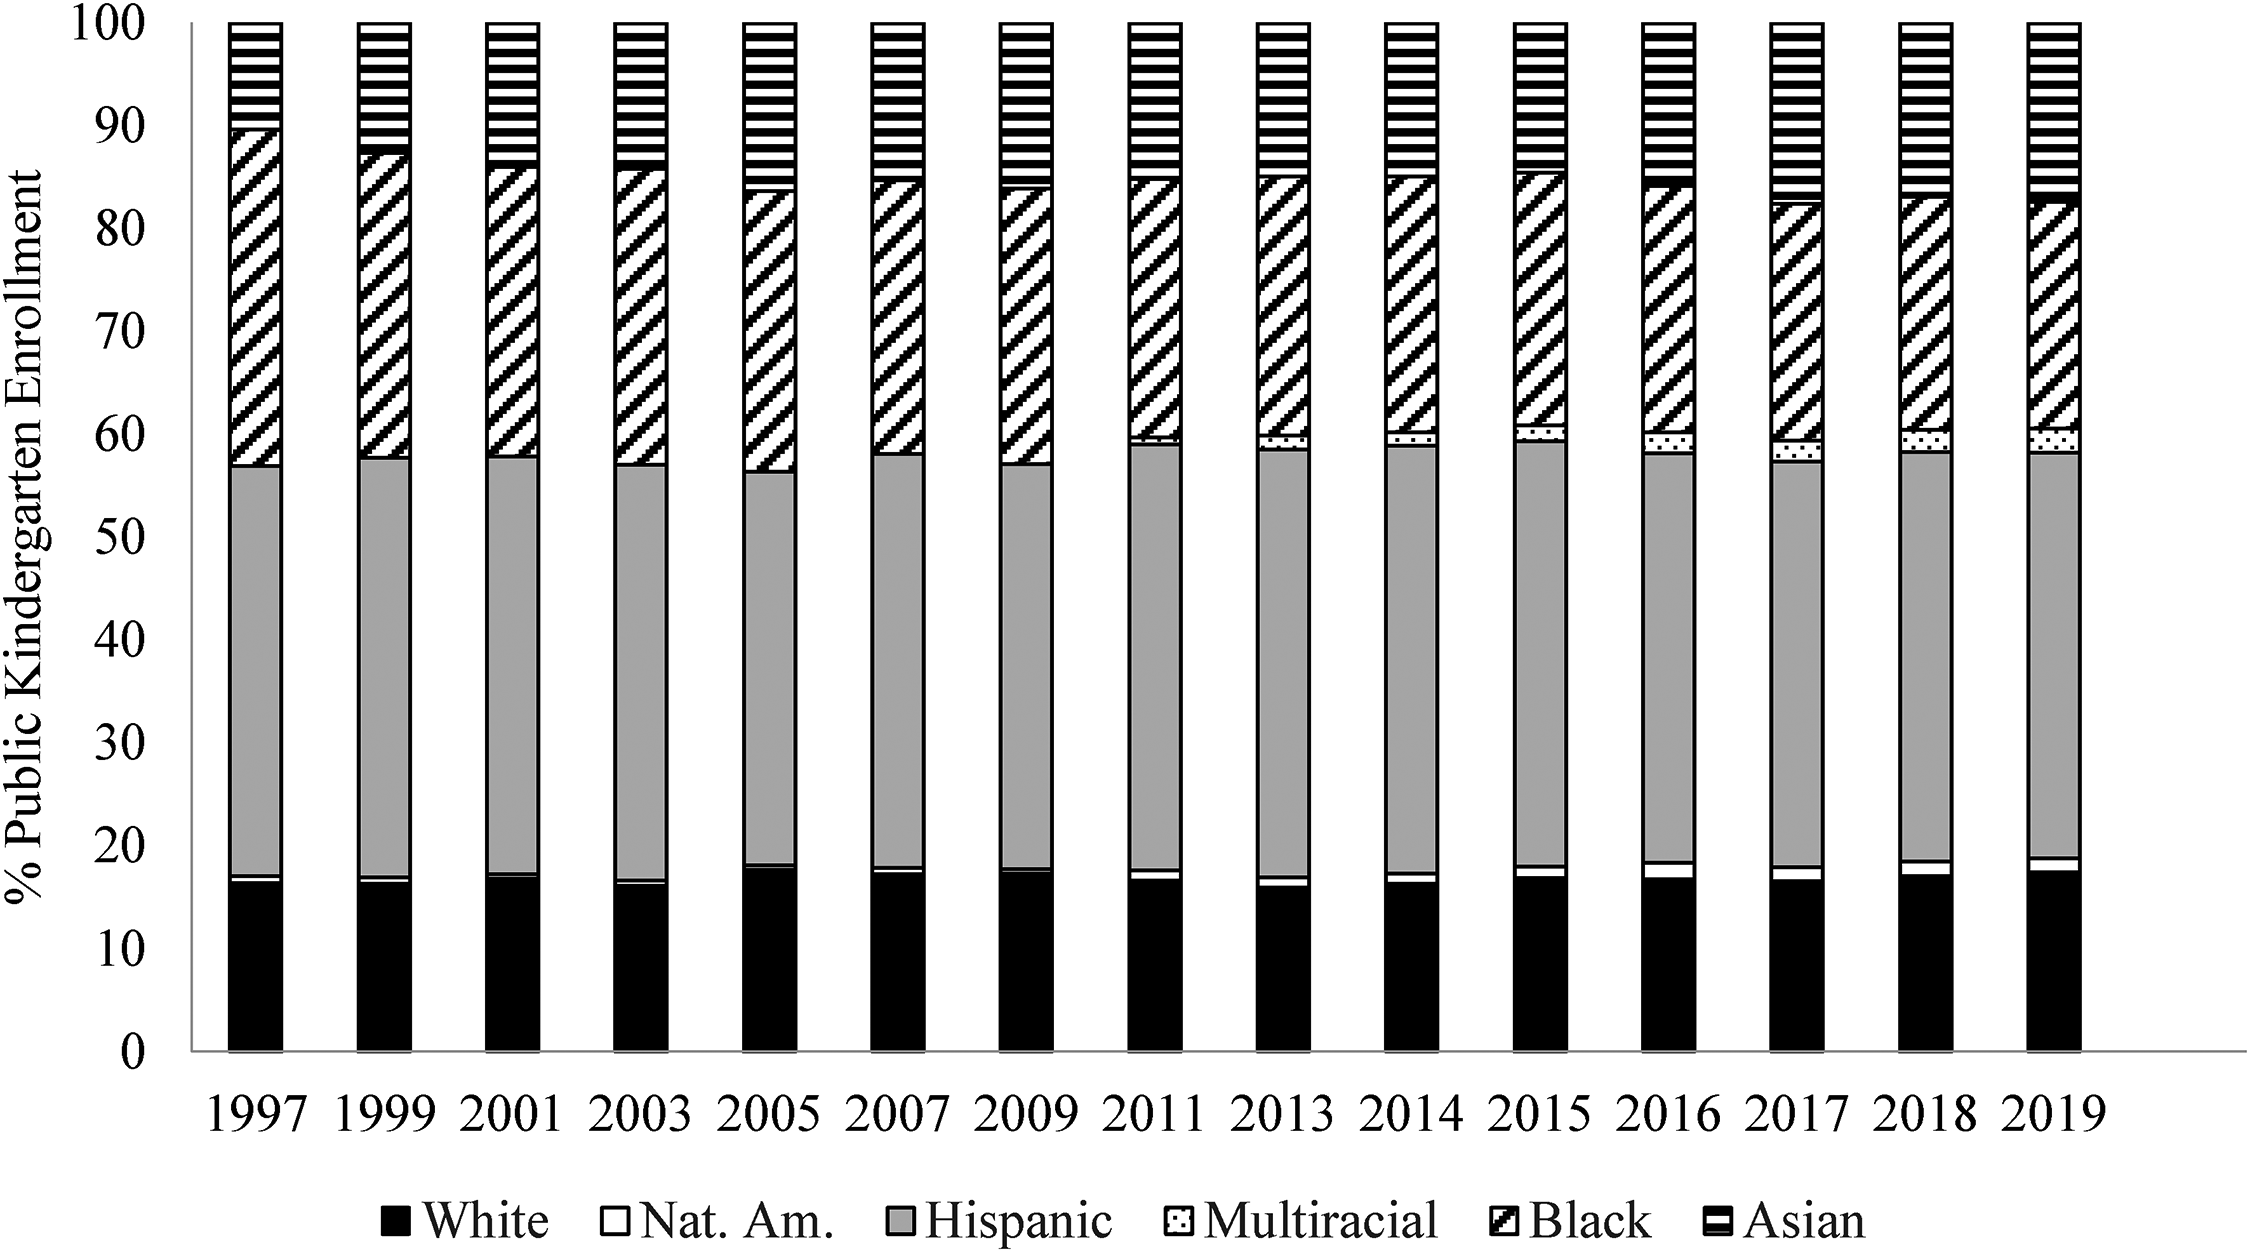
New York City kindergarten public school racial/ethnic enrollments, 1997–2019. Data Source. Common Core of Data (CCD).
Our assumption was that these changes in private school racial/ethnic compositions over the past several decades would be accompanied by increased overall levels of segregation. Surprisingly, however, we find that segregation has been relatively stable (Figure 8). In fact, overall segregation, segregation among private schools, and segregation among public schools has even slightly declined over time. Similar patterns are evident with comparisons between specific racial/ethnic groups (see Appendix Figure A1). Black/white segregation decreased slightly within both public and private schools. Hispanic/white segregation in private schools remained relatively stable but declined by almost 0.1 within public schools. While these modest declines are encouraging, it is important to bear in mind that NYC segregation has remained elevated at disarmingly high levels.
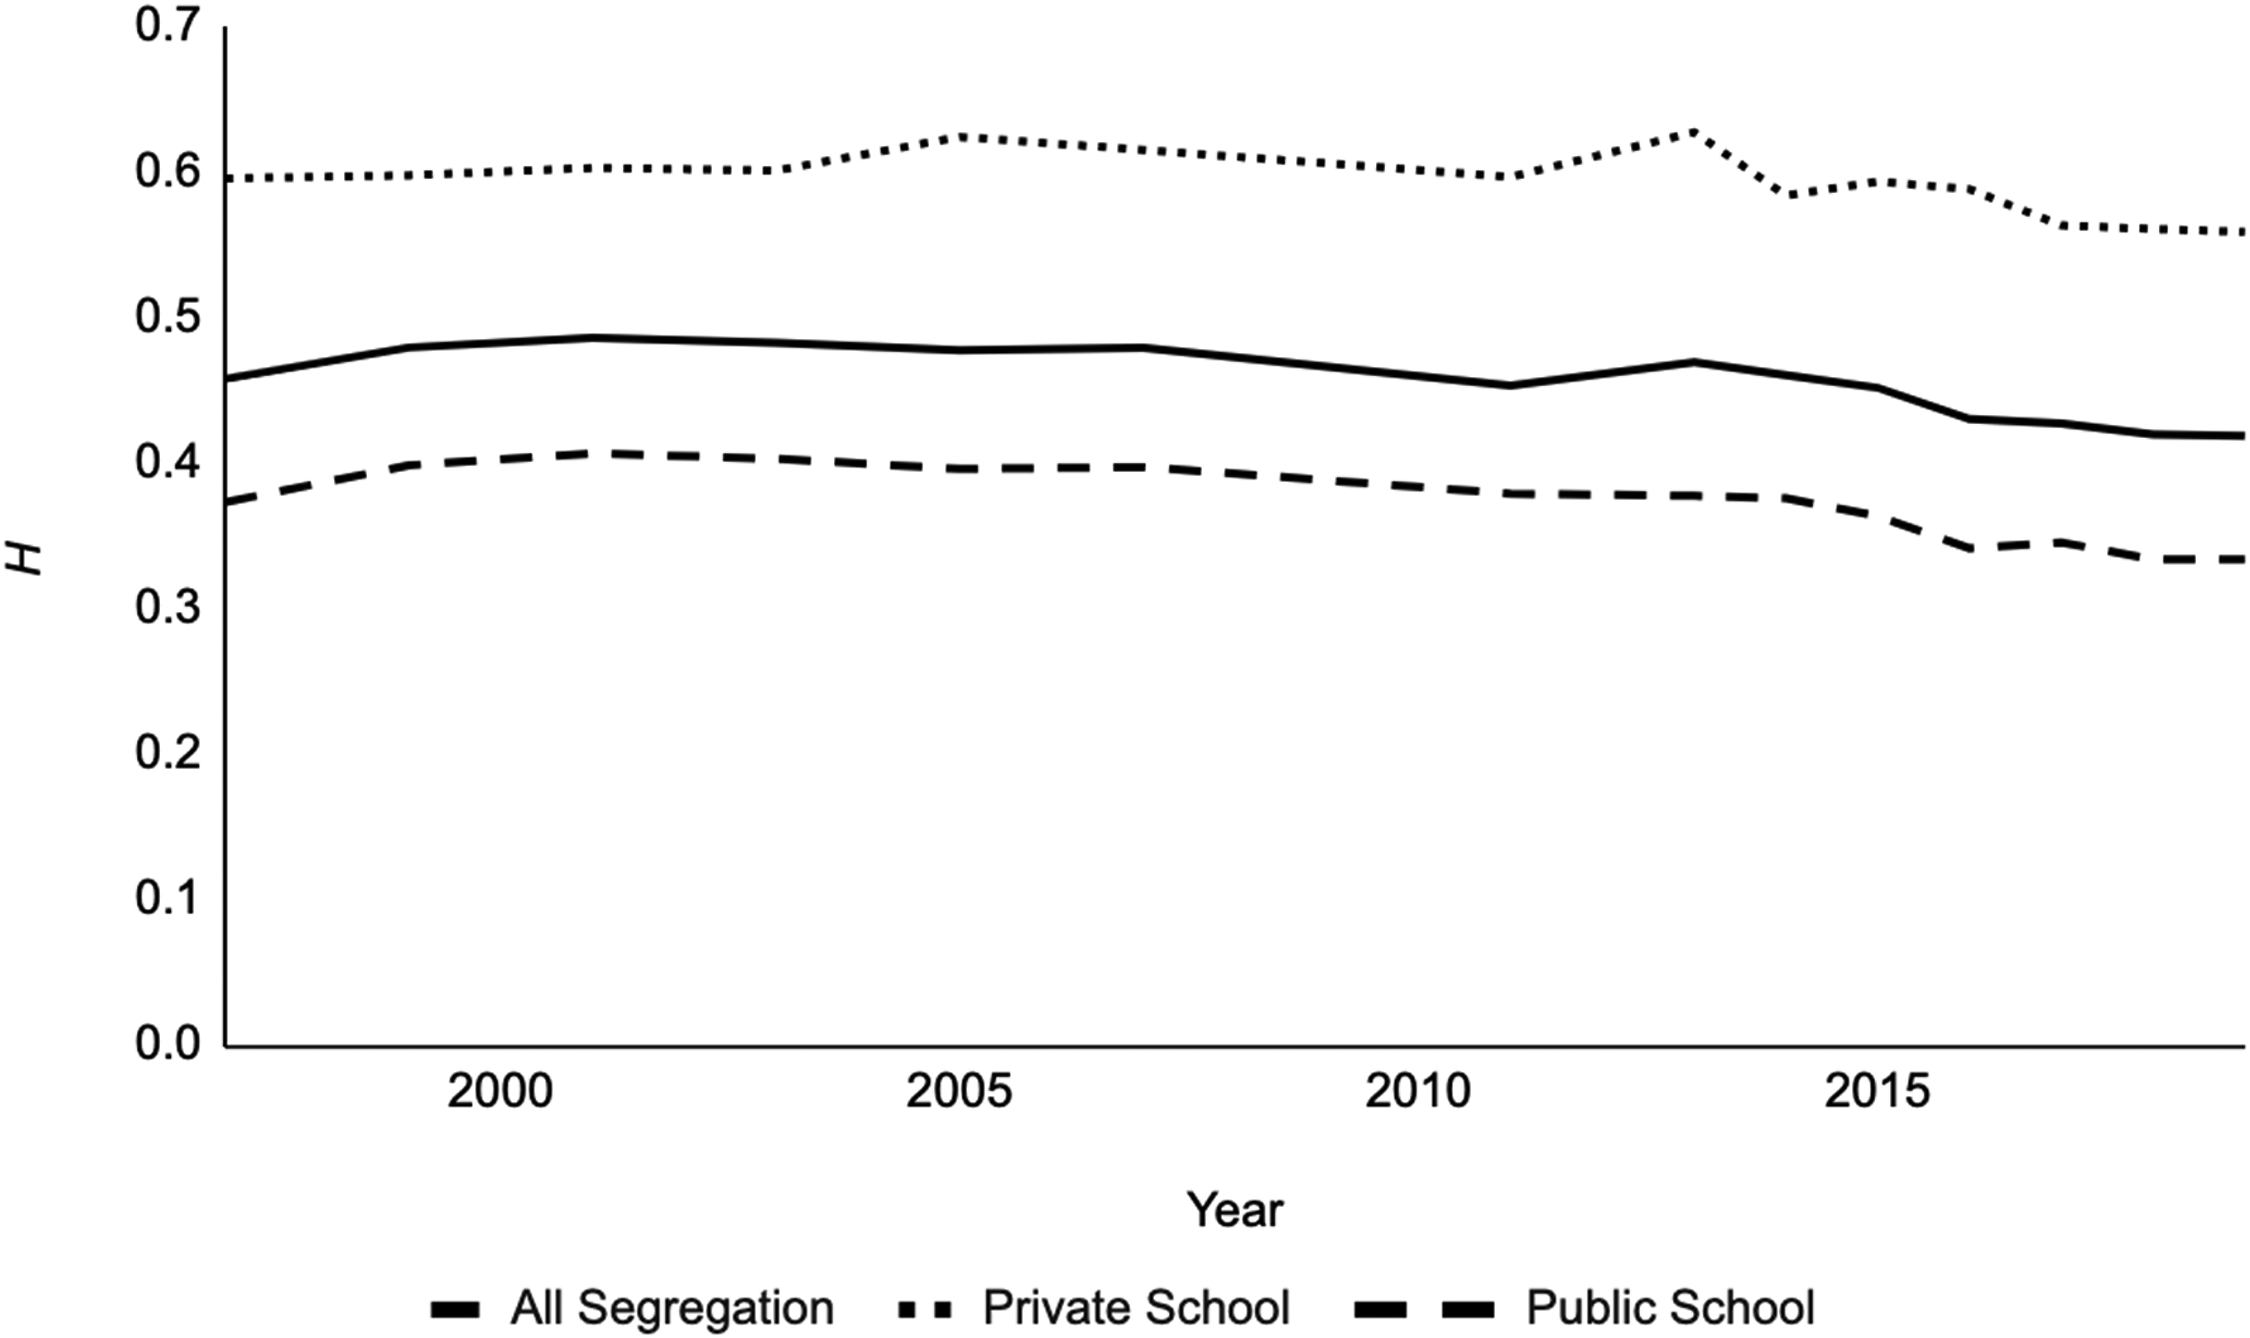
New York City kindergarten segregation across all racial groups by school sector, 1997–2019. Data Source. NYSED, PSS, and CCD. Note. H in 2009 is imputed as the average of H in prior available year (2007) and the following available year (2011) because private schools use multiracial as a racial/ethnic category in 2009 and public schools do not.
The decline in overall segregation suggests that, although the composition of private schools has become less representative of the city as a whole, the extent to which students are distributed evenly across schools within these sectors has slightly improved. Indeed, Figure 9 confirms that, although there is a slight upward trend in between-sector segregation, which parallels the growth in white private school enrollments (see Figure 6), declining within-sector segregation counteracts these between-sector changes, and overall segregation declines slightly. Hispanic/white and Black/white segregation generally follow the same trend, with between- and within-sector segregation converging (Appendix Figure A2).
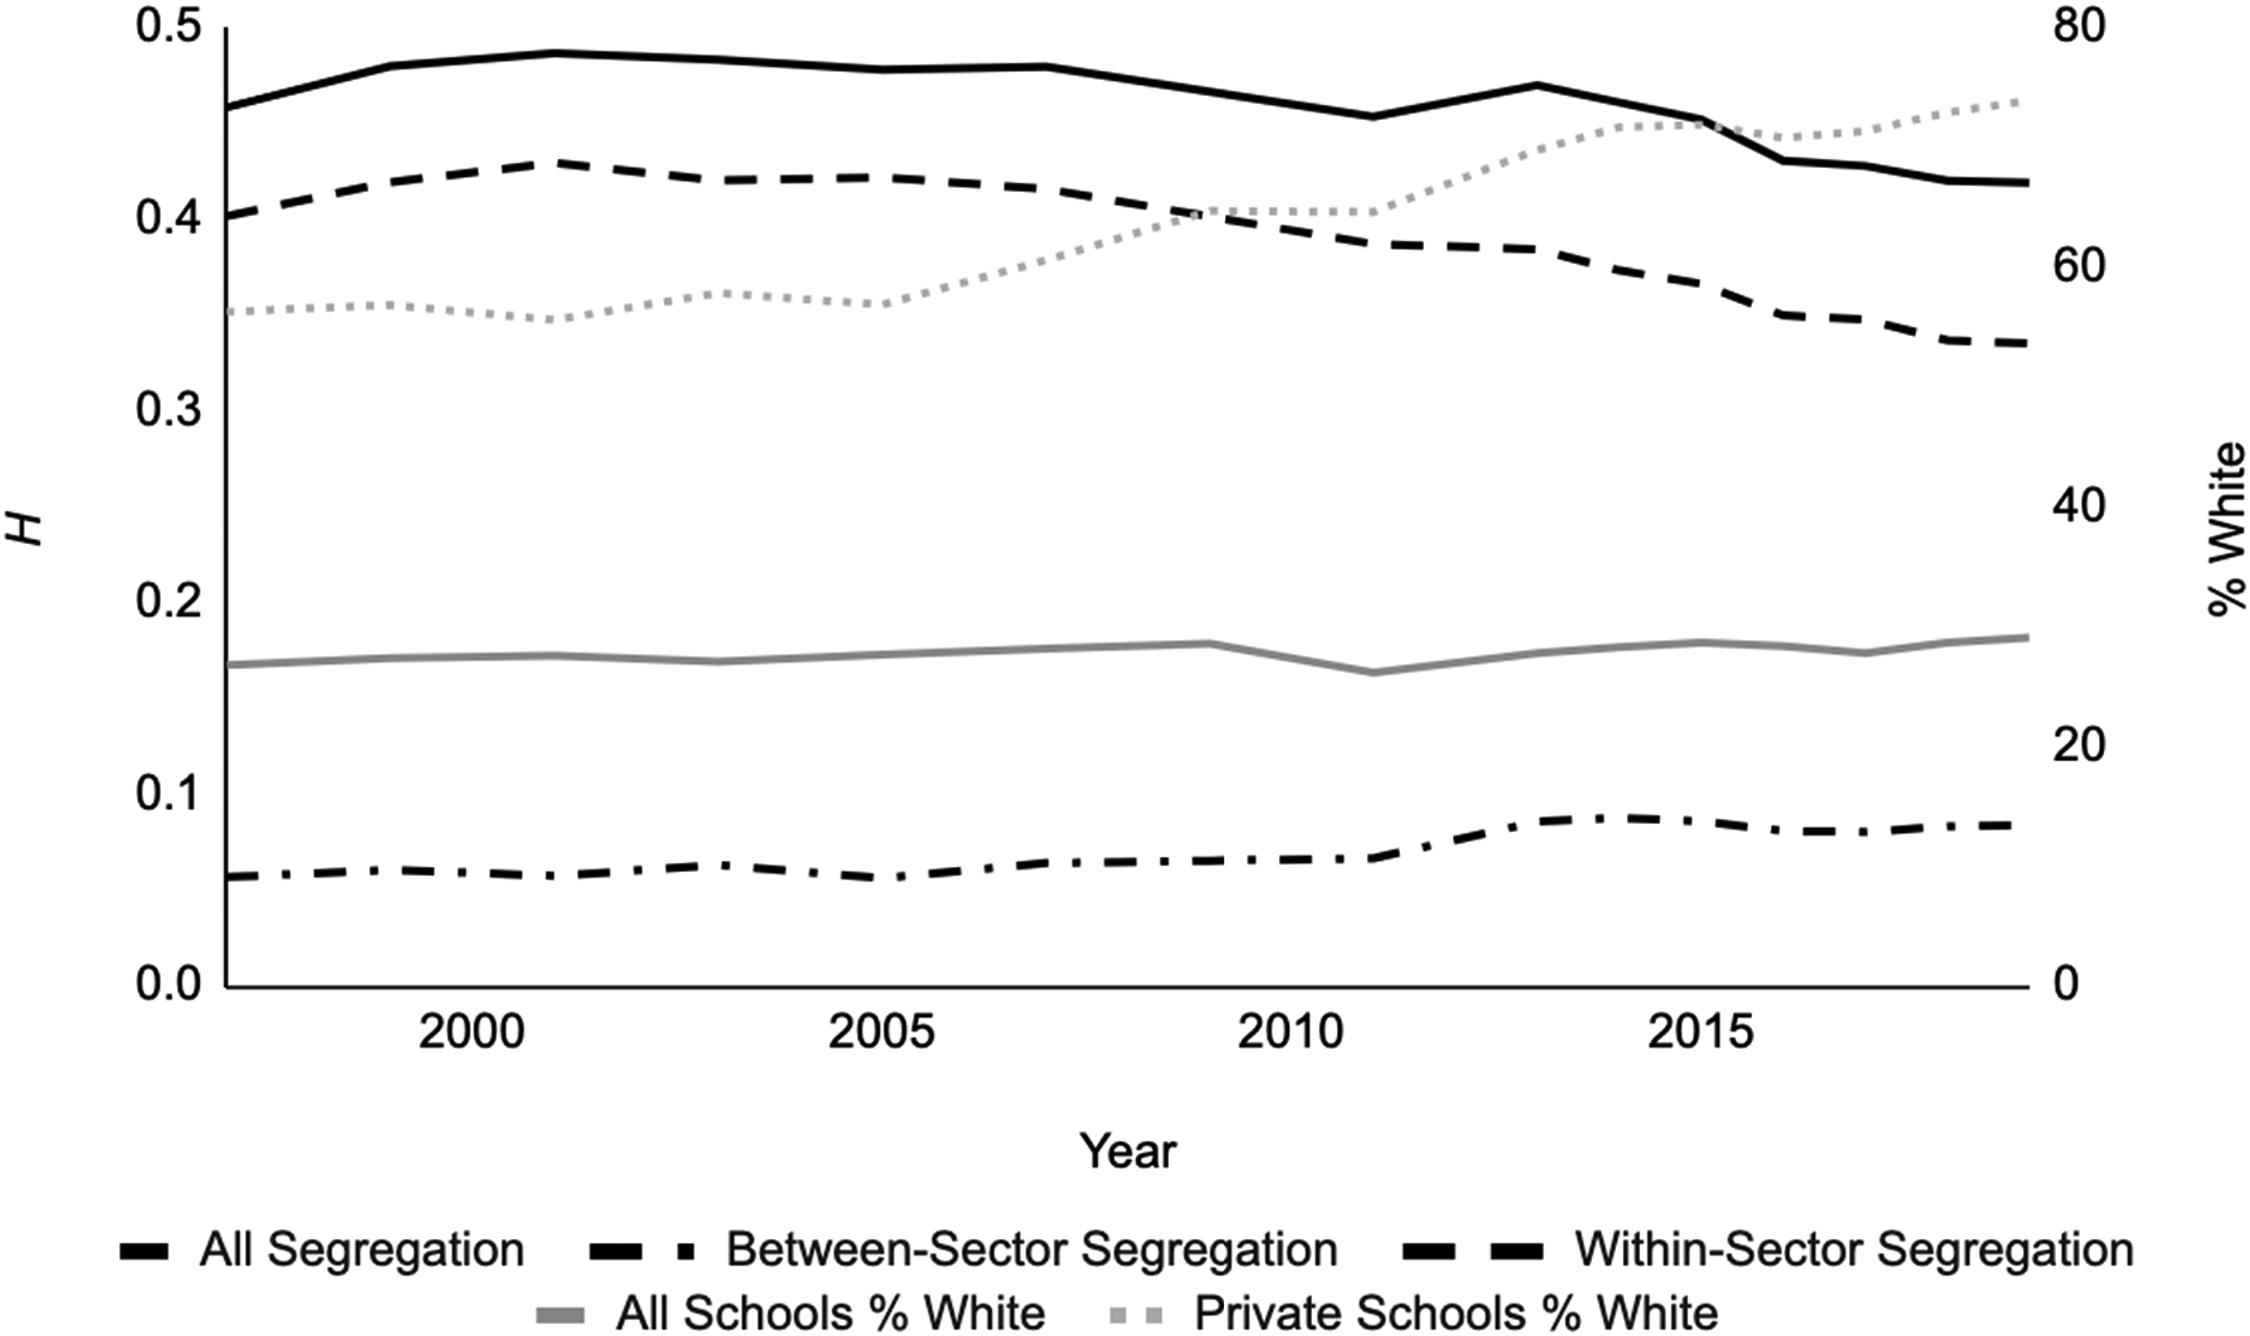
Between- versus within- sector segregation across all racial groups and racial composition in New York City kindergartens from 1997 to 2019. Data Source. NYSED, PSS, and CCD. Note. H in 2009 is imputed as the average of H in prior available year (2007) and the following available year (2011) because private schools use multiracial as a racial/ethnic category in 2009 and public schools do not.
Conclusion and Discussion
Our results suggest that NYC private schools have consistently stratified an already segregated educational landscape over the last two decades. Private sector kindergarten enrollments in no way reflect the City's racial/ethnic diversity, with white students substantially overrepresented, particularly in NAIS and Jewish private schools. We find that overall segregation is exacerbated by the presence of private schools, not only due to the stark, and growing, differences in racial/ethnic demographics across sectors, but also because private schools are themselves more segregated than their public counterparts. When we compare these two sources of segregation—segregation between sectors and segregation within sectors—we find that between-sector segregation accounts for roughly one-quarter of overall school segregation.
Importantly—and counter to the public narrative—the level of NYC school segregation has remained relatively stable over time, even decreasing slightly. This is unexpected both given NYC's shifting demographics, with a growing Asian, Hispanic, and multiracial population (NYC Planning, n.d.), and the increasingly disproportionate racial/ethnic composition of private school enrollments. However, the overall segregation's stability over time can be explained by declining segregation within each sector. That is, NYC's infamously segregated public sector (Kucsera & Orfield, 2014) is making (some) progress, but that progress is in part counterbalanced by the growing disproportionality of NYC's private sector.
The increasingly disproportionate enrollment of white students in private schools is particularly notable in light of NYC's gentrification, which has itself received considerable attention (e.g., Mordechay & Ayscue, 2024). Our results reinforce prior work finding that the availability of options beyond neighborhood public schools facilitates gentrification (Kimelberg & Billingham, 2012; Mann & Rogers, 2025; Pearman & Swain, 2017).
While our results are specific to New York City, the City's growing gentrification makes it, in an important sense, a microcosm of urban intensive spaces (Milner, 2012) across the country. As in New York, more than one-quarter of low-income census tracts gentrified between 2000 and 2010 in both Atlanta and Philadelphia (Maciag, 2015). While some aspects of NYC's increasing between-sector segregation are likely idiosyncratic (the rapidly expanding Jewish private school enrollment, for one), the implications for policymakers and researchers are relevant to other urban intensive spaces.
Implications for Policymakers
An important policy question relates to the counterfactual: in the absence of private school options, how would segregation in urban intensive spaces change? If all private school students instead attended public schools in the same districts and were equally distributed by racial/ethnic group among public schools, then overall segregation would improve substantially. However, given stark residential segregation (Frankenberg, 2013; Operti et al., 2022), private school students would likely remain unequally distributed. Moreover, in the absence of private school options, many private school families might opt for suburban communities. To the extent that this would occur, the location of segregation would simply change from between sectors within cities, to between the cities and their suburbs (or even between suburban public and private sectors).
The opposite counterfactual also bears consideration: if private school enrollments in urban intensive areas were to grow, how would segregation change? In the context of the rapid national expansion of voucher programs, this question is no mere hypothetical (Welner et al. 2023). One could argue (and voucher advocates often do; Goldstein, 2025) that vouchers provide low-income families access to the private sector. However, even if more low-income families enrolled in private schools, it seems quite unlikely that vouchers would decrease overall racial segregation in urban intensive areas given that segregation within the private sector is higher and broad voucher expansions have generally spurred more, not less, stratification (Hsieh & Urquiola, 2006). Moreover, the exorbitant tuitions charged by many elite private schools puts them beyond the scope of any U.S. voucher program currently under discussion (DiMarco, 2025).
Implications for Researchers
Our findings also highlight the importance of taking private schools into account when measuring overall segregation. Had we focused solely on public-school segregation—the typical approach—we would only have observed a slight decrease in segregation over time. By including the private school sector, we see the growing disproportionality between sectors. Perhaps the most notable finding, then, is that studying public school segregation in a silo can obscure broader trends, underscoring the importance of accounting for the private sector in any examination of school segregation.
Footnotes
Ethical Approval and Informed Consent Statements
No approvals or consent were required for this study, which exclusively employs publicly available data.
Funding
The authors received no financial support for the research, authorship, and/or publication of this article.
Declaration of Conflicting Interests
The authors declared no potential conflicts of interest with respect to the research, authorship, and/or publication of this article.
Data Availability Statement
All data used in this study are publicly available free of charge through the Common Core of Data (CCD), organized by the National Center for Education Statistics (NCES), NCES’ Private School Survey (PSS), and the New York State Education Department (NYSED).
