
Abstract
Two significant trends have occurred in urban areas across the US during recent decades: immigration and the decentralisation of employment. While each trend has been investigated by research, the magnitude of spatial disparity between immigrant settlement patterns and employment location and its change over time has received much less attention. Using a sample of the 60 largest immigrant metropolitan areas, this study uses a spatial mismatch index and regression methods to address this question over the period 1980–2000. Results indicate that immigrants are more spatially mismatched with job opportunities than the White population, but less so than the Black population. It is found that job growth occurred close to where the native-born Whites concentrate and away from immigrants and other minority populations. However, immigrants’ residential location patterns shifted towards employment opportunities and was able to offset the otherwise enlarging spatial disparity.
Introduction
Two significant trends have occurred in urban areas across the United States during recent decades: immigration and the decentralisation of employment. While immigrants continue to arrive in traditional ‘gateway’ metropolitan areas, they have also begun to disperse from established gateways and migrate directly to new destinations (Singer, 2004; Painter and Yu, 2010; Frey and Liaw, 2005; Hempstead, 2007). At the same time, employment decentralisation accelerated in the second half of the 20th century, with higher job growth happening in suburban rather than central-city areas (Holzer and Stoll, 2007). Research shows that a quarter of central cities experienced job losses and more than three-quarters lost their private-sector employment share to suburbs between 1993 and 1996 (Brennan and Hill, 1999). 1 Industries like manufacturing, services and retail suburbanised at especially rapid rates and these industries are sectors that immigrants heavily concentrate in. While both trends have been documented, it remains unclear what the magnitude of the spatial disparity is between where immigrants live and where jobs are located within metropolitan areas, and how this disparity may have changed over time.
Reduced spatial accessibility to jobs has been identified as one of the barriers to employment for inner-city minorities since Kain’s seminal work (1968). The ‘spatial mismatch hypothesis’ states that, in the context of economic restructuring, Blacks in inner-city neighbourhoods suffer from high unemployment rates, low wages and long commutes due to their spatial isolation from suburbanised low-skill and semi-skill job opportunities and limited residential mobility to settle in suburban areas given exclusionary zoning and other discriminatory housing practices. Voluminous empirical studies in recent years have tested this hypothesis on different scales and with different approaches (see Ihlanfeldt and Sjoquist, 1998, for a comprehensive review) and many have documented the effect of living in job-poor central cities on Blacks’ economic well-being (Raphael, 1998; Stoll, 1999). Most of the reviewed studies are conducted for selected case study metropolitan areas and for a single point in time. Results have been mixed and sometimes sensitive to the specification of the research design. As exceptions, a few studies have tested for the persistence of spatial mismatch and the changing degree of spatial disparity between Blacks and jobs using data over a longer period of time. Martin (2001) found that, between 1970 and 1990, Blacks’ residential mobility did not fully adjust to decentralised employment and the resultant combined impact increased the disparity between the spatial distribution of employment and the distribution of the Black population by more than 20 per cent in 39 selected metropolitan areas. Raphael and Stoll (2002) extended this study and documented a modest reversal of this trend from 1990 to 2000 in the 20 metropolitan areas with the largest Black populations.
Despite the increasing presence of immigrants in the US labour market, past research on their employment accessibility has been limited (for example, Parks, 2004; Painter et al., 2007, on Los Angeles; Wang, 2006, on San Francisco). What makes the study of how the labour market outcomes of immigrants are influenced by space particularly interesting is the fact that immigrants may choose to locate near co-ethnics to share resources and their common culture (Logan et al., 2002) even if their residential choices are less constrained than those of African Americans. Because many of these ethnic communities exist in central-city areas, immigrants may still be at a disadvantage spatially. Further, recent evidence indicates that, while discrimination diminished during the 1990s, all minority groups still face adverse treatment in the rental and owner-occupied housing markets (Turner et al., 2002; Turner and Ross, 2003). Many Hispanics and Asians are likely to be immigrants.
However, it is an open question whether spatial concentration will disadvantage immigrants because of the documented reliance on ethnic networks and neighbourhood-based social ties in locating jobs (Elliott and Sims, 2001). In addition, immigrants are increasingly settling away from the urban core within metro areas (Singer et al., 2008; Massey, 2008). In 2007, slightly over half of US foreign-born residents lived in major metropolitan suburbs (Frey et al., 2009). Recent studies have characterised this increasingly decentralised residential pattern as ‘ethnoburbs’ (Li, 1998), ‘melting pot suburbs’ (Frey, 2001) and ‘suburban immigrant nation’ (Hardwick, 2008). Therefore, immigrants may suffer less from spatial dislocation from jobs than other minority groups. However, it might also be the case that suburbanised immigrants are located into lower-income immigrant enclaves in the suburban areas (Dawkins, 2009) and such residential mobility cannot be taken as an indicator of socioeconomic advancement (Lichter et al., 2010). These studies did not examine the changing geographical proximity to jobs that accompanied these residential patterns and it is unclear the extent to which immigrants’ residential mobility may have changed their job accessibility over time.
This paper thus fills an important gap in the literature on spatial mismatch between minorities and jobs by examining the impact of the evolving urban spatial structure in a sample of 60 of the largest immigrant-receiving metropolitan areas. Instead of focusing on labour market outcomes, the changing spatial distribution of jobs and residential distribution of immigrants is compared with that of native-born White and African American households to document the overall changes in these patterns. 2 Given residential segregation, employment decentralisation might increase the job proximity of some households while distancing from others, depending on their ability to adjust to employment shifts. The literature (Baird et al., 2008) has suggested that immigrants are able to follow job opportunities by altering their residential location choices via intermetropolitan moves, but it is not clear if the same holds true at the intrametropolitan level as well. If it is the case that immigrants tend to locate in closer proximity to jobs than Blacks, it might help to explain their overall higher employment rates (Camarota and Jensenius, 2009). To determine the impact of employment decentralisation on spatial mismatch, the overall change is decomposed to determine the portion of the shift due to the population shift alone and employment shift alone in an effort to understand whether employment is occurring towards or away from immigrant concentrations and how immigrants are adjusting to employment locations through their residential choices. Finally, county-level regression models are estimated to examine the various factors that underlie the evolving intrametropolitan distribution of jobs and residents between 1980–90, and 1990–2000.
Theory and Previous Research
The Residential Location of Immigrants
Understanding immigrants’ locational choices is an important and integral element in understanding their assimilation process. A formal theorising of spatial assimilation starts from Massey (1985), who largely adopts the earlier ecological model of spatial succession and invasion proposed in Park et al. (1925). This model predicts that, with their acculturation in the US society and accumulation of economic resources, immigrants disperse from their initial settlement in inner-city ethnic communities towards better-quality, native-majority suburban neighbourhoods. An opposing view holds that ethnic concentration and clustering may endure, even given immigrants’ higher socioeconomic status. Place stratification literature suggests that the persistence of structural barriers in the housing market may perpetuate residential segregation over time. A recent study reveals that immigrant segregation in 2000 is at its century-high (Cutler et al., 2008). While the Black segregation level declined modestly at the national level between 1980 and 2000, Hispanic and Asian segregation remained unchanged or rose in most metropolitan areas (Logan et al., 2004).
The emergence of high-status suburban immigrant communities (Li, 1998; Logan et al., 2002) and the fact that many immigrants choose suburban residential locations immediately upon arriving in the US (Alba et al., 1999) questions the validity of stereotypical spatial assimilation theories. The quality of such a suburbanising residential pattern for the general immigrant population lacks definite evidence. Suburban residence does not necessarily bring immigrants into closer contact with the White native-born population, as traditional spatial assimilation theory would suggest. This might be attributable to the fact that immigrant households are sorting themselves into lower-status immigrant enclaves in the suburban areas and those with a higher existing suburban immigrant and minority population (Dawkins, 2009; Timberlake et al., 2011). However, it is not clear how their evolving residential arrangement changes their proximity to job opportunities. Dispersed residential locations might bring immigrants closer to jobs in the context of employment suburbanisation, but, if the areas that immigrants move to are not the areas that experience economic growth, then suburbanisation will not necessarily increase their job proximity. This paper thus provides a broad and dynamic perspective on this question.
The Spatial Pattern of Employment
Theories on the location of firms begin with the von-Thünen-type monocentric model which states that the trade-off between land rent and transport costs determines firms’ optimal locations. Urban spatial structure evolves as industries with different bid–rent functions compete for land uses (O’Sullivan, 2000). The decentralisation of employment in American metropolises accelerated in the second half of the 20th century and recent statistics show that this trend is not slowing: a quarter of central cities experienced job losses and more than three-quarters lost their private-sector employment share to suburbs between 1993 and 1996 (Brennan and Hill, 1999) and in 1996 a third of people worked more than 10 miles from the city centre (Glaeser et al., 2001). Recent statistics show that most employment (72 per cent) is located more than five miles from CBDs (Raphael and Stoll, 2010).
The factors underlying this trend include: innovations in technologies that make production more flexible and suburban locations more accessible; the development of interstate highways and suburban airports which diversify means of transport from a single central export node and reduce transport costs; and, the suburbanisation of population that both provides suburban firms with ample local labour supply and also constitutes the demand and clientèle for their produced goods and services (Mieszkowski and Mills, 1993; O’Sullivan, 2000). As a consequence, sub-centres emerge that serve as employment nodes in the polycentric urban structure (Anas et al., 1998). Within this general pattern, the suburbanisation of manufacturing, service and retail jobs is especially prominent and these are exactly the sectors in which low-skill jobs heavily concentrate. Relatively insensitive to knowledge spillover and other proximity advantages of the central cities, manufacturing firms are attracted to the suburbs for their cheaper land rents, convenient transport and lower congestion. Service firms and retailers also find suburban locations attractive as the growing suburban population provides a stable clientèle. Manufacturing, construction, and services are among the industries that are most suburbanised (Kneebone, 2009).
Given residential segregation in American metropolitan areas, it can be expected that employment decentralisation will increase the job proximity of some households while taking jobs away from others. The degree of proximity between residents and jobs over time partly depends on residents’ ability to adjust their residential locations in response to employment location change. It has long been argued that continued job sprawl has made these jobs increasingly inaccessible to inner-city Black residents over time (spatial mismatch hypothesis, Kain, 1968; see Ihlanfeldt and Sjoquist, 1998, for a review). Martin (2001) showed that between 1970 and 1990 the spatial disparity between the distribution of employment and distribution of Blacks increased by 20 per cent. Black population shifts eliminated about 57 per cent of the increases in the spatial mismatch index caused by employment shifts. For the period between 1990 and 2000, Raphael and Stoll (2002) found that Blacks’ overall proximity to jobs improved slightly and that the gap between Blacks and jobs narrowed by 13 per cent. However, they remained the most physically isolated from jobs across all groups in 2000. The modest progress is due entirely to the residential movement of Black households. The movement of jobs alone over the decade would have increased spatial mismatch between Blacks and jobs. No study has examined how job sprawl has changed the spatial mismatch conditions for immigrant populations.
Spatial Mismatch between Immigrants and Jobs
Despite the continued growth of the immigrant population around the country, very few studies address the effect of residential segregation on immigrants’ employment accessibility. Aponte (1996) began the inquiry for immigrants and found that Mexican workers are an ‘exception’ to the spatial mismatch hypothesis as they consistently have a relatively high employment rate compared with native-born minority workers, which might be attributable to their strong social networks in job search and employers’ hiring strategies. Pastor and Marcelli (2000) found that individual skills matter more than ‘pure’ spatial mismatch in Los Angeles, especially for recent Latino immigrants. Also for Los Angeles, Painter et al. (2007) underscored the importance of space and the spatial variation in job growth for Latino and second-generation immigrant youth employment probabilities, but not for first-generation immigrants. As regards commuting, Preston et al.’s (1998) results indicate the persistence of spatial barriers faced by immigrant workers as evidenced by their overall longer commutes than their native-born counterparts in central New York CMSA. Liu (2009) documented that Latino immigrants living in job-poor central cities tend to have both lower employment probability and longer commutes than their suburban counterparts.
Most of the spatial mismatch studies on immigrants focus on selected case study areas for a given point in time. As immigrants have started to move in large quantities to most metropolitan areas (Painter and Yu, 2010), it is important to develop an understanding of how the magnitude of immigrants’ spatial disparity between jobs and residential location has changed for a broad cross-section of the US. Given the highly local nature of immigrants’ employment concentration (Ellis et al., 2007), it can be hypothesised that their degree of spatial mismatch with jobs will be reduced over time with their suburbanising residential pattern.
Overall, the literature suggests that both the White population and jobs have been decentralising. It is expected that immigrant populations will be following those jobs. Further, it would be expected that immigrant populations may be quicker at following jobs than the Black population due to the fact that they may have less developed social networks in many of the metropolitan areas and due to the fact that many immigrants may have moved directly from their country of origin to the locations of greatest job growth. Therefore, one would expect less spatial mismatch for immigrants than for the Black population.
Data and Context
Data for this research are primarily drawn from the Decennial Census County and City Data Books for years 1980, 1990 and 2000 and are accessed from Census Bureau website. These datasets feature a wide range of statistics on the population, employment (by industry) and other characteristics of each county, which are essential for this study. Among them, data on population are drawn from the Decennial Census and employment statistics are drawn from the Economic Census’ County Business Patterns. Counties are chosen as the geographical sub-units on which the metropolitan-level spatial mismatch index is calculated for their consistency in boundary over time. While the initial spatial mismatch conceptualisation of Kain (1968) involves testing spatial structure and its economic implications at a more nuanced level, counties have been used in similar research design for Blacks before (Martin, 2001, 2004). Other studies have used zip-code level as the analytical unit for calculating the spatial mismatch index, but statistics on immigrants are not available at the zip-code level. One disadvantage stemming from the use of counties is that they can be relatively large, especially in certain metropolitan areas, but their consistency in boundary over time and the availability of relevant information for all population groups, industries and contextual variables serve the purpose of this study very well. While the magnitude of the spatial mismatch index would necessarily differ according to different geographical scales, as long as the same methods are applied to all sub-groups and time-periods, direct comparison can be obtained. 3
The definition of metropolitan areas in the US underwent a major change at the turn of the century, with the Office of Management and Budgeting (OMB) publishing a new classification of metropolitan areas (OMB, 2003) which supersedes the previous set of definitions (OMB, 1999). 4 The basis of such change is a re-evaluation of the economic activities and connectivity among sub-units (counties) within a region, especially commuting patterns across counties in the context of decentralised residence and employment (Frey et al., 2004). County composition of MSAs is identified based on the new definition and a consistent spatial boundary is kept from 1980 through 2000 in order to trace the evolution of residential and employment locations within these metropolitan areas over time.
To conduct the analysis, we initially select all of the counties that were part of the top 100 US metropolitan areas with largest immigrant population in 2000. We first removed the MSAs that contain a single county from the dataset (35 MSAs fall into this category). Another five MSAs are removed from the analysis sample because they have a single county dominating the metropolitan area economic activities (share of MSA population and employment exceeds 98 per cent). The resulting sample is comprised of 60 MSAs, including 450 counties. These 60 MSAs were home to 74 per cent of all immigrants in the country as of 2000 and thus constitute a representative sample of this population.
While there exist numerous ways of measuring spatial decentralisation and sprawl across different dimensions (Jaret et al., 2009), we measure spatial decentralisation using the following approach. Each of the 60 metropolitan areas is divided into centre and ring counties. The centre counties are those that include the central cities for the MSA and the rest of the counties in a MSA are termed ring counties. In several instances, the central city is not situated within any county. In those cases, the city is identified as the centre with all counties as ring counties. Specifically these are Baltimore City in Baltimore–Towson MD MSA, St Louis City in St Louis, MO–IL MSA, Virginia Beach City in Virginia Beach–Norfolk–Newport News VA–NC MSA and the District of Columbia in Washington–Arlington–Alexandria DC–VA–MD–WV MSA.
Table 1 presents ring counties’ share of metropolitan area total employment between 1980 and 2000 and indicates a clear pattern of employment shift from the centre to rings in most MSAs examined. In the 1980s, all but 18 MSAs witnessed an increase of employment share in ring counties. In the 1990s, all but nine MSAs experienced the same trend. Across the 20 years, 11 centre counties gained employment share from ring counties, with the most notable ones being Charlotte-Gastonia-Concord (8.2 percentage points), Virginia Beach–Norfork–Newport News (7.6 percentage points), Richmond (5.7 percentage points), Raleigh–Cary (4.8 percentage points), Allentown–Bethlehem–Easton (4.5 percentage points) and Durham (4.3 percentage points). In all the other 49 MSAs, centre counties lost employment share to ring counties to various degrees. The largest shifts occurred in St Louis (18.3 percentage points), Denver–Aurora (17.1 percentage points), Detroit–Warren–Livonia (15.8 percentage points), Baltimore–Towson (15 percentage points), Milwaukee–Waukesha–West Allis (12.7 percentage points), New Orleans–Metairie–Kenner (12.5 percentage points), Atlanta–Sandy Springs–Marietta (12.4 percentage points), Washington–Arlington–Alexandria (11.3 percentage points), Portland–Vancouver–Beaverton (11.1 percentage points) and Cincinnati–Middleton (10.8 percentage points). Overall, Table 1 demonstrates that ring counties’ share of MSA employment increased from 44.7 per cent to 48.6 per cent between 1980 and 2000, an increase of 8.7 per cent (or 3.9 percentage points). While employment decentralisation continues across US metropolitan areas, the average rate of change has slowed in the 1990s compared with the previous decade.
Ring counties’ share of MSA employment, 1980–2000
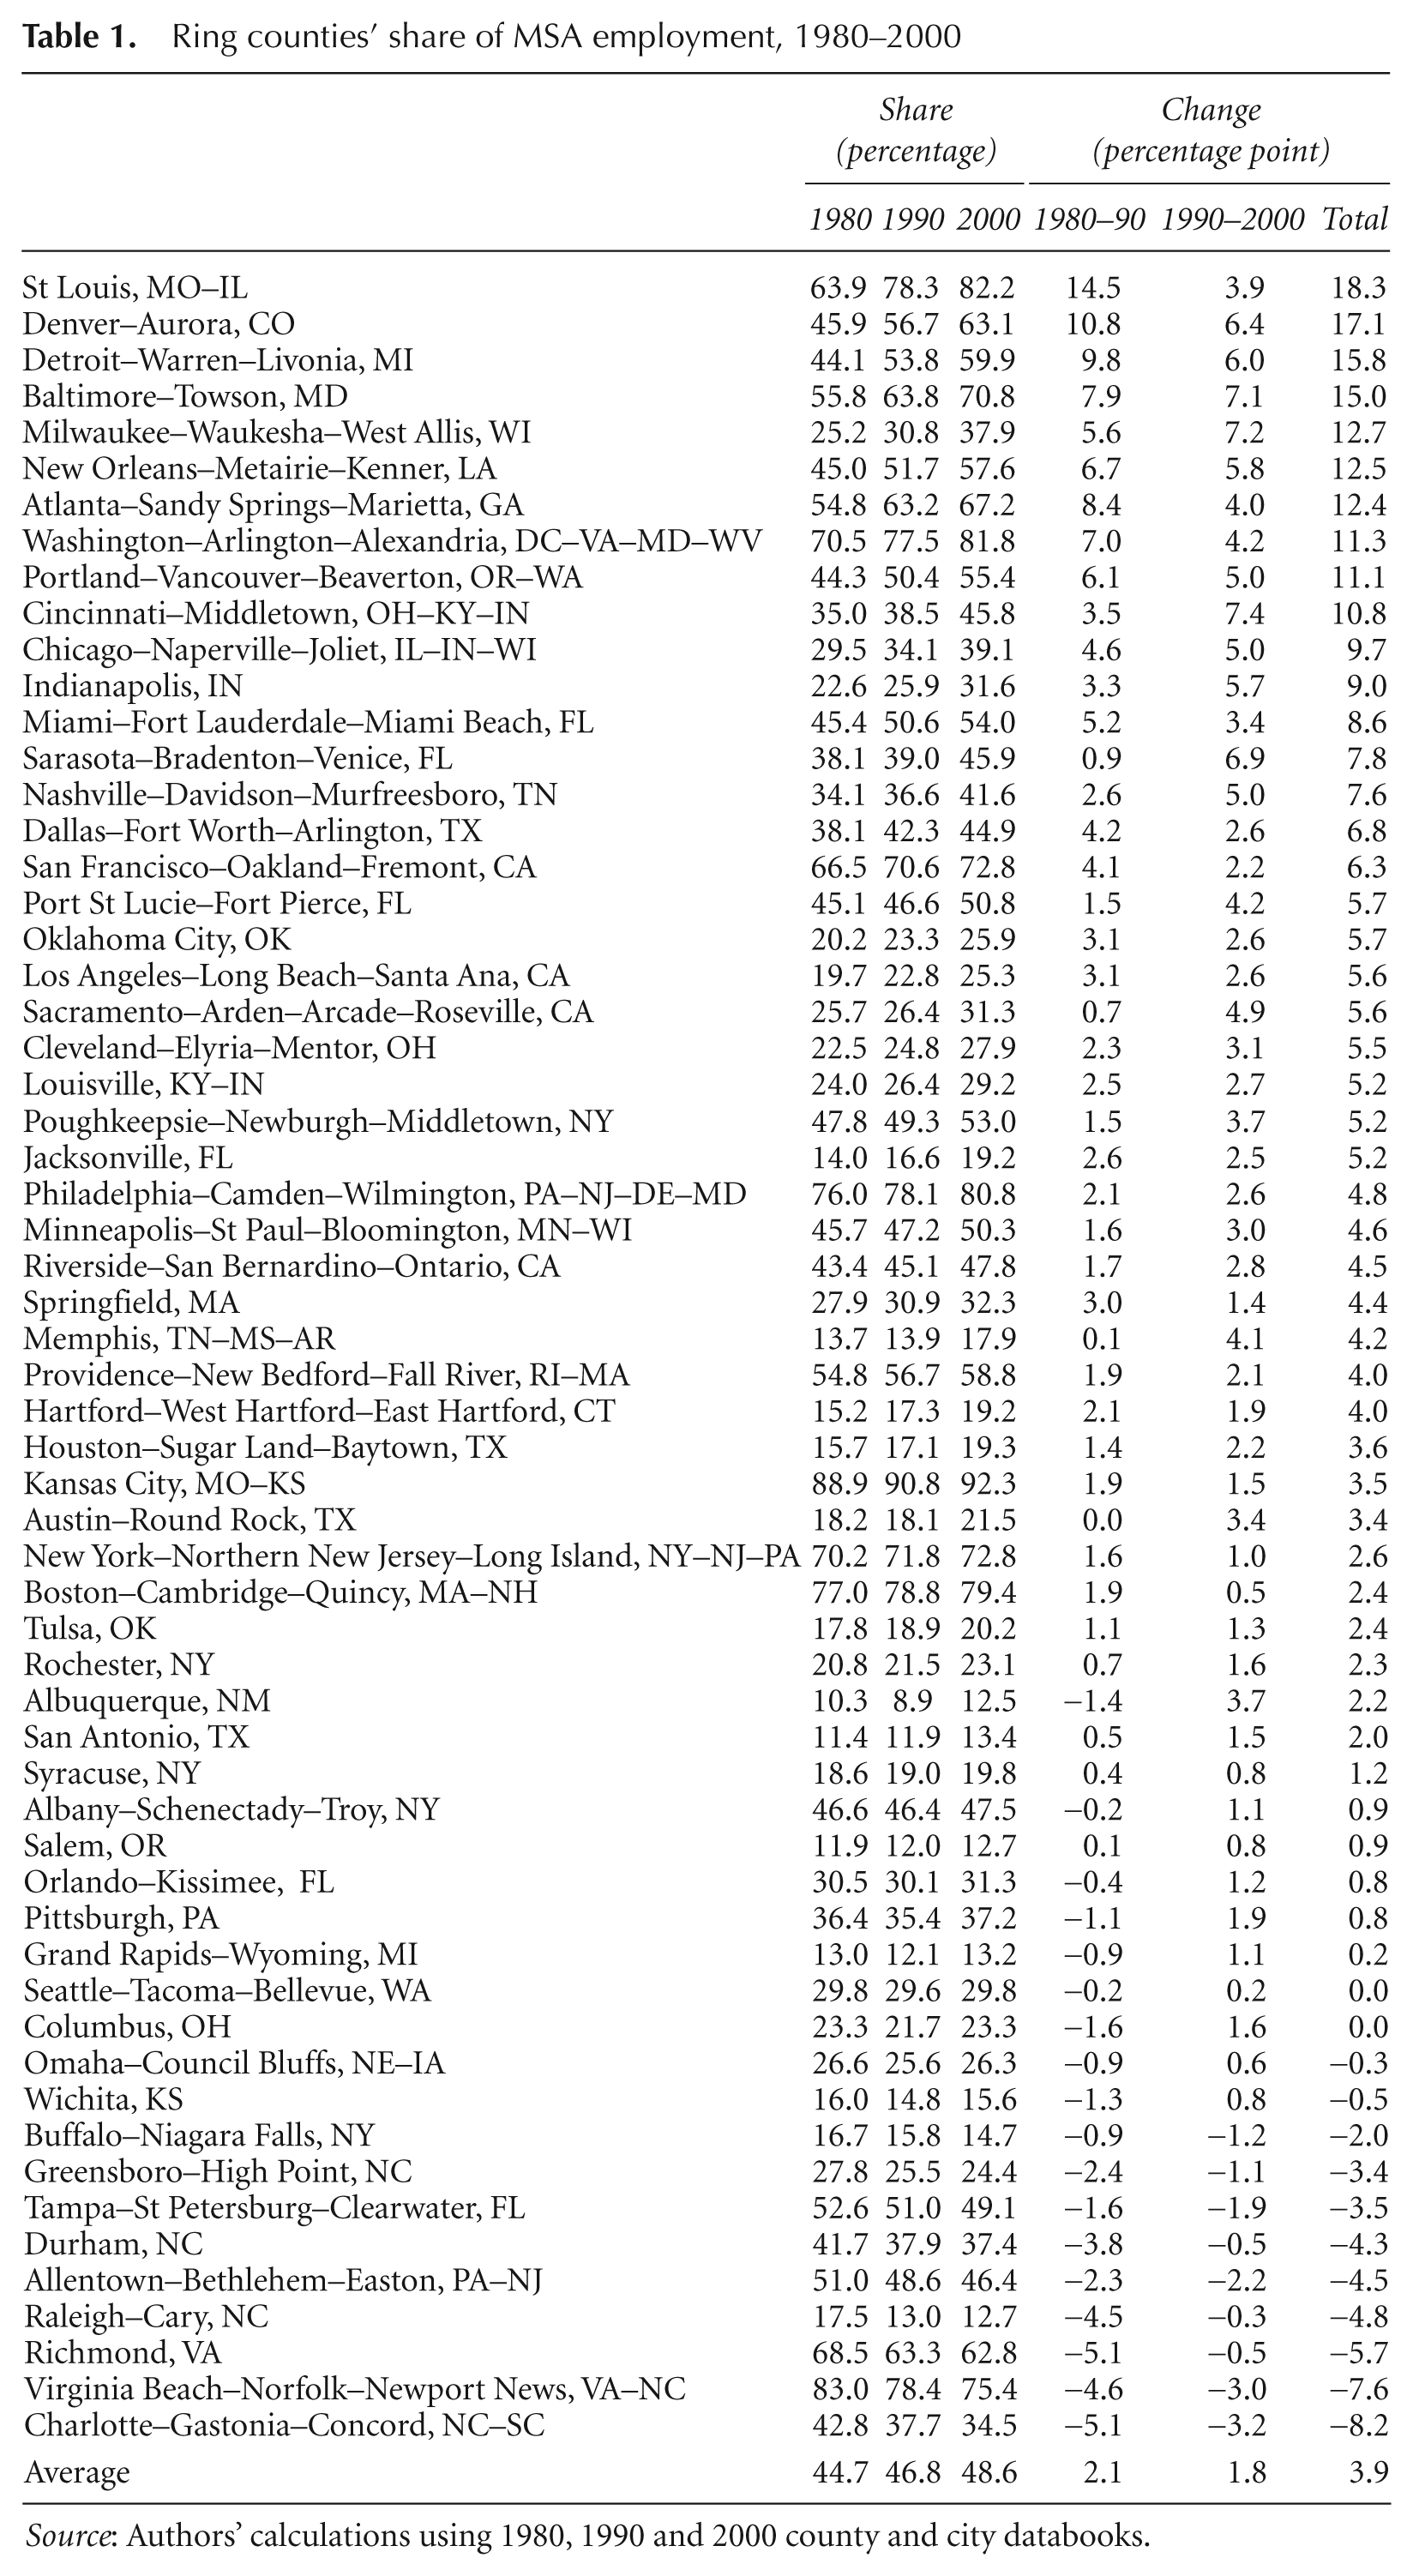
Source: Authors’ calculations using 1980, 1990 and 2000 county and city databooks.
The intrametropolitan shifts of the immigrant population between centre counties and ring counties demonstrate a pattern of both the centralisation of the immigrant population in some metropolitan areas and the suburbanisation of the immigrant population in others. As Table 2 shows, of all the 60 MSAs, around half experienced a loss of immigrant share from the centre counties to the surrounding ring counties, while the other half gained immigrant share in the centre during the 1980s, 1990s, as well as across the 20 years. The MSAs which experienced the largest increase of immigrant population in the ring counties during the 1980–2000 period include Atlanta–Sandy Springs–Marietta (20.4 percentage points), Cincinnati–Middletown (15.2 percentage points), New Orleans–Metairie–Kenner (14.9 percentage points), Baltimore–Towson (13.0 percentage points), Portland–Vancouver–Beaverton (11.9 percentage points), Miami–Fort Lauderdale–Miami Beach (11.7 percentage points) and Detroit–Warren–Livonia (11.3 percentage points). At the same time, the share of the immigrant population shrank significantly in ring counties in some other MSAs. Among those are Port St Lucie–Fort Pierce (-18.8 percentage points), Tampa– St. Petersburg–Clearwater (-15.2 percentage points), Virginia Beach–Norfolk–Newport News (-11.6 percentage points), Providence–New Bedford–Fall River (-11.3 percentage points) and Omaha–Council Bluffs (-10.5 percentage points). It is worth noting that these are net changes in ring counties’ share of immigrants. Therefore, we are not able to distinguish between the intrametropolitan movement of existing immigrants and the residential location choice of newly arrived immigrants from elsewhere in the US and from abroad. As this paper is concerned with immigrants’ changing residential redistribution in relation to employment redistribution, no employment outcome is explicitly tested. 5
Ring counties’ share of MSA foreign-born population, 1980–2000
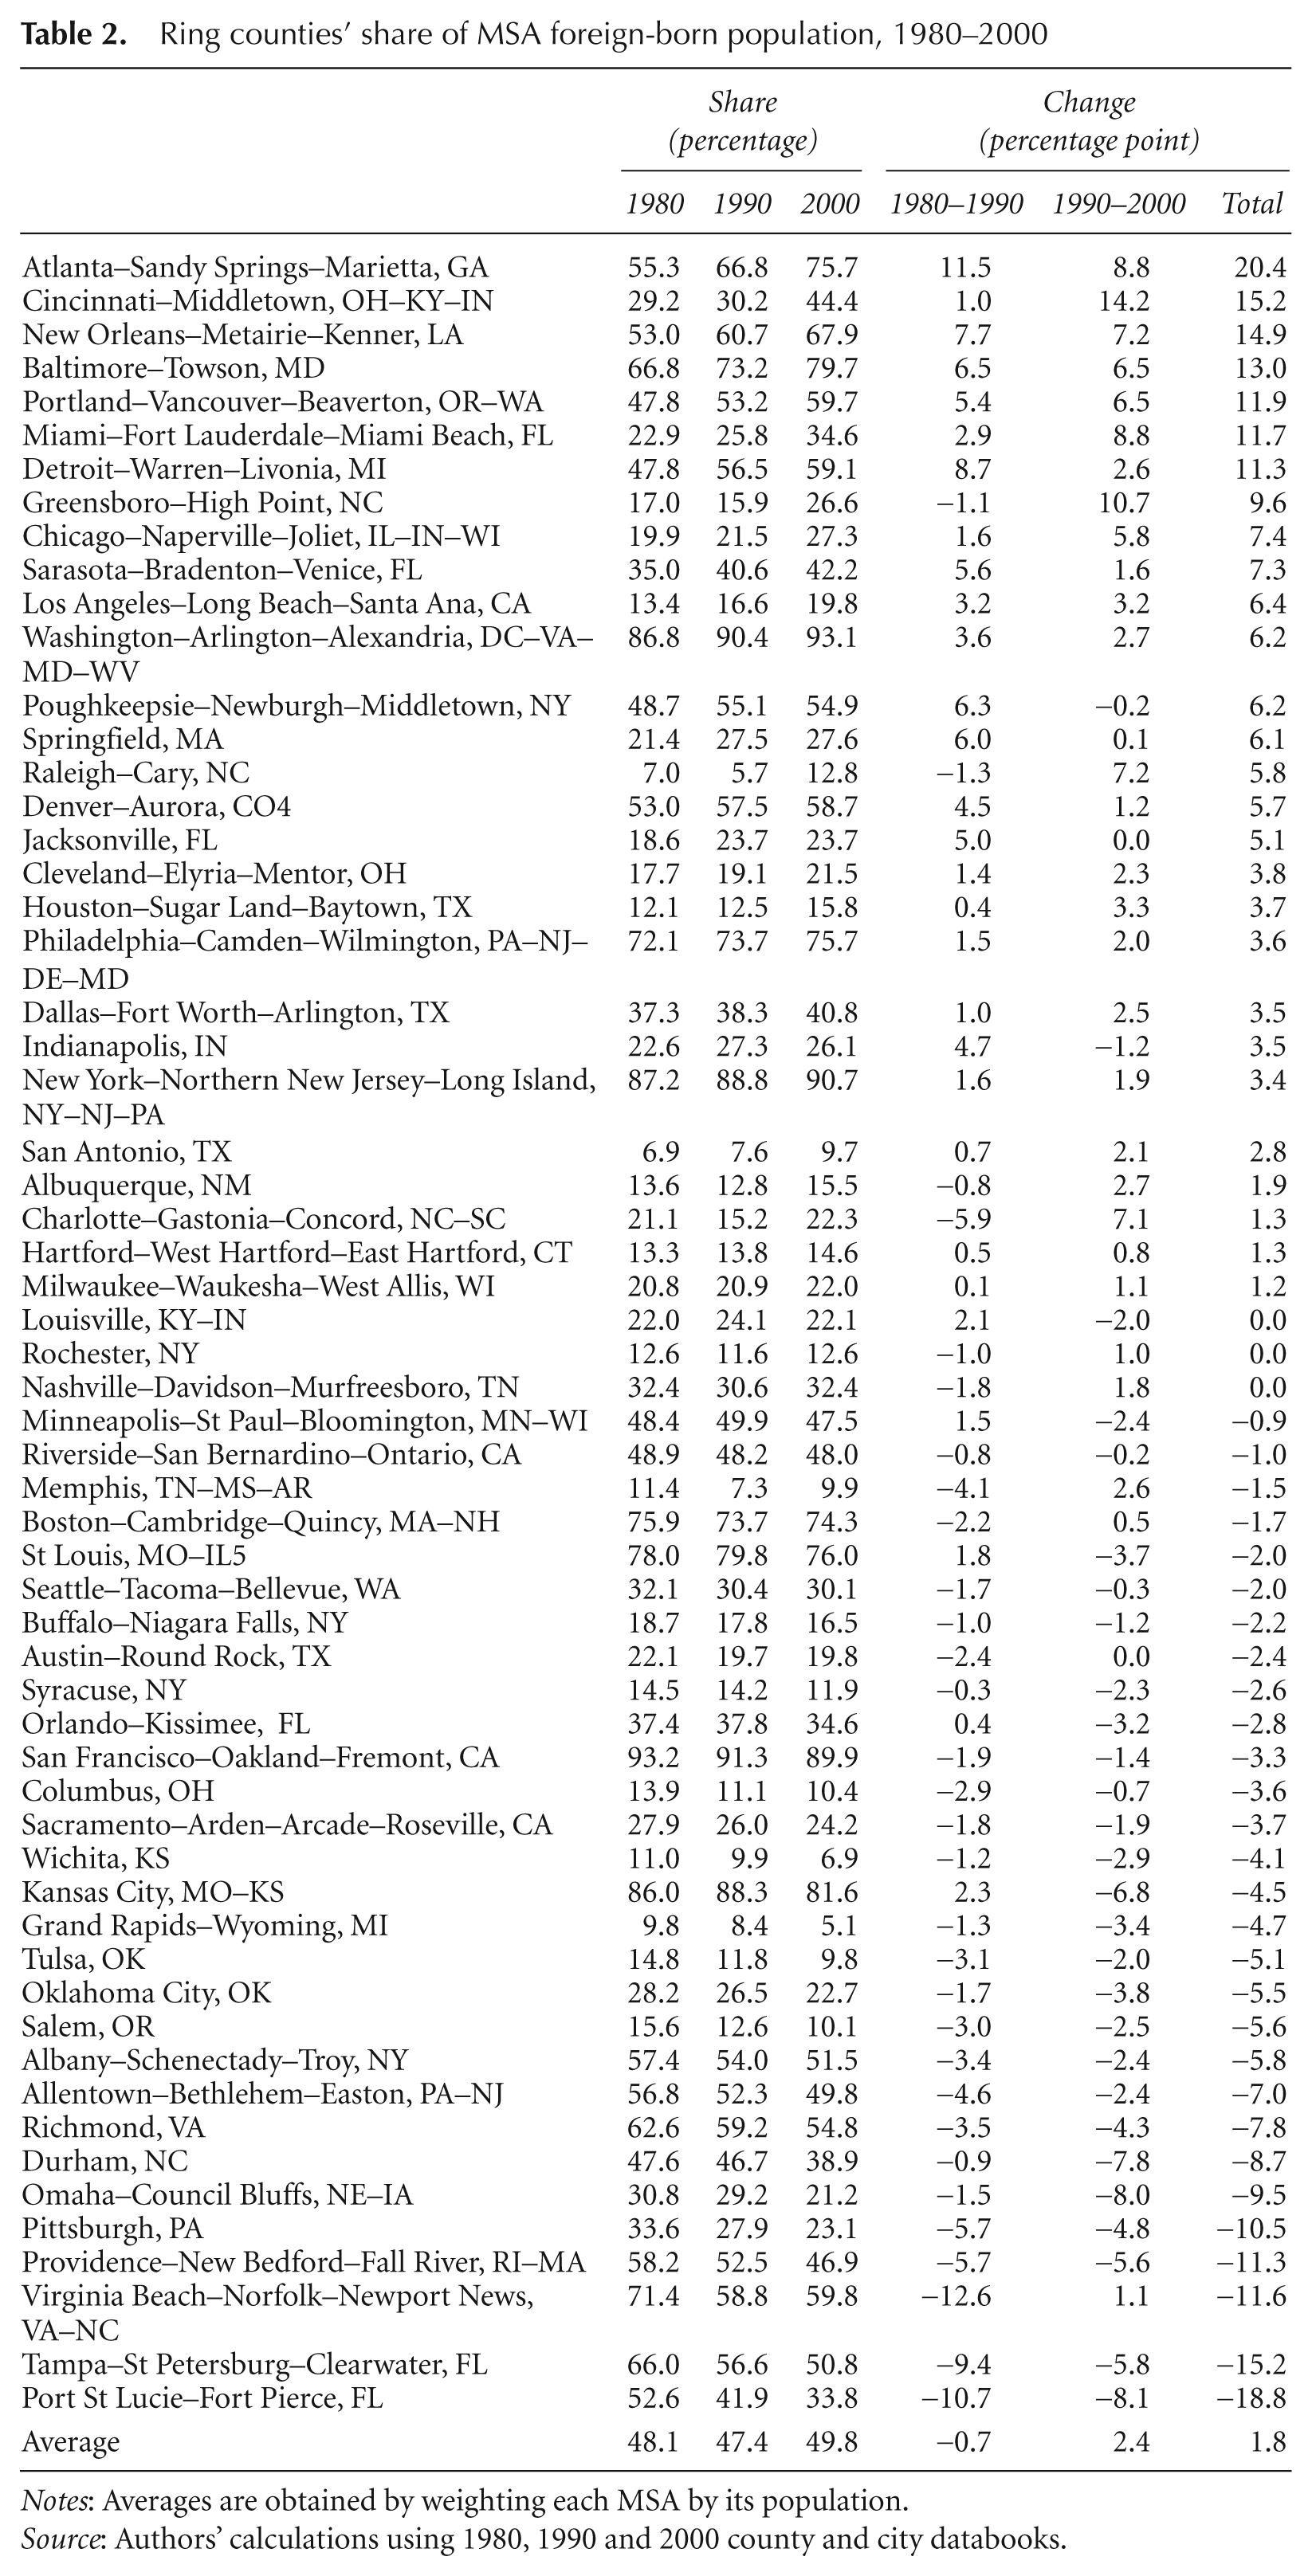
Notes: Averages are obtained by weighting each MSA by its population.
Source: Authors’ calculations using 1980, 1990 and 2000 county and city databooks.
By way of comparison, Table 3 summarises the average ring county’s share of metropolitan area native-born White and Black populations among 60 MSAs. Overall, 59.3 per cent of the White population live in suburban counties in 2000, an increase from 56.2 per cent in 1980 and 57.5 per cent in 1990. While the White population is more suburbanised than the immigrant population, the Black population began the sample period more centrally located than were immigrants. Approximately 40 per cent of the Black population lived in suburban counties in 1980, but this number increased to 45.3 per cent in 2000. This increasing rate of suburbanisation might reflect the reduction of various barriers they face in locating in suburban neighbourhoods.
Ring counties’ share of MSA populations (60 MSA average), 1980–2000
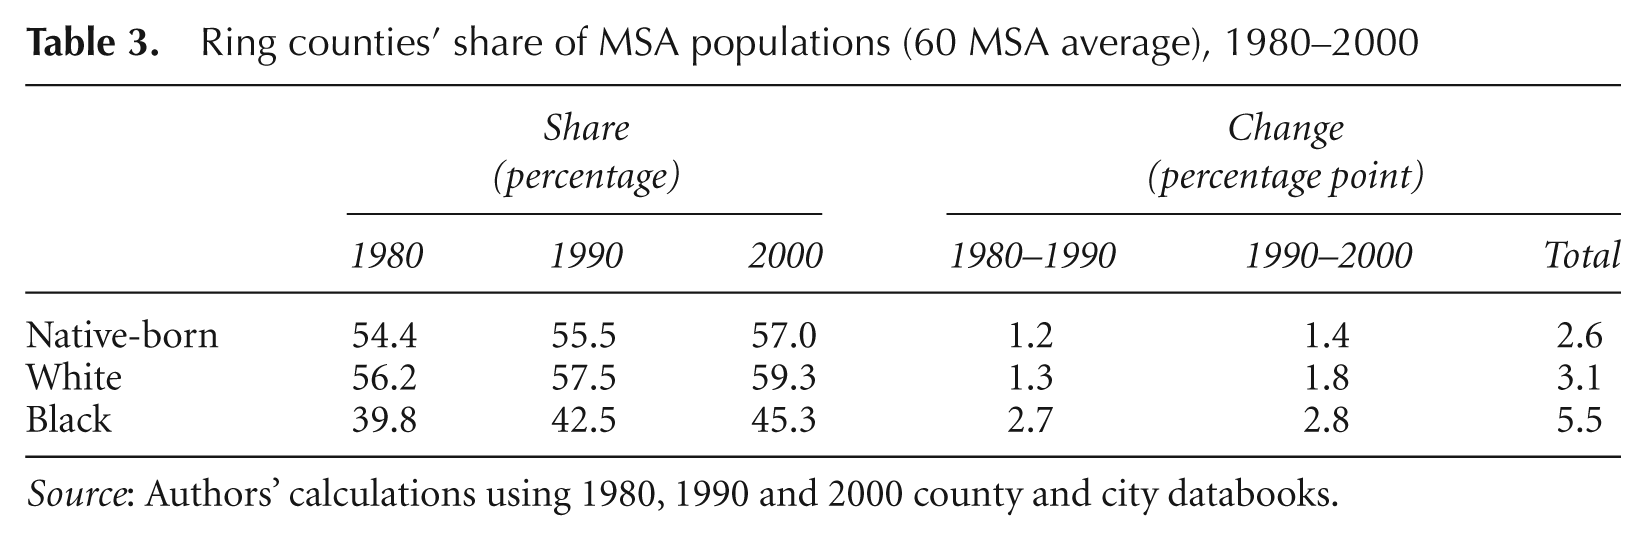
Source: Authors’ calculations using 1980, 1990 and 2000 county and city databooks.
Results
Spatial Mismatch Index
As noted previously, the spatial organisation of both residents and employment in metropolitan areas has changed over recent decades. One way of measuring the net effect of the movement of population and jobs within a metropolitan area is through a spatial mismatch index (SMI). This index allows for both intertemporal comparisons of the movement of population and jobs and for the testing of the persistence and degree of spatial mismatch over time. This index is adapted from the concept of a dissimilarity index in the residential segregation literature (Massey and Denton, 1988) and has been applied to measure the spatial disparity between Blacks and jobs (Martin, 2001; Raphael and Stoll, 2002). Formally, the spatial mismatch index (SMI) is expressed as

where i = (1, …, n) and refers to each geographical sub-unit (for this paper, it is the county) in the metropolitan area. In this analysis, E i and P i are the employment and population in a given county respectively. E and P are the employment and population for the metro as a whole. Multiplying this proportion by 100, the SMI can be interpreted as the percentage of residents that need to be relocated in order to achieve an even balance between the distribution of employment and residents. It is worth noting that the spatial mismatch index does not take into account the physical distance between jobs and residents, only their relative distribution among geographical sub-units.
This index is calculated for immigrants and the native-born, White and Black populations for the three years of 1980, 1990 and 2000. An increase in SMI indicates a higher level of separation between jobs and residents and a higher percentage of jobs/residents that would need to move to achieve a jobs/housing balance, while a decrease of SMI indicates a convergence between the distribution of jobs and people. The change in SMI within each decade is further decomposed into shifts in population alone and shifts in employment alone in order to gauge the sources of change in spatial imbalance over time. This is achieved by hypothetically holding population distribution from the previous time-period constant and using employment distribution from the current time-period to construct SMIs that take into account one shift at a time. These changes are calculated for 1980–90, 1990–2000 and 1980–2000.
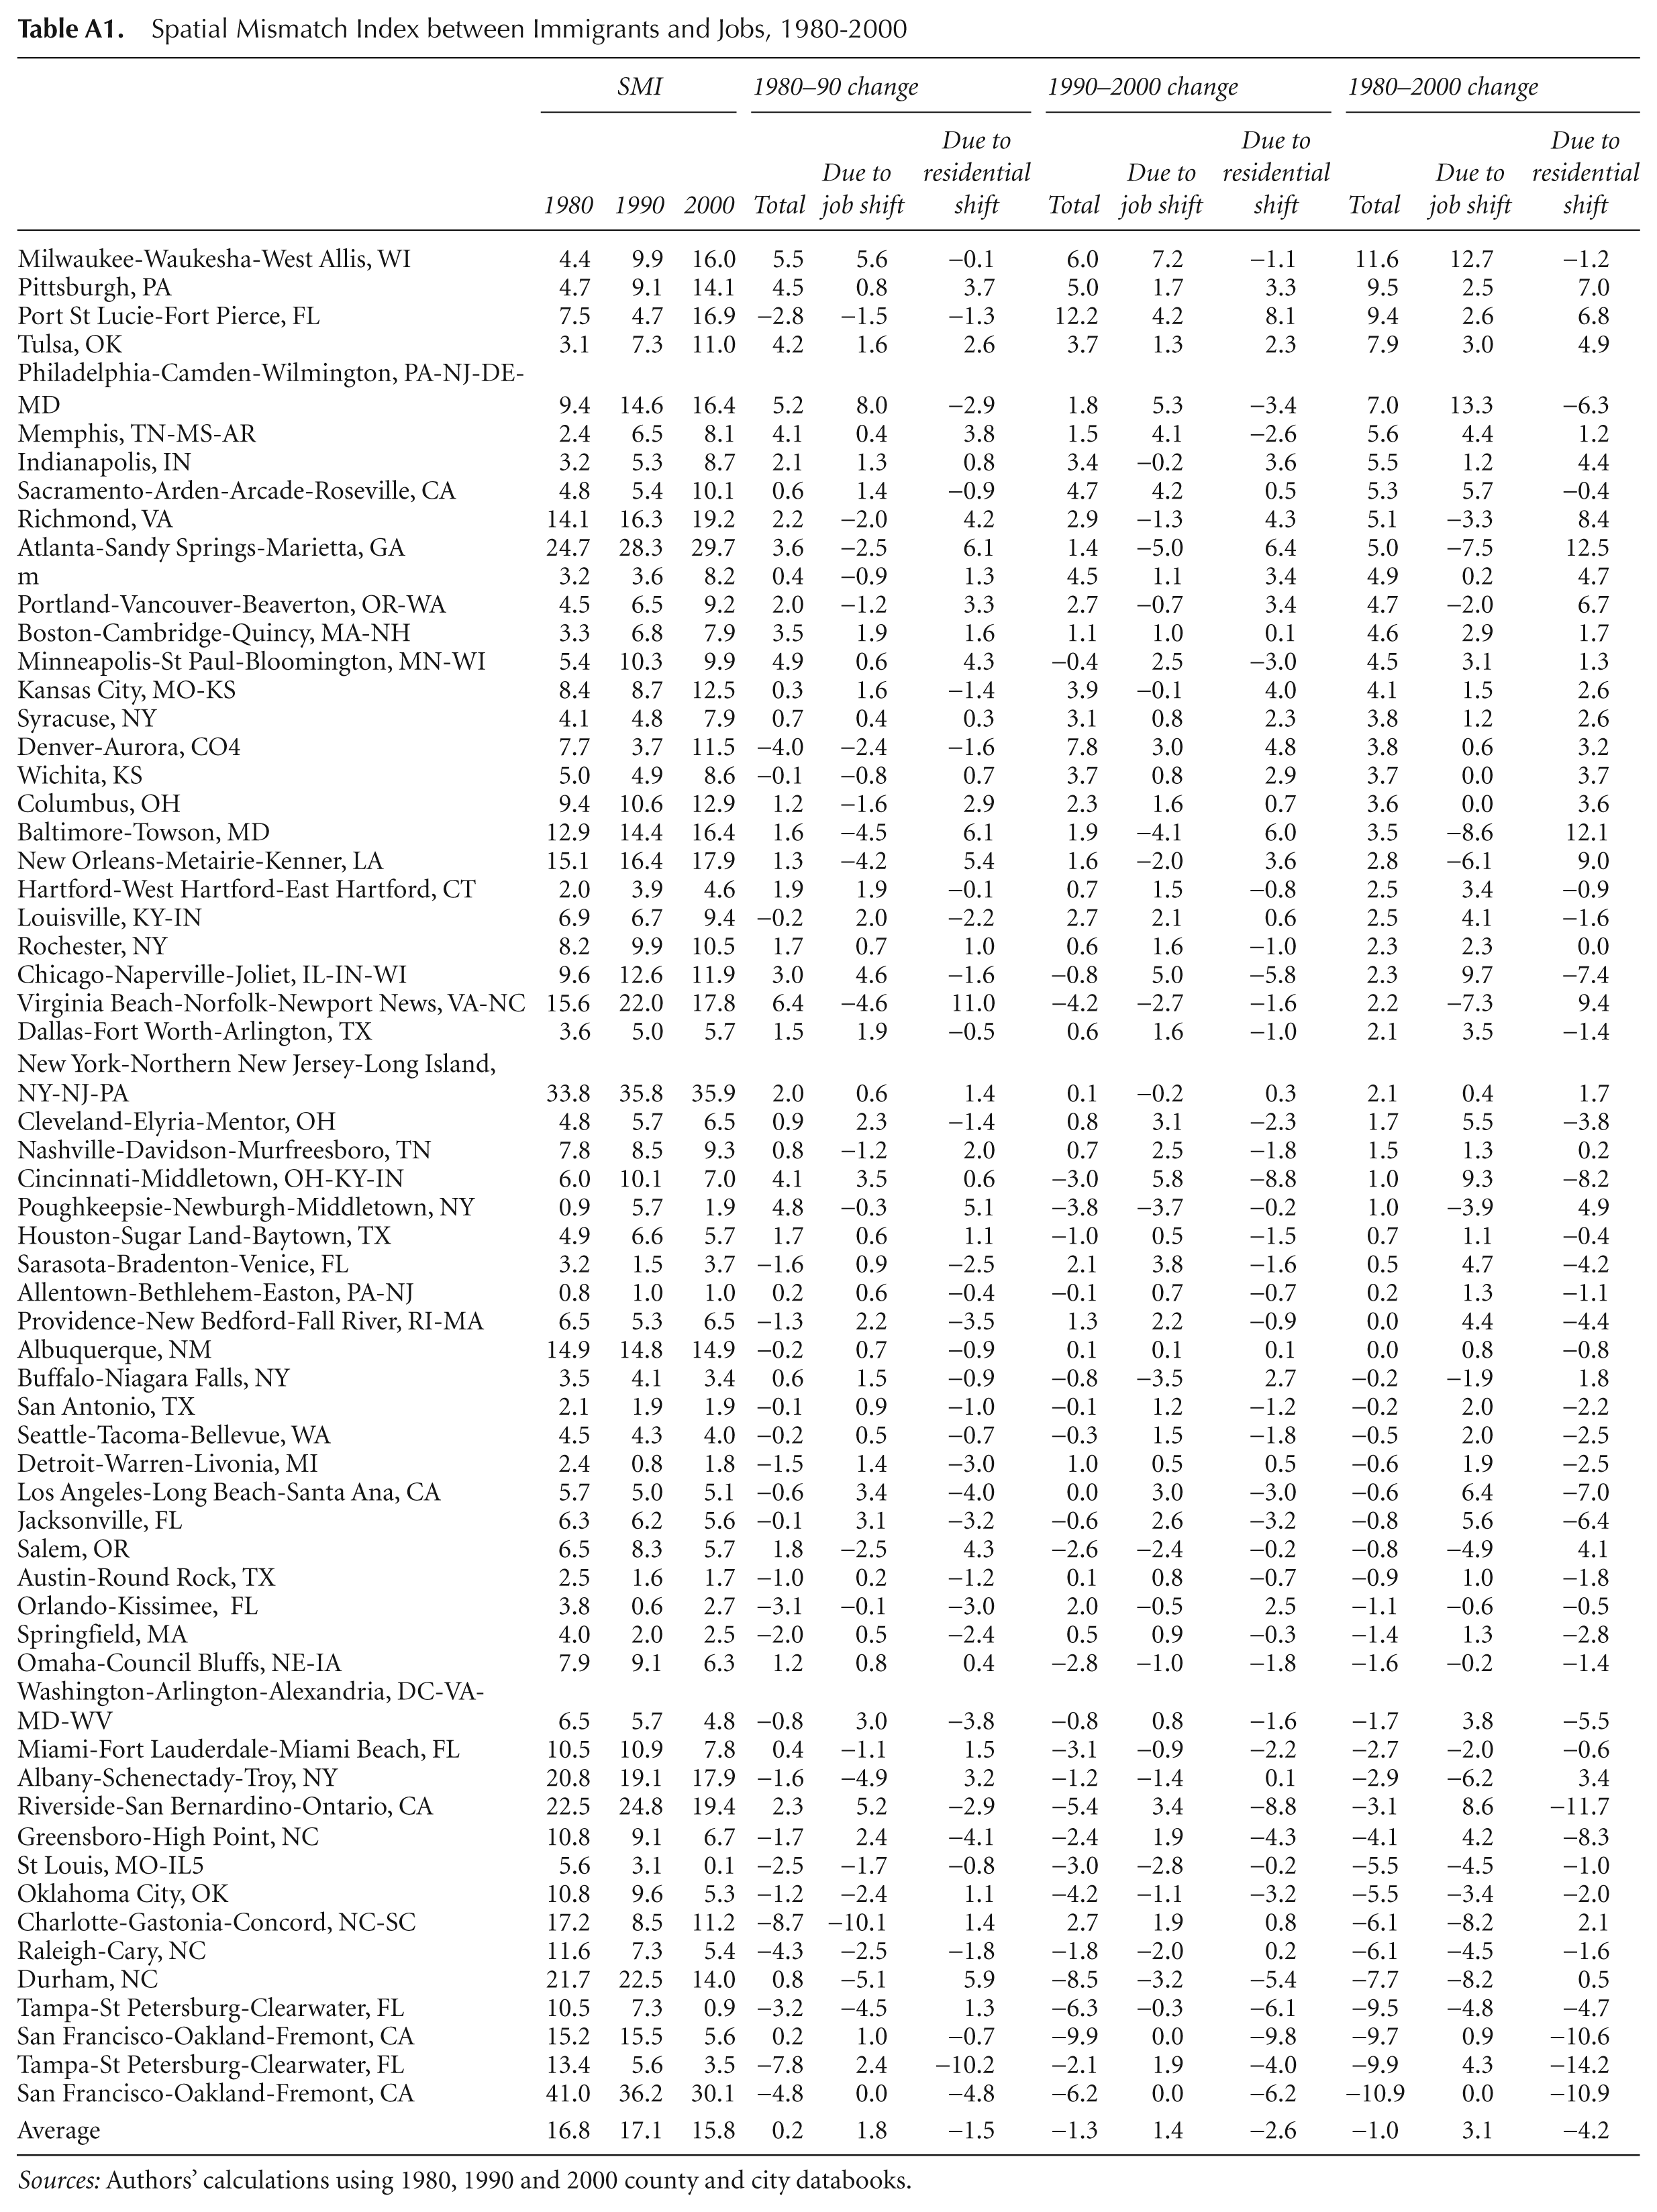
The average SMIs between jobs and immigrants, as well as between jobs and the native-born White and Black populations are presented in Table 4. Table 4 presents average statistics calculated by weighting each MSA by its total population (see the Appendix, Table A1, for detailed statistics for the immigrant population). 6 Some interesting patterns emerge when comparing the SMIs for these different groups over the 20-year period. The overall spatial imbalance between jobs and residents is largest for the native-born Black population and smallest for the native-born White population. The immigrant population has an index level of spatial mismatch that is in between the White and Black population, with values of 16.8 in 1980, 17.1 in 1990 and 15.8 in 2000. The change in the index over the two decades reveals that there is an overall decline across metropolitan areas in the SMI of 1 percentage point. However, actual changes across metropolitan areas range from 11.6 percentage points in Milwaukee–Waukesha–West Allis to negative 10.9 percentage points in San Francisco–Oakland–Fremont (Appendix, Table A1). Once the total change is decomposed into employment shifts alone and population shifts alone, 7 it is evident that between 1980 and 2000, jobs occurred away from where immigrants lived, thereby increasing SMI by 3.1 percentage points. However, immigrants were attracted to where jobs are, lowering SMI by 4.2 percentage points and resulting in a total SMI reduction of 1 percentage point. Between the two decades, the suburbanisation of the residential location of immigrants increased in the 1990s when compared with the 1980s, bringing immigrants in closer proximity to jobs. In sum, immigrants became more spatially mismatched from jobs as jobs occurred away from their residential locations. However, their residential location choices brought them closer to job opportunities, offsetting the adverse effect of employment decentralisation and achieving a more balanced spatial distribution.
Spatial mismatch index between residents and jobs, 1980–2000
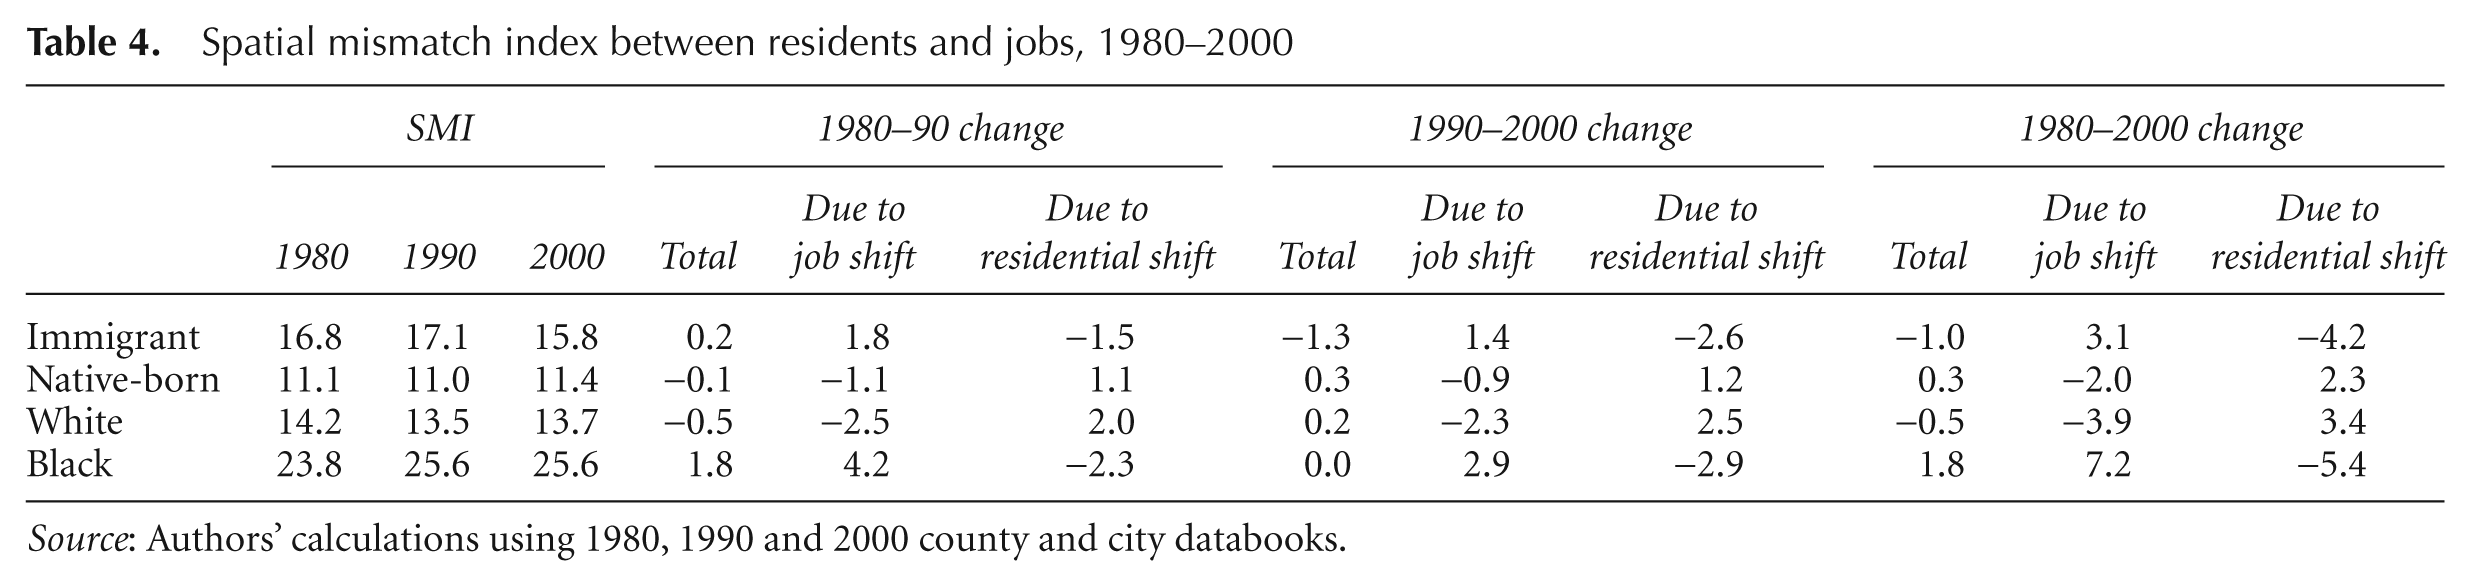
Source: Authors’ calculations using 1980, 1990 and 2000 county and city databooks.
The intrametropolitan dynamics between jobs and native-born White residents are in the opposite direction. While at the beginning of each decade the distribution of native-born White populations are on average more identical to distribution of jobs than immigrants, they tend to move away from jobs. However, employment growth shifts towards the fringes of the urban areas, offsetting the otherwise increasing spatial disparity. Over the two decades, jobs gravitated towards White residents at a faster rate than Whites suburbanised, resulting in a reduction of spatial mismatch between 1980 and 2000. Conversely, Blacks are even more spatially segregated from job opportunities than immigrants, as evidenced by a high SMI of 23.8 in 1980 and 25.6 in both 1990 and 2000. As with immigrants, jobs growth occurred away from Black residents, but at a more dramatic rate than for immigrants. The residential mobility of Black residents was able partially (1980s) or even totally (1990s) to offset the resultant enlarging spatial disparity. It is worth noting that Black residents are moving towards jobs at a higher rate than immigrants, which might be partially explained by their more concentrated location pattern in central counties in 1980. 8
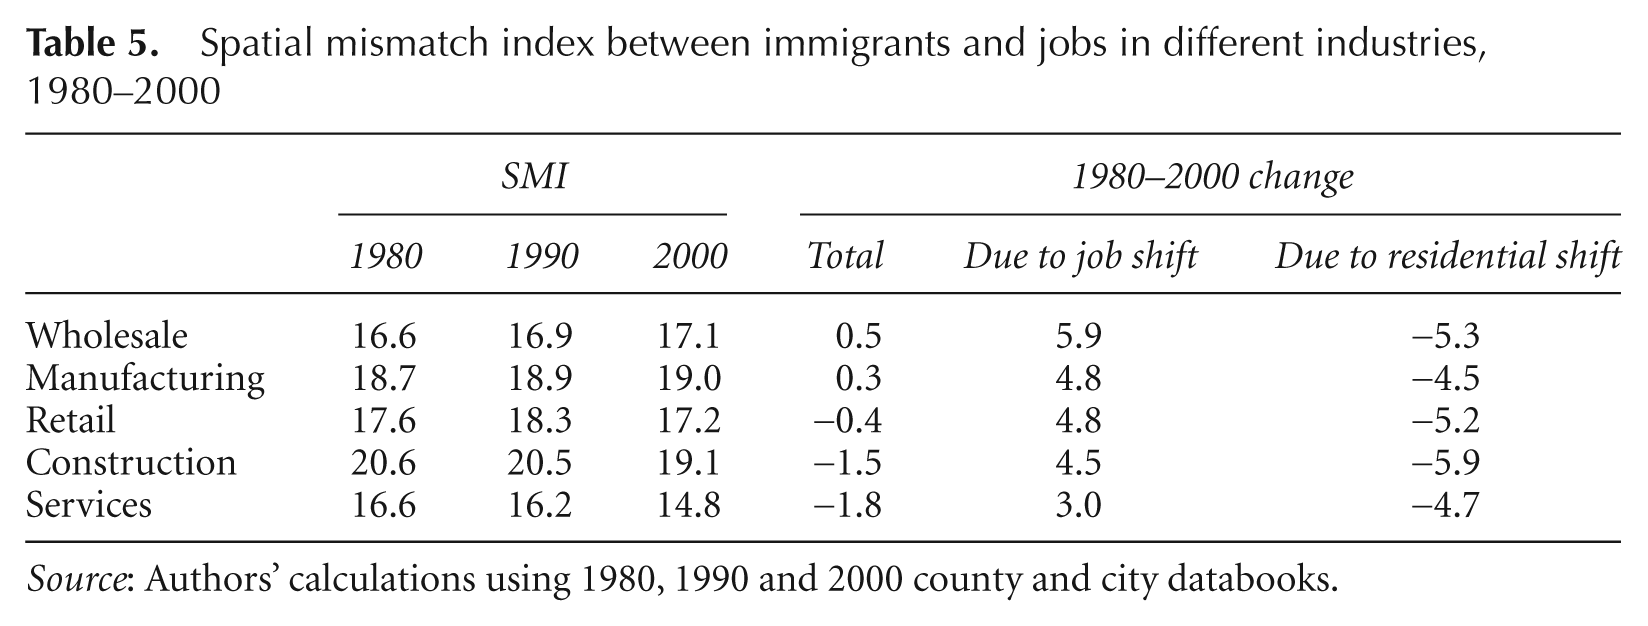
Within the context of job decentralisation, Table 5 demonstrates the contribution of industry job movement to compare the relative contribution of each industry using the SMI for immigrants. There are clear differences by industry. Immigrants’ residential shifts occurred closest to where the services and construction jobs are located causing a reduction in the SMI, even though these jobs had shifted away from the initial location of immigrants. On the other hand, growth in wholesale, manufacturing and retail jobs diverges from the initial locations of immigrants at faster rates and immigrant residential mobility did not always make up for the difference in spatial disparity caused by the shift in the location of jobs. Therefore, the SMI fell by 1.5 to 1.8 percentage points for service and construction jobs, and either rose or fell in the other industries by about half a percentage point.
Spatial mismatch index between immigrants and jobs in different industries, 1980–2000
Source: Authors’ calculations using 1980, 1990 and 2000 county and city databooks.
Regression Models
While this analysis demonstrates the general trend that employment growth in US metropolitan areas is occurring away from where immigrants live and towards where the native-born White population lives, regression analysis provides tests regarding the intrametropolitan movement of jobs and residents in relation to each other while controlling for other factors that might be correlated with jobs and residential shifts. Following Martin (2001), we first test whether county-level population shifts are a function of the previous period’s concentration of jobs and one’s own group population share. Ordinary least squares models are estimated for each group as follows

where, ΔIMMSHARE i is the change in county i’s share of the metropolitan area’s immigrant (native-born) population between 1980 and 1990, and between 1990 and 2000; IMMSHARE i is county i’s share of the metropolitan area’s immigrant population in 1980 and 1990; J i is a variable that measures county i’s share of metropolitan area total employment. 9
The level of immigrant concentration in a given county measures the extent to which newly settled immigrants are converging or diverging relative to existing immigrant-concentrated areas within the MSA. Numerous studies have established immigrants’ propensity to locate in communities with considerable co-ethnic presence (Timberlake et al., 2011; Dawkins, 2009). The inclusion of a county’s employment share measures the extent to which immigrants move towards areas with larger shares of MSA employment. 10
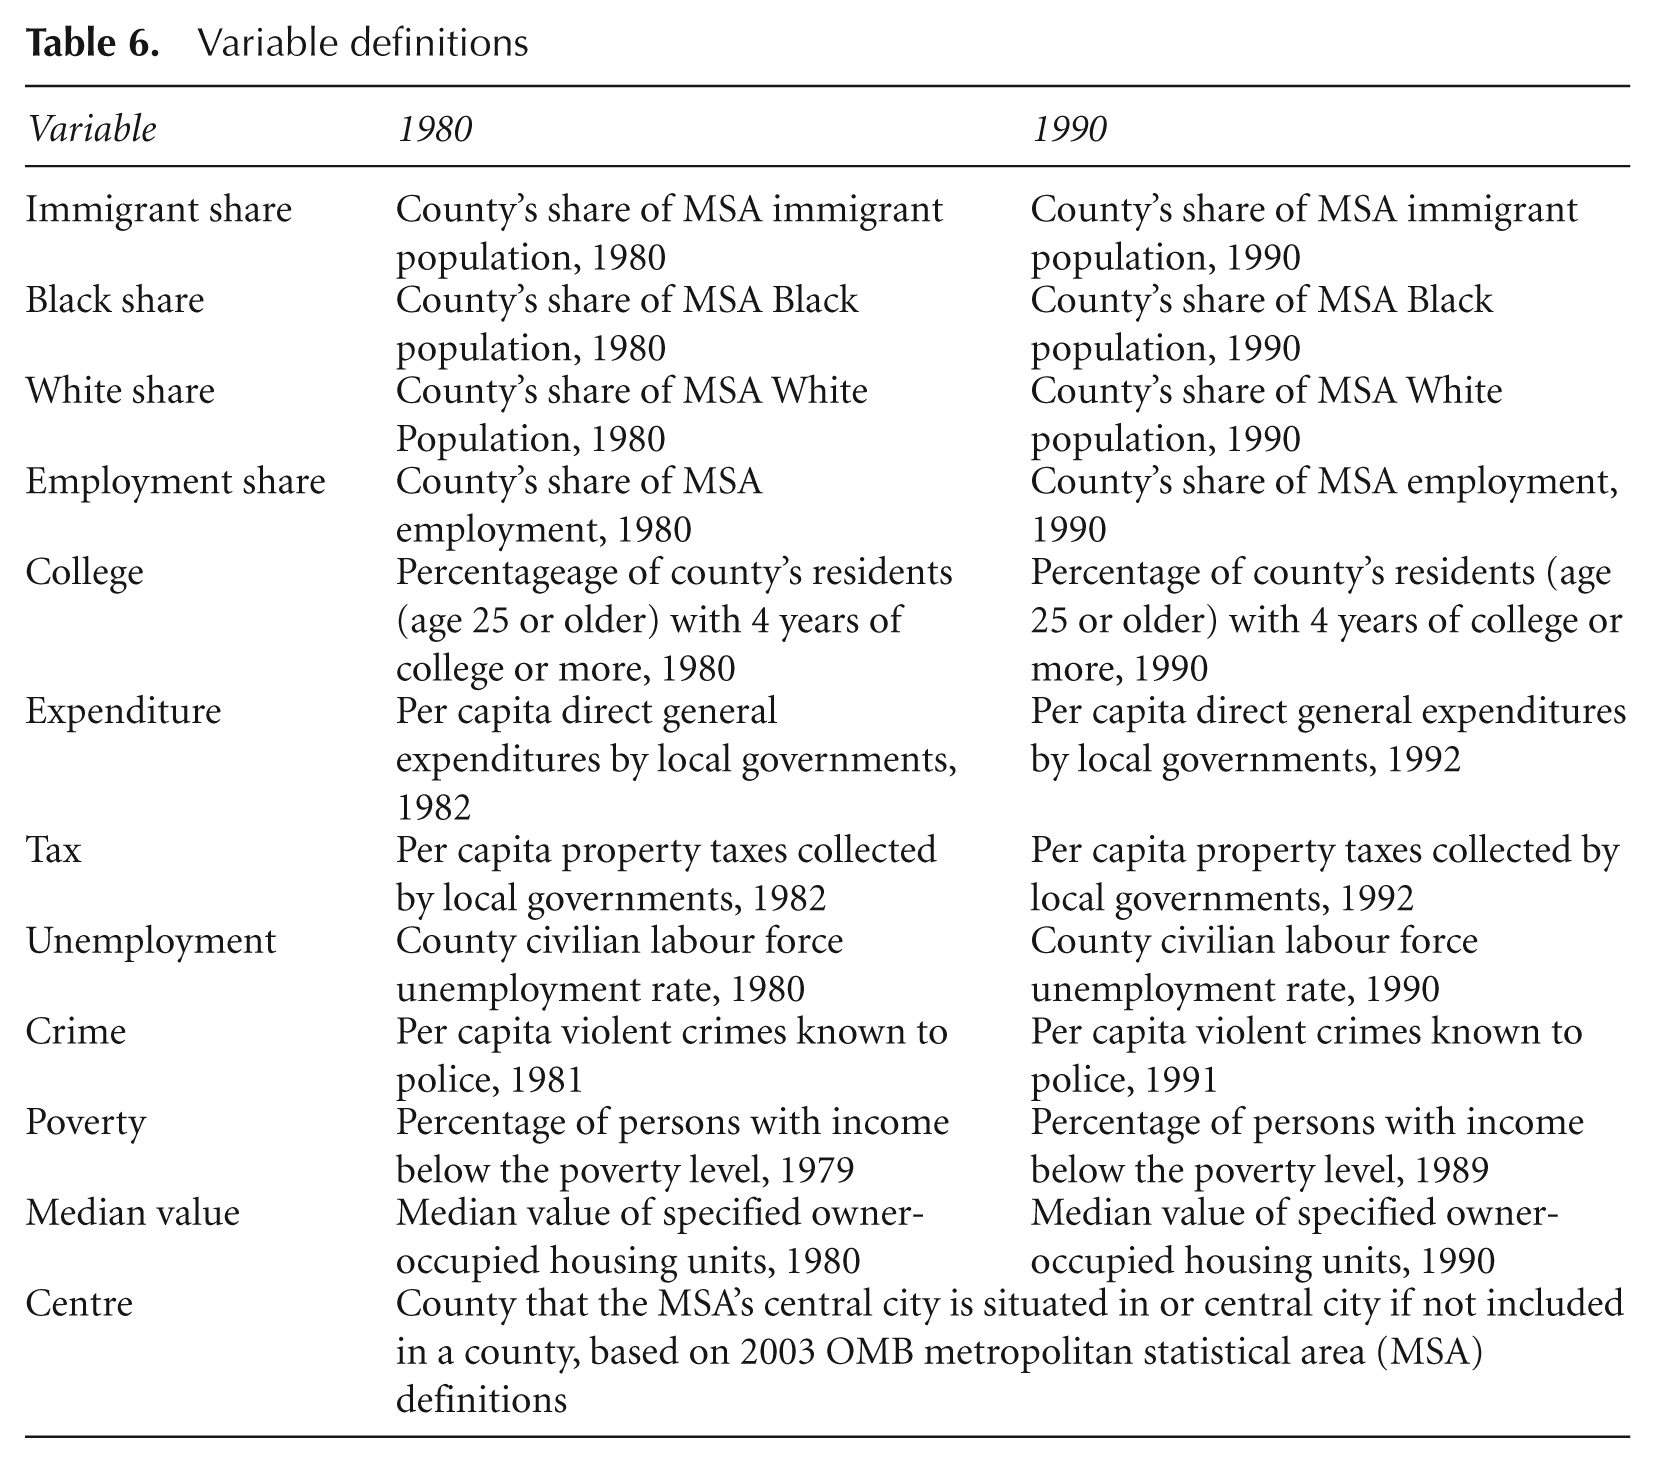
The term X i contains a series of contextual variables that are expected to be important in residents’ location choices. Detailed description of all variables is provided in Table 6. It is expected that residents will be attracted to areas with high percentage of college graduates, a low poverty rate, low housing prices, a low crime rate, high per capital direct general expenditures by local government and low per capita property taxes. These variables have been identified at the intermetropolitan level as determinants of immigrants’ residential locations (for example, Baird et al., 2008). A dummy variable denoting the centre county is also included to measure the relative movement of residents and jobs relative to the metro centre. Again, variables are used for the years 1980 and 1990 when estimating models on changes between 1980 and 1990, and between 1990 and 2000 respectively. Each variable is calculated as an index value by dividing the county’s value for a variable by the average value among counties of the same MSA (Martin 2001). This approach is intended to capture the intrametropolitan variation in locational amenities that underlie intrametropolitan movement of residents, but not the variation across MSAs. To account for the correlation that exists for counties within the same MSA, counties are clustered by their respective MSAs and standard errors are adjusted accordingly. Model results for immigrants are compared with results for native-born Black and White residents in Table 7.
Variable definitions
Regression results of county population shift (N = 450)
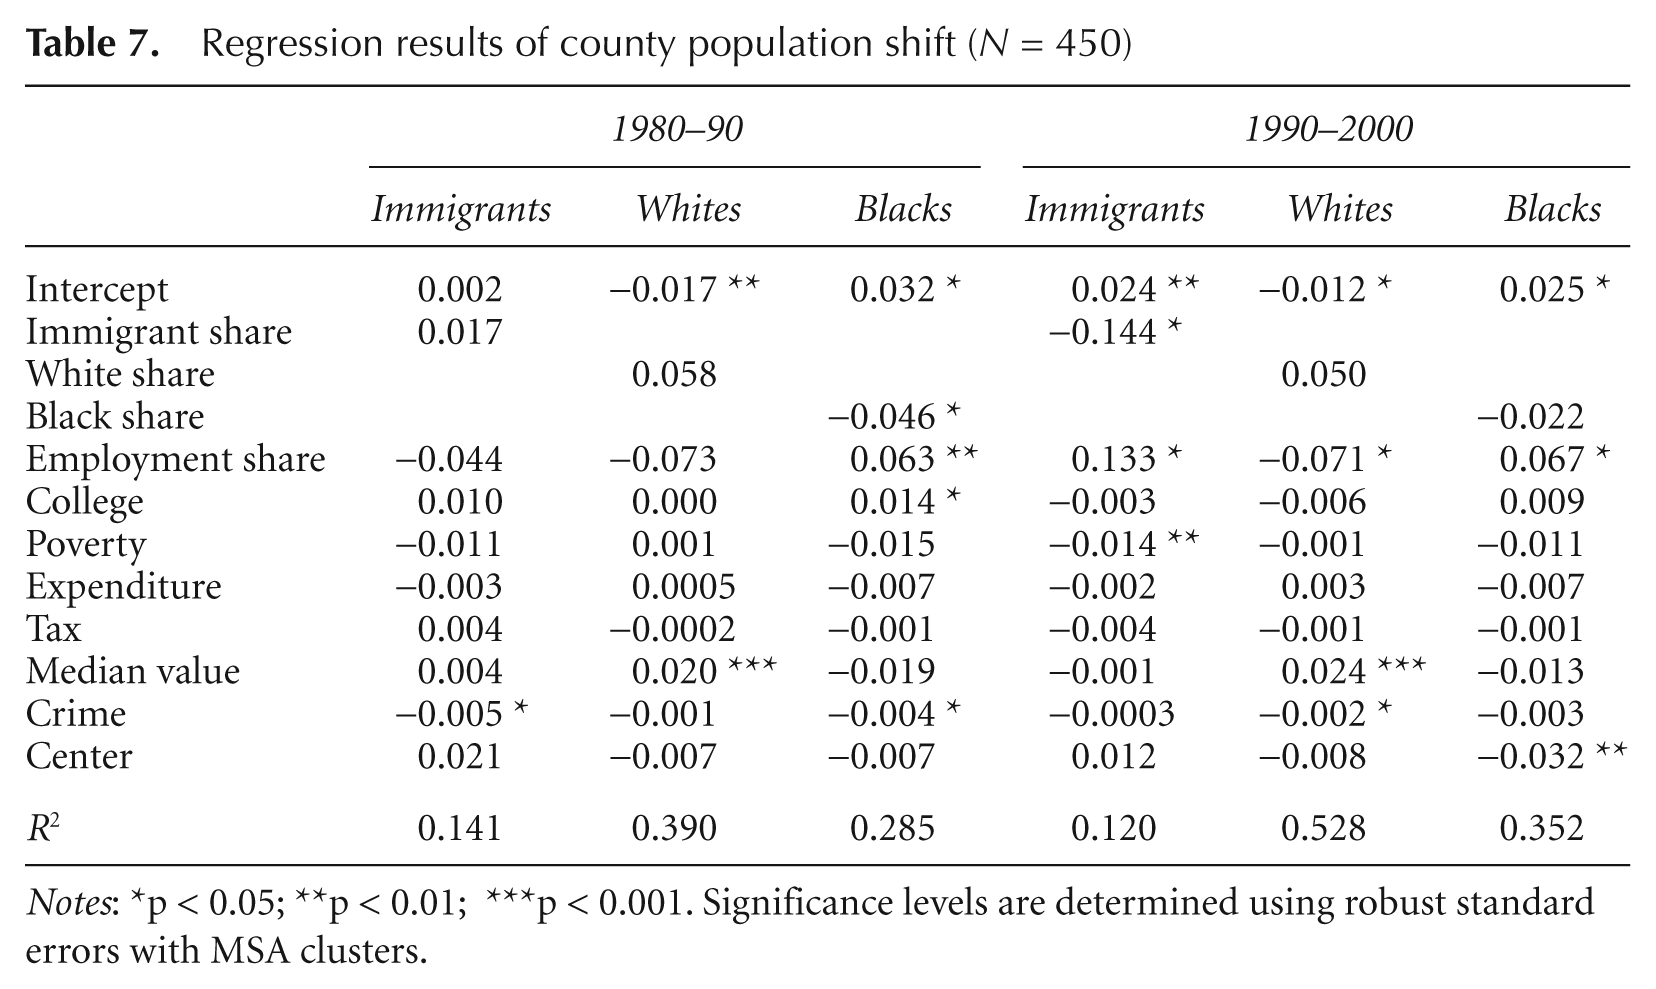
Notes: *p < 0.05; **p < 0.01; ***p < 0.001. Significance levels are determined using robust standard errors with MSA clusters.
Beginning with the results for immigrants, it is evident that during the 1990s, immigrants shifted away from their 1990 residential location and were more likely to locate in areas with higher shares of metropolitan employment. Both of these factors were not significantly predictive of immigrant residential location during the 1980s. This could be due to the rapid suburbanisation trend among immigrant populations in this period. Of all the county characteristics, only the poverty rate and violent crime rate are significant predictors, as immigrant growth occurred away from areas with high poverty rates (1980s) and high crime rates (1990s).
By comparison, model results for native-born Whites and Blacks are also shown in Table 7. In the case of White residents, their growth is converging to areas with higher shares of metropolitan-area White residents but away from existing employment centres (significant for 1990s). This suggests that White residents are continuing to decentralise. Unlike the other two groups, White population growth is occurring in areas with significantly higher housing values. Unlike Whites, Blacks are attracted to areas with dense job opportunities, an effect that is significant for both the 1980s and the 1990s. In addition, Blacks are also diverging from city centres, which are their traditional residential concentrated areas. This suggests the suburbanisation of Black residents as documented elsewhere (Raphael and Stoll, 2002), although the magnitude of this residential shift is smaller than that of immigrants during the 1990s.
All these results further illustrate the patterns derived from spatial mismatch indices presented earlier. While the direction of the concurrent movements of jobs and residents is hard to establish, a general trend regarding the relative movement of one in relation to another can be observed. During this 20-year period in general and in the 1990s in particular, immigrants and Black population shifts are occurring towards metropolitan employment centres whereas White population shifts are occurring away from existing job centres. Immigrants and Blacks are also diverging from parts of the metropolitan areas where their presences have been traditionally large, a phenomenon indicative of their suburbanising residential pattern.
We next estimate employment models in an analogous manner

where, ΔEMPSHARE i is the change in county i’s share of MSA total employment 1980–90 and 1990–2000; EMPSHARE i , IMMSHARE i , WHITE _ SHARE i and BLACK _ SHARE i are county i’s share of MSA total employment, immigrant population and native-born White and Black population respectively, for 1980 and 1990.
This model allows us to determine where employment growth is occurring in relation to existing concentration of jobs and residents. X i is a vector of control variables that are expected to affect the location decisions of employers from previous research (Martin, 2001), including percentage of college graduates, per capita direct general expenditures by local government, per capita property taxes collected by local government and civilian labour force unemployment rate, all at the county level, as well as a centre dummy variable to indicate whether the county is where the MSA’s central city is located or the central city itself. As explained earlier, these variables are constructed as index variables by dividing county values by average values across counties in the same MSA.
Model results are presented in Table 8 and evidence from the two time-periods exhibits very similar patterns. The first model for each time-period includes the immigrant share and employment share together with additional controls. Neither the immigrant share nor the employment share is statistically significant. Once the White and Black population shares are added to the model, it is evident that job growth is occurring close to where the White population is residing and away from where the Black population is residing, although this later result is not statistically significant. Immigrant share again has the expected negative sign, but is not statistically significant. The positive movement towards the concentration of the White population is strongly significant in both cases. While immigrant growth is occurring close to employment centres, employment shifts away from current immigrant concentrations, suggesting that immigrants are following job opportunities. These results are similar for both time-periods, although the effect sizes are generally smaller in the later period than in the decade of the 1980s. For both time-periods, employment growth is shifting towards counties with high levels of college graduates and away from areas with a high local government expenditure and a high unemployment rate. 11
Regression results of county employment shift (N = 450)

Notes: *p < 0.05; **p < 0.01; ***p < 0.001. Significance levels are determined using robust standard errors with MSA clusters.
Conclusion
This paper provides evidence concerning the persistence of spatial mismatch of immigrant populations and jobs across a broad set of metropolitan areas during the 1980-2000 period. In order to determine whether the increasing decentralisation of jobs might adversely affect employment access for immigrants, two sets of analyses were done. First, we constructed a spatial mismatch index to provide evidence from 60 US metropolitan areas with largest immigrant populations. The results demonstrate that there is a higher degree of spatial disparity between immigrants and jobs than between the native-born White population and jobs, implying that a higher percentage of immigrants would have to relocate to other counties to achieve an even balance between residents and jobs. However, we also find that immigrants are less spatially dislocated from jobs than is the Black population.
With respect to the residential location of immigrants, evidence suggests that they tend to locate close to jobs and their residential mobility was able to offset the otherwise enlarging spatial disparity. Further, this movement towards jobs is faster in the 1990s than in the 1980s. The pattern for the Black population is similar although jobs have moved away from the Black population at a faster rate than the Black population has moved towards the jobs, leaving a higher level of spatial disparity in 2000 than in 1980. 12 Overall, the evidence gleaned from the SMI suggests that jobs are moving towards the White population as the White population suburbanises, and that the immigrant and Black populations move towards where the jobs are relocating at differing rates.
Secondly, we conducted a regression analysis to describe the role of job location and residential population shares on the probabilities of locating in a particular part of the metropolitan area. We find that immigrants are attracted to areas with higher shares of employment and away from the residential location of existing immigrant populations during the 1990s. This confirms the recent suburbanisation trend of the immigrant population (Singer et al., 2008; Massey, 2008), although the data in this analysis do not make a distinction between the residential mobility of earlier immigrants and the location choice of new arrivals. In addition, immigrants are moving towards parts of the MSAs with high levels of college graduates and low levels of crime. They are, however, diverging from their existing residential concentrations, signalling their heightened suburbanising pattern in recent decades. It is possible that immigrants are sorting themselves into lower-status enclaves in the suburban areas, a phenomenon worth further exploration. These results are similar to Baird et al.’s (2008) intermetropolitan level analysis and demonstrate that economic and quality of life factors play a more critical role than ethnic factors in immigrants’ intrametropolitan settlement pattern as well. This analysis further finds that employment continues to decentralise. Employment growth is occurring close to White-concentrated parts of the metropolitan area and away from the Black-concentrated locations. Employment growth is happening outside existing employment centres. Areas with a highly educated labour pool (percentage with a college degree), a low unemployment rate and low per capita government expenditure are experiencing faster economic growth compared with elsewhere in the metropolitan area.
This paper traces the dynamics of concurrent geographical shifts in the immigrant population and the location of jobs in metropolitan areas across the US Despite the continued suburbanisation of jobs during the 1980s and1990s, this study also provides evidence that immigrants have been able to close the disparity between their residence and the location of jobs by moving to where the jobs are locating at faster rates than the jobs moved away from the existing immigrant population. This suggests that job decentralisation alone did not lead to increased immigrant stratification. The question of how immigrants are able to do this better than other minority populations is an open question for future research. It may be the case that specific local housing market and labour market dynamics or land use patterns and policies play a role in the different metropolitan areas. It also may be due to the higher levels of mobility that exist among recent immigrants. In addition, future research is needed to discover how the geographical proximity to jobs impacts immigrants’ overall employment outcomes in different types of metropolitan area and to compare the results with those of other minority groups to provide policy-makers and planners with better insights into how to provide assistance to populations that are most disadvantaged in the job market.
Footnotes
Notes
Acknowledgements
The authors are grateful to Xi Huang for her excellent research assistance. They would like to thank Charles Jaret and Urban Studies referees and Editor for their helpful comments.
Appendix
Spatial Mismatch Index between Immigrants and Jobs, 1980-2000
| SMI | 1980–90 change | 1990–2000 change | 1980–2000 change | |||||||||
|---|---|---|---|---|---|---|---|---|---|---|---|---|
| 1980 | 1990 | 2000 | Total | Due to job shift | Due to residential shift | Total | Due to job shift | Due to residential shift | Total | Due to job shift | Due to residential shift | |
| Milwaukee-Waukesha-West Allis, WI | 4.4 | 9.9 | 16.0 | 5.5 | 5.6 | −0.1 | 6.0 | 7.2 | −1.1 | 11.6 | 12.7 | −1.2 |
| Pittsburgh, PA | 4.7 | 9.1 | 14.1 | 4.5 | 0.8 | 3.7 | 5.0 | 1.7 | 3.3 | 9.5 | 2.5 | 7.0 |
| Port St Lucie-Fort Pierce, FL | 7.5 | 4.7 | 16.9 | −2.8 | −1.5 | −1.3 | 12.2 | 4.2 | 8.1 | 9.4 | 2.6 | 6.8 |
| Tulsa, OK | 3.1 | 7.3 | 11.0 | 4.2 | 1.6 | 2.6 | 3.7 | 1.3 | 2.3 | 7.9 | 3.0 | 4.9 |
| Philadelphia-Camden-Wilmington, PA-NJ-DE-MD | 9.4 | 14.6 | 16.4 | 5.2 | 8.0 | −2.9 | 1.8 | 5.3 | −3.4 | 7.0 | 13.3 | −6.3 |
| Memphis, TN-MS-AR | 2.4 | 6.5 | 8.1 | 4.1 | 0.4 | 3.8 | 1.5 | 4.1 | −2.6 | 5.6 | 4.4 | 1.2 |
| Indianapolis, IN | 3.2 | 5.3 | 8.7 | 2.1 | 1.3 | 0.8 | 3.4 | −0.2 | 3.6 | 5.5 | 1.2 | 4.4 |
| Sacramento-Arden-Arcade-Roseville, CA | 4.8 | 5.4 | 10.1 | 0.6 | 1.4 | −0.9 | 4.7 | 4.2 | 0.5 | 5.3 | 5.7 | −0.4 |
| Richmond, VA | 14.1 | 16.3 | 19.2 | 2.2 | −2.0 | 4.2 | 2.9 | −1.3 | 4.3 | 5.1 | −3.3 | 8.4 |
| Atlanta-Sandy Springs-Marietta, GA | 24.7 | 28.3 | 29.7 | 3.6 | −2.5 | 6.1 | 1.4 | −5.0 | 6.4 | 5.0 | −7.5 | 12.5 |
| m | 3.2 | 3.6 | 8.2 | 0.4 | −0.9 | 1.3 | 4.5 | 1.1 | 3.4 | 4.9 | 0.2 | 4.7 |
| Portland-Vancouver-Beaverton, OR-WA | 4.5 | 6.5 | 9.2 | 2.0 | −1.2 | 3.3 | 2.7 | −0.7 | 3.4 | 4.7 | −2.0 | 6.7 |
| Boston-Cambridge-Quincy, MA-NH | 3.3 | 6.8 | 7.9 | 3.5 | 1.9 | 1.6 | 1.1 | 1.0 | 0.1 | 4.6 | 2.9 | 1.7 |
| Minneapolis-St Paul-Bloomington, MN-WI | 5.4 | 10.3 | 9.9 | 4.9 | 0.6 | 4.3 | −0.4 | 2.5 | −3.0 | 4.5 | 3.1 | 1.3 |
| Kansas City, MO-KS | 8.4 | 8.7 | 12.5 | 0.3 | 1.6 | −1.4 | 3.9 | −0.1 | 4.0 | 4.1 | 1.5 | 2.6 |
| Syracuse, NY | 4.1 | 4.8 | 7.9 | 0.7 | 0.4 | 0.3 | 3.1 | 0.8 | 2.3 | 3.8 | 1.2 | 2.6 |
| Denver-Aurora, CO4 | 7.7 | 3.7 | 11.5 | −4.0 | −2.4 | −1.6 | 7.8 | 3.0 | 4.8 | 3.8 | 0.6 | 3.2 |
| Wichita, KS | 5.0 | 4.9 | 8.6 | −0.1 | −0.8 | 0.7 | 3.7 | 0.8 | 2.9 | 3.7 | 0.0 | 3.7 |
| Columbus, OH | 9.4 | 10.6 | 12.9 | 1.2 | −1.6 | 2.9 | 2.3 | 1.6 | 0.7 | 3.6 | 0.0 | 3.6 |
| Baltimore-Towson, MD | 12.9 | 14.4 | 16.4 | 1.6 | −4.5 | 6.1 | 1.9 | −4.1 | 6.0 | 3.5 | −8.6 | 12.1 |
| New Orleans-Metairie-Kenner, LA | 15.1 | 16.4 | 17.9 | 1.3 | −4.2 | 5.4 | 1.6 | −2.0 | 3.6 | 2.8 | −6.1 | 9.0 |
| Hartford-West Hartford-East Hartford, CT | 2.0 | 3.9 | 4.6 | 1.9 | 1.9 | −0.1 | 0.7 | 1.5 | −0.8 | 2.5 | 3.4 | −0.9 |
| Louisville, KY-IN | 6.9 | 6.7 | 9.4 | −0.2 | 2.0 | −2.2 | 2.7 | 2.1 | 0.6 | 2.5 | 4.1 | −1.6 |
| Rochester, NY | 8.2 | 9.9 | 10.5 | 1.7 | 0.7 | 1.0 | 0.6 | 1.6 | −1.0 | 2.3 | 2.3 | 0.0 |
| Chicago-Naperville-Joliet, IL-IN-WI | 9.6 | 12.6 | 11.9 | 3.0 | 4.6 | −1.6 | −0.8 | 5.0 | −5.8 | 2.3 | 9.7 | −7.4 |
| Virginia Beach-Norfolk-Newport News, VA-NC | 15.6 | 22.0 | 17.8 | 6.4 | −4.6 | 11.0 | −4.2 | −2.7 | −1.6 | 2.2 | −7.3 | 9.4 |
| Dallas-Fort Worth-Arlington, TX | 3.6 | 5.0 | 5.7 | 1.5 | 1.9 | −0.5 | 0.6 | 1.6 | −1.0 | 2.1 | 3.5 | −1.4 |
| New York-Northern New Jersey-Long Island, NY-NJ-PA | 33.8 | 35.8 | 35.9 | 2.0 | 0.6 | 1.4 | 0.1 | −0.2 | 0.3 | 2.1 | 0.4 | 1.7 |
| Cleveland-Elyria-Mentor, OH | 4.8 | 5.7 | 6.5 | 0.9 | 2.3 | −1.4 | 0.8 | 3.1 | −2.3 | 1.7 | 5.5 | −3.8 |
| Nashville-Davidson-Murfreesboro, TN | 7.8 | 8.5 | 9.3 | 0.8 | −1.2 | 2.0 | 0.7 | 2.5 | −1.8 | 1.5 | 1.3 | 0.2 |
| Cincinnati-Middletown, OH-KY-IN | 6.0 | 10.1 | 7.0 | 4.1 | 3.5 | 0.6 | −3.0 | 5.8 | −8.8 | 1.0 | 9.3 | −8.2 |
| Poughkeepsie-Newburgh-Middletown, NY | 0.9 | 5.7 | 1.9 | 4.8 | −0.3 | 5.1 | −3.8 | −3.7 | −0.2 | 1.0 | −3.9 | 4.9 |
| Houston-Sugar Land-Baytown, TX | 4.9 | 6.6 | 5.7 | 1.7 | 0.6 | 1.1 | −1.0 | 0.5 | −1.5 | 0.7 | 1.1 | −0.4 |
| Sarasota-Bradenton-Venice, FL | 3.2 | 1.5 | 3.7 | −1.6 | 0.9 | −2.5 | 2.1 | 3.8 | −1.6 | 0.5 | 4.7 | −4.2 |
| Allentown-Bethlehem-Easton, PA-NJ | 0.8 | 1.0 | 1.0 | 0.2 | 0.6 | −0.4 | −0.1 | 0.7 | −0.7 | 0.2 | 1.3 | −1.1 |
| Providence-New Bedford-Fall River, RI-MA | 6.5 | 5.3 | 6.5 | −1.3 | 2.2 | −3.5 | 1.3 | 2.2 | −0.9 | 0.0 | 4.4 | −4.4 |
| Albuquerque, NM | 14.9 | 14.8 | 14.9 | −0.2 | 0.7 | −0.9 | 0.1 | 0.1 | 0.1 | 0.0 | 0.8 | −0.8 |
| Buffalo-Niagara Falls, NY | 3.5 | 4.1 | 3.4 | 0.6 | 1.5 | −0.9 | −0.8 | −3.5 | 2.7 | −0.2 | −1.9 | 1.8 |
| San Antonio, TX | 2.1 | 1.9 | 1.9 | −0.1 | 0.9 | −1.0 | −0.1 | 1.2 | −1.2 | −0.2 | 2.0 | −2.2 |
| Seattle-Tacoma-Bellevue, WA | 4.5 | 4.3 | 4.0 | −0.2 | 0.5 | −0.7 | −0.3 | 1.5 | −1.8 | −0.5 | 2.0 | −2.5 |
| Detroit-Warren-Livonia, MI | 2.4 | 0.8 | 1.8 | −1.5 | 1.4 | −3.0 | 1.0 | 0.5 | 0.5 | −0.6 | 1.9 | −2.5 |
| Los Angeles-Long Beach-Santa Ana, CA | 5.7 | 5.0 | 5.1 | −0.6 | 3.4 | −4.0 | 0.0 | 3.0 | −3.0 | −0.6 | 6.4 | −7.0 |
| Jacksonville, FL | 6.3 | 6.2 | 5.6 | −0.1 | 3.1 | −3.2 | −0.6 | 2.6 | −3.2 | −0.8 | 5.6 | −6.4 |
| Salem, OR | 6.5 | 8.3 | 5.7 | 1.8 | −2.5 | 4.3 | −2.6 | −2.4 | −0.2 | −0.8 | −4.9 | 4.1 |
| Austin-Round Rock, TX | 2.5 | 1.6 | 1.7 | −1.0 | 0.2 | −1.2 | 0.1 | 0.8 | −0.7 | −0.9 | 1.0 | −1.8 |
| Orlando-Kissimee, FL | 3.8 | 0.6 | 2.7 | −3.1 | −0.1 | −3.0 | 2.0 | −0.5 | 2.5 | −1.1 | −0.6 | −0.5 |
| Springfield, MA | 4.0 | 2.0 | 2.5 | −2.0 | 0.5 | −2.4 | 0.5 | 0.9 | −0.3 | −1.4 | 1.3 | −2.8 |
| Omaha-Council Bluffs, NE-IA | 7.9 | 9.1 | 6.3 | 1.2 | 0.8 | 0.4 | −2.8 | −1.0 | −1.8 | −1.6 | −0.2 | −1.4 |
| Washington-Arlington-Alexandria, DC-VA-MD-WV | 6.5 | 5.7 | 4.8 | −0.8 | 3.0 | −3.8 | −0.8 | 0.8 | −1.6 | −1.7 | 3.8 | −5.5 |
| Miami-Fort Lauderdale-Miami Beach, FL | 10.5 | 10.9 | 7.8 | 0.4 | −1.1 | 1.5 | −3.1 | −0.9 | −2.2 | −2.7 | −2.0 | −0.6 |
| Albany-Schenectady-Troy, NY | 20.8 | 19.1 | 17.9 | −1.6 | −4.9 | 3.2 | −1.2 | −1.4 | 0.1 | −2.9 | −6.2 | 3.4 |
| Riverside-San Bernardino-Ontario, CA | 22.5 | 24.8 | 19.4 | 2.3 | 5.2 | −2.9 | −5.4 | 3.4 | −8.8 | −3.1 | 8.6 | −11.7 |
| Greensboro-High Point, NC | 10.8 | 9.1 | 6.7 | −1.7 | 2.4 | −4.1 | −2.4 | 1.9 | −4.3 | −4.1 | 4.2 | −8.3 |
| St Louis, MO-IL5 | 5.6 | 3.1 | 0.1 | −2.5 | −1.7 | −0.8 | −3.0 | −2.8 | −0.2 | −5.5 | −4.5 | −1.0 |
| Oklahoma City, OK | 10.8 | 9.6 | 5.3 | −1.2 | −2.4 | 1.1 | −4.2 | −1.1 | −3.2 | −5.5 | −3.4 | −2.0 |
| Charlotte-Gastonia-Concord, NC-SC | 17.2 | 8.5 | 11.2 | −8.7 | −10.1 | 1.4 | 2.7 | 1.9 | 0.8 | −6.1 | −8.2 | 2.1 |
| Raleigh-Cary, NC | 11.6 | 7.3 | 5.4 | −4.3 | −2.5 | −1.8 | −1.8 | −2.0 | 0.2 | −6.1 | −4.5 | −1.6 |
| Durham, NC | 21.7 | 22.5 | 14.0 | 0.8 | −5.1 | 5.9 | −8.5 | −3.2 | −5.4 | −7.7 | −8.2 | 0.5 |
| Tampa-St Petersburg-Clearwater, FL | 10.5 | 7.3 | 0.9 | −3.2 | −4.5 | 1.3 | −6.3 | −0.3 | −6.1 | −9.5 | −4.8 | −4.7 |
| San Francisco-Oakland-Fremont, CA | 15.2 | 15.5 | 5.6 | 0.2 | 1.0 | −0.7 | −9.9 | 0.0 | −9.8 | −9.7 | 0.9 | −10.6 |
| Tampa-St Petersburg-Clearwater, FL | 13.4 | 5.6 | 3.5 | −7.8 | 2.4 | −10.2 | −2.1 | 1.9 | −4.0 | −9.9 | 4.3 | −14.2 |
| San Francisco-Oakland-Fremont, CA | 41.0 | 36.2 | 30.1 | −4.8 | 0.0 | −4.8 | −6.2 | 0.0 | −6.2 | −10.9 | 0.0 | −10.9 |
| Average | 16.8 | 17.1 | 15.8 | 0.2 | 1.8 | −1.5 | −1.3 | 1.4 | −2.6 | −1.0 | 3.1 | −4.2 |
Sources: Authors’ calculations using 1980, 1990 and 2000 county and city databooks.