
Abstract
The research investigates the potential of a geographical information system to analyse the recorded displacement of office and industrial occupiers in Tyne and Wear, England. The paper demonstrates that a GIS provides an effective tool with which to illustrate, analyse and model occupier displacement and market filtering. The research goes on to develop and test an indicator with which to identify urban areas that may be most vulnerable to property occupier displacement. The correlation of rateable value and VAT registration datasets, with the origin of occupiers of new office and industrial developments and the location of vacant chain-end property, was tested. The strongest correlation is with new VAT registrations within a three-year period. A property market resilience indicator is developed, with which to classify urban areas in terms of their resilience or vulnerability to business occupier displacement generated by commercial property development.
Introduction
The research investigates whether a geographical information system (GIS) can enhance the representation and analysis of commercial property occupier chaining data—a technique designed to capture the chain of moves that take place when businesses relocate to new premises. It employs GIS to analyse commercial property occupier displacement and filtering generated by new office and industrial development in Tyne and Wear, to capture the geography of occupier chains, the spatial impact of occupier displacement and to facilitate the analysis and investigation of their property market impact. Both the methodology, developed for modelling occupier chaining data, and the creation of a property market resilience indicator, are transferable to any property market where there is some transparency of occupation, market values and business registration. The resultant findings have implications not only for Tyne and Wear, but any city-region where area-based interventions are being introduced to stimulate property development and occupation—for example the new breed of Enterprise Zones, Tax Increment Financing and Accelerated Development Zones currently being designated across the UK.
The first section of the paper provides a review of the literature on property occupier displacement, its measurement and the process of property market filtering and the chaining technique; the second section describes the methodology employed by the research, which is followed by the results of the analysis of the chaining data in the GIS. The penultimate section of the paper considers the potential of developing an indicator of property market resilience and vulnerability using VAT registration and rateable value datasets, before drawing its conclusions.
Literature Review
A recognised weakness of physical regeneration is when it leads to uncompensated displacement and substitution, distorting local property markets and diverting development investment from more efficient land use patterns. In property market terms, the need for firms to relocate is usually driven by a combination of ‘push’ and ‘pull’ factors. Push factors typically result from a mismatch between the buildings that firms occupy and their needs (see Fothergill et al., 1987; Harris, 2002). For a firm or organisation to choose to relocate, there needs to be a mismatch that cannot be resolved by expanding on site or refurbishing obsolescent premises (Turok, 1989). Pull factors are the socioeconomic, physical, environmental and legal conditions offered by competing locations with available floorspace; in addition to which developers and public-sector bodies may offer financial incentives such as tax breaks, rates holidays, rent-free periods and contributions to capital works.
Displacement of property occupiers is caused when new property developments come on to the market and occupiers relocate to these new developments, vacating their old premises in the process. This is not a problem per se, as the old premises might soon be re-occupied by new businesses. From a public policy perspective, displacement occurs when a company makes a decision to locate to new, assisted premises, leaving vacant space in its wake. Thus, desirable development output leads to a loss of output elsewhere. The concern is that public-sector intervention in land and property markets has led to micro changes in locational advantage, without necessarily increasing the quantum demand for space (Ball et al., 1998).
Academics, policy-makers and practitioners have long speculated that the provision of commercial and industrial property leads to local transfers of existing firms, or accommodates firms that would have moved into an area anyway. Evaluation of the Enterprise Zones experiment (DoE, 1995) confirmed that the majority of relocations into the zones were displacement moves, raising the concern that the stimulation of viable property markets in EZs had been at the expense of the local property markets off-zone. Some displacement occurs when firms move into an EZ from elsewhere in the local area (for example, boundary hopping) and when firms moving into the local area have been diverted into the zone instead of going elsewhere. Evidence from off-zone property markets suggests that voids are not caused directly by competing developments in the zones, but that a filtering process occurs, with vacancies persisting in premises that are unsuitable to the needs of modern businesses.
Measurement of displacement is a component of calculations of net additionality, defined by HM Treasury (1995) as the extent to which activity takes place on a larger scale, takes place at all or earlier, or within a geographical area of policy concern as a result of the intervention (HM Treasury, 1995, p. 36).
ODPM’s (2004) ‘3Rs guidance’ explicitly identified deadweight, leakage effects, displacement, substitution, crowding out and multiplier effects as components of additionality; defining displacement as the proportion of the intervention’s outputs/outcomes accounted for by reduced outputs/outcomes elsewhere (ODPM, 2004, p. 122).
1
It is the incidence and wider impact of business occupier displacement, generated by office and industrial developments promoted or assisted by the public sector through physical regeneration initiatives, that is the focus of this research.
Property Market Filtering and Chaining
When new office and industrial accommodation is built, existing firms move into the new premises and their old premises are generally re-absorbed as other firms move into the vacated premises. This, in turn, releases other premises further down the chain, that are likely to be smaller, older and potentially attractive to smaller firms. A model of the process of occupier chaining and the filtering effect, resulting from displacement caused by the construction of new premises, is shown in Figure 1.
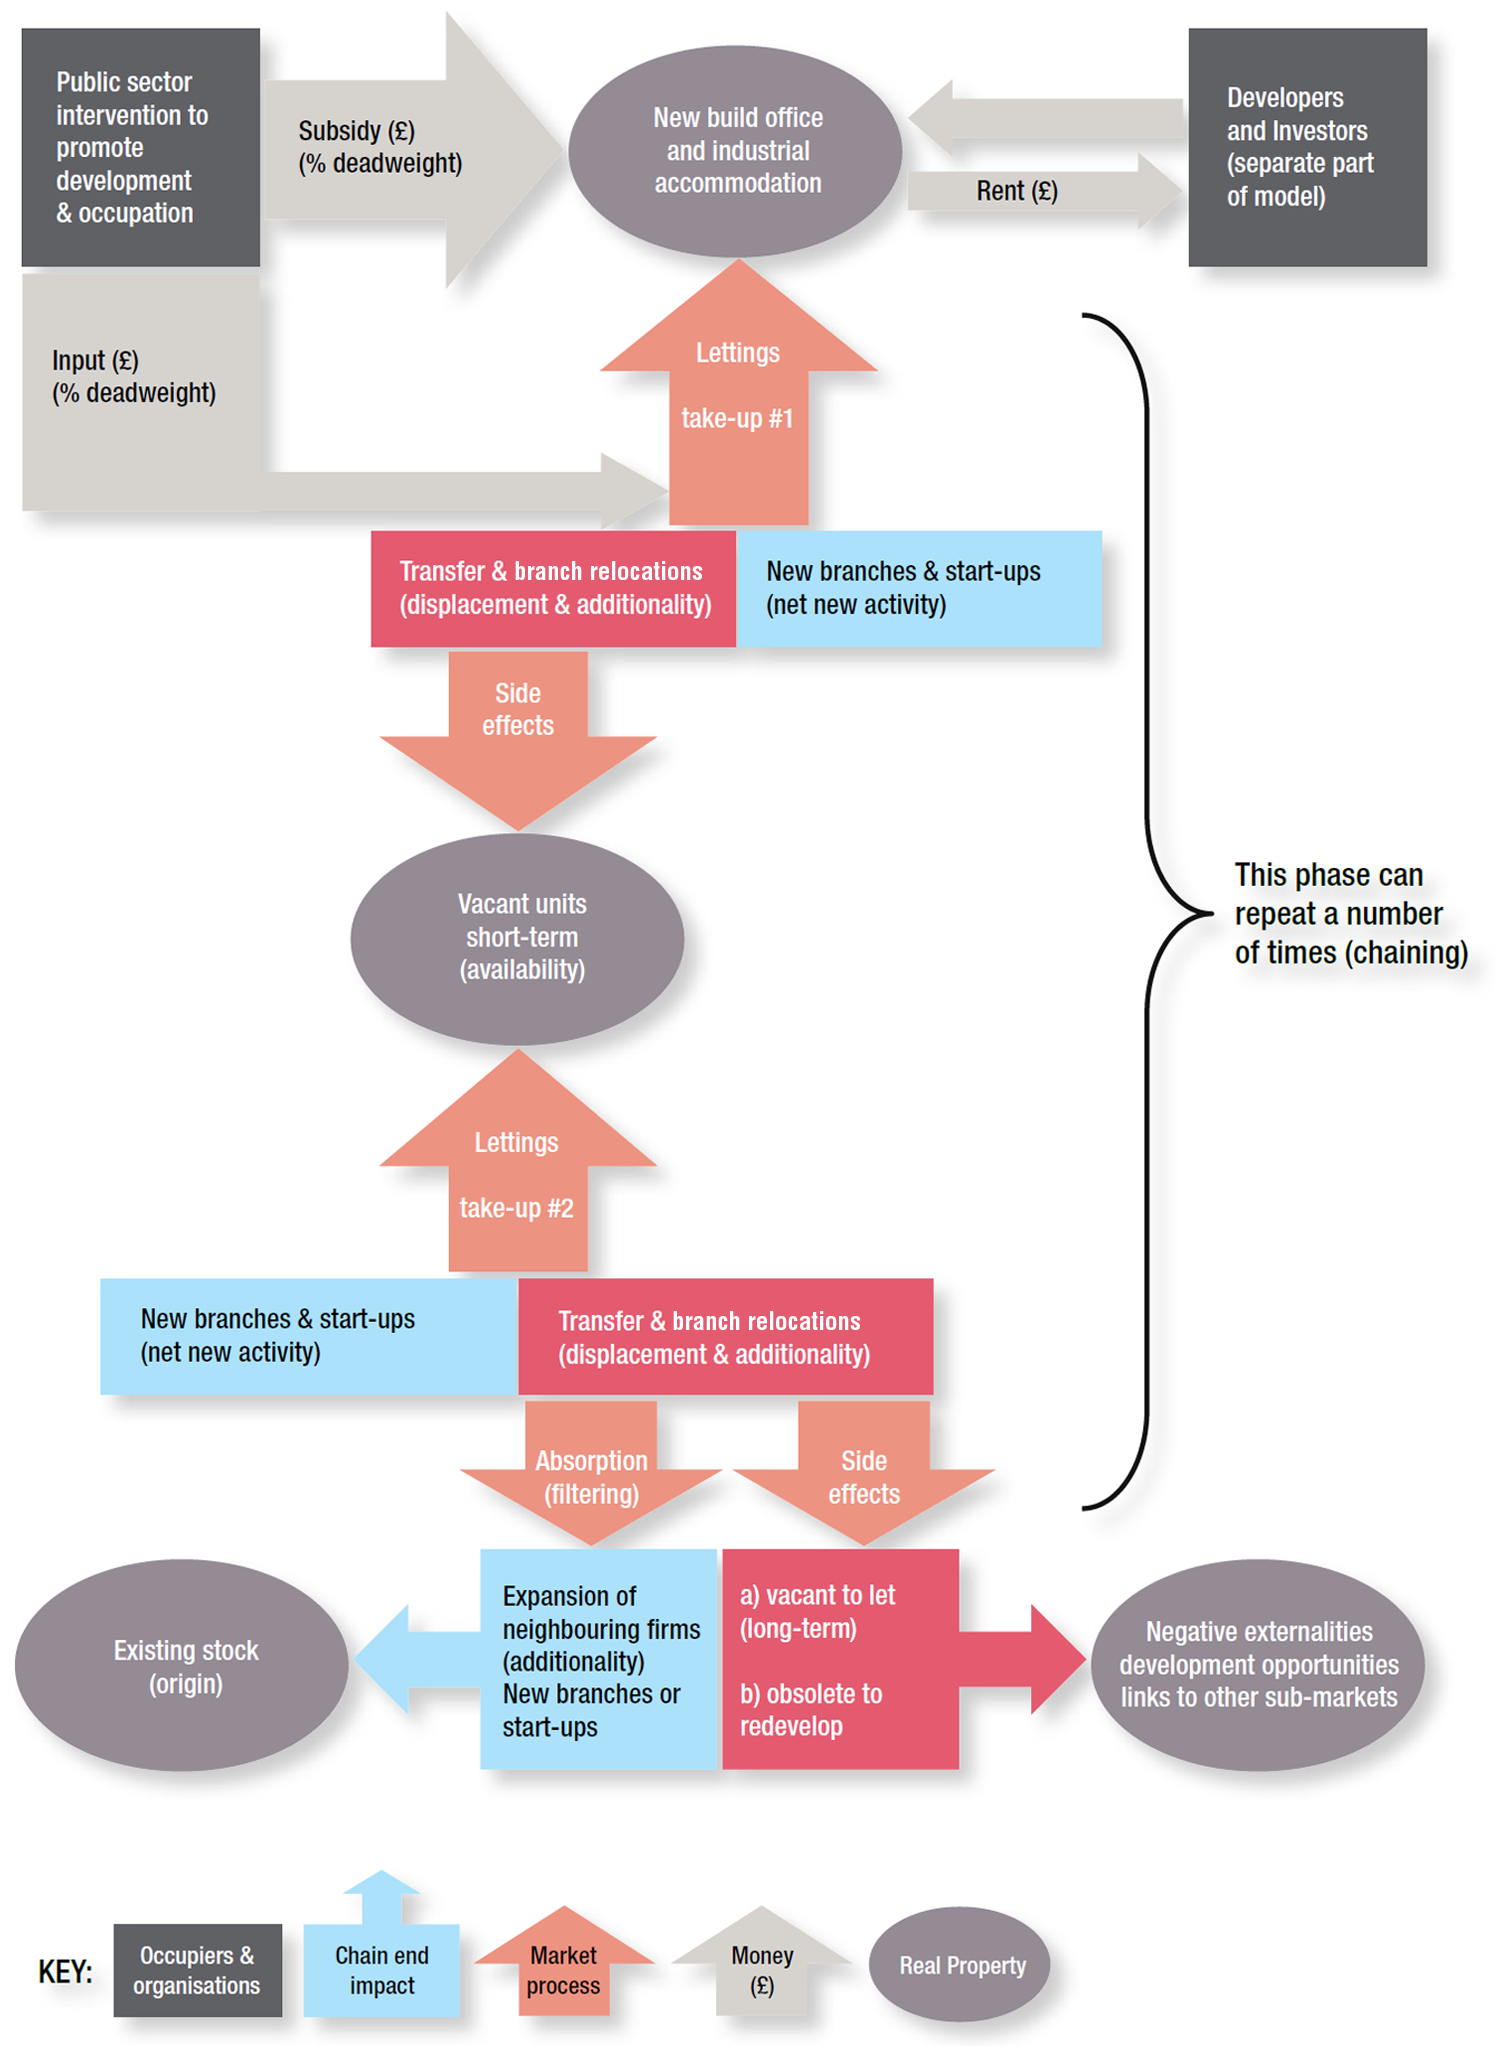
Occupier chaining and the filtering effect.
The chaining technique was originally developed to investigate residential occupier chains, but was adapted by Robson et al. (see DETR, 1998) to capture business occupier displacement generated by Urban Development Corporation property interventions (see also Robson et al., 1999, 2000). A refined chaining technique was employed to capture property market filtering generated by new office and industrial development in Tyne and Wear in the north-east of England. The impact of new developments was represented by recording where relocating occupiers originated, what had become of their old premises, how each chain ended and where the end of each chain was located.
Additionality may be regarded as any chain that ends with
— the creation of a genuinely new business (or start-up);
— the establishment of new activity through the creation of a new branch or through expansion, merger or reorganisation;
— relocations where the business that moves in derives from outside the local economy.
As long as premises are ultimately reoccupied for commercial use, relocations do not represent displacement. Only when chains end in vacancy or the demolition of premises, can one determine that intervention has generated negative impact. The relevant event, therefore, is not the immediate movement of a business to a new property development, but the net effect of the completed chain. Displacement is associated with a move from within the local economic area that leaves behind a building that is vacant or has to be demolished or converted to a non-commercial use (DETR, 1998). Chains that end in vacant properties are significant because they represent the impact of new property developments coming on to the market. Through filtering, vacant chain-end properties may be concentrated in locations that are particularly vulnerable to occupier relocations, where property markets are less resilient and absorption of vacant stock is weaker or slower. The chaining technique thus captures the spatial impact of the spill-over effects of property development and area-based regeneration initiatives.
Previous chaining research (see Valente and Leigh, 1982; DoE, 1995; DETR, 1998; Robson et al., 1999, 2000; Francis and Thomas, 2008) has quantified the number and type of moves rather than pursuing a deeper understanding of the ‘forcing’ or ‘push and pull’ factors associated with decisions of relocation (see Leishman and Watkins, 2004; Greenhalgh, 2008). The integration of data concerning the origin of occupiers moving to new office and industrial developments and the location of chain-end vacant property is crucial if the impact of property development on local property markets is to be fully appreciated, and identification of areas that have been most affected by displacement and property market filtering is to be made. Analysing the chaining data using GIS offers the prospect of not only identifying vulnerable areas, but also offering identification and insight to the conditions that may contribute to their lack of resilience.
Use of GIS
GIS is well known for its ability to ‘add value to data’ (Longley et al., 2005) and has long been recognised as a tool that can perform a number of roles in urban management, including monitoring of the environment, analysis of planning options, informing decision-making, reducing risk and assisting in the implementation of decisions (Dale, 1991; Wyatt, 1999). From a real estate perspective, GIS may be used to record landownership and condition, audit property assets, identify sites for redevelopment, analyse changing land use patterns and property vacancy, map changing property values and model the influence of location on value (see Dale, 1991; Gallimore et al., 1996; Wyatt 1996, 1997; Malpass and Mullins, 2002; Katyoka and Wyatt, 2008). This study is the first attempt to use GIS to model property chaining data to represent the impact of business occupier displacement generated by public-sector-assisted property development.
Methodology
The chaining survey captured displacement generated by 20 office and industrial developments in Tyne and Wear (see Figure 2) that benefited from public-sector support (for example, Enterprise Zone, Urban Development Corporation, gap funding, etc.). The resulting 500 000 square metres of business accommodation attracted more than 500 firms, just over half (52 per cent) of which had relocated from within Tyne and Wear. First moves are most significant as they are directly associated with the supply of new office and industrial accommodation. They also constitute the majority of all movements (63 per cent). Some 251 occupier chains were generated by relocating firms which, due to fragmentation, resulted in 376 chain ends, just over half (54 per cent) of which were premises reoccupied by new start-ups, one-third (36 per cent) were vacant and the remainder (10 per cent) were redeveloped for new end uses. In total, the new developments generated chains comprising approximately 1200 property transactions.
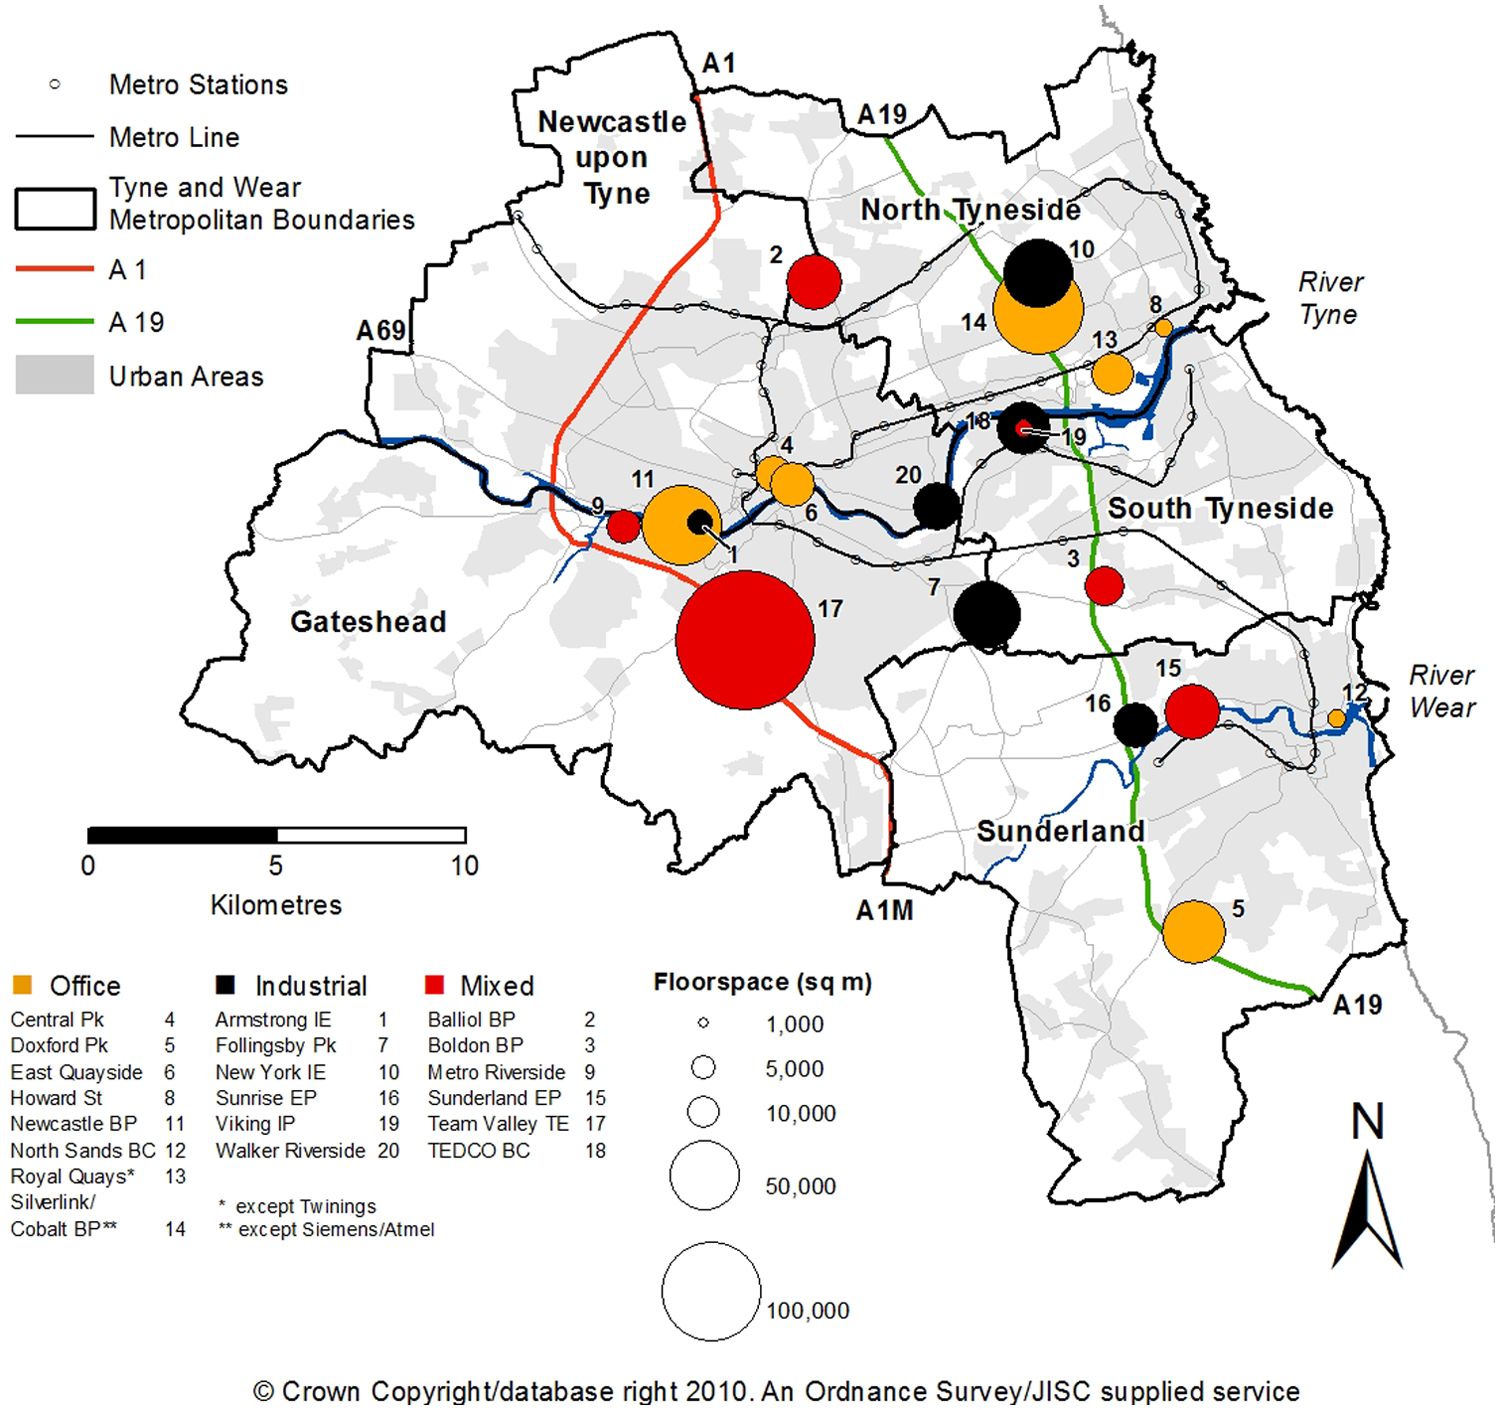
Office and industrial developments in Tyne and Wear (scaled by aggregate floorspace).
By plotting the origin of firms, it is possible both to represent the geographical distribution of premises vacated by relocating firms and to measure the distance occupiers move. The location and status of properties at the end of occupier chains may be plotted to identify which areas within the conurbation have been most affected by occupier displacement and vacancy.
Business, Address and Movements Datasets
An example of how a chain is represented in the dataset and GIS is shown in Figure 3. The chain is started by Company A moving into the new development. Company B, then consolidates by moving from two different locations into the space vacated by Company A (consolidations may also occur from separate suites/units at the same address). Within the same building, Company D moved into the space vacated by B and is represented by the circle in the figure. The space D previously occupied was then split between G and H and this is where the chain ends. The other sub-chain is more straightforward. The business and address dataset represents the locations (nodes) of business premises and their positions in their respective chains, but does not convey chain movement. An additional dataset was generated to ‘join up the dots’ between the development and the addresses in the chain, as shown in Figure 4 for Doxford Park.
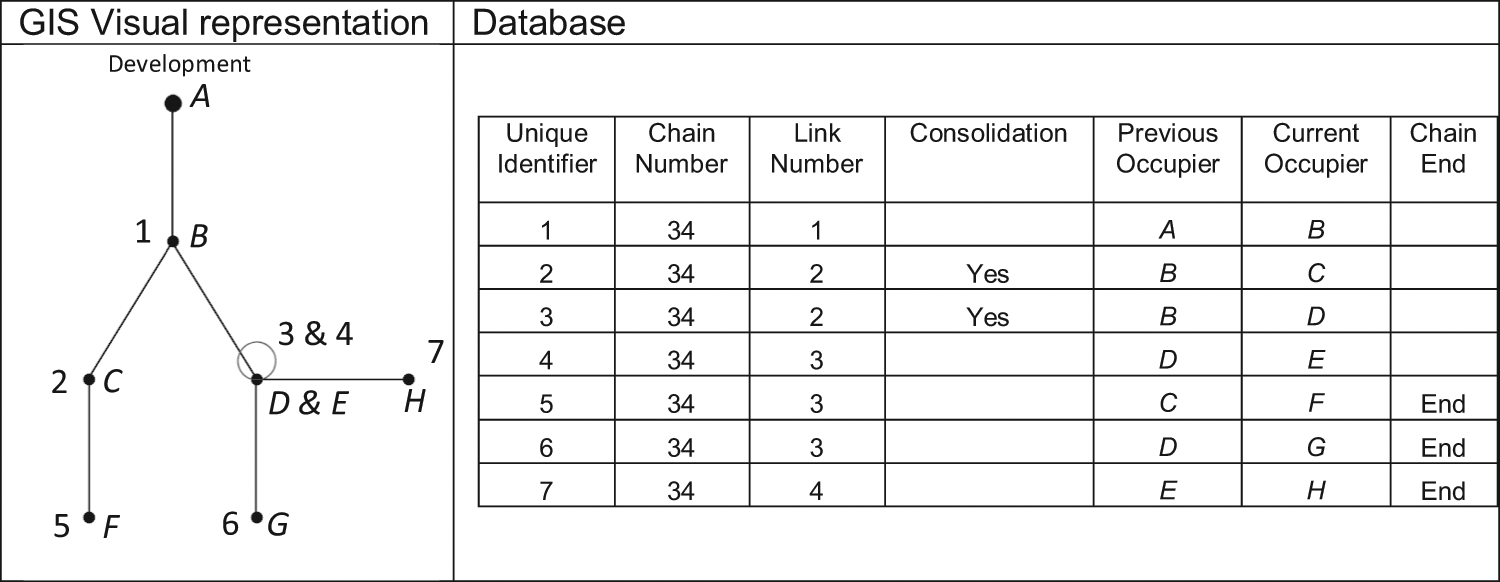
An example of an occupier chains in GIS.
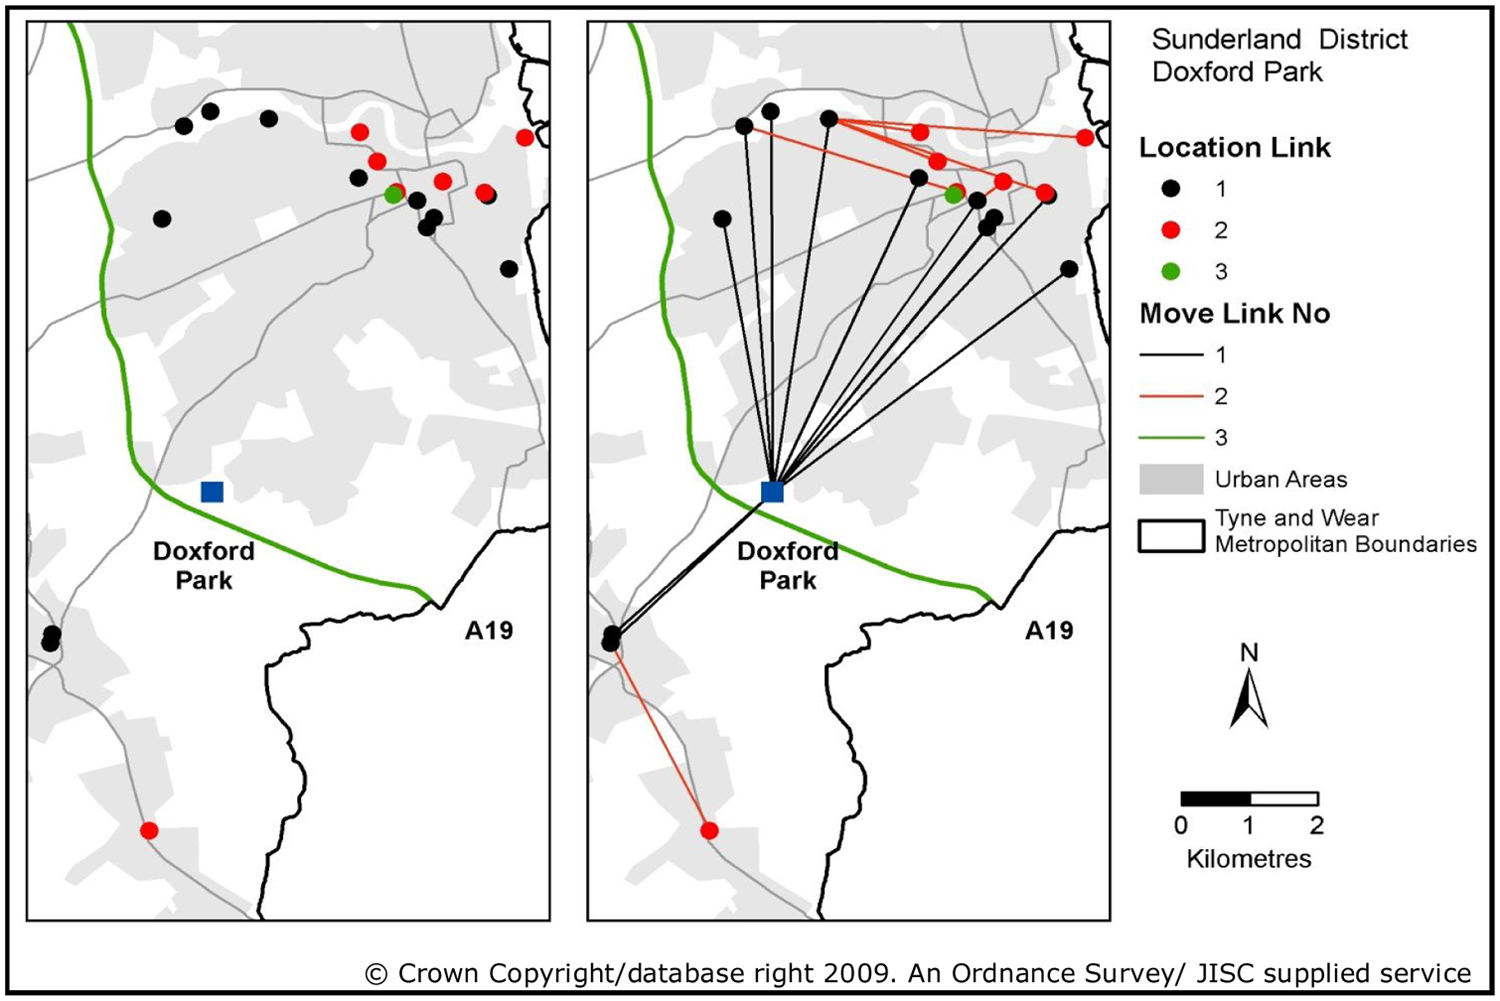
An example of an occupier chains in GIS: Doxford Park.
Using GIS enables investigation of whether the location of a concentration of chain ends, first moves or vacancies, shares similar characteristics. A wide range of data are available to characterise a location over a range of geographical scales; the highest resolution is the lower super output area that sits within a nested hierarchy of geographical administrative boundaries up to district and regional levels. The greater the resolution of the data, the greater the capacity to look at change in certain attributes or indicators identified in a dataset over space; however, at high resolutions, as the size of the populations diminishes, so does the reliability of statistics calculated for those areas (see Watson et al., 2009).
One aim of the research was to experiment with available datasets to determine if any of them could be used as an indicator of property market resilience or vulnerability of an area to occupier displacement—in other words, to develop an index with which to score or grade an area’s property market status, similar to the way that the Index of Multiple Deprivation 2 is used to identify residential areas that display symptoms associated with multiple deprivation. By exploiting the chaining data to represent levels of business activity and market resilience, as represented by relative rates of absorption of vacant property, correlations between the location where vacancies persist and the characteristics of the geographical area in which they are predominantly found, were tested. Using the characteristic ‘signature’ of resilient or vulnerable areas, it was possible to identify those locations that may be prone to the effects of occupier displacement generated by new or proposed commercial property development. Not only does this contribute to our understanding of the impact of commercial property development, it may be used to measure and monitor the side effects of area-based investment initiatives such as Tax Increment Financing, Enterprise Zones and Accelerated Development Zones, as well as informing local and city-region planning and economic development strategies.
Two indicators (rateable values and VAT registrations) were selected with which to test the correlation with the origin of first moves and the persistence of vacant office and industrial property. The rationale for selection of the two datasets is considered next.
The Rateable Value Dataset
The rateable value (RV) of a property is an estimation of its market rental value at the antecedent date of valuation. It is therefore influenced by a complex array of factors, the most significant of which will be the size of the premises, the use to which it is put and its location. Rateable values recorded at 2003 3 were used because it was closest to the period during which the chaining data was collected and was the first time that non-domestic RV data were available at MSOA level. Rateable values may be used as a proxy for property market vitality, with high average RVs indicating a location where there is healthy occupier demand and low average RVs identifying locations where occupier demand is weak (Centre for Urban Policy Studies, 2008). Such data may be used, in isolation or in combination with other datasets, as an indicator of the relative ‘health’ of local commercial and industrial property markets. It may be inferred that those locations with higher average RVs are more buoyant local property markets with greater resilience to absorb property vacancies, whereas areas with lower RVs may suffer from longer-term vacancy. Localities with high average RVs would be expected to record lower levels of vacant property, relative to the local stock of commercial and industrial property. Conversely, localities with low average RVs may contain relatively higher levels of vacancy. A study carried out in Leeds by Katyoka and Wyatt (2008) demonstrated that it is possible to use ‘experimental statistics’ to establish the density of vacant properties and to identify clusters which were then interpreted relative to their micro location.
The VAT Registration Dataset
New VAT registrations data were incorporated because, not only are the data generated by the same sectors of the economy that contribute to RVs, but the number of new businesses (start-ups) registered for VAT purposes may be used as a proxy for the economic vitality of a location. A relatively high density of VAT registrations would suggest that an area has a dynamic economic base; conversely, a low density of new VAT registrations would indicate a locality with a weaker economy. New business start-ups would take up available small office suites and industrial units, thus reducing the vacancy level in a locality. An area with a relatively high level of VAT registrations may be expected to have a lower level of vacant business units; conversely, a location with a lower level of new business registrations could be predicted to show a higher level of relative vacancy.
Interpreting the Results of GIS Analysis
GIS can be used to analyse chaining data in respect of discrete locations and the distance between nodes for all chain links. The ‘spatial’ characteristic of the chaining data thus comprises two components
Location—of vacant property, occupied chain end or origin of first move.
Movement—distance and length of chain represented by number of links.
Location Queries
By plotting the location of the nodes in all 251 chains, it is possible to generate a number of queries relative to the location of any business address in any chain. The analysis can be split by focusing on first moves only. The upper part of Figure 5 represents the origin of the occupiers on the 20 developments by number per ward. The data can be ranked to allow comparison between the districts and the (donor) wards within them, which have been the source of occupiers for the 20 developments. Some locations are better able to absorb vacant property through filtering or take-up. The lower part of Figure 5 presents the spatial pattern and location of chain ends relative to status, identifying those wards with the highest percentage of vacancies, and offers a representation of market excitation, revealing the locations that have supplied occupiers to the new developments or have fuelled the chains arising from the first moves, feeding through to either a new business occupying the vacated property (absorption) or a vacant chain end.
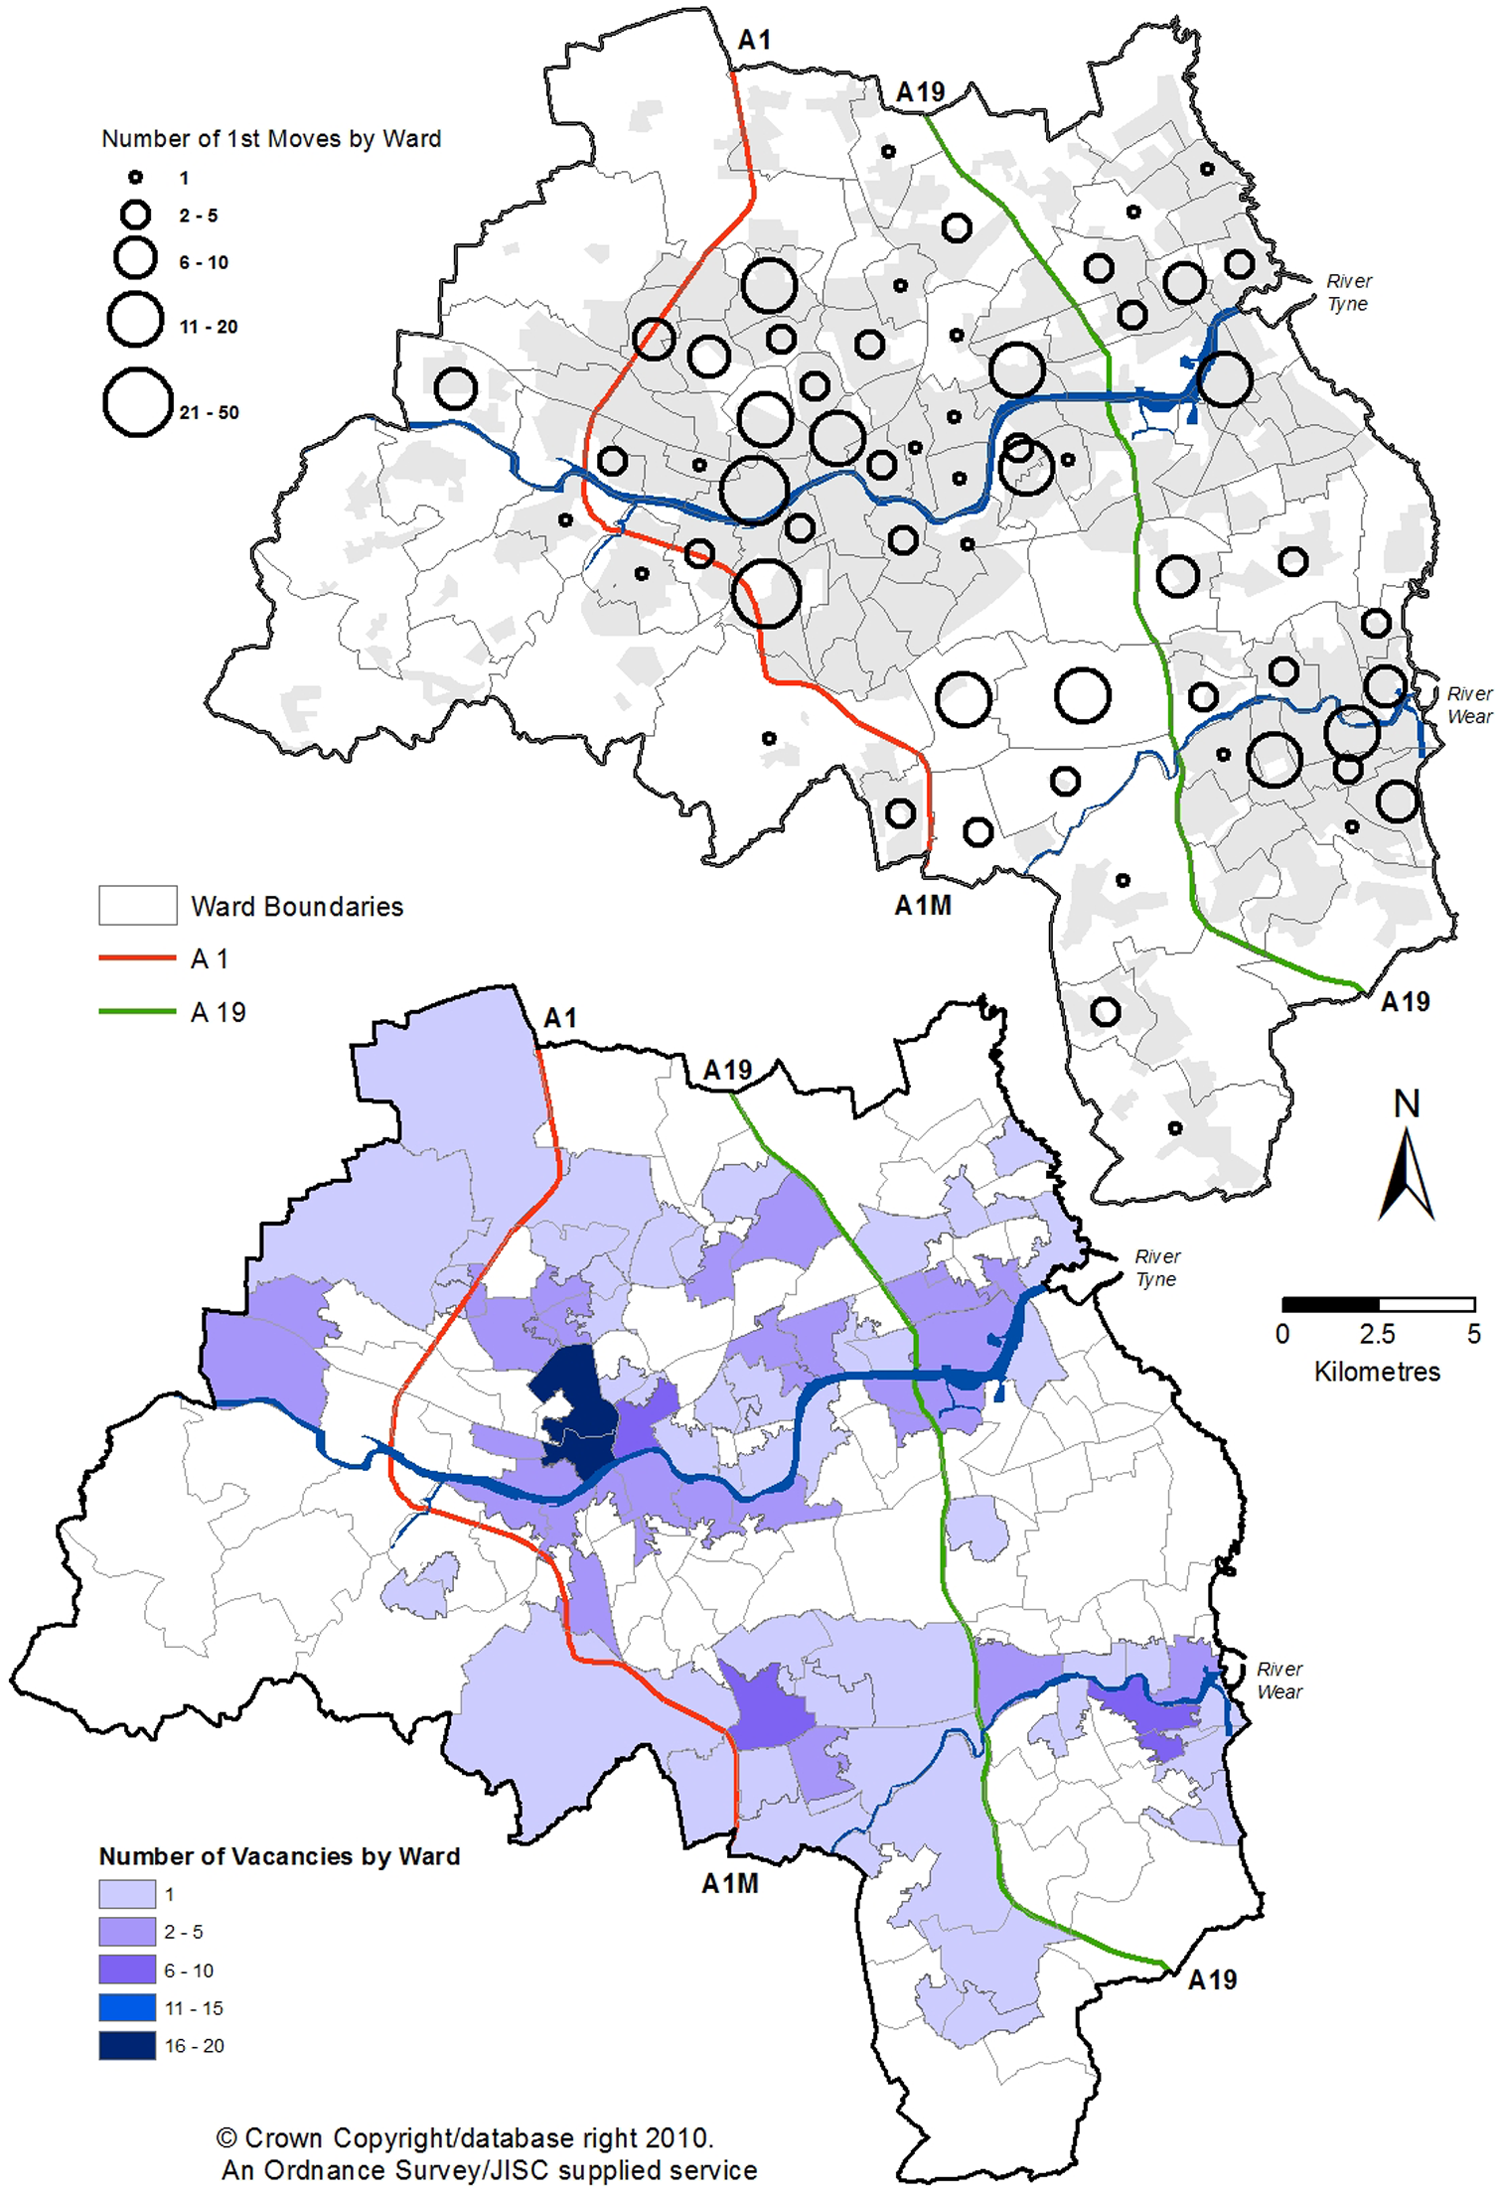
Above: Origin of occupiers. Below: Location of vacant property.
The lower part of Figure 5 reveals that the highest numbers of vacancies are on the periphery of Newcastle CBD but this also has the greatest stock of property so, as a percentage, the level of vacancy is relatively lower than locations with nominally lower recorded levels of vacancy. Two other areas register high levels of vacancy, the periphery of Sunderland city centre and Washington new town. The former has a similar status to the areas fringing Newcastle city centre and may be similarly associated with a ‘hollowing out’ effect (see DETR, 1998; Robson et al., 1999, 2000); the latter was identified in the original analysis that recorded a significant number of, mainly industrial, occupiers that had relocated from Washington to new premises located in the Sunderland Enterprise Zone. The ‘new town’ and its stock of industrial accommodation was not so ‘new’ any more (push factor), leases were due to expire and firms were lured to brand new accommodation in the Sunderland Enterprise Zone with the incentive of no business rates payable for the life of the zone (Greenhalgh et al., 2000).
By representing the density of office and industrial occupier movements, it was possible to identify locations (hot spots) that had the greatest levels of property market excitation. Most office developments are located close to the Tyne and Wear Metro system (see lower part of Figure 6), with two notable exceptions: Balliol/Quorum and Cobalt Business Parks; both were developed with apparently little regard to the provisions of PPG13, 4 on greenfield enterprise zones in unsustainable locations on the periphery of the conurbation that are heavily reliant on private car usage. Predictably, industrial clusters have a more dispersed pattern (see upper part of Figure 6), influenced to a greater degree by proximity to strategic road links; one industrial location that appears remote from both the Metro and A1/A19 corridors, is Washington; however, its location between the two major north–south road corridors and its extensive dual carriageway network mitigate this weakness.
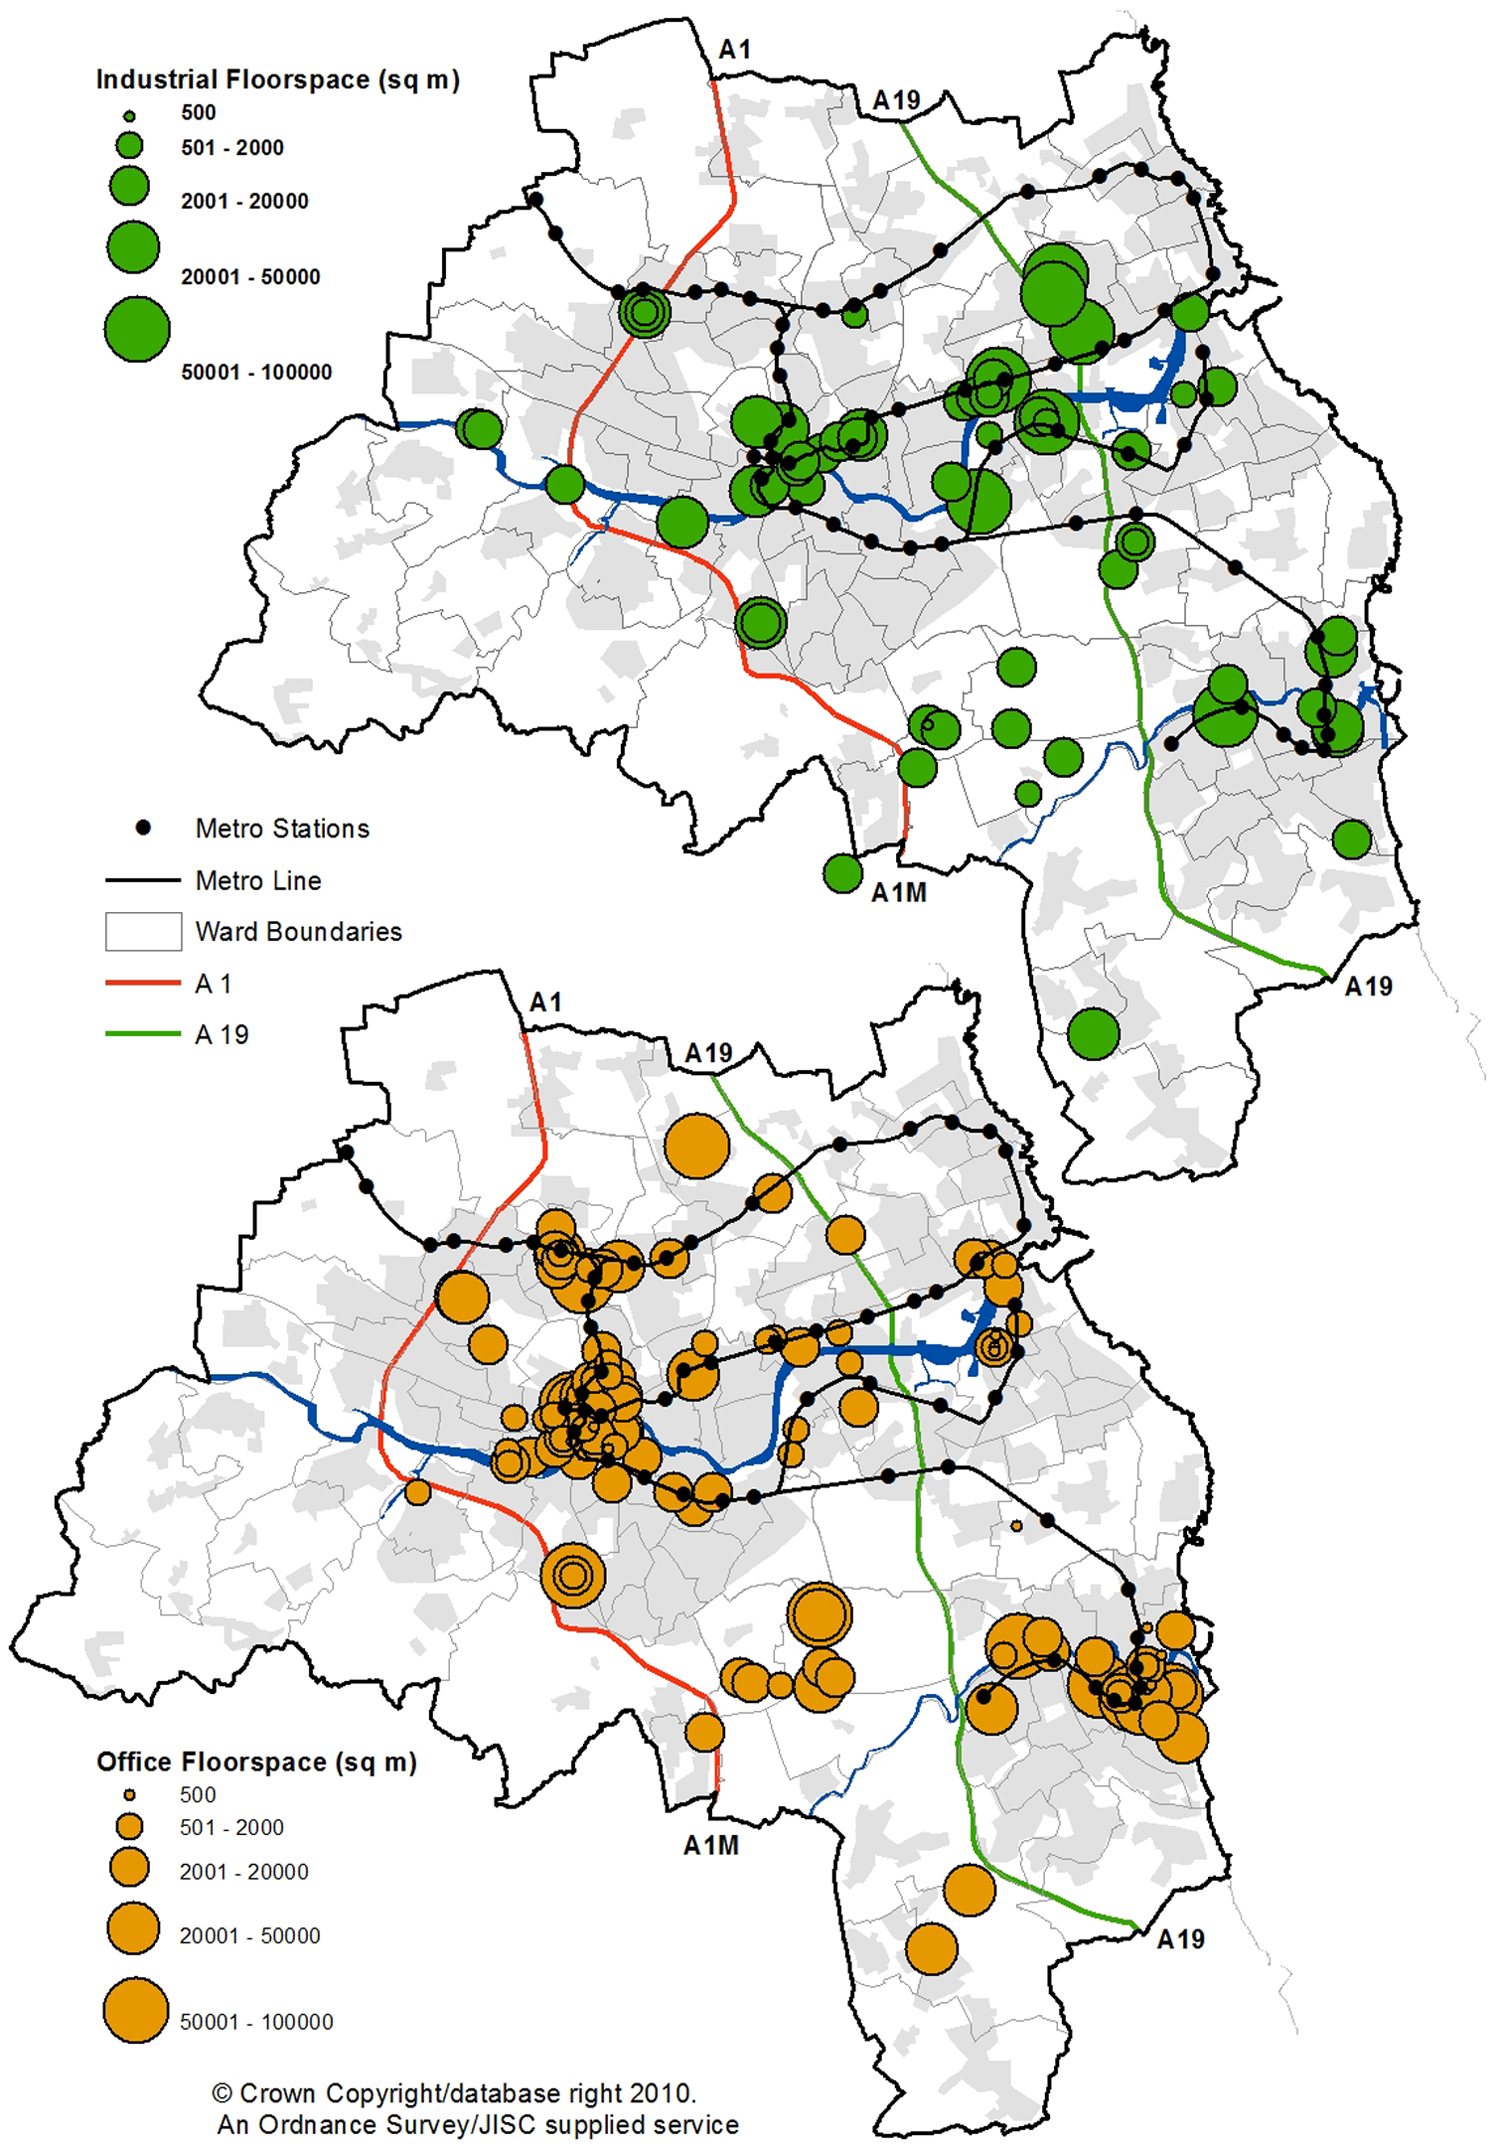
Above: Density of moves by occupier type and size (industrial floorspace). Below: Density of moves by occupier type and size (office floorspace).
Analysis of Movement
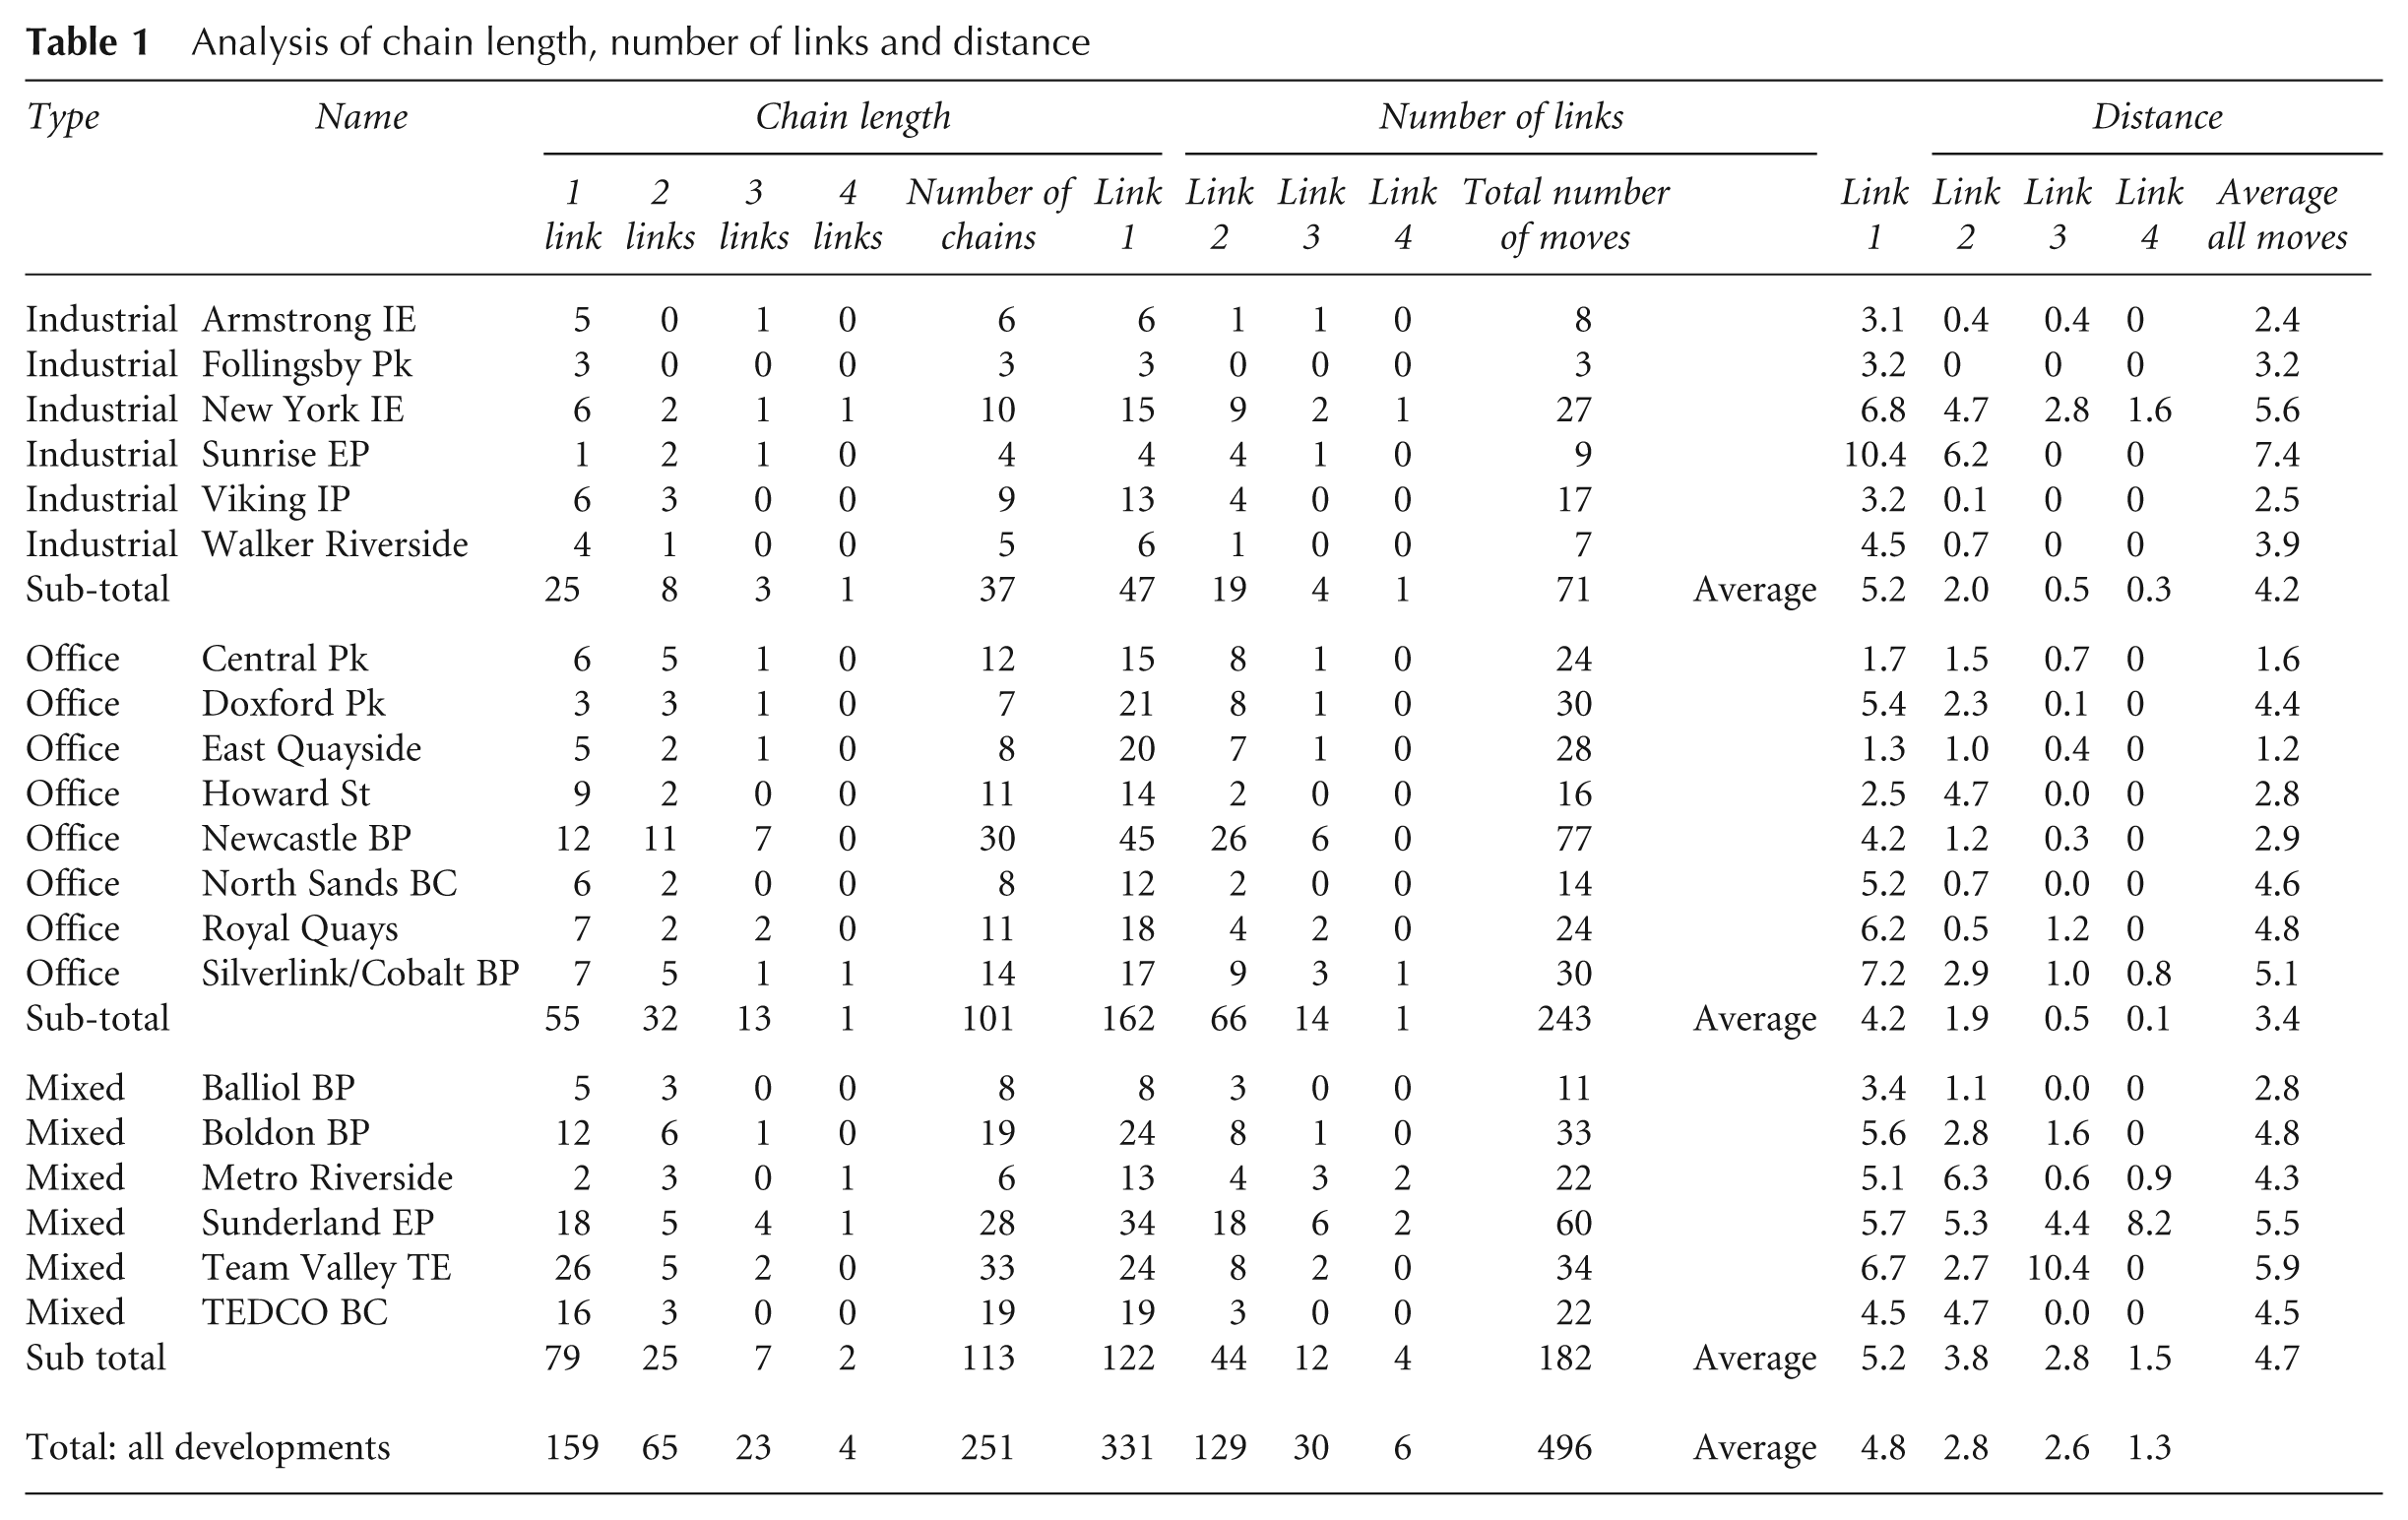
The number of chains diminishes with length, but does the average distance of move decrease the further along the chain it occurs, and does distance vary according to development, end use and location? Table 1 was produced using the ‘movement’ dataset. The level of property market excitation (as measured by the length of chains) was observed to be greater for new, larger, higher-status office and industrial properties. GIS measured the distance moved by all occupiers in every chain. It was hypothesised that the further a property is along a chain, the smaller it is and the shorter the distance the occupier is likely to move—i.e. smaller firms move shorter distances to smaller properties. The study confirmed this, with the average distance of moves decreasing from 4.8km for first moves, to 2.8 km for second, 2.6 km for third and 1.3 km for fourth moves. It is also apparent that industrial occupiers, on average, are prepared to relocate from a greater distance to new premises than office occupiers.
Analysis of chain length, number of links and distance
Using Indices to Identify Significant Characteristics Associated with Displacement
Figure 7 (upper part) shows the pattern of MSOA areas shaded by average RV for the Tyne and Wear conurbation. Higher rateable values (both gross and per unit area) represent a better quality of building in a better location; businesses filtering up property chains, generally occupy premises that command higher rents and as a result generate higher rateable values. As occupiers filter up to higher-value premises, lower-value/inferior premises move down the property ladder to be absorbed by smaller occupiers.
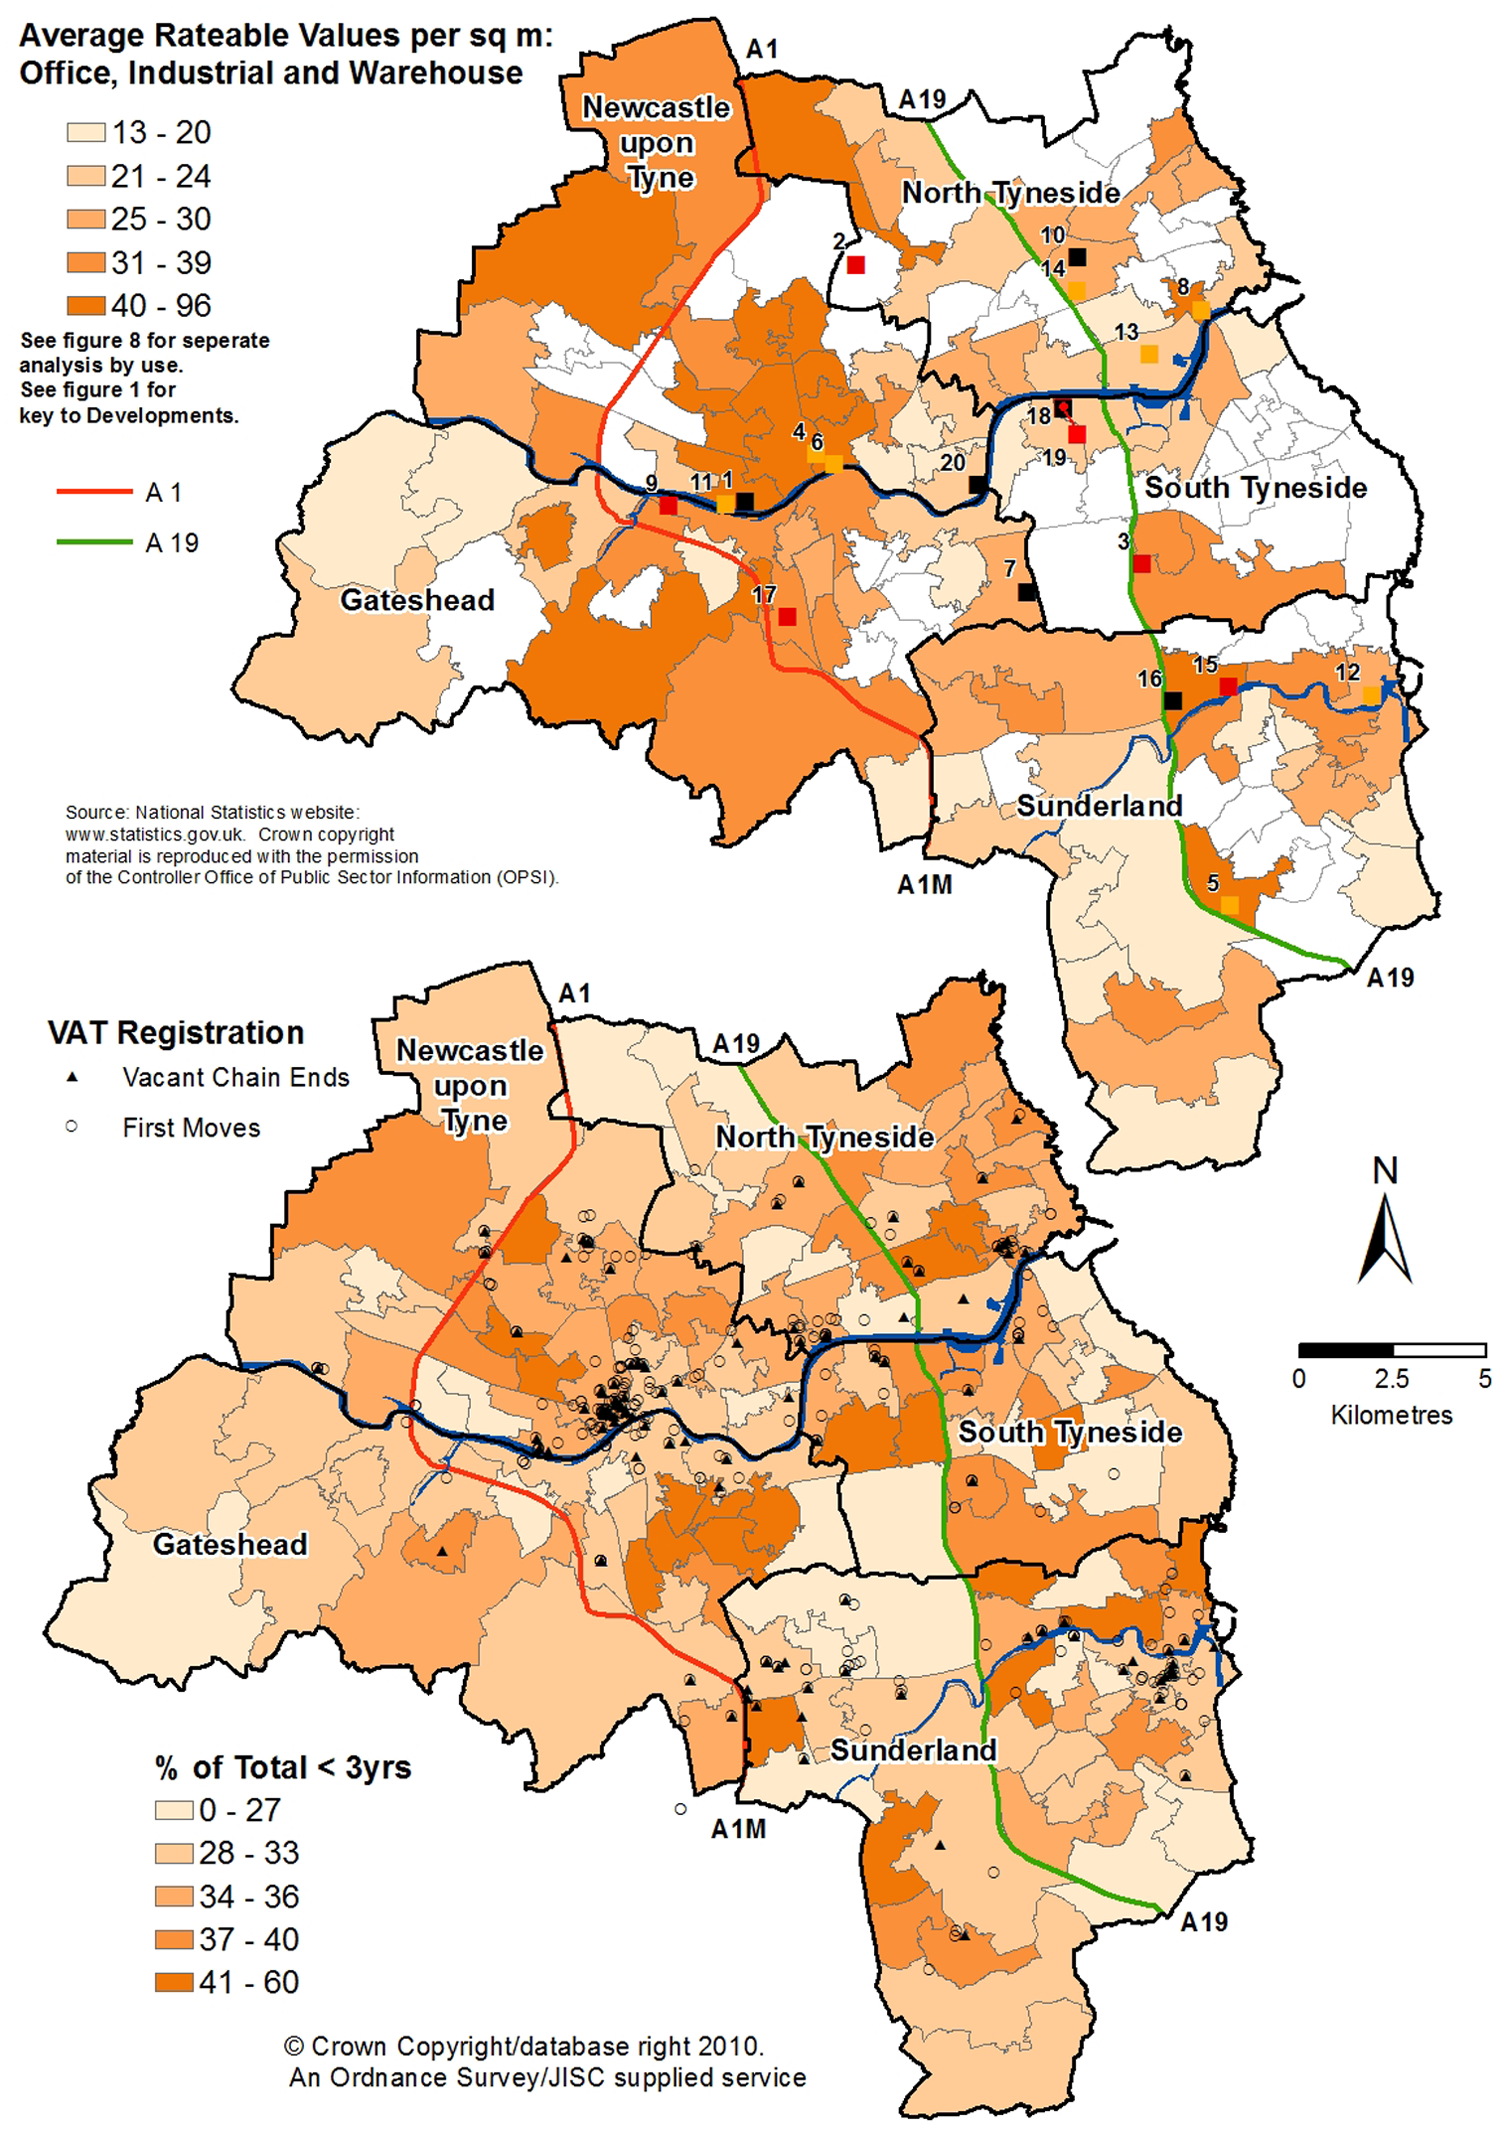
Above: MSOAs by rateable value (per square metre). Below: MSOAs by VAT registration (percentage <3 years).
Dark shaded areas proliferate in and around Newcastle/Gateshead CBD and other outlying sub-centres. The lightest shades are predominantly rural areas at the periphery of the urban area that contain a high concentration of green belt land. However, there are a few exceptions, where large MSOAs contain office and industrial developments at the urban fringe, for example, Team Valley, Balliol/Quorum, Kingston Park and Doxford Park. In some cases, it is the developments themselves that contribute the rateable values that generate the pattern observed.
The lower part of Figure 7 shows the pattern of MSOA areas shaded by the number of new VAT registrations over a three-year period. Despite the two tested datasets being loosely related, there appears to be little apparent correlation between the two maps.
Measuring Property Market Resilience and Vulnerability
Individually, these indicators may be used to characterise the nature of the location of the vacant properties, first moves or chain ends. It is only when this information is used in combination that the facility of GIS as a tool with which to add value to data becomes more apparent. Using GIS to score each individual dataset on a scale that represents the best spread of values, all those locations that score highly in a specific characteristic identified as either positive or negative, when combined, will appear as a distinctive signature. If there is a correlation in the location of chain ends and vacancies identified through the chaining technique, a quantitative measure of the signature of these areas and the characteristics of their resilience or vulnerability can be identified. The two datasets were combined to produce an indicator of resilience or vulnerability. The resulting map was overlaid with the pattern of recorded vacant chain end or first move properties, revealing a different, synthesised representation of the datasets and permitting the identification of ‘signature’ characteristics.
The quantile classification method was employed to separate raw figures for the two datasets, of contrasting units of measurement, into equal numbers for each class break using the range of values for the MSOAs of Tyne and Wear. This then allows identification of the areas where high- or low-scoring MSOAs coincide geographically for both datasets.
Figure 8 illustrates the combined score for MSOAs in Tyne and Wear, with the darker shades indicating areas with high average rateable values and levels of VAT registrations, and lighter shades representing areas with weak property markets and lower levels of economic activity, as represented by the two datasets. The CBDs of Newcastle/Gateshead and Sunderland show as darker shades, although Sunderland city centre is less resilient than the new office and industrial locations on the north bank of the River Wear. Areas showing low resilience, or high vulnerability, proliferate in the former industrial heartlands of Tyne and Wear, notably the east and west ends of Newcastle, North and South Tyneside and some locations at the urban fringe.
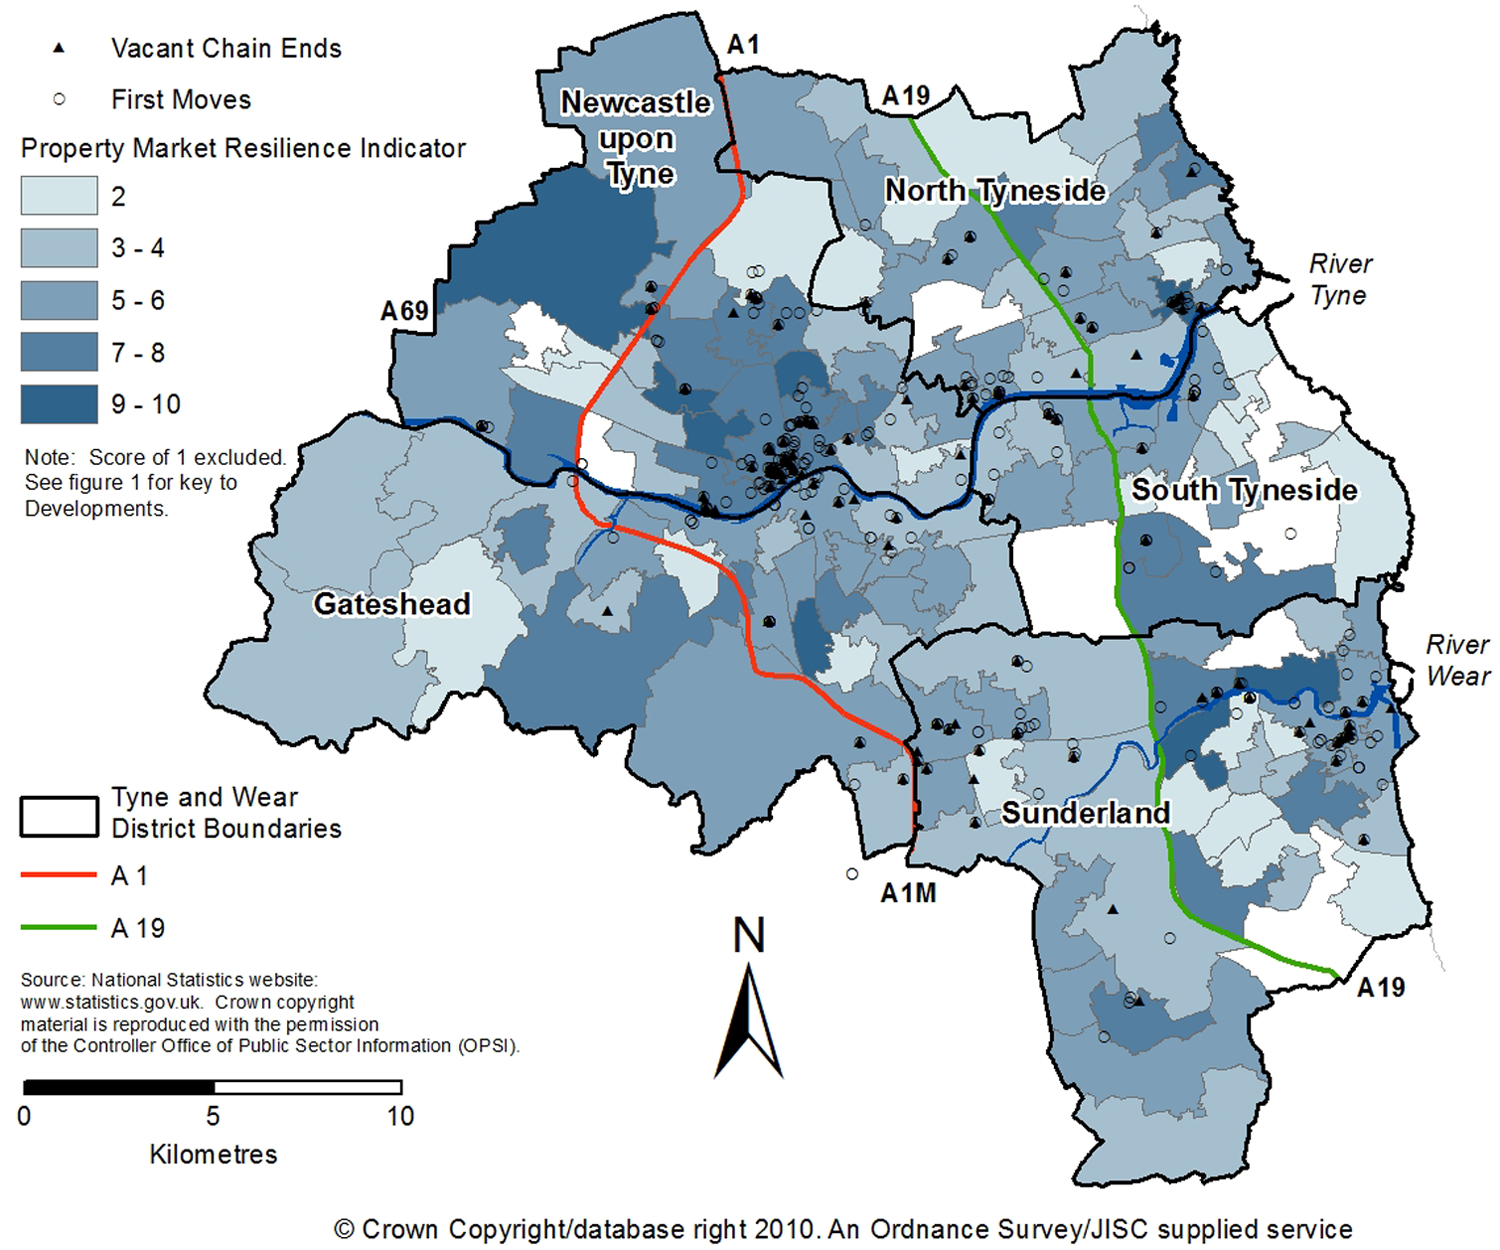
Property market resilience indicator.
The correlation of what we have termed the property market resilience indicator (PMRI), with the number of vacant properties and first moves was tested and demonstrated to be positive but weak. Some patterns do emerge, especially when the characteristics of MSOAs that contain a vacant property are reviewed. It is evident that there is a stronger relationship with the percentage of new start-ups within three years (as represented by VAT registrations), a proxy indicator of economic activity, demonstrated by the correlation of an increased number of MSOAs containing vacant chain ends and first move properties with a decreasing VAT registration score (fewer start-ups within three years as a percentage of the total number of VAT registrations).
The upper part of Figure 9 illustrates that there is an alignment of the indicator with the number of vacant properties and first moves, with more than 90 per cent of MSOAs with vacant and first moves scoring 2 and above, demonstrating that this indicator may have potential to be used in an index of property market vitality. The apparent anomaly at the bottom end is due, in part, to some MSOAs containing little business accommodation to be vacant or to accommodate new business.
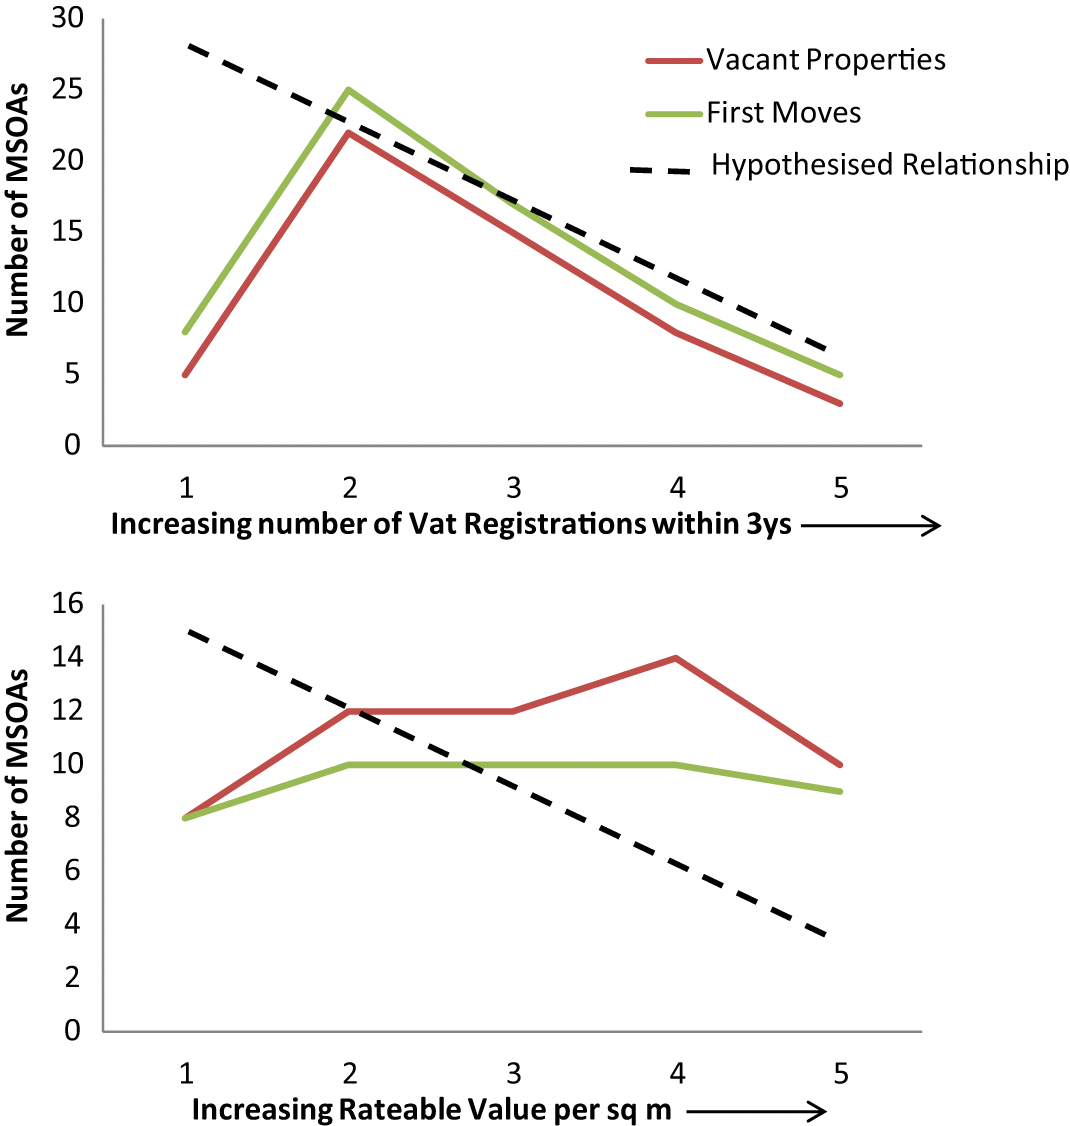
Testing the PMRI indices.
The lower part of Figure 9 illustrates no discernable trend between RV and the incidence of first moves and vacant properties, all quantile scores 1–5 having an almost equal number of MSOAs, thus questioning the suitability of RV as a proxy for property market vitality (see Centre for Urban Policy Studies, 2008).
Notwithstanding this, it is postulated that both the origin of first movers in the office and industrial chains and vacant chain end properties, are located in areas with weaker property markets and local economies, from which occupiers are displaced when new accommodation is developed in the proximity, and in which vacant properties persist longer due to lower levels of new business formation.
Limitations of the Study
This paper presents an experimental study that tests and demonstrates the suitability of GIS to represent and analyse property occupier chaining data. In due course, it should be possible to refine the property market resilience indicator by testing the suitability of other datasets—for example, vacancy ‘experimental statistics’—for incorporation. Other factors or characteristics may be modelled in relation to business locations, such as proximity to transport infrastructure. In particular, further work is needed to improve the representation of the level of recorded vacancy (by floorspace) against the total stock of office and industrial property in a locality which would allow a greater appreciation of the relative density of vacant chain ends.
Conclusions
The application of GIS verified the original findings and extended the analysis; for example, it calculated not only the average distance of first moves, but moves all the way down the chains. The spatial distribution of relocations, from first moves to chain ends and all points in between, has been illustrated with GIS and confirms the hollowing out of Newcastle and Sunderland CBDs and Washington new town. GIS provides an opportunity to introduce some geographical context to the analysis; for example, by imposing road and metro transport infrastructure onto the maps. The clustering of office occupier relocations in proximity to the Tyne and Wear Metro system was remarkable.
A particular focus of the study is on the spatial distribution of vacant chain ends and first moves. Not only has the GIS provided a clear and accurate representation of vacant chain end properties, but it has also been able to relate their pattern to other indicator datasets such as industrial and office rateable values and VAT registrations. By studying the incidence of first move origins and vacant chain ends, it has been possible to identify donor MSOAs of occupiers who relocate to new office and industrial developments and the relative concentration of vacant chain ends across the conurbation. The representation of the density of all moves effectively identifies the locations or ‘hotspots’ with the greatest levels of property market excitation generated by the 20 new developments.
The project establishes a methodology with which to use indices and their spatial pattern (within a GIS) to provide a measure of property market resilience. The resulting GIS has the potential to be used to model future area-based policy interventions, by representing spatial characteristics that predict the relative vulnerability or resilience of local property markets. Two indicator datasets (rateable value and VAT registrations) were tested to identify whether they correlated with the pattern of vacant chain ends and to offer an alternative interpretation of patterns of the origin of first moves and incidence of vacant chain ends. Of the two, the strongest correlation with both first move origin and the location of vacant chain end was with VAT registrations within a three-year period.
The research has demonstrated that GIS can characterise urban areas from an economic and property market perspective. The property market resilience indicator is still under development and needs to be refined further by exploiting other socioeconomic indicator datasets that are increasingly available at finer resolutions. PMRI scores may be generated for areas in a city-region, to identify the push and pull factors that contribute to mismatch and encourage occupier displacement, similar to the way that the IMD and census data are used to represent the wellbeing of localities from a domestic and demographic perspective. Such a tool may be used to measure and monitor the side effects of area-based investment initiatives such as Tax Increment Financing, Enterprise Zones and Accelerated Development Zones, as well as informing local and city-region planning and economic development strategies.
Footnotes
Notes
Funding Statement
This paper is based, in part, on the findings of a research project, funded by the RICS Education Trust, to explore the potential of using GIS to analyse property chaining data: Project 775