
Abstract
For flood-prone urban areas, the prospect of increasing population densities and more frequent extreme weather associated with climate change is alarming. Proactive adaptation can reduce potential flood risks in theory. However, there is limited empirical economics exploring this issue, without which convincing residents within exposed areas to participate in adaptation is challenging. In this paper, a hedonic model is presented of property prices for a flood-prone inner-city suburb of Brisbane, Australia. The study defines a continuous flood-risk variable based on the vertical distances of properties relative to a flood level that occurs on average once every 100 years. The results show significant property-price discounting of 5.5 per cent per metre below the defined flood level. Detailed hedonic characteristics also provided shadow price estimates of housing characteristics and distances to amenities (such as bus-stops, train-stations, parks and bikeways) and these hedonics need to be considered when holistically assessing the dynamics of suburbs for adaptation planning.
1. Introduction
As population densities in urban areas increase, the potential losses due to flooding events can have major economic impacts (Guofang et al., 2003; Hallegatte and Corfee-Morlot, 2011). Climate change compounds the risks from flooding, as sea levels rise and extreme events occur more frequently. Proactive adaptation can help to manage urban flooding risks (for example, Dawson et al., 2011). However, proactive adaptation requires buy-in from the community. People’s wealth is largely tied up in the family home. In Australia, for example, residences account for approximately 40 per cent of personal net worth (Wilkins et al., 2009). How willing residents might be to engage in longer-term adaptations to current and future climate risks will depend on the implications for their net wealth. We use hedonic modelling to uncover the longer-term flooding price signal for residential homes. Hedonic modelling has an extensive history in urban studies (Ball, 2011; Debrezion et al., 2011; Duncan, 2011; Kang and Cervero, 2009). We extend this research by exploring flood-related price discounting along a continuum of risk, such that the impact could be scaled to consider future climate.
Past studies have shown that the impact of flooding is multifaceted, and varies with scale and according to the degree of social inequality and disruption. Baade et al. (2007) contrasted Hurricanes Katrina (New Orleans 2005) and Andrew (Miami 2002). Despite US$100 and US$20.8 billion damage bills for Katrina and Andrew, both events provided local economic stimulus with rebuilding efforts funded by public and private insurance. Longer-term recovery, it seems, is determined by the degree of social inequality and the lack of adaptive capacity in disadvantaged sub-groups. Recovery after Katrina was relatively more problematic than after Andrew in this regard (Rhodes, 2010). The comparison points to the need to consider the distribution of flooding impacts when planning adaptation measures.
In this paper, we explore the city of Brisbane, Australia. In January 2011, Brisbane and other regions of the State of Queensland experienced major flooding which caused shrinkage of the Australian economy by 1.2 per cent (ABC News, 1 June 2011). Past flood impact studies have focused on physical infrastructure (Hall et al., 2003; Hall et al., 2005; Wang and McAllister, 2011). For insurers, governments and industries reliant on infrastructure assets, this is the key measure of impact. In exposed urban areas, residents feel the impact from both damage to their residences, and also via discounting to their land values. After the Brisbane floods, individual land valuations were reassessed, some dropping by up to 20 per cent, with consequent reductions in local council property taxes (Bray, 2011). The tidal section of the Brisbane River extends inland past the bulk of Brisbane’s residents and hence future sea-level rise will directly impact on future flooding levels via drainage for overland flooding and inundation from storm surge. In planning pathways for adapting to the increased risks of flood and coastal inundation related to climate change, and in particular in engaging communities, these economics need to be understood.
Price discounting as a consequence of flooding has only been studied using hedonic analysis of market prices on a small number of occasions, including studies in the US (Bartosova et al., 1999; Bin and Kruse, 2006; Bin et al., 2008; Donnelly, 1989; Park and Miller, 1982; Shultz and Fridgen, 2001; Thompson and Stoevener, 1983;), Europe (Daniel et al. 2009) and Japan (Guofang et al., 2003). Most of these studies attempt to estimate the effect of flooding on residential or commercial prices in the few years immediately following a major event. While hedonic models have been applied to Australian urban systems (Hatton MacDonald et al., 2010; Higgins et al., 2009; Tapsuwan et al., 2009) none has explored the impact of urban flooding. Only simpler statistical analyses of the effects of flood risk on house prices have been conducted in Australia, partly due to paucity of data (Eves, 2002).
Internationally, previous studies generally found that location within a floodplain significantly reduces the property values by 5–10 per cent relative to similar flood-secure housing in the same area (Bartosova et al., 1999; Bin and Kruse, 2006; Donnelly, 1989; Guofang et al., 2003; Speyrer and Ragas, 1991; Thompson and Stoevener, 1983). Other studies found small or no responses (Shaefer, 1990). Further studies have shown no response where decreased values due to coastal flood risk are confounded with increased amenity due to coastal proximity (Bin and Kruse, 2006), or when the time since the last major flood event has exceeded the market ‘memory’ (Bartosova et al., 1999). Very few authors have considered continuous measures of flood risk as a continuous driver of value loss in flood-prone properties (Bartosova et al., 1999).
Some authors have questioned the power of hedonics in analysing historical sales records in order to estimate the real-market-valued costs of flooding because such a conclusion relies on the market’s dubious ability to price high-consequence, low-probability risk (Bouma et al., 2005; Pryce et al., 2011). Land devaluation due to inundation risk measures the market’s estimate of the probability of long-term risk (Shabman and Stephenson, 1996) and there is debate in the literature about ‘market memory’ in the case of natural disasters (Bouma et al., 2005). However, where the question being asked relates directly to the market’s response to flood risk, hedonic analysis is an optimal method as it measures market valuations directly. Forward-looking climate change studies, for instance, are beginning to explore how flood risk may affect land prices directly (Bin et al., 2011).
Hedonic analyses require a great deal of explanatory data in order adequately to decompose individual properties into the factors that explain variation in prices. Furthermore, data tend to come from disparate sources, and most data are costly to purchase, clean and digitise where required. In Australia, a significantly reduced variety of data is stored by local councils, requiring particular attention to synthesis of datasets from multiple sources.
This study analyses a purpose-built dataset which includes flood risk for individual properties, assessed based on vertical metres above observed past flood levels. This allows us to explore both the price discounting that occurs for properties with any flood risk, and then further to explore additional discounting along a continuum of flood risk. Hence, this paper defines a flood plain effect as a function of two parameters within a hedonic model with spatial effects. We present empirical estimates of this effect as well as estimates of the shadow prices of other characteristics. Our data are for a suburb in the city of Brisbane, Australia. Brisbane suffered major river flooding events in 1974 and 2011, yet ours is the first study that provides estimates of the shadow prices.
2. Methods and Data
In the context of this paper, the hedonic function is a model of buyers’ willingness to pay for land or the bundle of land with a structure (detached house). Further, we are concerned with estimating the decrease in value due to the property being in the floodplain. Here, we follow Diewert (2003) where he revisits Rosen’s classic paper and derives a much simpler economic model which is consistent with a time-series dummy variable econometric model of the type used in this study. Diewert takes a traditional consumer demand approach following Muellbauer (1974) and, therefore, in contrast to other approaches (for example, Bartik, 1987; Epple, 1987), such as the producer side of the market is ignored.
The area of the study is a single suburb (in Australia this refers to a geographical sub-division of the city with its own postcode) within what is known as the Inner Brisbane Area. The suburb has some appealing characteristics for the purpose of this study. It is close to the river but it is not at the riverfront. This avoids obvious problems of disentangling river views from the adverse effects of flooding. The suburb contains small waterways which are connected to the estuarine section of the Brisbane River. These waterways cause regular, minor, overland and tidal floods and, in addition, major flooding can occur from the Brisbane River. Hence we expect a market price signal from flooding and we expect that future sea-level rises will proportionally affect local flood risks. The suburb is also very homogeneous, with the majority of the houses either pre-war or post-war (the year 1946 marking a change in local architecture) and located within 5 km (3 miles) from the Brisbane central business district.
Typically, studies include socio-demographic characteristics to capture heterogeneity of the study area. In this case, no such information is available as a suburb is the smallest geographical area for which the Australian Bureau of Statistics provides data such as income per capita. In our model, as presented later, we assume that the marginal impact of flood security on residential sale prices is linear. In reality, in addition to any interactions with income variation over time (and space; Bartik, 1987) we would expect a non-linear decreasing marginal impact as flood security increases. This is a limitation of our model; however, we only explore the marginal impacts within the floodplain and hence the non-linearity at higher levels of flood security does not bias our estimates of within-floodplain residences.
2.1 Sales Data
Our model uses various hedonics to explain instances of residential property sales. Our dataset contains 3944 residential properties sales including 87 vacant land sales. Many properties were sold more than once in our sample period and our sales data relate to records from 1610 properties. Figure 1 shows the distribution of sales for each year in the 1970–2010 sample, although the dataset ends in the first quarter of 2010. Note therefore that our data do not include any sales that cover the recent 2011 major flooding in Brisbane.
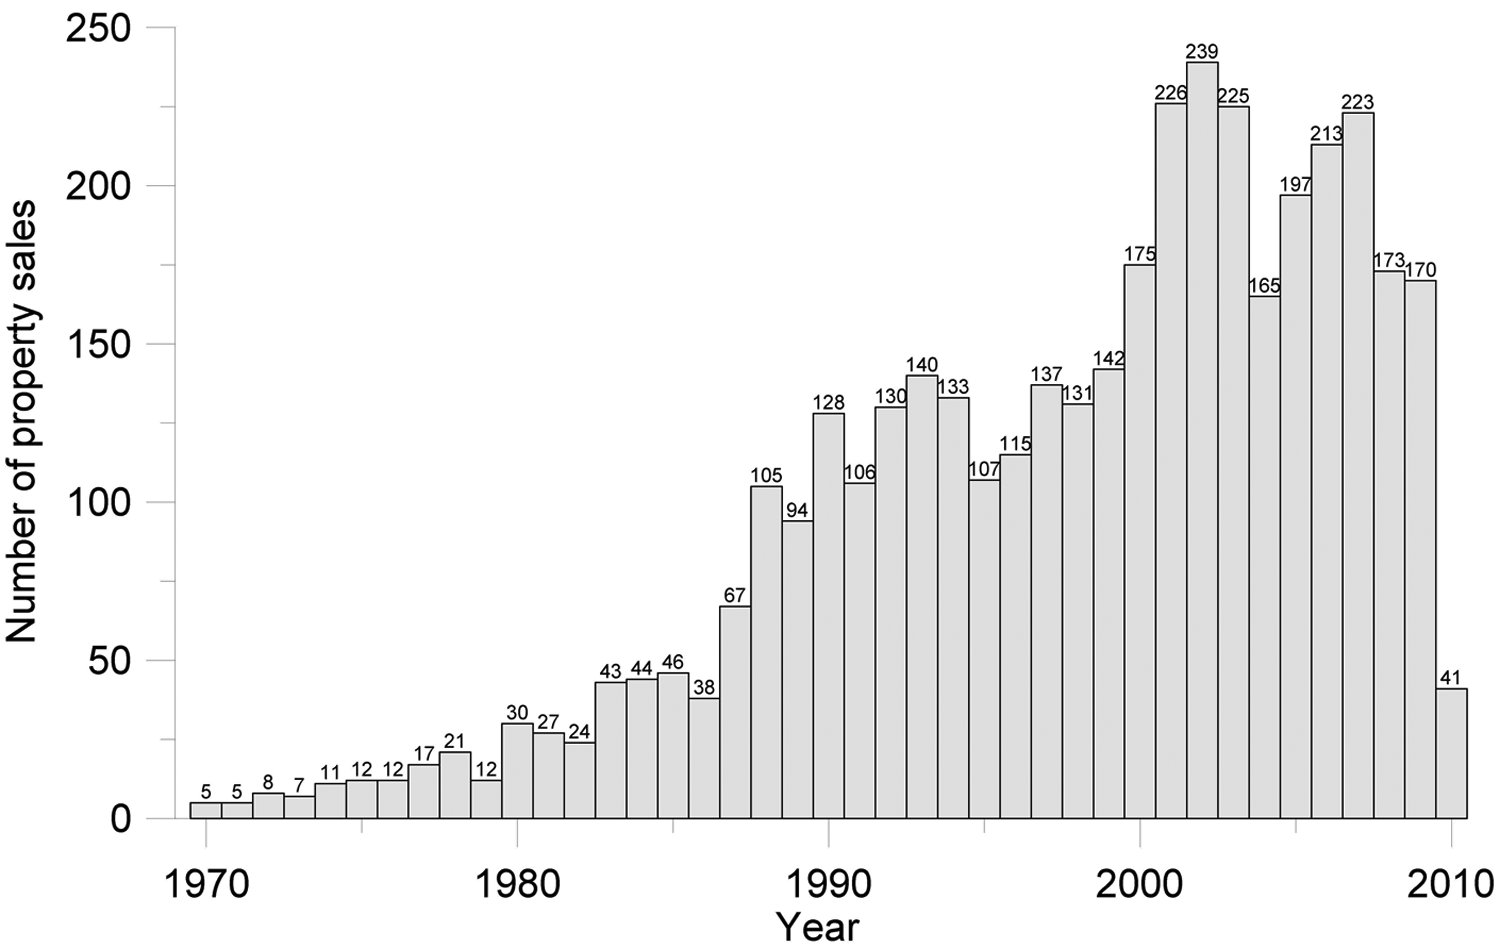
Distribution of sales data used by hedonic model.
We use commercially available property sales data, including sale date, sale value, street address, size of the lot (land size) and a series of attributes (RP Data Ltd). These data were combined with local government geospatial data, aerial imagery and terrain characteristics to estimate the structure’s age and to proxy the structure size. Only normal property sales (all other sales, such as gifted or partial sales were excluded) with a land use description of vacant land (i.e. Vacant—large house site; and Vacant—urban land) or dwelling (i.e. Dwelling—large house site; or Single Unit Dwelling) were used.
Substantial cleaning was required to remove obvious errors from the commercially provided data. This process involved cross-checking against additional data sources including local government sources (for example, the local council’s property planning and development website and other real estate data sources) 1 and aerial imagery sources including images supplied by the local government and on-line sources such as Google Earth (using its Historical Imagery feature) and Google Street View (see Appendix for more detail on data cleaning). Once cleaned, the dataset was combined with numerous other information sources, such as geospatial data and aerial imagery to build a more comprehensive set of hedonic and spatial hedonic characteristics.
2.2 Our Model
The econometric model used for estimation is the well-established time dummy hedonic model
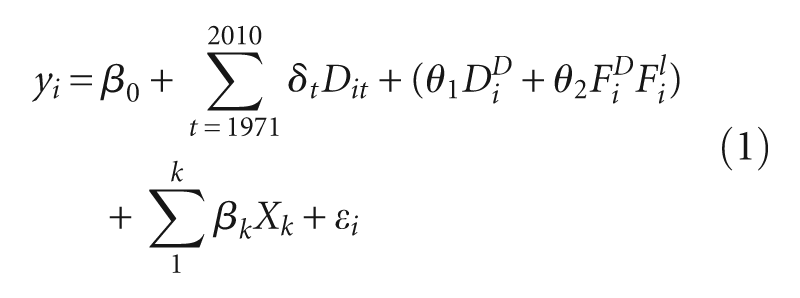
The dependent variable,
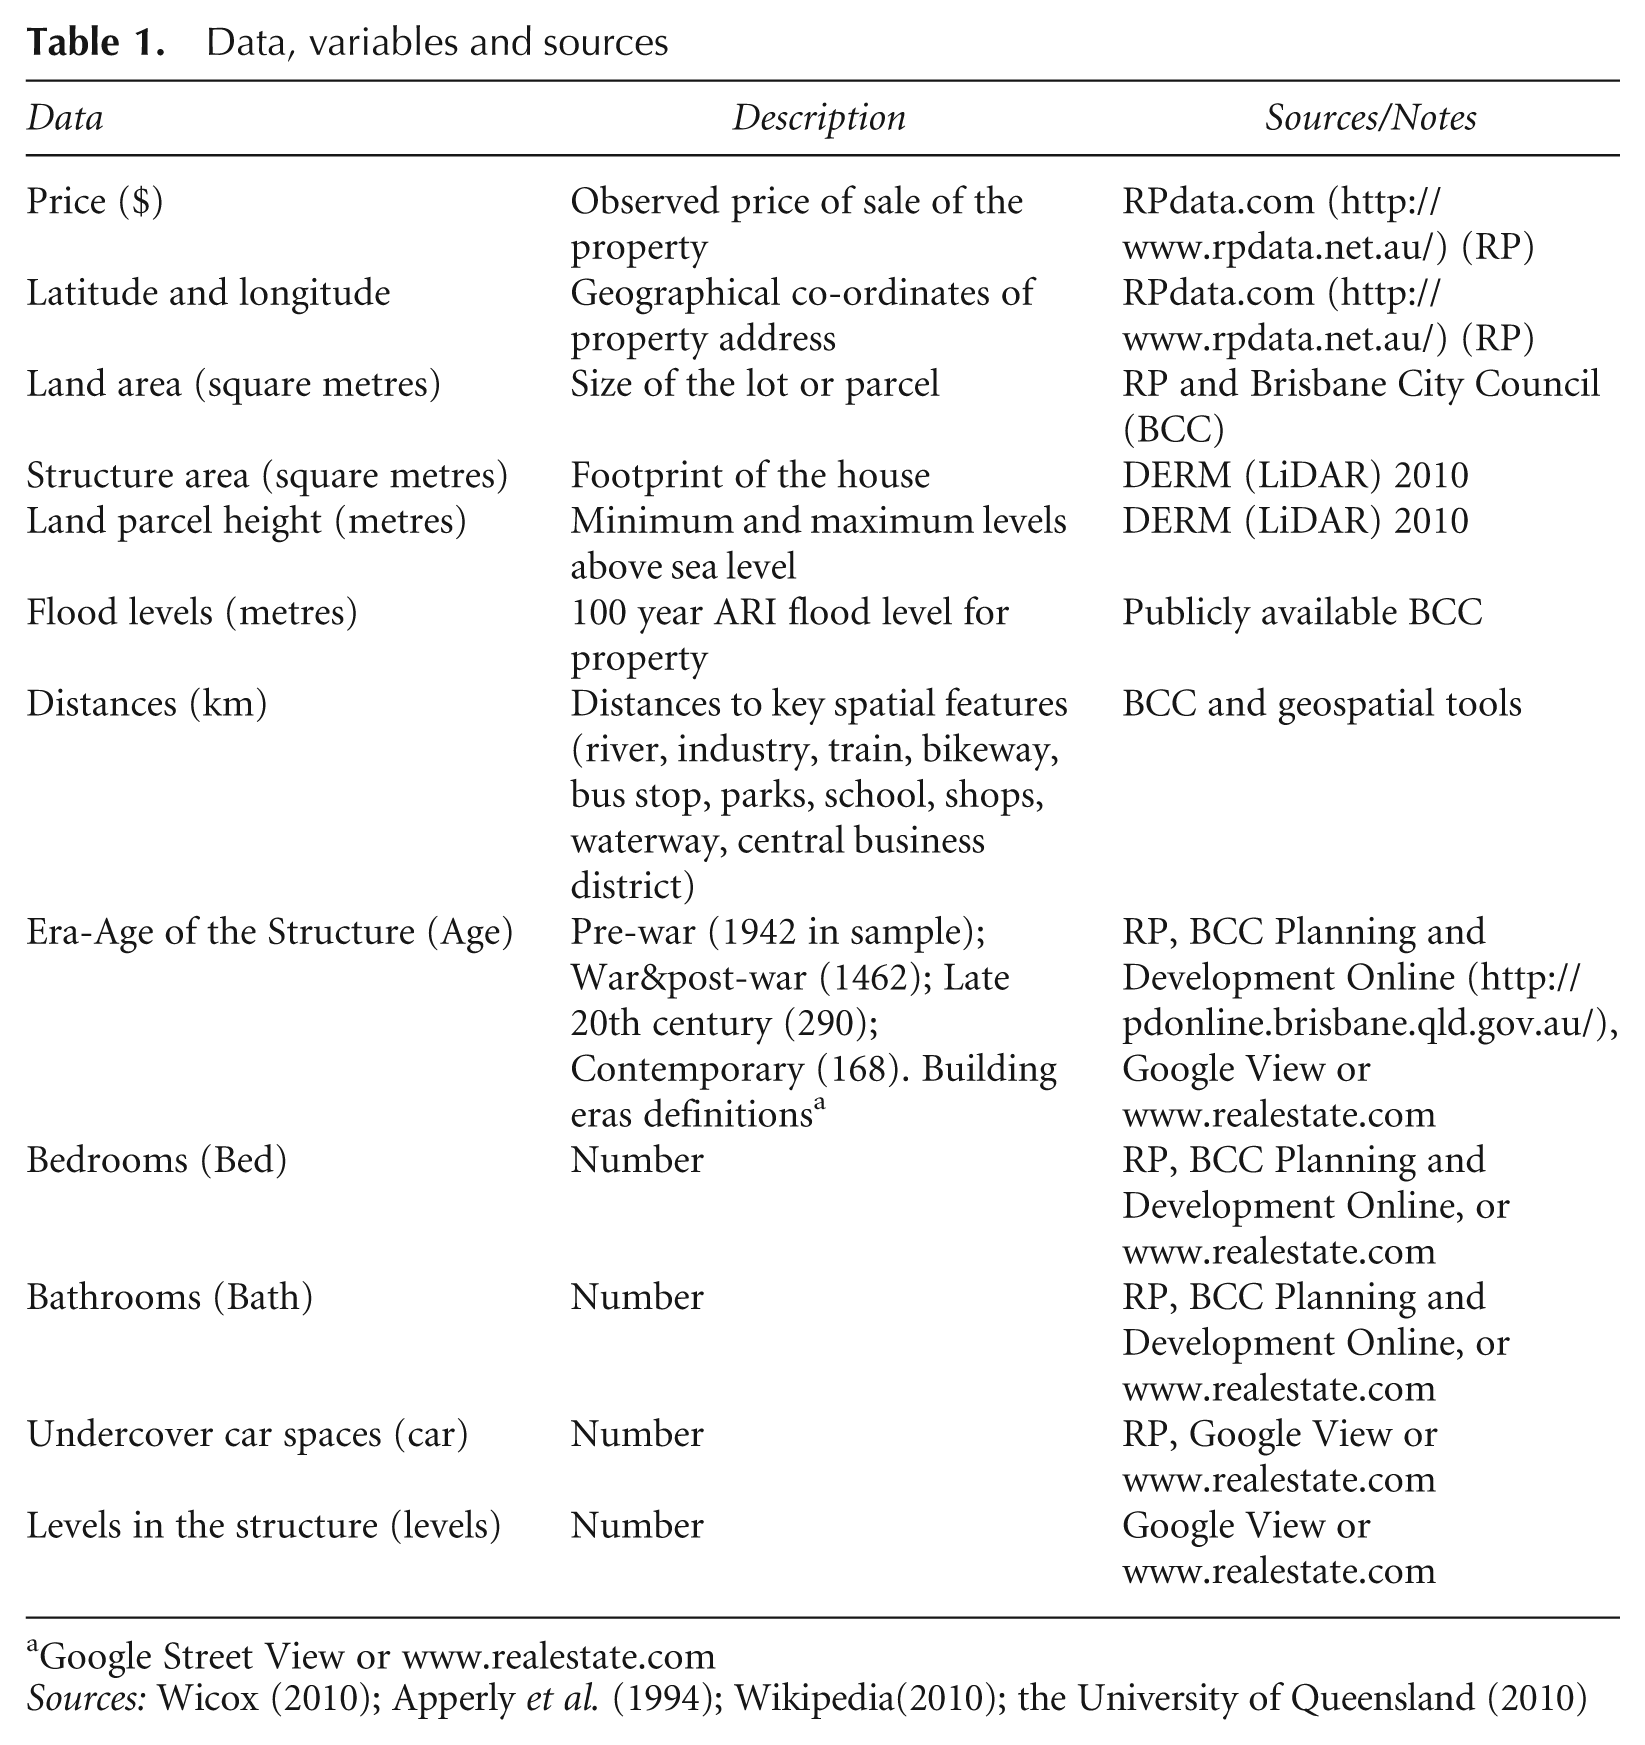
Data, variables and sources
Google Street View or www.realestate.com
Hedonic models are usually estimated in linear or log-linear (semi-log) forms. We estimated both log-linear and linear forms and found the marginal effects to be comparable when evaluated at the mean prices. Hence we choose to use the log-linear specification which has advantages in terms of interpretation. The slopes (marginal effects) and elasticities of characteristics are a function of price and therefore they change over time with sale values. In the log-linear form, the coefficients can be easily interpreted as the proportional change in the price given a one-unit change in the characteristic. This allows us to interpret the floodplain effect as a percentage impact on the value of the property.
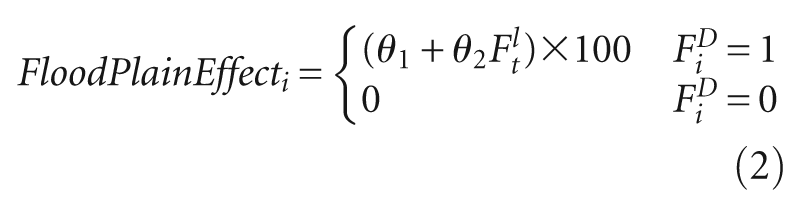
We define the floodplain effect on the property associated with sale i in the floodplain as
Two spatial variations of the model are estimated, a spatial error model (SEM) and a spatial Durbin model (SDM). The SEM model assumes that any spatial dependence results from omitted hedonic characteristics and is thus captured through the unobserved component of the model, ϵ i . The SEM model is equation (1) where the random error is assumed to be spatially autocorrelated

where,

Thus, the
The SDM specification of (1) is
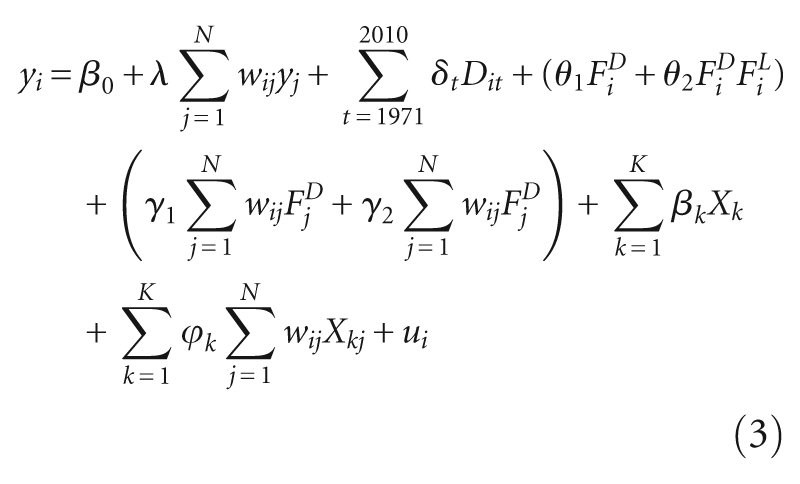
where,

where,


The averaging over the direct impact associated with all observations i (in equation (4)) is conceptually similar to the typical regression coefficient representing the average response of the dependent to the independent variables.
2.3 Explanatory Hedonics
The econometric specification of hedonic models is highly dependent on available data (see Sirmans et al., 2005, pp. 5–6). Although a very large number of hedonic attributes can be included in a hedonic function, it is clear that some are more crucial than others (Sirmans et al., 2005). For instance, houses are durable assets and thus undergo a quality change over time (depreciation); however, without information on the age of the structure (year of build), the hedonic function could be severely mis-specified. On the other hand, lack of information on the type of roof is unlikely to induce large biases.
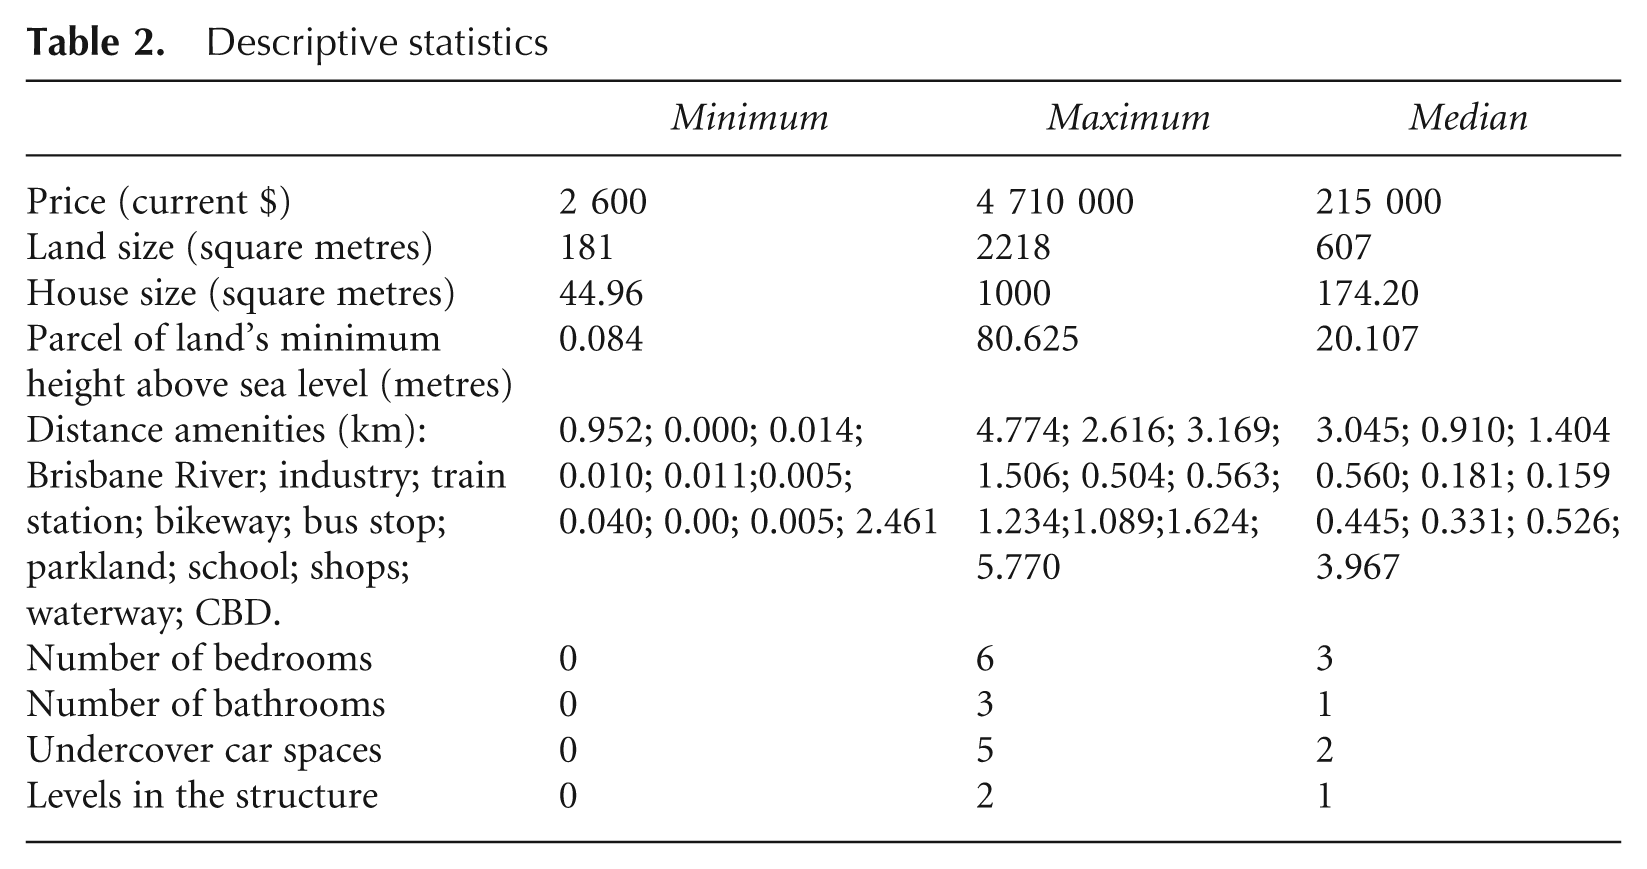
The explanatory hedonic characteristics used in our study are presented in Table 1, with descriptive statistics in Table 2. The dataset was constructed by merging commercial individual transaction records with government spatial data. As a result, very detailed hedonic characteristics are included in the dataset and thus the study also provides estimates of the shadow prices of housing characteristics (such as bedrooms and bathrooms), structure (extra square metre in size of the structure), land (extra square metre in land size) and of the distance to several amenities (such as bus stops, train stations and schools).
Descriptive statistics
The age of the structure (i.e. the year it was built) is a key variable, but one often not available in Australian datasets. 2 Only around 7 per cent of the commercially purchased dataset records were supplied with a build year. To establish a proxy for build year/age of the structure on-line sources, largely Google Street View, were used to view each property and determine, through expert knowledge, a build era (see Apperly et al., 1994; The University of Queensland, 2010; Wikipedia, 2010; Wilcox, 2010). The identified eras were pre-war (pre-1946), post-war (1946–60), late 20th century (1960–2000) and contemporary (2000 onwards). At the same time, this process was also used to collect the additional hedonic characteristics of number of levels of each structure and the building and roof material of each structure.
Geospatial data were used in the determination of the distance of properties to key amenities (such as parks, train stations, schools and waterways), their minimum and maximum ground levels, and the footprint of each structure. All spatial calculations were done using the ESRI ArcGIS platform. Distances to key amenities were calculated using the Euclidean distance. This was a measurement of the straight-line distance from the centroid of each land parcel to the closest object of interest, such as a park, train station, bus stop, school, the coastline or a waterway. The minimum and maximum ground levels of each land parcel were determined from a digital elevation model (DEM) at a spatial resolution of 5 metres created from LiDAR data (DERM 2010).
3. Results
Maximum likelihood estimates of the parameters (except for
Time-dummy spatial models: explanatory variables (N = 3944)
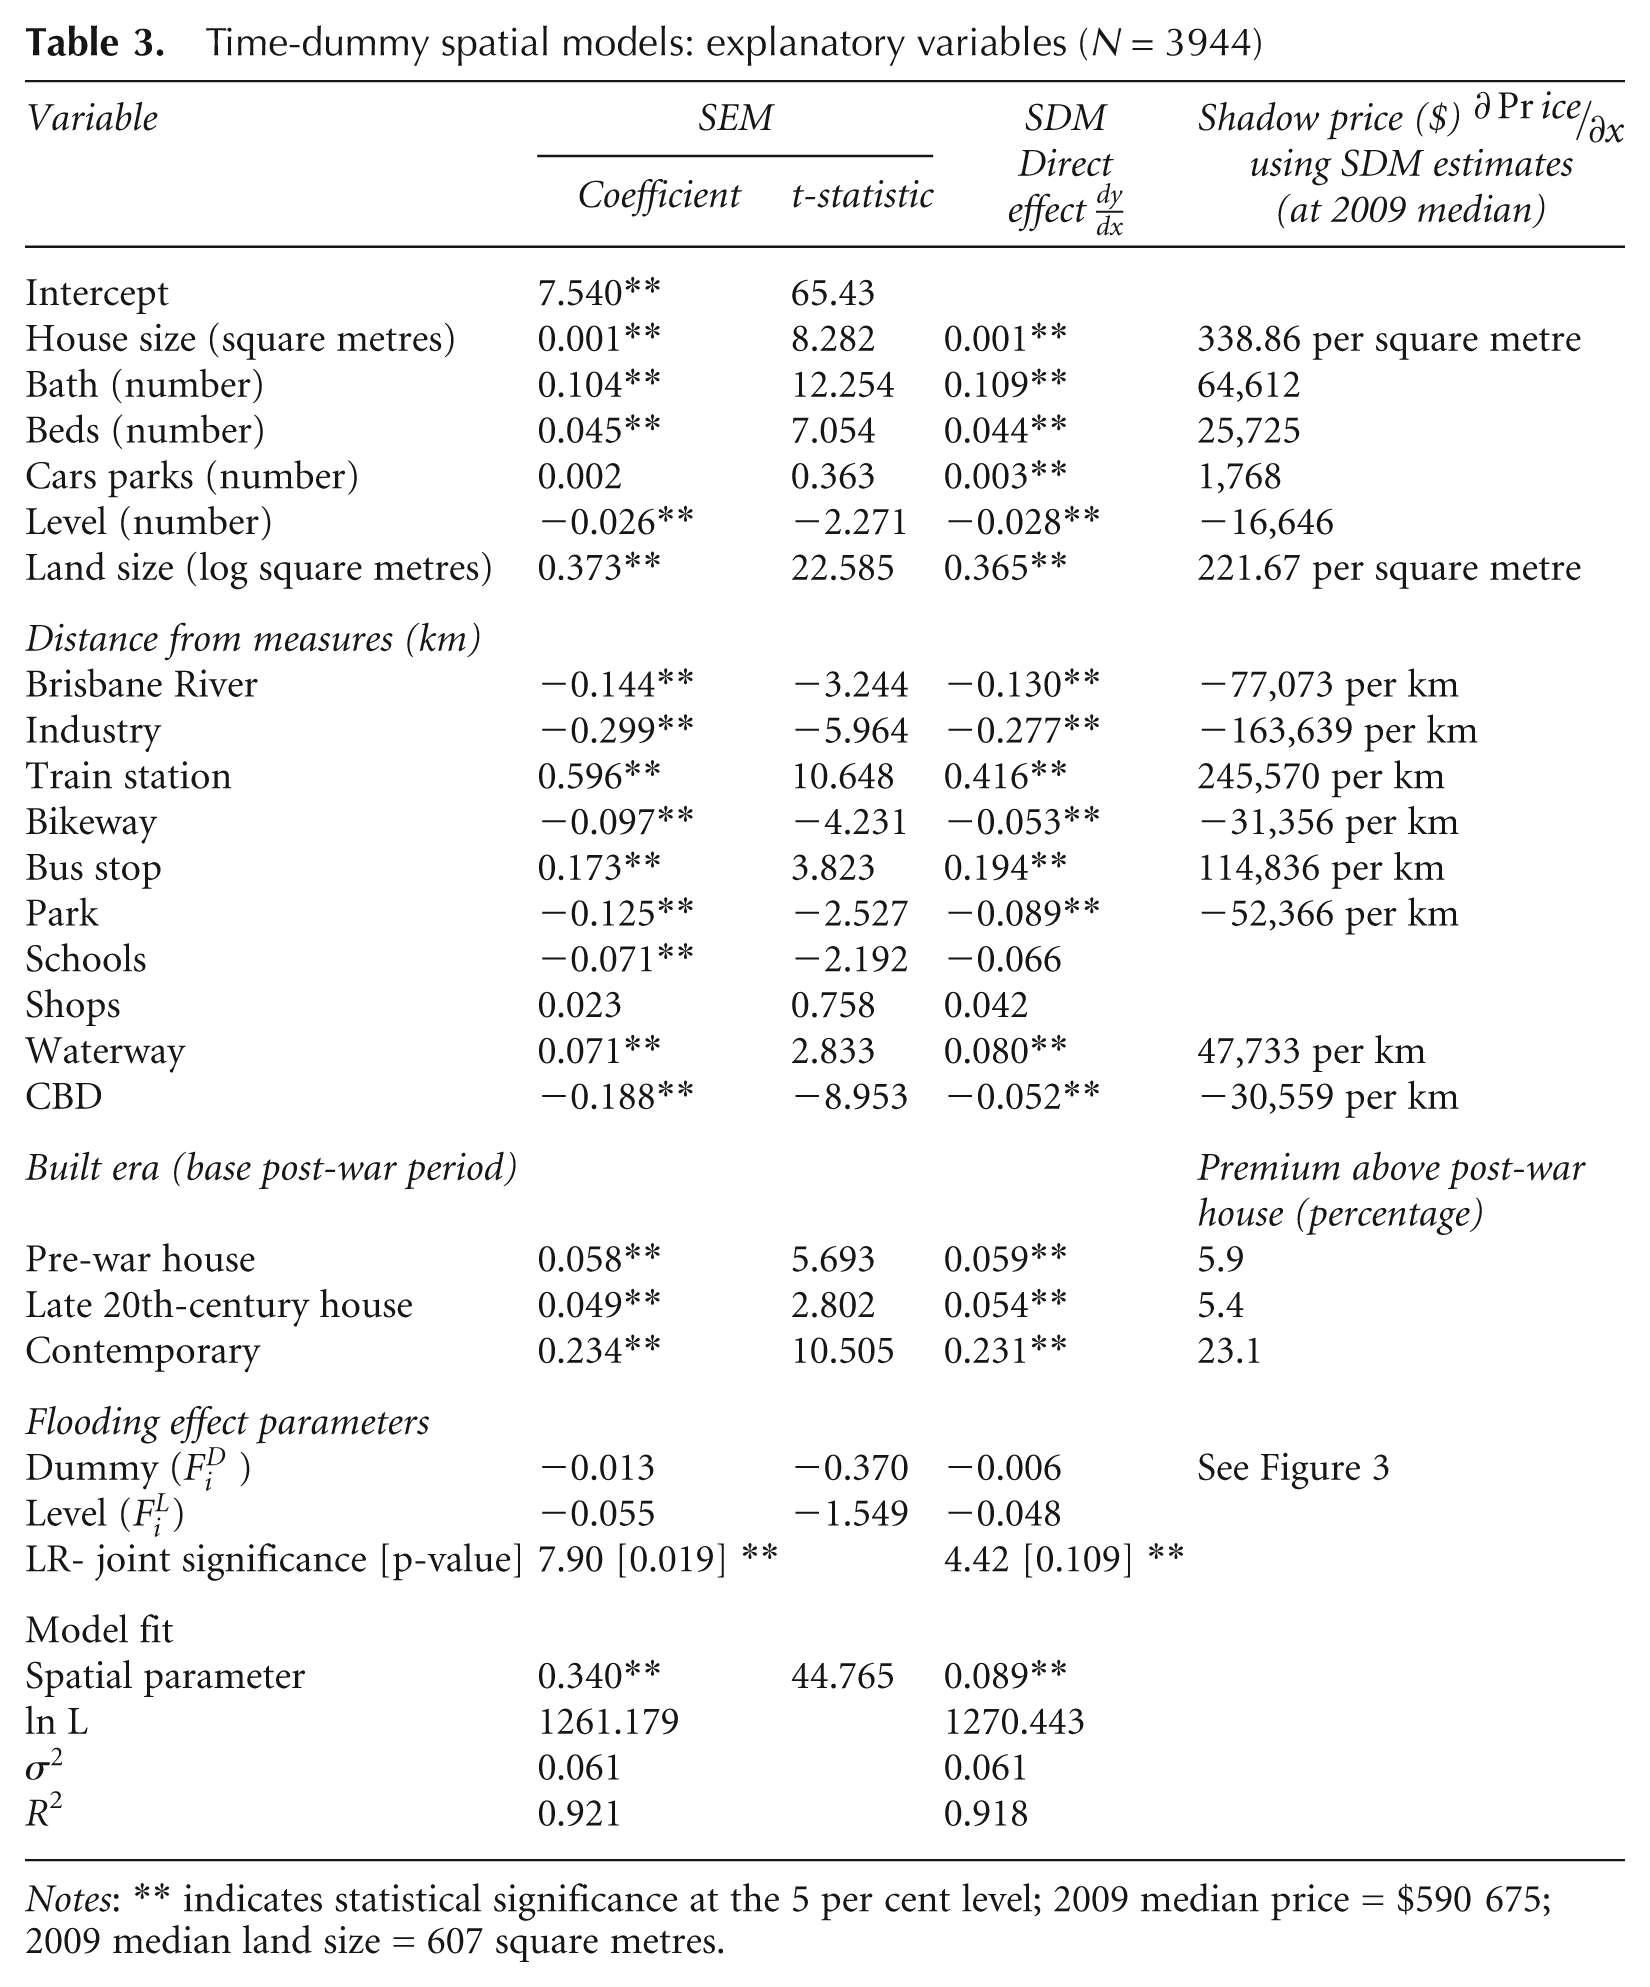
Notes: ** indicates statistical significance at the 5 per cent level; 2009 median price = $590 675; 2009 median land size = 607 square metres.
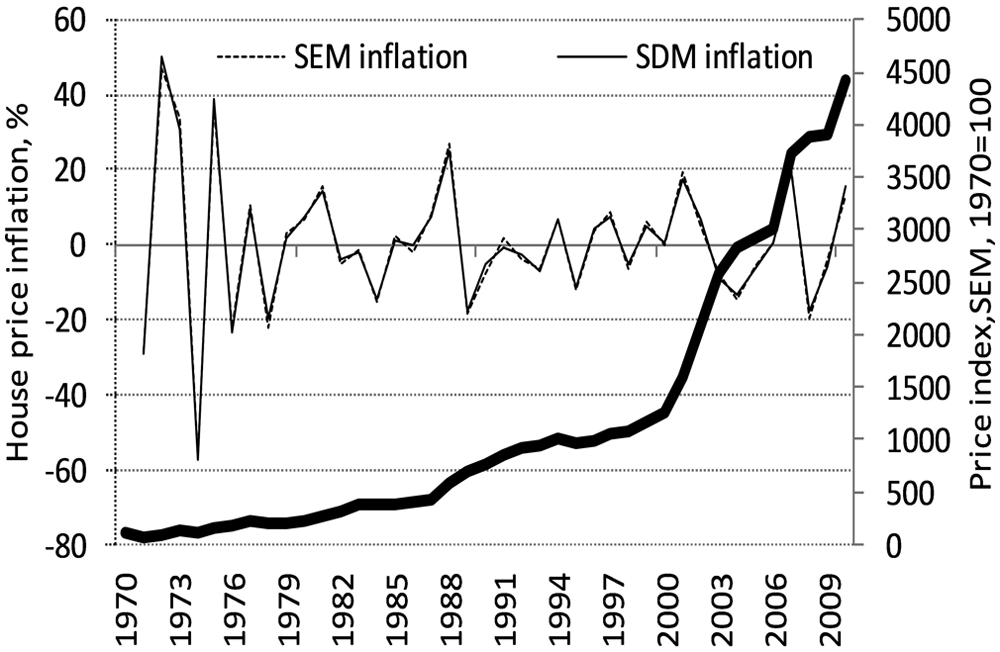
Computed time-dummy hedonic price indices.
3.1 Flooding
The floodplain effect as defined in equation (2) is a function of two variables in the model—a dummy and a continuous measure. These two variables are highly collinear by design and thus their statistical significance is best evaluated through a joint test as individual t-ratios are likely to be low even if they are jointly significant. The likelihood ratio test (and p-value) for the null hypothesis that they are jointly zero is rejected at the 5 per cent for the SEM (p-value = 0.019), but cannot be rejected for the SDM (p-value = 0.109). The SDM estimates are not only less significant, but also result in a lower discounting per metre below the floodplain (Figure 3). A property with its lowest ground level 1 metre below the 100-year ARI flood level is expected to have a discount of 6.8 per cent based on the SEM floodplain effect estimates (1.3 per cent + 5.5 per cent, Table 3) and 5.4 per cent based on the SDM (0.6 per cent + 4.8 per cent, Table 3).
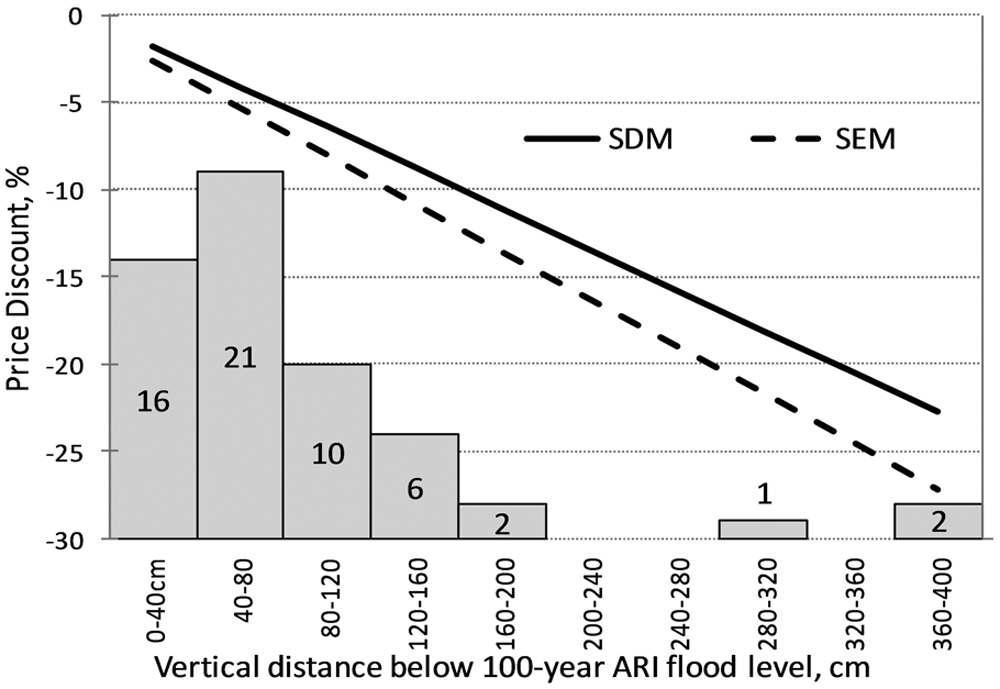
Estimated relationship between the degree of price discounting and the vertical distance of a property below the 100-year ARI flood level. The histogram indicates the distribution of the 59 properties exposed across vertical distance levels. Note: these 59 properties accounted for 169 of our total sales data from within the 100-year ARI floodplain.
In order to draw comparisons with previous studies, we also re-estimated the model excluding the interaction term
3.2 Other Hedonics
The average direct impact estimates from SDM (Table 3) are very similar in size to the SEM coefficient estimates for most hedonic characteristics of the property, although the number of carparks was only significant in the SDM. There are some differences in the estimates associated with distance to amenities. For example, distance to schools is significant in SEM but not in the SDM, although the estimates are close. In the case of distance to parks, both models produce a negative and significant estimate but they differ in the size of the derived shadow price,
Dummy variables show that a pre-war style home is 5.8 per cent higher in value than a war/post-war home (war/post-war homes being the base in our model). This is a vintage effect which has been referred to in the real estate literature (see Sirmans et al., 2006 for discussion). Homes built in the late 20th century are 4.9 per cent higher in value than those built in the war/post-war era, while contemporary homes (built in the past 10 years) are 23.4 per cent higher in value than those built in the war/post-war era.
From our results, we estimate average annualised property growth of 9.9 per cent between 1970 and 2010 (Figure 2). This is not adjusted for inflation, and otherwise is likely to be driven by land prices due to the proximity of the suburb to the CBD. We also compared our sales data with official government valuations published by the Queensland Government. For 170 properties sold in 2009 and 37 in 2010, government land valuations averaged 69.7 per cent and 62.3 per cent of the observed sale value in our dataset. This suggests that in our case study area land comprises the major share of property value.
4. Discussion
The study used a hedonic approach to evaluate the willingness to pay for a property (land and structure) in an inner Brisbane city suburb which contains areas that are in the floodplain. The approach we applied is data intensive and provides for a variety of results on what residents value. However, our purpose was to use the hedonic housing features such that we can more accurately isolate the impact of flooding.
The sample used in this study includes 3944 property sales. Of these, 169 relate to sales of properties with their lowest ground level below their 100-year ARI flood level. Using our specially constructed dataset, the study defines a continuous effect of flooding such that the discount in the property price depends on its vertical distance below the 100-year ARI flood level.
The city of Brisbane and its surroundings is one of Australia’s fastest-growing regions. It is also coastal and low-lying and the combination of exposure and impacts led the Intergovernmental Panel on Climate Change (IPCC 4th Assessment) to identify the region as an international vulnerability ‘hot spot’ for flooding, storm surges and sea level rise. Our results are for a suburb subject to storm and river flooding and, because the suburb drains to the tidal section of the Brisbane River, future sea-level rises will increase flooding risk and this will pose critical challenges for adapting to climate change.
Our spatial error model (SEM) indicates that, for every property exposed to 100-year ARI flooding, prices have a significant discount, all else being equal. This finding is consistent with international studies (Bartosova et al., 1999; Bin and Kruse, 2006; Donnelly, 1989; Guofang et al., 2003; Speyrer and Ragas, 1991; Thompson and Stoevener, 1983). Furthermore, for our case study we show that for every vertical metre a property is below the 100-year ARI mark, additional discounting applies. The spatial error model (SEM) showed that properties in the 100-year ARI floodplain level experience a 1.28 per cent price discount, with an additional 5.45 per cent discount per metre below the 100-year ARI mark. The comparable spatial Durbin model (SDM) shows weak significance (just outside the 10 per cent level) for the continuous flood effect. The SDM is not a parsimonious model and thus extracting the signal from the small proportion of properties that are in the floodplain is relatively harder, but a signal is nevertheless found at a marginal level of significance. Further, when the SEM and SDM were fitted with just a dummy variable coding if the property is in or out of the 100-year ARI floodplain, the relevant flood effect parameters were significant at the 5 per cent and 10 per cent levels respectively.
Pryce et al. (2011) recently proposed a conceptual model whereby property sale prices fluctuate between their true flood-risk-adjusted and their zero-risk price equivalents. After flood-free periods of time, prices trend up towards their risk-free values as myopic and amnesiac behaviour erodes the true impact of flooding. Questioning if the results from hedonic models like ours are based on the risk-adjusted prices or their zero-risk equivalents guides more a careful interpretation of their results.
Our case study area experienced major Brisbane River floods in early 1974 and 2011. While our dataset does not include sales post-2011 flooding, it does include sales around the 1974 floods. Our results suggest a short-lived price effect from the 1974 floods (Figure 2). However, more than 97 per cent of our data are for sales more than six years post-flooding (Figure 1). Given the limited number of transactions in the early part of our sample, we expect high volatility of the earlier index values and this questions the accuracy of any price impact observed around 1974. The fact that we find evidence of an overall flood effect suggests that, for our case study, minor floods throughout our sample period are regular enough such that flood-prone properties tend not to reach their zero-risk price (Pryce et al., 2011, Figure 3). 5 This may also point to the specifics of flood risks in settlements along tidal estuaries. Even when overland floods are infrequent, high tides penetrate the suburbs and flood low-lying green space. This recurrence of observing even small floods can remind homeowners of the risks, potentially suggesting stabilisation of house prices with a long-term impact of flooding somewhere between the fully risk-adjusted prices and their zero-risk price equivalents. While such ideas need further testing, overall, the significance of the flood effect is consistent with our expectations for our case study. Evidence that flood risks are valued highlights major issues for regional planning in the context of climate change.
Our results analyse hedonics that are already embedded in the local housing market and we look at the long-term impact of flooding rather than the impact of a flood event. Because in our case study flood events drain through, and flood via a tidal river system, local flood events are compounded by sea levels. This allows us to interpret our results against our detailed dataset and climate change scenarios for sea level. As sea levels rise, more properties will become part of the 100-year ARI floodplain, up from 3.6 to 5.1 per cent of all properties with a 50 cm rise (Figure 4). For this increasing number of properties that are in the floodplain, based on the significant SEM flood effect, the average price discount to their properties also increases, up from 5.7 per cent to 6.7 per cent with a 50 cm rise (Figure 4). While climate change projections are uncertain, local planning guidelines are likely to factor in an 80 cm rise by the end of the century. Adaptations to sea-level rise will include planned retreat, retrofitting building standards and modifying drainage infrastructure. An understanding of how adaptations will impact on residents’ net worth will help policy-makers more accurately to value the benefits of various adaptation options.
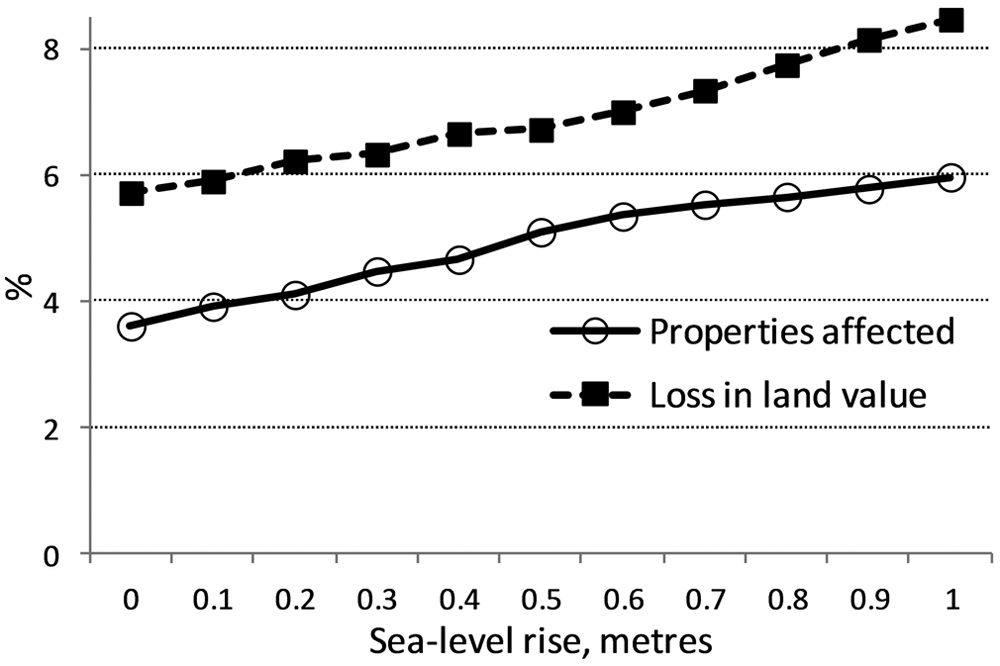
Impacts of sea-level rise on: the percentage of case study properties exposed to 100-year ARI flood events; and the average price discount due to flood risk for those exposed properties, based on the spatial error model.
Climate change or not, potential flood risks are uncertain in Brisbane. Brisbane is young by European standards (circa 1840s). The past 100 years have been quiet in terms of major storm activity (cyclones/hurricanes) (Levin, 2011). Hence, it is possible the hedonics on flood risk that are built into prices are overoptimistic. In future climates, the region is likely to see increased extreme events and flooding, and planning in existing, flood-prone areas is the real crux for adaptation in the region (Wang and McAllister, 2011).
Yet planning needs to consider more than just flood mitigation and our results also talk to the dynamics of changing suburb structures. House prices decrease with distance from parks. Staged resumptions of exposed housing are an opportunity to create additional green space which will improve the hedonics for some residences. Likewise, newly created green spaces could facilitate bikeways which also significantly boost values. The suburb dynamics created by resumptions will also have impacts for density and the feasibility of transport and shopping options, all of which need to be balanced when thinking about the economic motivations for land holders, and the economic and social feasibility of policy.
Planning for climate risks, particularly under future climate change scenarios, will require multilevel governance frameworks which involve governments across scales, industry and the community (Funfgeld, 2010). A great deal of conceptual research has explored the need to build multilevel urban governance and networks across cities (Betsill and Bulkeley, 2006; Bulkeley and Betsill, 2005; Bulkeley and Kern, 2006). Empirically, studies are emerging that look at the private-sector interest in urban governance (for example, Cook, 2009; Koppenjan and Enserink, 2009; Moore and Bunce, 2009; Taylor et al., 2012). How motivated urban residents are to engage in governing climate adaptation will need to be informed by when and where the costs and benefits of adaptive responses manifest. In developing a detailed empirical case study of how the risks of flooding impact on personal wealth, our research builds a platform from which to examine state and community interactions.
Footnotes
Appendix
While our main data-cleaning approaches are outlined in the main body, here we outline additional checks used to ensure data quality
‘PD Online’ is an on-line database that enables the viewing of council planning applications and approvals. Its structure and the information that it provides vary from council to council. Our case study area contains many properties that underwent renovations between sales, typically including the addition of bedrooms and bathrooms. Frequently, the commercially provided sales data made use of the bed/bath/car space numbers of the most recent sale and backfilled its previous sales with these numbers. This results in errors and a loss of information. For those properties that had lodged planning applications after 2004 (when on-line records began), it was possible to check via this site the numbers of bed/bath/car spaces pre- and post-renovations.
The Home Price Guide provided an additional source to check for bed/bath/car spaces numbers if they were not provided in the purchased dataset (www.homepriceguide.com.au).
The realesatate.com website provided an additional source to check the more recent property sales information (those that occurred in the past 2 years).
Google Earth’s Historical Imagery feature provides a series of aerial images from around 2001 onwards. This feature assisted greatly in establishing an improved approximation of a built year (house age) for newer properties, frequently enabling the viewing of when a block changed from vacant to a dwelling within the time frame of a year.
Google Street View proved to be a key source of additional information for the number of levels of the structure, the building and roof material, as well as identifying an era of when the house was built to establish a proxy of house age/build year when this information was not available through other sources. This site also provided an additional source to check available car parking.
Acknowledgements
Some of the information used by this research has been based on or contains data provided by the Brisbane City Council and Queensland Government (![]() ). However, our findings do not represent the views of either the Queensland Government or the Brisbane City Council. Many thanks to Martijn van Grieken, Sorada Tapsuwan, Mohammad Alauddin and two anonymous referees.
). However, our findings do not represent the views of either the Queensland Government or the Brisbane City Council. Many thanks to Martijn van Grieken, Sorada Tapsuwan, Mohammad Alauddin and two anonymous referees.
Notes
Funding Statement
This research was funded by the Australian government represented by the Department of Climate Change and Energy Efficiency, CSIRO’s Climate Adaptation Flagship and the Australian Research Council (DP120102124).