
Abstract
This study analyses the structure of transit demand in Atlanta’s transit system to understand why different elements of the network appeal to bus and rail riders. By estimating direct demand models of work trip use between pairs of traffic analysis zones, the authors find that self-identified bus riders come from poorer areas having fewer autos per household and seek to reach jobs scattered throughout the metropolitan area. Their demand is highly elastic with respect to travel time. They care not about the presence of transit-oriented development (TOD) attributes at either origins or destinations. Self-identified rail riders primarily access transit by automobile and value fast service to within convenient walking distance of employment, such as in the central business district (CBD) and some but not all TODs. The results suggest that an agency could increase ridership by both groups using a core network of higher speed lines that provide access to decentralised employment centres.
Introduction
This paper examines how multidestination bus/rail transit systems can better serve choice riders who have access to automobiles, while continuing to expand the travel opportunities of transit dependent riders who lack easy automobile access and depend on transit for their transport needs. A growing body of evidence shows that multidestination (decentralised) systems have higher per capita ridership and are more efficient in resources used to carry each passenger than central business district (CBD)-focused systems. However, evidence also suggests that multidestination systems appeal largely to transit dependent riders, whose demand appears to be highly elastic with respect to the shortening of transit travel time between origin and destination. Given the interest in using transit to lure people from their automobiles to reduce greenhouse gas emissions and congestion, it is imperative that the appeal of such systems to choice riders also be understood. However, this issue remains as yet relatively unexplored.
This study examines the nature of transit demand in different segments of the multidestination, multimodal rail and bus network serving Atlanta, Georgia, to understand which elements of the network appeal to transit dependent riders and which elements appeal to choice riders and why any possible differential in appeal exists. Atlanta provides an opportunity to explore the consequences of a multidestination network for bus patrons (hypothesised as being largely transit dependent riders) and rail patrons (hypothesised as being predominantly choice riders). The authors estimate several statistical models that explain the pattern of transit work trips across the Atlanta metropolitan area following the method used in a similar study of Broward County, Florida (Thompson et al., 2012). The authors segment the statistical analysis based on a distinction between passengers who identify themselves as bus riders and those who identify themselves as rail riders and further by their travel destination. The models explore the relationship between the number of trips from one traffic analysis zone (TAZ) to another as a function of a combination of land use, transit service quality, and socioeconomic characteristics of the TAZs.
The results show that bus trips are produced in larger numbers from zones exhibiting more transit dependent characteristics and rail trips from zones typified by more choice rider characteristics. However, the two groups value similar attributes of service quality (including shorter access and egress times and more direct trips) and their use of transit is associated with many of the same variables (including population and employment). At the same time, the factors that are associated with transit demand vary depending on the type of destination the rider wishes to reach, including whether it is the CBD or a more auto-oriented location. These results offer new insights into the nature of transit demand in a multidestination system and provide lessons for agencies seeking to increase ridership among different ridership groups.
Literature Review
This research is informed by scholarship that examines the relationship between transit ridership and network design to explore their possible associations. The roots of this literature lie in studies that relate ridership trends to changing urban structure. Meyer et al.’s (1965) study highlighting the relationship between urban decentralisation, the decline of the CBD and declining transit patronage across the US was an early landmark in this literature. Subsequent work by Hendrickson (1986), Jones (1985), Mierzejewski and Ball (1990), Meyer and Gomez-Ibanez (1981), Pisarski (1996) and Taylor (1991) has echoed these earlier findings, emphasising the importance of a strong CBD and more centralised development patterns for transit ridership success due to the clustering of origins and destinations. Paired with the findings of Pushkarev and Zupan’s (1977) study of the relationship between the strength of the CBD, residential density and transit ridership in New York, these studies suggest that the most effective planning strategy is to focus transit systems on the CBD (or its closest equivalent) and to support land use planning initiatives that intensify residential and employment densities to be more transit supportive. Policies promoting CBD-focused express bus routes and/or rail transit systems and promoting more mixed-use, walkable transit-oriented development (TOD) around rail stations are two important outgrowths of this research.
A problem that agencies face is that the CBD is no longer the dominant centre of economic activity in most US metropolitan areas that it once was, due to recent suburban employment growth (Glaeser and Kahn, 2001). A system focused on the CBD might do a good job serving CBD-bound commuters, but it does so at the expense of providing poor or no service to other important destinations (Brown and Thompson, 2009). The alternative approach is a multidestination network design, which decentralises the network to better fit the decentralised destination pattern. The strength of the multidestination approach is that it fits the dispersed pattern of activities. Its weakness is that it relies on passenger transfers to facilitate connections.
The transfer is the key to making the multidestination system work, because it makes the linkages across the array of destinations possible for the rider and financially feasible for the agency. The transfer is also a potential obstacle if it is not well co-ordinated, given the extensive literature testifying to the negative view passengers have of transfers. Transit riders tend to weigh their times spent waiting for a bus and/or transferring as being much more onerous than the time spent travelling (Balcombe et al., 2004; Victoria Transportation Policy Institute, 2013; Wardman, 2004). Because of this, many agencies have tried to avoid instituting transfers to the extent possible. Other agencies (such as those in Dallas, Denver and San Diego), however, have recognised the opportunity for cross-regional connections that transfers provide and have planned their networks accordingly (Brown and Thompson, 2009).
Recent literature has examined the potential for multidestination systems to increase ridership, although there is still a relative paucity of scholarship that directly compares radial with multidestination systems or subjects multidestination systems to rigorous statistical analysis. Mees’s work employed case studies to document the effectiveness of multidestination networks in North America, Europe and Australasia (Mees, 2010). He found that multidestination networks enjoy strong patronage even in very low-density environments; however, he did not subject his case study investigations to comparative or statistical analyses. A recent report on Transit oriented development (TOD) and employment makes a descriptive and statistical argument that rail transit systems attract greater ridership when they directly serve dispersed employment centres in addition to CBDs (Center for Transit-Oriented Development, 2011).
Brown and Thompson (2008a, 2008b) have conducted a series of quantitative analyses of multidestination systems in the US, including comparisons of metropolitan areas with radial versus multidestination networks. Their work is generally associative as opposed to causal in nature. One report examined transit performance in all US metropolitan statistical areas (MSAs) with 1 million to 5 million persons in 2000 organised into four groups based on the structure of the network (radial or multidestination) and its modal composition (bus-and-rail or bus-only) (Brown and Thompson, 2008a). The median multidestination MSA outperformed its radial counterpart in terms of per capita ridership growth, while it also enjoyed better service productivity and cost effectiveness than its radial counterpart. A statistical examination of multidestination system productivity in the same MSAs confirmed the association of decentralised transit networks with higher service productivity (Brown and Thompson, 2008b). The same authors found a positive association between employment decentralisation within the agency service area and ridership in a time-series analysis of Atlanta, indicating that the decentralised network structure successfully connected the decentralised pattern of employment destinations (Brown and Thompson 2008c). By contrast, there was no statistical relationship between the amount of employment in the Atlanta CBD and transit patronage.
While these studies suggest that higher ridership and productivity are associated with multidestination systems, they do not address how different ridership markets are affected by different network structures. The focus on the CBD, a hallmark of radial structures, reflects a desire to tap the commuter market, in particular choice riders. This focus also relates to long-running interest in using transit to reduce traffic congestion and vehicle kilometres travelled (VKT) as part of an overall greenhouse gas reduction strategy. To explore further the extent to which multidestination transit systems attract transit dependent and choice riders, the authors of this paper compared supply and demand of two bus-only systems, one offering multidestination service and the other CBD-oriented service (Thompson et al., 2012). The authors found that the multidestination system, located in Broward County, Florida, carries almost 400 per cent more ridership per capita than does the radial system, located in Tarrant County, Texas, while also carrying about 35 per cent more passengers per bus mile. These very different results were found despite the similar populations, employment levels and automobile-oriented, decentralised development patterns. A statistical analysis of the multidestination system found, however, that most of its riders are transit dependent (Thompson et al., 2012). Nevertheless, even these riders were very sensitive to the quality of transit service, measured using transit travel times.
The research presented here is an effort to broaden the earlier analysis from a bus-only multidestination system to one that includes both bus and rail. Further, the authors refine the statistical analysis conducted earlier in Broward County (Thompson et al., 2012) to focus on different ridership sub-markets through the estimation of multiple demand models. This approach offers greater insight into the nature of transit demand in a multidestination network, permitting the development of policies that increase choice ridership beyond the traditional suburb-to-CBD market, while preserving what appears to be a major benefit in multidestination systems for transit dependent riders, the access they provide to a more dispersed array of destinations.
Case Study
This study examines transit ridership demand in a major US metropolitan area in 2000, the most recent year for which all variables were available at the time of the study. The authors selected Atlanta because it has a combined bus-and-rail transit system. It also has a small number of TODs at rail transit stations.
For purposes of the study, the Atlanta metropolitan area encompasses the five counties at the heart of the region: Clayton, Cobb, DeKalb, Fulton and Gwinnett. In 2000, these five counties had a combined 2.9 million residents (US Census Bureau, 2006) and 1.8 million jobs. 1 During the same time, transit service was provided by the Metropolitan Atlanta Rapid Transit Authority (MARTA), which operated bus and rail networks and accounted for about 97 per cent of all regional transit trips, and Cobb Community Transit, a suburban operator that also provided buses to rail stations and the Atlanta CBD (Florida Department of Transportation, 2011). The regional transit system is shown in Figure 1.
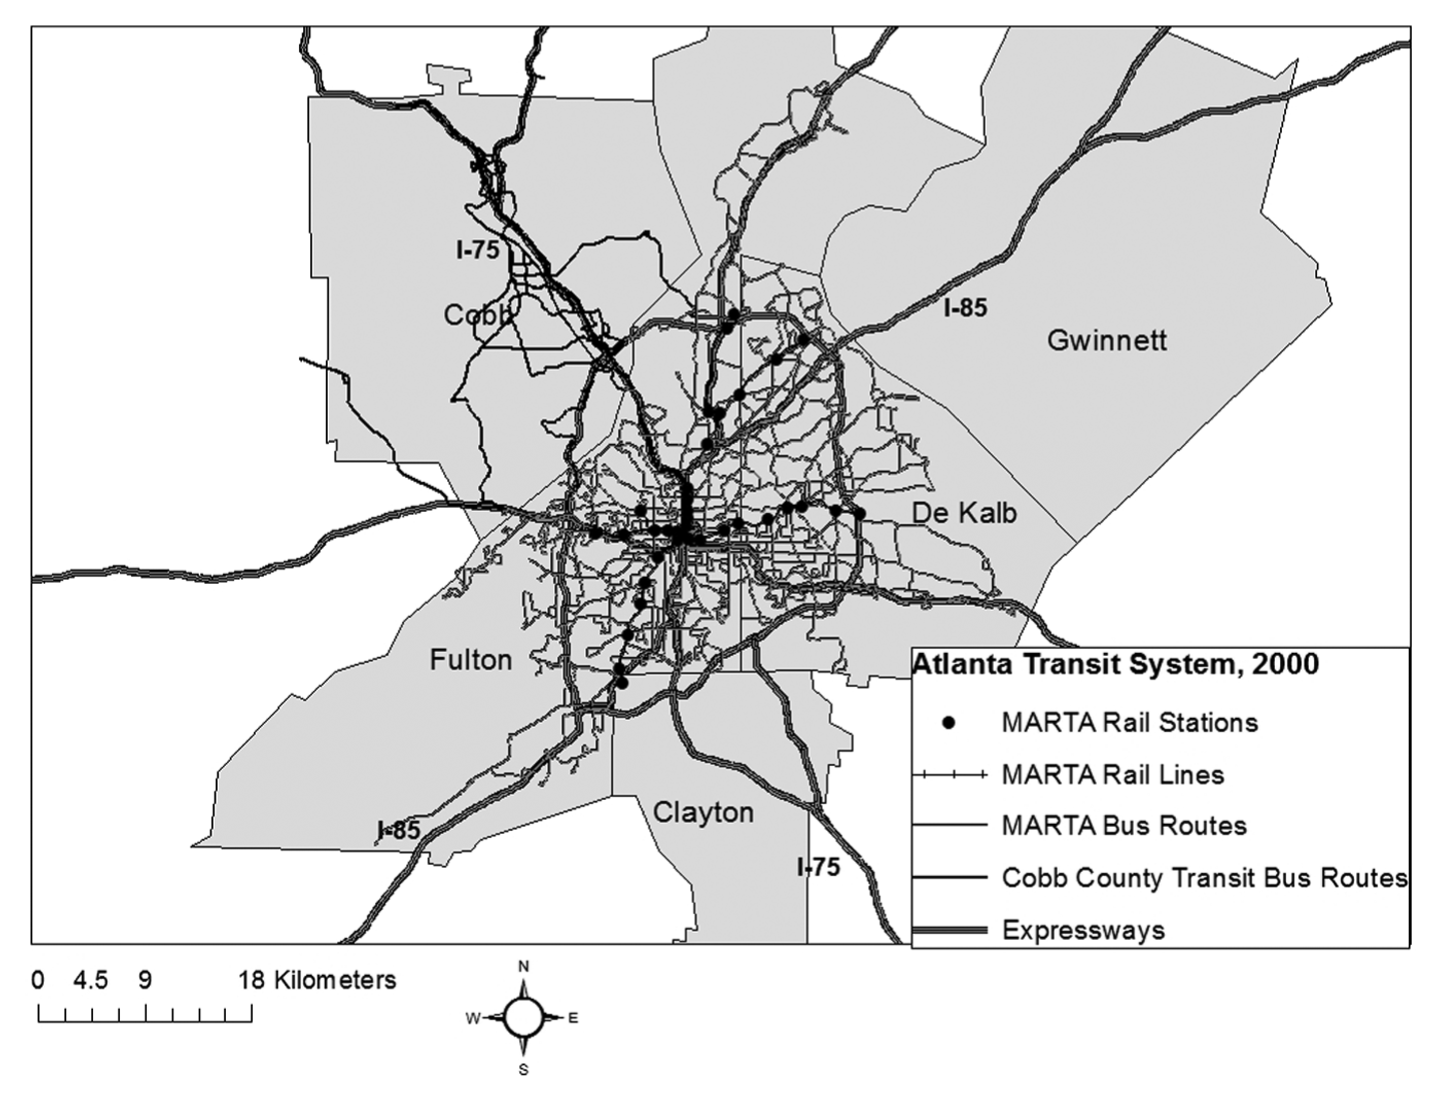
Atlanta regional transit system, 2000.
The Atlanta Regional Commission (ARC), the region’s metropolitan planning organisation (MPO), defines a number of areas that are of special interest because of their potential role as destinations for transit trips (Atlanta Regional Commission 2011). These areas are: the Atlanta central business district (CBD), Atlanta city centre, regional centres and several TODs. The CBD is Atlanta’s original commercial district and is largely an office district. The city centre encompasses portions of the historical CBD, as well as the adjacent Midtown area. The Midtown area contains offices as well as cultural institutions and residential development and is located near the Georgia Tech campus, a major MARTA trip attractor. Combined, these areas contain 10 rail stations and sit at the heart of the rail network. Another set of important potential destinations are the regional centres, which are largely suburban employment centres. ARC defines regional centres as areas that contain 10,000 or more jobs within approximately 10 square kilometres. Most regional centres are oriented towards expressways or arterial roads and represent automobile-oriented development. A final set of potentially important destinations are the area’s TODs. In 2000, there were four existing TODs, as recognised by ARC, the Transit Co-operative Research programme, and the Urban Land Institute’s (ULI) Atlanta Chapter (Transit Co-operative Research Program 2004). Two of these TODs lie within the city centre, but outside the CBD: Midtown and North Avenue; the two other TODs lie outside the city centre: Decatur and Lindbergh Center. These more central locations are shown in Figure 2. The authors explore ridership demand to each of these destinations in the statistical analysis.
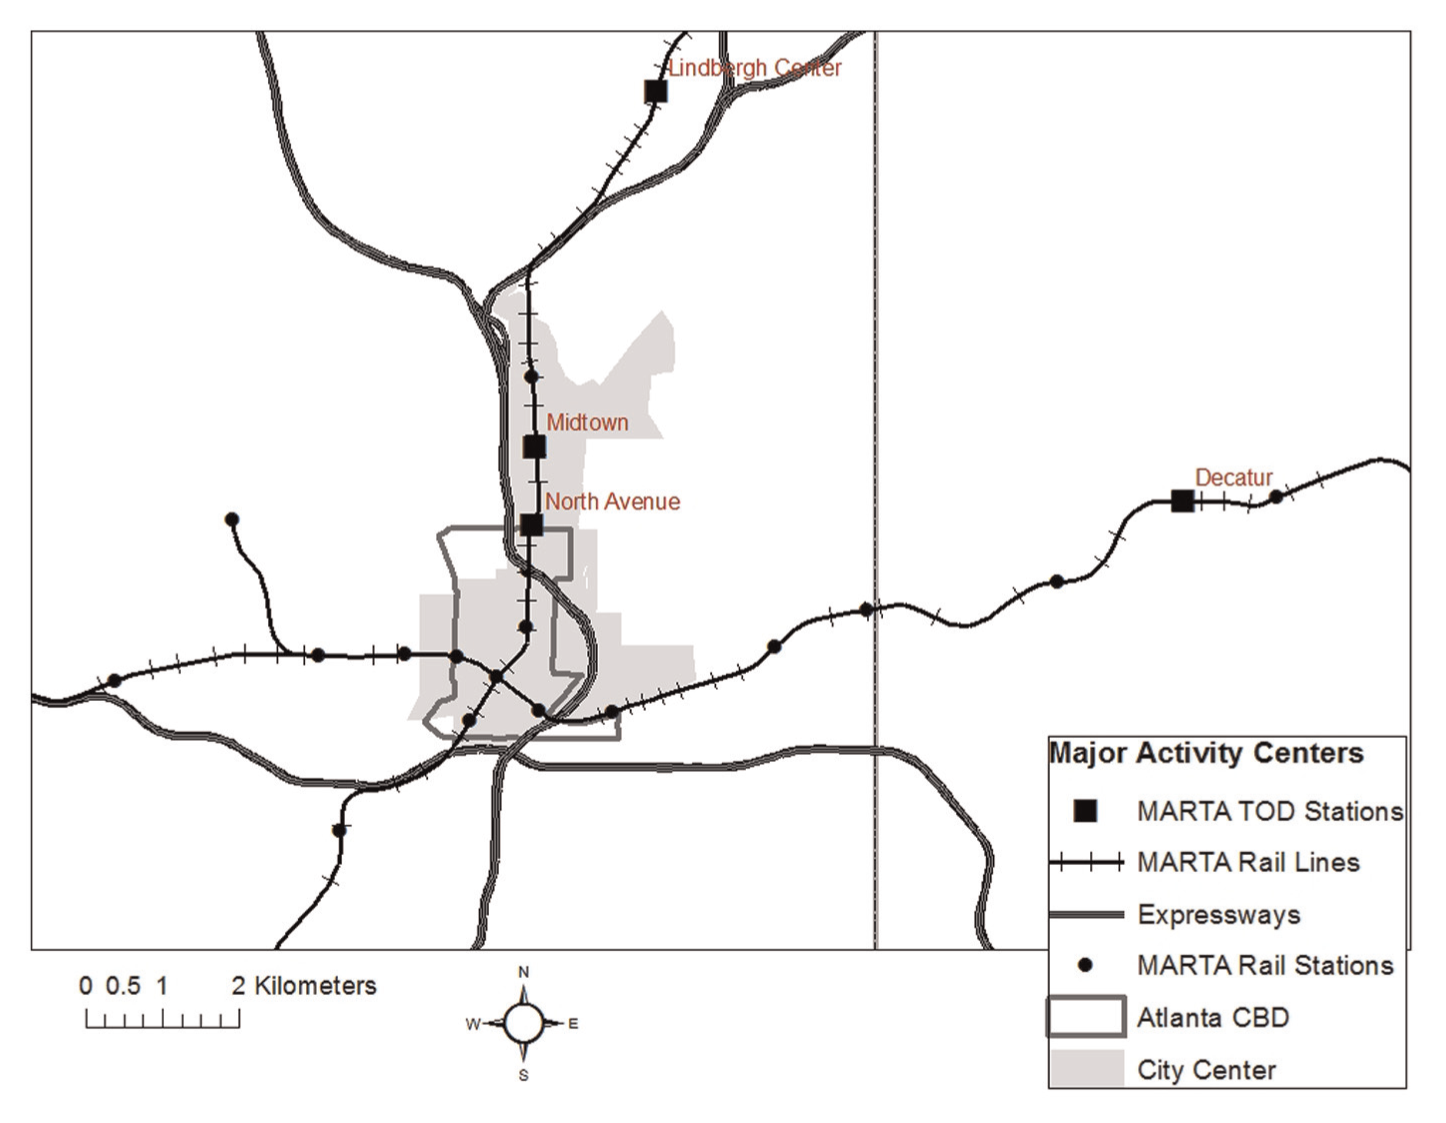
Major destinations at the centre of the Atlanta metropolitan area.
Methodology
The authors estimate two sets of models that predict bus and rail work trips (the dependent variable) from one part of the metropolitan area (traffic analysis zone or TAZ) to another. The study uses these predictive models to identify associations between the dependent and explanatory variables; it does not test for causal relationships. For one set of models, the dependent variable consists of riders who identified themselves as ‘bus or trolley bus’ riders in the 2000 Census Transportation Planning Package (CTPP) and, for the other set of models, it consists of riders who identified themselves as ‘subway or elevated’ riders. The authors treat the former group as self-identified bus riders and the latter group as self-identified rail riders, although many riders undoubtedly use multiple modes for their trips. The explanatory variables used in the models include socioeconomic variables from the 2000 CTPP (US Census Bureau, 2000), land use variables defined by the local MPO, 2 and transit service quality variables (broken into three components: in-vehicle, out-of-vehicle and transfer time) obtained from the zone-to-zone travel time matrices derived from the 2002 regional travel demand model (Atlanta Regional Commission, 2002a).
Model Specification
The dependent variable, the flow of transit trips between a pair of TAZs, is a count variable whose minimum value is 0. The zone-to-zone bus ridership (12,371 riders across 40,269 TAZ pairs) ranges from 0 to 90 trips, with a mean of 0.30 and a standard deviation of 2.53; rail ridership (6121 riders across 70,409 TAZ pairs) ranges from 0 to 70 trips with a mean of 0.08 and a standard deviation of 1.21. The large standard deviations indicate that many zonal interchanges have 0 trips. This type of dependent variable, which is a non-negative count variable, is best analysed using negative binomial regression (Long and Freese 2006). The equation is
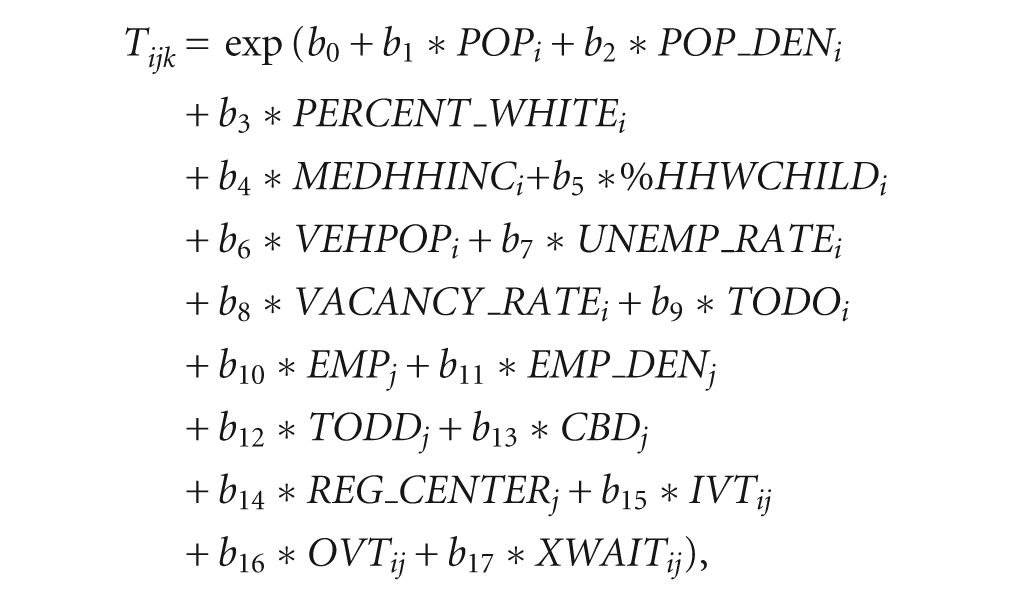
where:
Tijk represents the number of transit work trips originating in zone i and terminating in zone j using primarily mode k (either rail or bus as self-described by respondent);
The equation estimates that transit work trips self-identified as using mode k and originating in zone i and destined to zone j are associated with three separate categories of variables, characterising the trip origin, the trip destination and the trip itself. Variables characterising the originating zone i include its population, population density, unemployment rate, vacancy rate, percentage of White population, median household income, percentage of households without children, personal vehicles available per capita and whether it has TOD characteristics. Population and population density are traditionally associated with trip production in transport studies; low household income and low vehicle access in a zone tend to be strongly correlated to transit usage; TODs tend to be mixed use, walkable communities that feature higher levels of transit use; the unemployment rate and vacancy rate variables are measures of the economic health of the zone and its residents; and the share of households without children has also been found to be related to transit use in prior research (Thompson et al., 2012; Transit Co-operative Research Program 2004; US Department of Housing and Urban Development 2011). Variables characterising the destination zone j include its employment, employment density, the presence of TOD characteristics, whether it is in the CBD and whether it is in a regional centre. Employment and employment density are strongly associated with trip attraction in transport studies; TODs tend to be mixed use, walkable communities that feature higher levels of transit use; and the CBD and regional centres are major potential destinations for transit trips due to their concentration of jobs 3 (Thompson et al., 2012). Variables describing the trip between origin and destination zones include out-of-vehicle time (excluding transfer time), in-vehicle time and transfer time; these variables are included to represent the time cost of travel between zones by transit (Thompson et al., 2012; Balcombe et al., 2004). The authors eliminated any TAZs for which no transit connections existed in the year 2000. A spatial autocorrelation test of model results revealed no spatial biases on the destination end of trips for either the regional bus or regional rail model and small Moran’s I statistics for the origin end of trips for both models. Pairwise correlation for testing multicollinearity between the independent variables used in the models found no significant correlation between the variables.
The authors estimated 10 different models, with five sets of destinations defined for bus trips and rail trips. The five different destinations are listed as follows
Trips to all transit-accessible destinations;
Trips to Atlanta CBD;
Trips to city centre outside Atlanta CBD;
Trips to all destinations except CBD and city centre outside CBD; and
Trips to regional centres.
The authors hypothesised that the bus models would largely reflect the presence of a transit dependent ridership due to the overrepresentation of transit dependent riders who lack regular vehicle access among many bus transit systems’ riders and that the rail models would reflect the presence of a large choice rider group. The regional on-board survey supports these initial hypotheses. The survey reports that 59 per cent of rail riders have access to a vehicle, while only 22 per cent of bus riders do. Only 27 per cent of rail riders live in zero-vehicle households, while 52 per cent of bus riders do (ARC, 2002b). The authors also hypothesised that they might find more evidence of choice riders in four models: bus and rail passengers to Atlanta CBD and bus and rail passengers to city centre outside Atlanta CBD. The authors expected self-identified rail riders to resemble transit dependent riders in the rail to regional centres model, because these passengers must use a bus transfer to reach most of the regional centres. The model results largely support these hypotheses about bus and rail ridership, indicating that bus trips are produced in larger numbers by zones with larger numbers of households with transit dependent characteristics and rail trips are produced in larger numbers by zones with larger numbers of households with choice rider characteristics.
Transit Travel Time Variables
As noted earlier, transit travel time is the key indicator of service quality used in the models and reflects the generalised cost of travel by transit from one TAZ to another. The authors included three different travel time components in the models: in-vehicle (time spent inside the moving vehicle), out-of-vehicle (access time to and egress time from the transit stop and wait time for the initial transit vehicle) and transfer time (wait time between transit connections or transfers). The authors break transit travel time into these components, based on the peak transit travel time skims obtained from ARC’s (2002a) regional transport model. Skim files provide travel time and distance data for every origin–destination zone pair for highways and transit for peak and off-peak hours of travel. The authors use the peak travel time skims since the dependent variable is the work trip and the peak travel time better reflects work travel. The hypothesis is that out-of-vehicle and transfer time will be weighted twice as heavily as in-vehicle travel time (Balcombe et al., 2004).
The dependent variable in the bus models include passengers who self-identified as bus riders, although many of them may use multiple modes to complete their trips. Most bus passengers begin their trips in poorer zones south and west of the CBD but end their trips near rail stations in the northern zones. These trips appear to be multimodal. In order to calculate zone-to-zone travel times for these trips, the authors first calculated travel time entirely by bus and then by a combination of bus and rail, where a rail link was present, for all origin–destination pairs. The authors then compared the two travel times and used the bus-only travel time if it was shorter. However, if the bus and rail travel time was shorter, the authors used this travel time as long as the time saving was at least 10 per cent. This value served as a transfer penalty that reflected the inconvenience of making a transfer. In Atlanta, the average trip length was approximately 35 minutes, so 10 per cent of the travel time gives us a 3.5-minute transfer penalty, which is within the ranges for transfer penalties cited in the literature (Currie, 2005).
The dependent variable in the rail models include passengers who self-identified as rail riders although many of these passengers might also use multiple modes either on the access portion (bus or auto) or the destination end (bus or walk) of the trip. The skim files handle issues related to the destination end of the trip, which for many of these passengers is at some distance from rail stations and requires a bus transfer. The authors used the results of the 2001–2002 regional on-board transit survey (ARC, 2002b) to apportion the trips across potential access modes at the access end of the trip and weighted the zone-to-zone travel times accordingly.
Bus Model Results
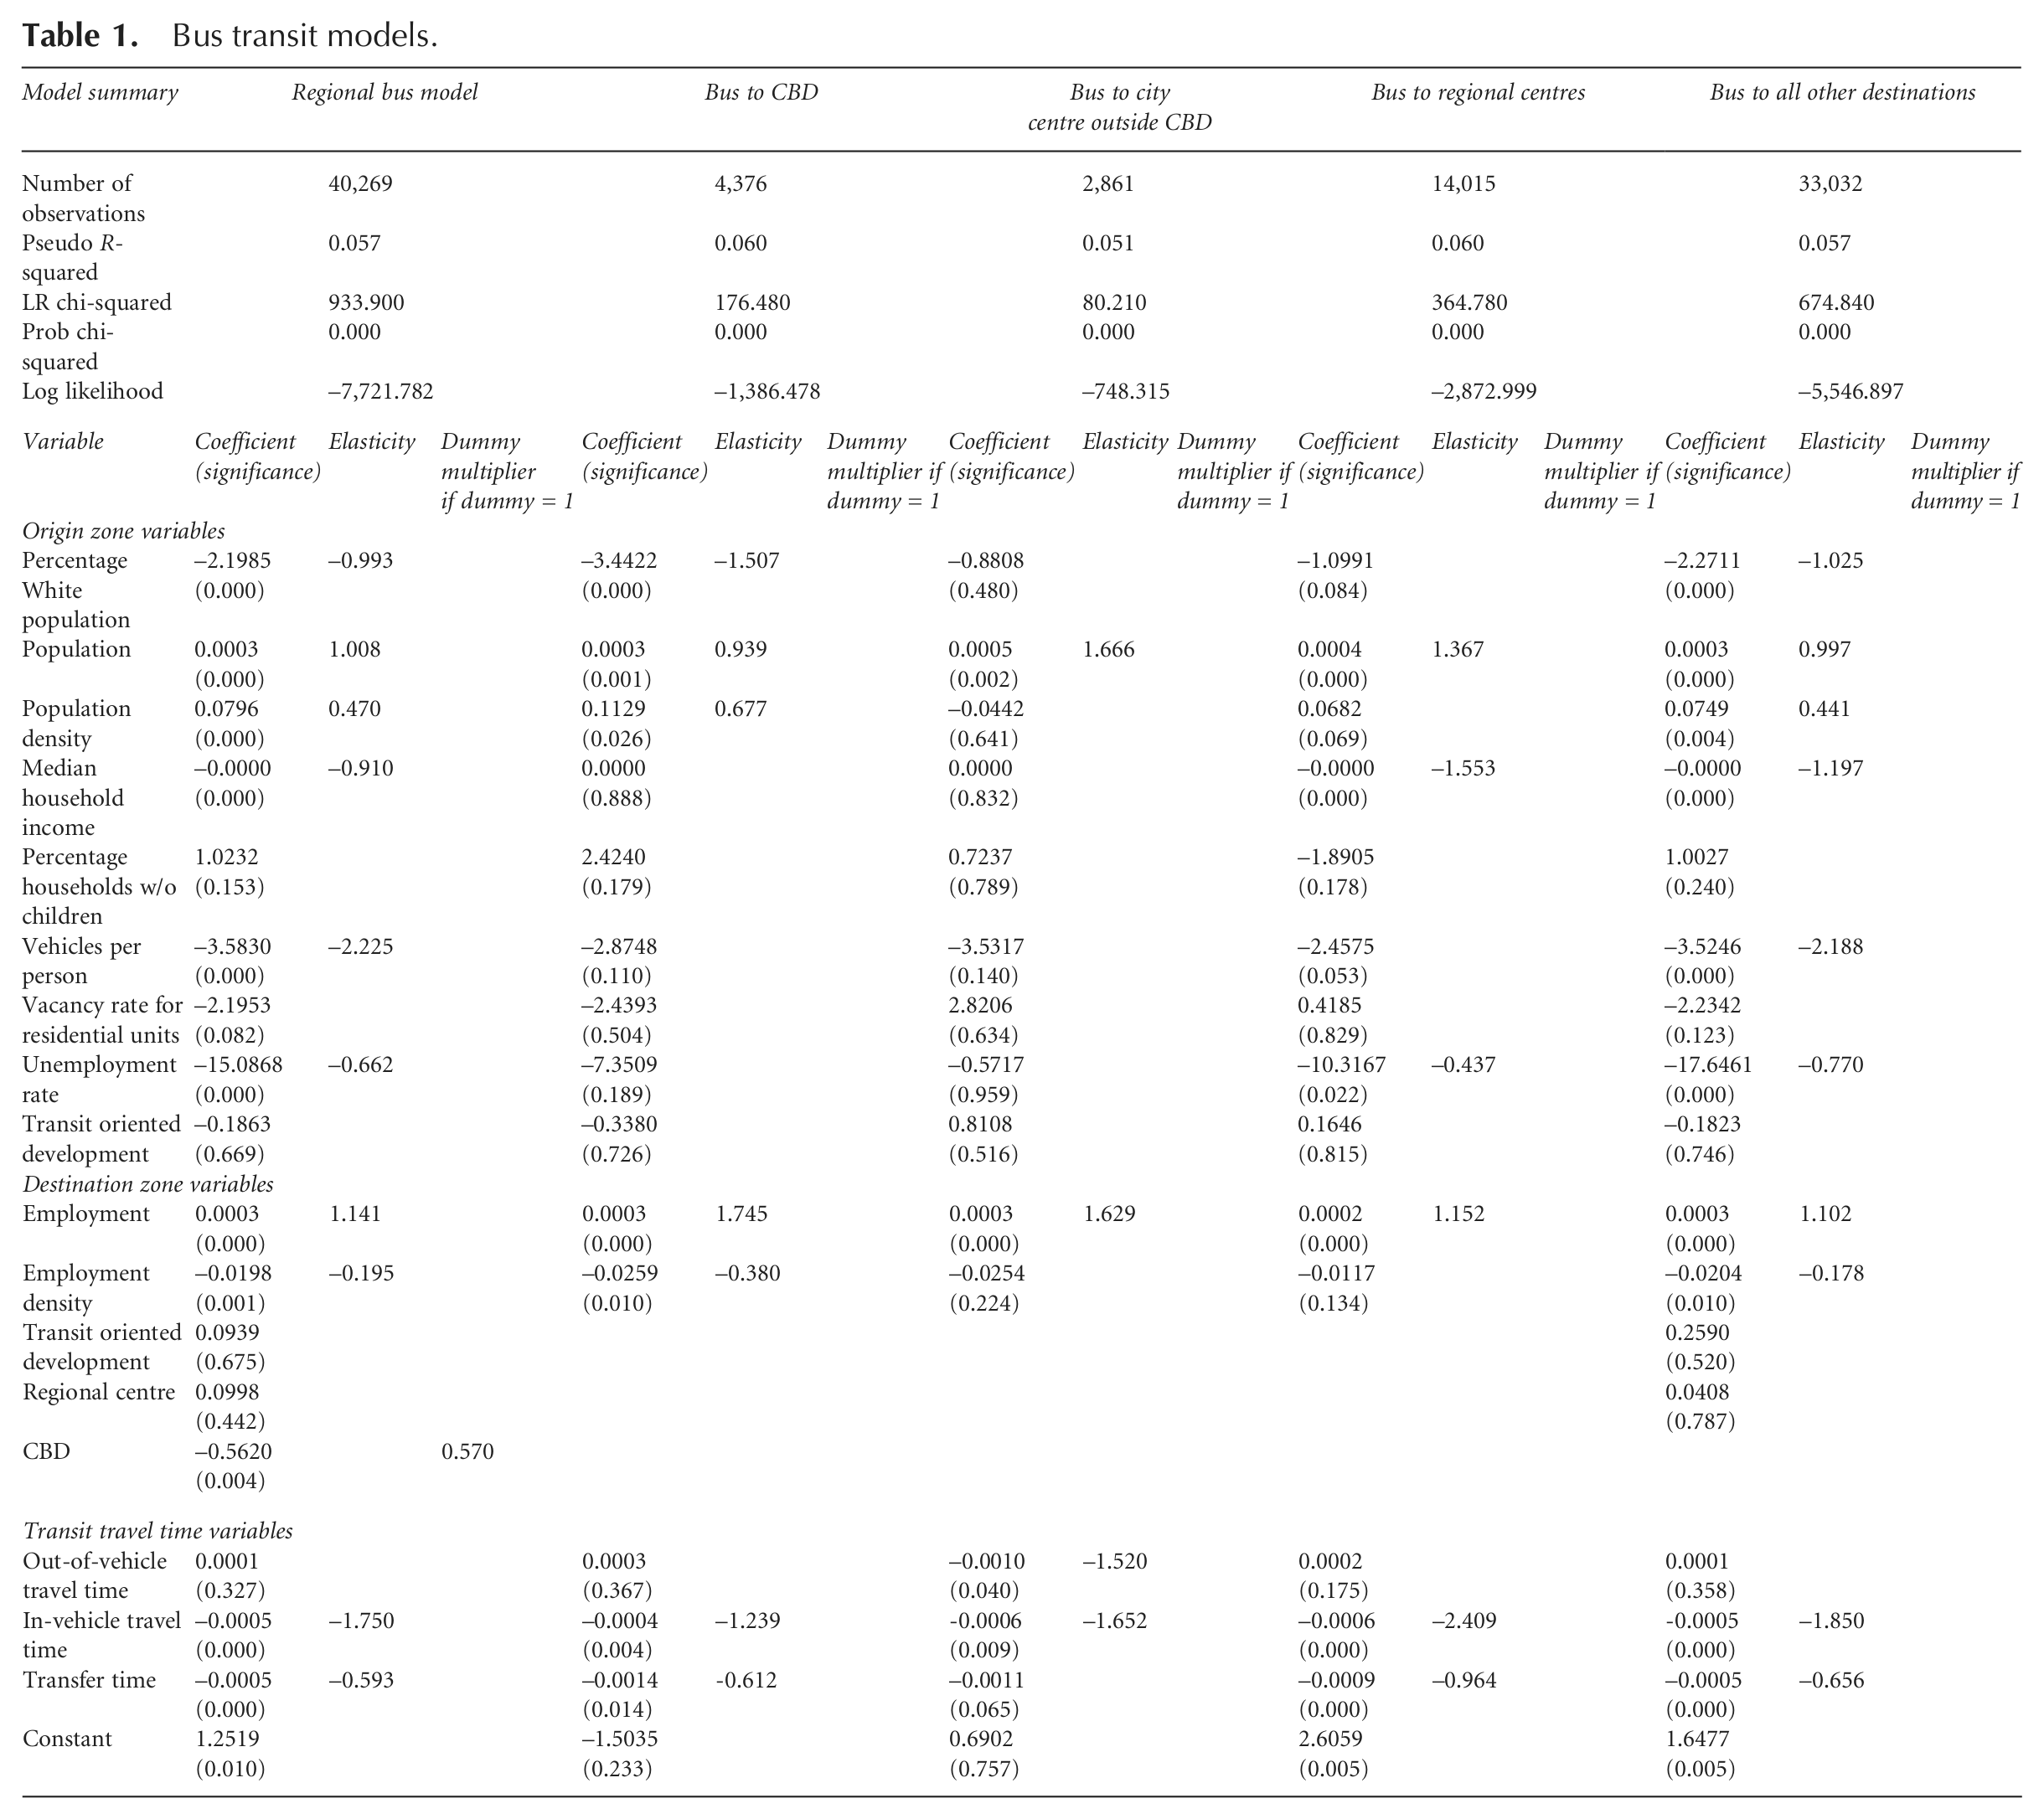
The bus model results are shown in Table 1. The pseudo R-squared values indicate that the models explain only a small proportion of the variation in the dataset, but these values are comparable with those found in prior research (Thompson et al., 2012). The results also include coefficients and significance levels for all variables, as well as elasticities or dummy multipliers, as appropriate, for the statistically significant variables. The actual pattern of bus rider origins and destinations is shown in Figure 3. The parameters in the regional bus model (panel 1 of Table 1) are those of a model that strongly depicts bus trips produced in larger numbers from zones with more transit dependent characteristics which, none-the-less, are highly sensitive to the quality of transit service. Increased bus ridership is positively associated with the population and population density of an origin TAZ, but as auto access, median income and the percentage of White population goes up, the propensity of the TAZ to produce bus trips decreases. All of these associations are strong.
Bus transit models.
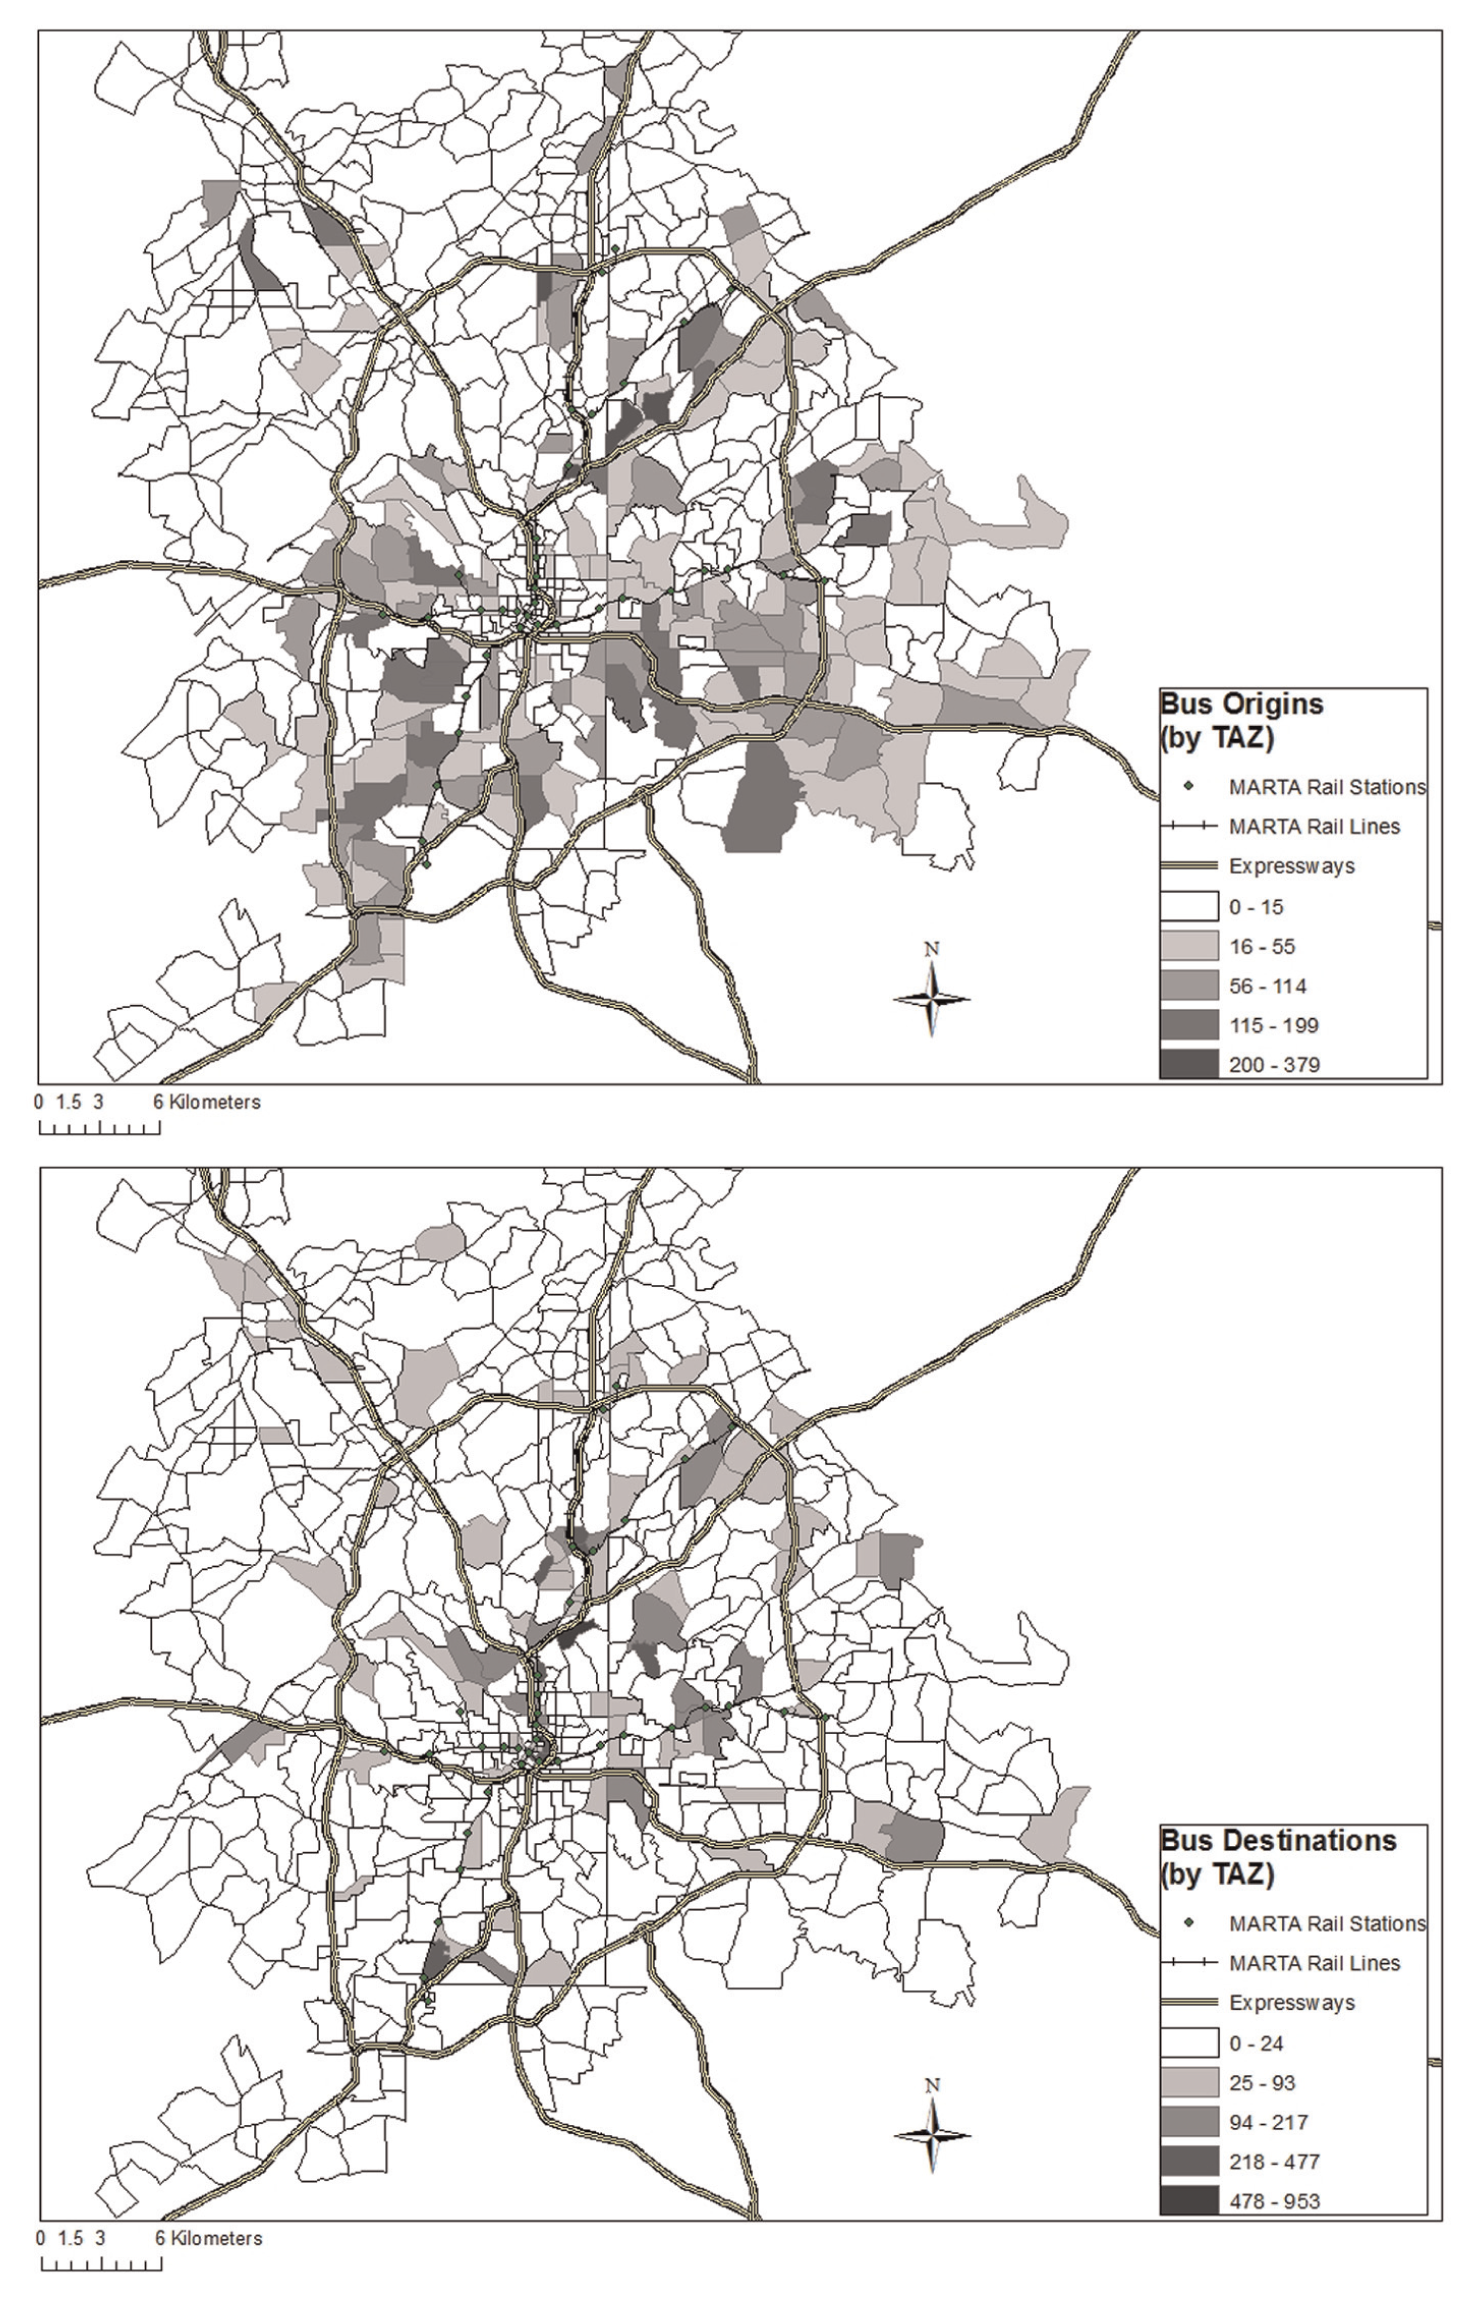
Bus rider journey to work trip origins and destinations, 2000.
Variables that are important in attracting bus work trips at the destination TAZ include employment, employment density and whether or not the destination TAZ is in the CBD. For every 1 per cent that employment in the destination zone increases, bus trips attracted to the zone increase by 1.14 per cent. Yet for every 1 per cent that employment density increases, bus trips attracted to the destination decrease by 0.20 per cent, a small but statistically significant relationship in the opposite direction from expected. Moreover, if the destination zone is in the CBD, the highly statistically significant results indicate that bus trips attracted to the zone would be 57 per cent lower than if the zone were located somewhere else.
Over 75 per cent of all bus trips are going to non-CBD zones, most of which have lower employment densities than the more central zones. The types of jobs that highly transit dependent workers seek may have a lower probability of being located in the CBD than in more peripheral locations (Cervero et al., 2002). These results are very similar to those found in the study of bus transit demand in Broward County (Thompson et al., 2012). It also is noteworthy that the TOD variables contribute nothing that is statistically significant for either generating or attracting bus work trips. This finding is also consistent with the earlier study, but it is a major difference with what was found in the regional rail model (where one TOD variable is highly significant), as discussed later. The difference between the bus and rail models may be explained by the fact that TOD zones may not be typical living locations of transit dependent populations, given TOD’s often higher housing costs; however, they may be attractive to choice riders, a quality more typical of rail riders (US Government Accountability Office, 2009).
Three variables describing the ease of using bus to travel from origin to destination are: in-vehicle travel time (IVT), transfer time and out-of-vehicle travel time (OVT). In-vehicle travel time (IVT) and transfer time are both highly significant. These results suggest that a major policy objective should be to connect residential areas to work areas as directly as possible by bus routes. This consideration implies a grid of routes, because transit cannot directly serve many origin–destination pairs without transfers. That the wait time for transfers is also highly significant suggests the need for well-designed transfers and frequent-service connecting routes. The surprising variable here is out-of-vehicle travel time (OVT), comprising walk time at the beginning and end of a trip as well as wait time for the first transit vehicle, which is statistically insignificant. The transfer time variable indicates that headways matter; so, the unimportance of this variable suggests that bus transit stops are so ubiquitous throughout the study area that walking to and from them is not an issue. This is another major difference with the rail model, where rail stations are few in number, often far removed from important origins and destinations, and where walking distances are a major factor affecting ridership.
The sub-regional models shown in the remainder of the table (panels 2–5) largely echo these findings, although there are two important differences between the pair of models that represent destinations in central Atlanta and the pair of models that represent more dispersed destinations. The models for bus trips to the CBD and the city centre outside the CBD show the vehicles per person variable as being statistically insignificant and the median household income variable also becoming insignificant as it changes from negative to positive. It is likely that these results reflect the TAZs with high income characteristics that produce trips bound to these destinations.
Rail Model Results
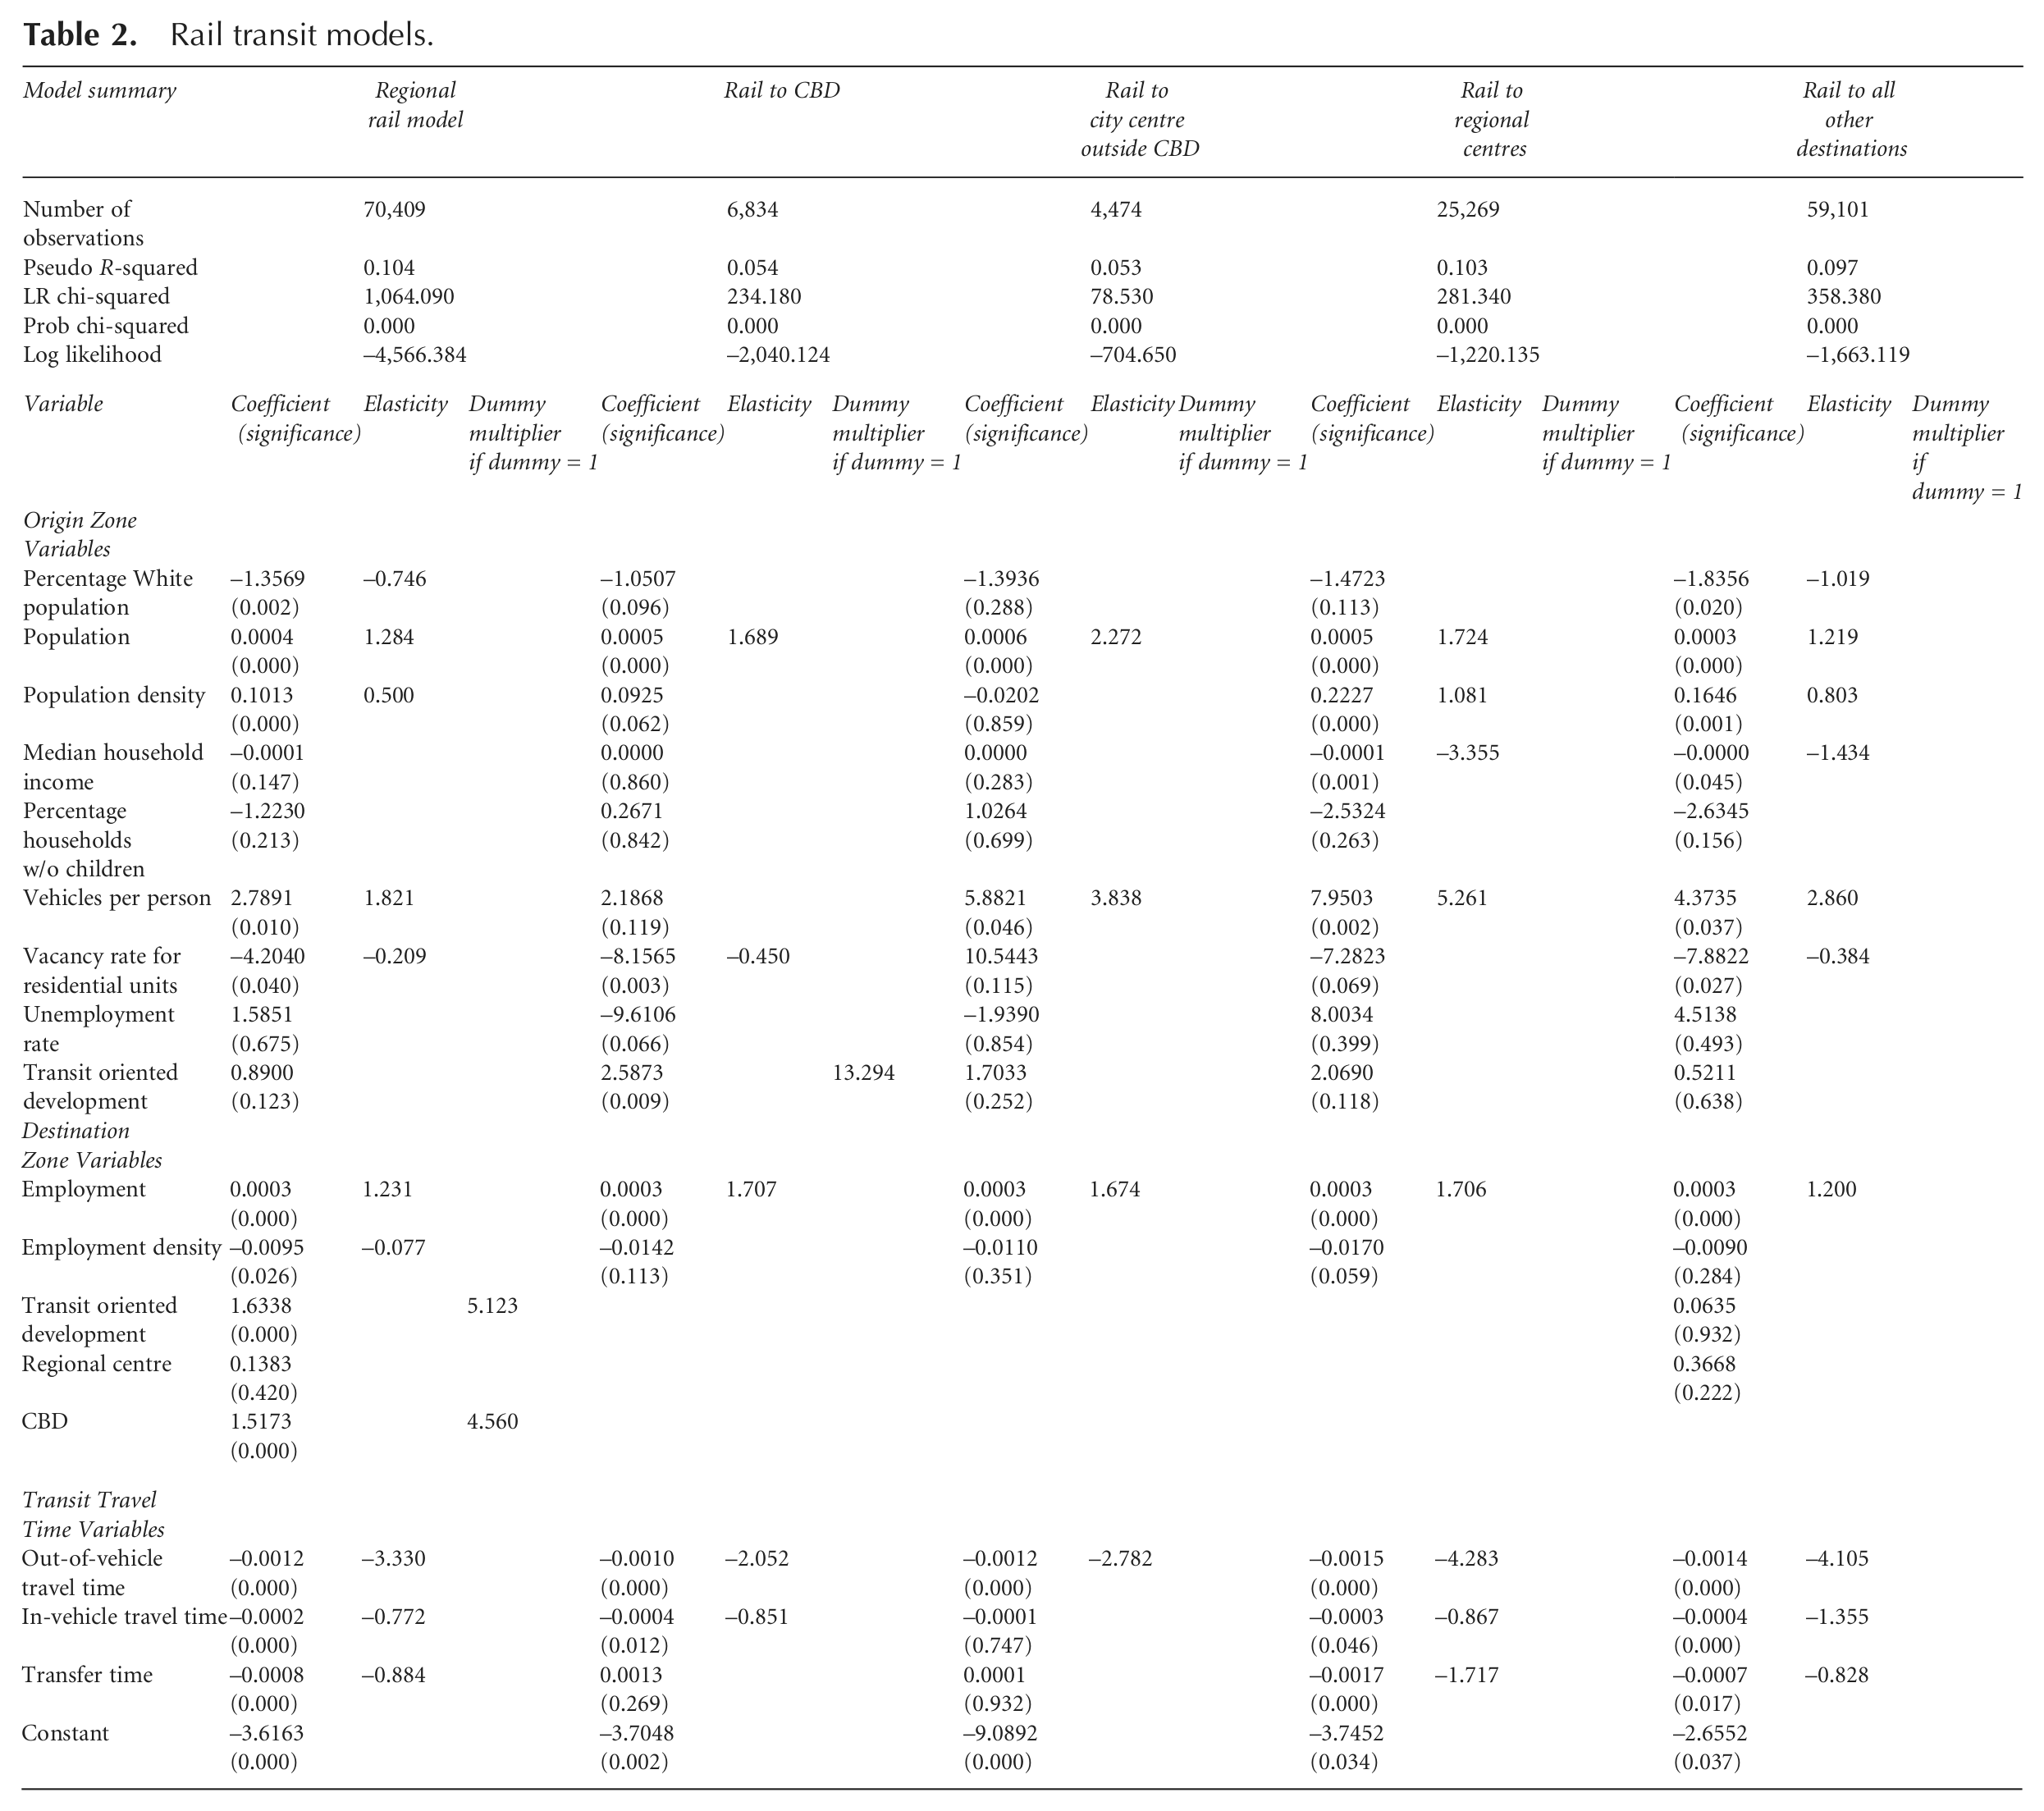
The results for the rail models are shown in Table 2. As with the bus models shown earlier, the pseudo R-squared values indicate that the models explain only a small proportion of the variation in the dataset, but these values are comparable with those found in prior research (Thompson et al., 2012). The results also include coefficients and significance levels for all variables, as well as elasticities or dummy multipliers, as appropriate, for the statistically significant variables. Figure 4 shows the pattern of rail rider origins and destinations. As with the bus models, population in the origin zone and employment in the destination zone are strongly associated with rail ridership between zones. For the regional model (panel 1), higher population density zones are associated with more rail riders while lower employment density zones attract more riders. The latter finding indicates that much of the rail ridership is destined to lower employment density destinations, as was also true in the regional bus model. Higher levels of auto accessibility in the origin zone are associated with higher rail ridership, a clear difference from the bus models. Also unlike the bus models, median household income has no consistent relationship with rail ridership. Rail riders bound to more dispersed destinations tend to come in larger numbers from zones with lower incomes, as do their bus counterparts, but rail riders destined to the CBD and city centre do not. The likelihood of transit passengers to come in larger numbers from zones with larger non-White population is less pronounced for the rail models than for the bus models. The variable is statistically unimportant in three of the five rail models. As a group, the rail models depict a pattern indicating a larger number of trips generated by zones with more choice rider characteristics than was true for the bus models.
Rail transit models.
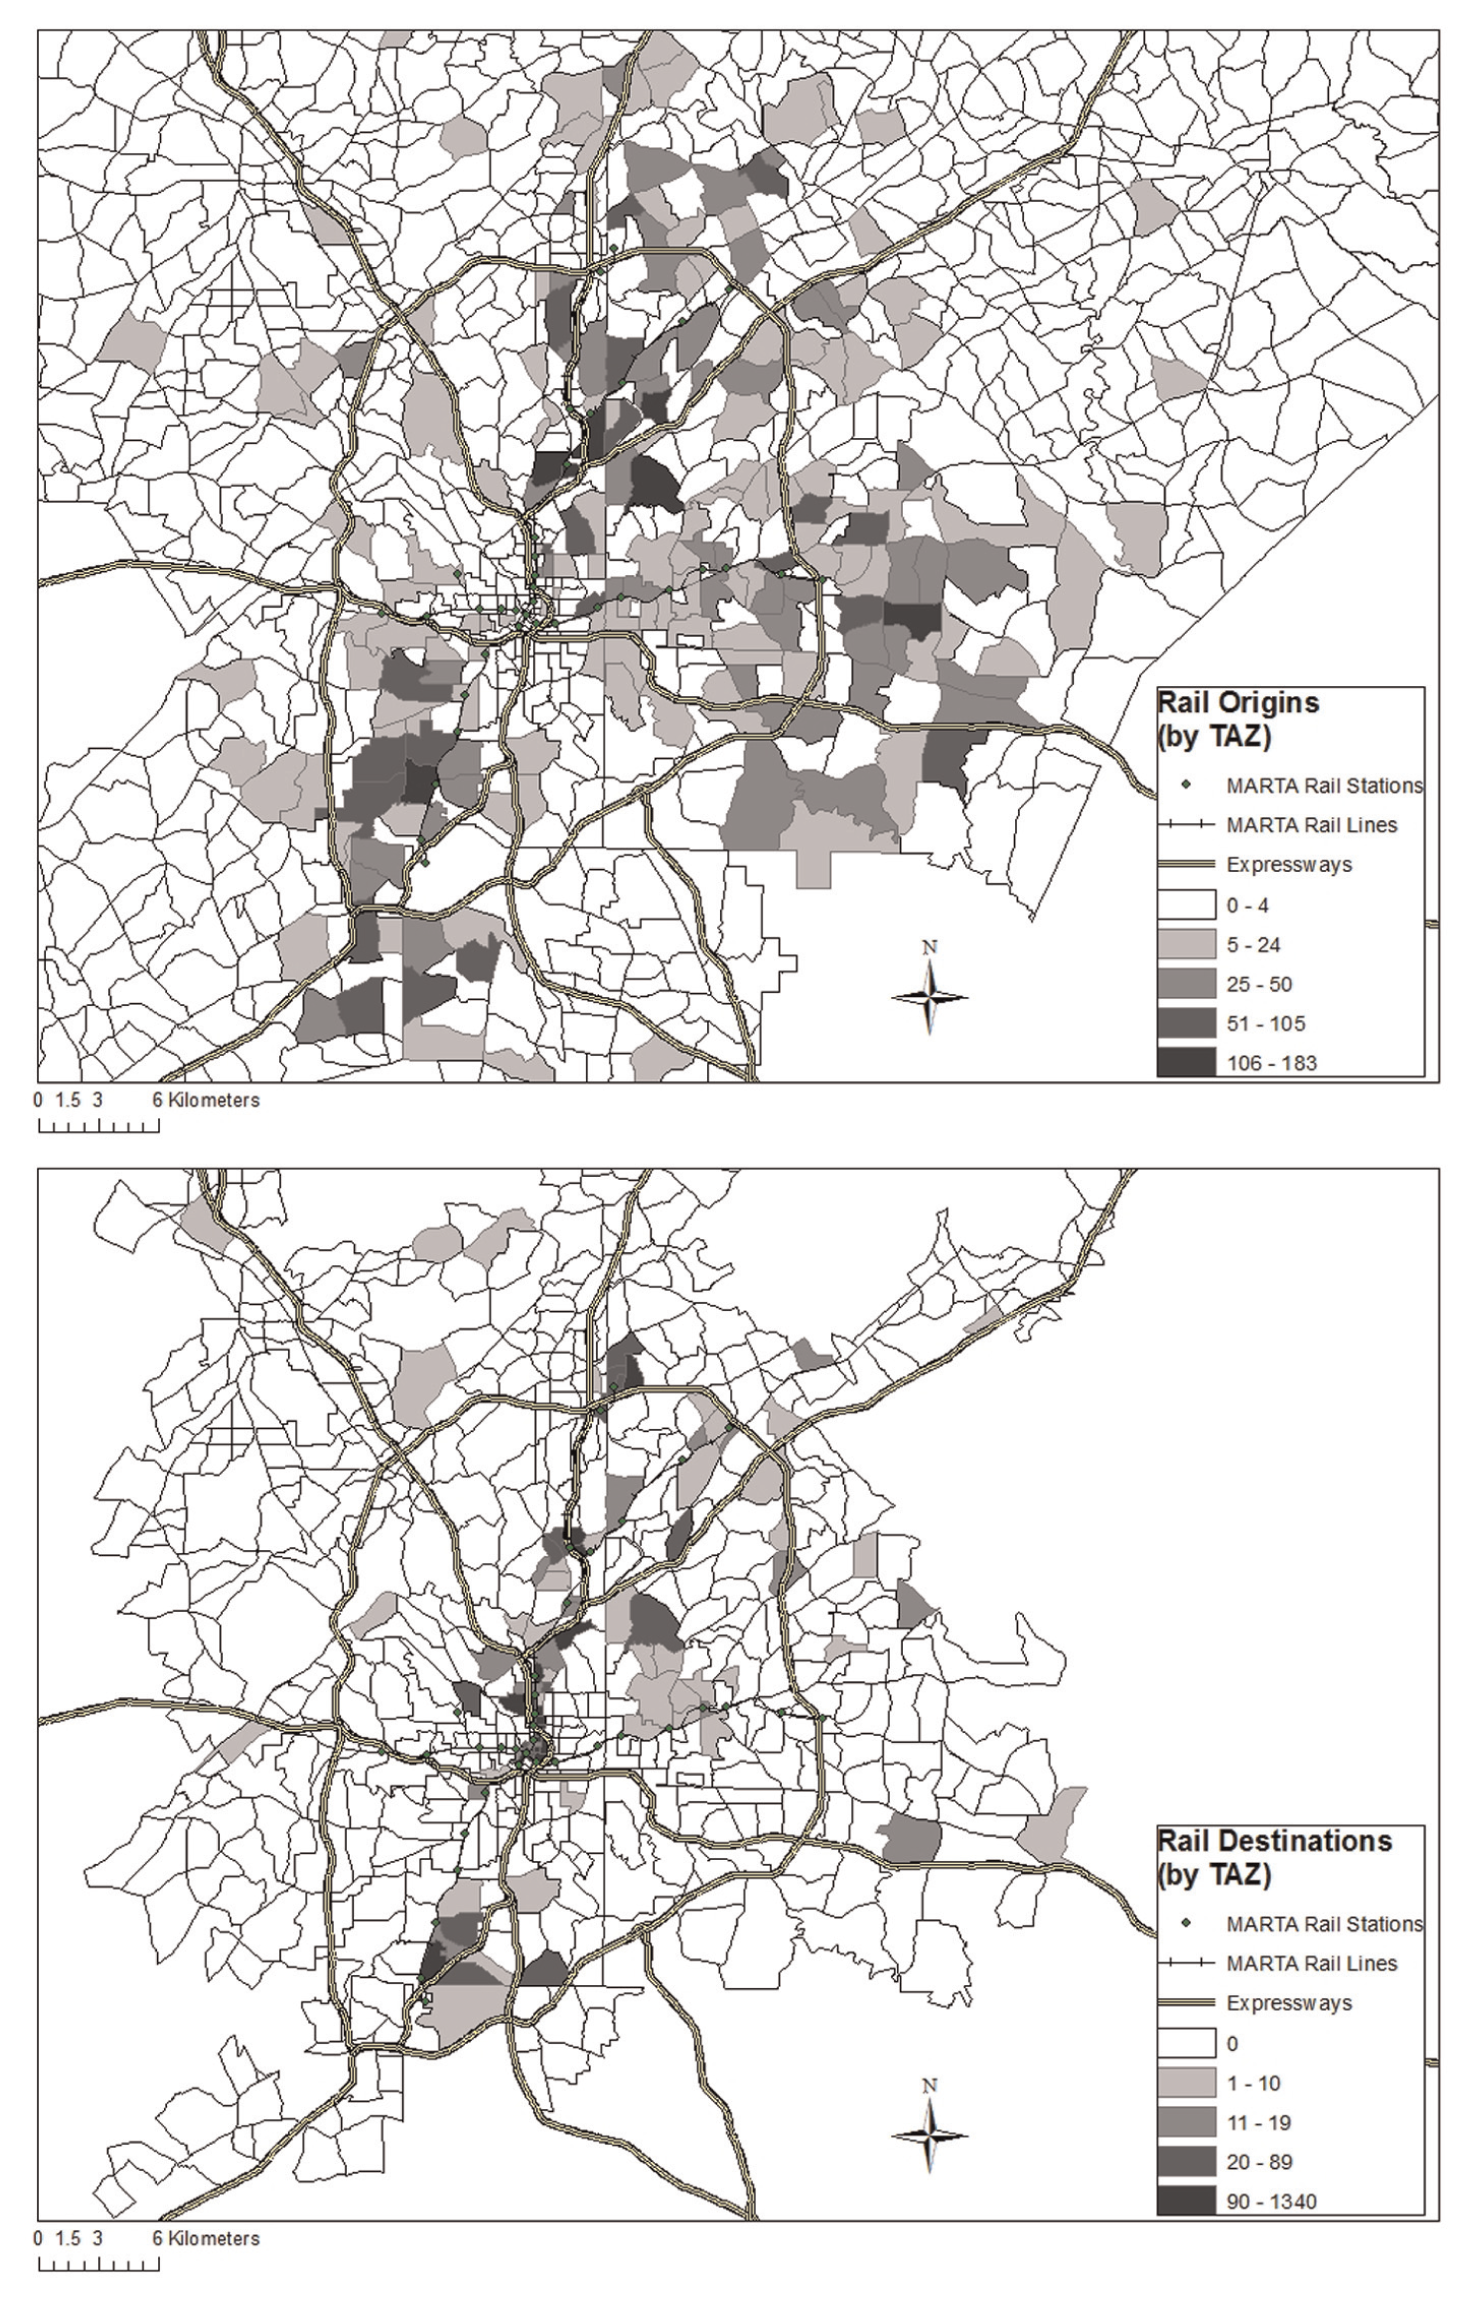
Rail rider journey to work trip origins and destinations, 2000.
For the regional model, if the destination zone has CBD characteristics or is a TOD (with qualifications discussed later), rail trips are multiplied by four- to five-fold. Variables that measure ease of rail travel from an origin to a destination also are highly correlated with regional rail ridership. The model shows that work trip rail passengers weigh every minute spent in OVT 4.84 times their IVT. What the findings for OVT demonstrate is the difficulty that a rail system of limited scope has in connecting origins and destinations. In Atlanta, most rail riders travel to jobs very close to rail stations; a much smaller number transfer to buses to reach jobs located farther away. The prominence of the out-of-vehicle travel time variable in the regional rail model suggests that if rail stations could be brought into close proximity of most employment concentrations, rail ridership could grow.
The remaining four panels describe rail ridership to different types of travel destinations. There are important differences between these models, particularly between the two models indicating travel to the city centre (panels 2 and 3) and the two models indicating travel to dispersed destinations (panels 4 and 5). Few passengers transfer to buses to reach final destinations in the former two models, primarily because most of the central area is within walking distance of rail stations. The low use of bus egress is indicated by the insignificance of the transfer time and in-vehicle time variables, both highly significant in models with greater bus use. However, for the dispersed destination models, most passengers must transfer to buses to complete their trips, and these two variables assume importance. Passengers in the two dispersed destination models also are characterised as coming from zones with higher densities and lower incomes than those in the two centralised models. The lack of importance of originating zone population density for the CBD and central city models is unexpected but may be explained by a mix of service workers coming from higher-density areas and executives coming from low-density areas negating the effect of density.
The regional model’s destination TOD variable increases ridership by five-fold. The destination TOD variable in the ‘rail-to-all-other-destinations’ model is insignificant, however. The authors speculate that qualitative differences among the TODs account for that result. The former model’s TOD variable includes all four TODs, while the latter model includes only the Lindbergh Center and the Decatur TODs. Their unimportance for influencing trip attractions suggests that in the regional model only the Midtown and North Avenue TODs attract trips over what employment would suggest. Similarly, the origin zone TOD variable shows up increasing transit trip origins in the CBD model 13-fold over the magnitude of trips predicted by population and other explanatory variables. On the other hand, the origin TOD variable is unimportant for the centre city model, where the Midtown and North Avenue TODs are excluded from the origin TOD variable. This difference leads to the conclusion that these two TODs boost transit trip attractions in the regional model and trip origins in the CBD model. The authors are yet uncertain what types of differences between these pairs of TODs explain the difference in results.
Discussion
The results largely confirmed the hypothesis that trips by self-identified bus riders are produced in larger numbers in zones with lower incomes and lower levels of vehicle access, characteristics more reflective of transit dependent riders, while trips by rail riders are produced in larger numbers in zones with higher incomes and higher levels of vehicle access, characteristics more reflective of choice riders. The models highlight important similarities as well as differences between the two rider groups. In terms of similarities, both bus and rail trips are strongly associated with higher populations and population densities, and attracted to destinations with larger numbers of jobs but generally not areas with the highest employment densities. Both bus and rail riders are also quite sensitive to in-vehicle travel and transfer times. These similarities, and the results of the previous Broward County study, suggest that both bus and rail riders might benefit from policies that seek to connect major employment concentrations by relatively direct service involving seamless, co-ordinated transfers, and that agencies would enjoy higher patronage after adopting these policies (Thompson et al., 2012).
In terms of differences, bus trips are produced in larger numbers from zones with lower income, lower vehicle access and higher minority populations. While rail trips also originate in large numbers from minority zones, they tend to originate from zones with high levels of vehicle access; the income variable is not significant, except for trips destined to more dispersed destinations which tend to originate from zones with lower incomes but also relatively high levels of vehicle access. Bus riders do not place the same importance on out-of-vehicle travel time as do rail riders, suggesting that bus stop locations are easily accessible on both ends of their trips. Rail riders, on the other hand, do place a premium on out-of-vehicle travel time, suggesting that they have difficulty accessing stations and/or reaching destinations. This is not surprising given the small number of stations and their spatial distribution relative to the patterns of population and employment.
The land use variable results also reveal important differences between bus and rail riders as well as insights into the importance of TODs. Bus ridership in Atlanta is not associated with TOD characteristics at either the origin or destination end of a trip. The CBD does not emerge as a statistically significant destination for bus riders; indeed, lower-density employment clusters emerge as important destinations for these riders. These results are similar to those found in the study of the bus-only transit system in Broward County, Florida (Thompson et al., 2012). For rail riders, on the other hand, the CBD does emerge as an important destination, and two TODs (Midtown and North Avenue) emerge as important contributors to rail patronage, in excess of what would otherwise be predicted by their employment levels or densities. The authors are unsure exactly what makes these two TODs so different from their counterparts in Decatur and Lindbergh Centre, although an analysis of aerial photography suggests that differences in the land use mix, their walkability and perhaps the treatment and price of parking might play roles. An important caveat to these results is that these predictive models tested only for associations and do not permit speculation about possible causal relationships between the explanatory and dependent variables. More sophisticated analyses would be necessary to test for causal relationships and their possible nature.
Conclusion
The authors began this study by asking what types of policies would expand the use of transit by choice riders while at the least not hurting transit dependent riders. The authors used bus riders to represent transit dependent riders and rail riders to represent choice riders and found that bus trips in Atlanta did originate in larger numbers in zones with higher levels of transit dependent characteristics than rail riders. The model results suggest that commuters who consider themselves bus riders seem to want a grid of routes connecting the region’s employment centres with faster, more direct, and more frequent service. Shelters, good pedestrian connections and other amenities at transfer points are also implied as being important to these riders coming disproportionately from zones with more transit dependent characteristics. With such amenities, many more bus riders will use transit, presumably relying less on friends and relatives for chauffeured auto rides. Many of these riders appear to use trains to move speedily from one part of the region to the other, relying on buses at one or both ends of the trip, so good transfer connections between buses and trains also will increase their ridership.
Commuters who consider themselves rail riders, who tend to access transit by automobile, want trains to take them to major employment destinations, including the CBD and some TODs. Serving more rail riders will require extending lines into job-rich corridors and developing stations and station environments with qualities typical of the North Avenue and Midtown TODs. The more that can be done with a network of several regional rapid transit lines, the greater will be the number of rail riders in the Atlanta region.
If a transfer to a bus is required to complete the trip, the service may attract lower-status workers who none-the-less are likely to live in zones with higher auto ownership and make use of autos to access the system. Are these choice riders, as well? The model results suggest that many of them come from zones more characteristic of choice riders. Their numbers could increase in a more expansive regional network of rapid transit lines that have excellent bus connections to jobs within 1–3 kilometres of stations.
A grid of local buses tied into such a regional rapid transit system could greatly increase the number of transit dependent ridership as well, because it would enable them to reach additional employment opportunities that are presently not adequately served by transit. Research conducted elsewhere suggests this can be done efficiently and in a relatively cost-effective manner (Thompson et al., 2012). These results derive from a study of Atlanta, but given their consistency with lessons derived from other locales, they provide important guidance to agencies seeking to increase ridership by both rider groups.
Footnotes
Acknowledgements
The authors wish to thank the staff of the Atlanta Regional Commission for providing data used in the analysis.
Funding
The authors wish to thank the Mineta Transportation Institute for their financial support of this research.