
Abstract
New Urbanism and traditional neighbourhood development (TND) have been championed as solutions to the problems associated with post-war suburban sprawl. However, they have yet to capture a substantial share of the US housing market. The market context for TND is not well understood as the paucity of TND makes it difficult to study directly. This paper takes a novel approach by focusing on the market for ‘traditional’ development itself, defined as subdivisions recorded prior to World War II, in the sprawling Tucson, Arizona, MSA. The results of the hedonic analysis demonstrate that home buyers value the features embodied in traditional development, as homes in subdivisions platted before 1940 command premiums over those in their modern counterparts, even after carefully controlling for locational and structural characteristics. Moreover, the analysis finds that the premiums have increased through time, which suggests growing demand for traditionally designed subdivisions.
1. Introduction
The design of American subdivisions has evolved markedly over the past century as the compact, walkable and well-connected developments of the early 20th century gave way to more auto-centric and inward looking designs after World War II. The post-war suburban model has proven to be a tremendously successful form of development as evidenced by the high proportion of Americans living within these settings today. However, this model has come under increasing scrutiny in recent decades. Planners and New Urbanist proponents decry it as sterile, lifeless and isolating (Nasar, 2003). Low-density suburban development, with its large lots and separated land uses, has also been shown to be more resource intensive than the compact style of development that prevailed before and the auto dependence it fosters creates damaging externalities such as higher energy consumption and greenhouse gas emissions (Ewing and Cervero, 2001; Kahn, 2000; Leinberger, 2007).
These deficiencies have led to a growing call to return to more ‘traditional’ forms of development. The traditional neighbourhood development (TND) movement advocates replicating the pre-war style of development and emphasises compact sub-divisions with smaller lots and pedestrian-oriented layouts featuring smaller blocks and narrower streets laid out in a grid pattern. It also emphasises greater mixing of housing types and land uses including workspaces, retail, civic and open space (Duany et al., 2000; Nasar, 2003). While there are some distinctions, the related New Urbanism movement shares many of the same concerns (Bohl, 2000; Morrow-Jones et al., 2004; Talen, 2001).
Housing and community preference surveys generally find substantial consumer support for TND and allied forms of development (Myers and Gearin, 2001; Morrow-Jones, 2004; Handy et al., 2008) and its proponents argue that pent-up demand exists (Levine and Frank, 2007; Nelson, 2006). However, TND has yet to capture a substantial share of the housing market. The lack of market penetration may be due to multiple factors. Restrictive zoning regulations based on the post-war suburban template are clearly one (Levine et al., 2005). It may also reflect a failure of developers to respond appropriately to consumer demand. Alternatively, it could be due to the fact that consumers are unwilling to accept the associated tradeoffs, such as smaller lots and reduced privacy, when actual housing decisions are made. What is certain is that TND must be financially feasible and generate a financial return commensurate with that of conventional suburban development if it is to capture a larger share of the market. Thus it is imperative to develop a more nuanced understanding of the market context for TND.
A number of prior studies have sought to demonstrate that home buyers are willing to pay premiums for homes in TNDs or for the neighbourhood design attributes embodied in the concept, but the results have been mixed and the market context for TND is still not well understood (Tu and Eppli, 1999, 2001; Song and Knaap, 2003; Ryan and Weber, 2007). This effort has been hampered by the fact that many areas have experienced little or no TND, which makes it difficult to study the market directly. Moreover, the presence of pricing premiums alone does not demonstrate the existence of pent-up demand for TND.
The present paper takes a novel approach to enhance understanding of the market context for TND by focusing on the pricing of ‘traditional’ development itself—defined here as subdivisions recorded prior to the auto era. Because these subdivisions embody the features that TND strives to emulate, differences in pricing between homes in traditional developments and those found in conventional post-war developments can provide insight into the market potential for TND. If traditional subdivision designs are valued by home buyers, homes within should sell for higher prices, ceteris paribus. Moreover, if the market is undersupplying TND, it will be manifested in the form of growing price premiums through time. The study is set in Tucson, Arizona, where few TNDs exist. However, Tucson does have many subdivisions platted prior to the auto era. The empirical analysis uses the hedonic method to quantify the price effects attributable to the ‘vintage’ of the subdivision in which a home resides based on nearly 75,000 transactions. In addition, the study examines the extent to which the premiums/discounts attributable to subdivision vintage changed over the course of the 10-year study period.
The paper proceeds as follows. The first section outlines the theoretical context and reviews the prior empirical research relating to the valuation of TND. This is followed by an overview of Tucson, its housing market and its development patterns. Section 3 discusses the data and methods employed in the empirical analysis. The fourth section details the results of the hedonic models and the final section draws conclusions and suggests avenues for future research.
2. Theoretical Background and Prior Empirical Findings
Urban land economics theory provides the theoretical context to support the idea that subdivision design attributes may influence property values. More specifically, Situs theory argues that urban land values are shaped by the characteristics of the surrounding environment and the quality of the linkages between a property and complimentary land uses (Andrews, 1971). Sub-divisions represent the division of a single, larger parcel of land into individual lots with the purpose of their sale and development. The subdivision process is generally controlled and guided by a single land developer, although it is common for multiple builders to be involved in the construction of homes. While the size of homes, lots and architectural styles may vary, subdivisions are relatively homogeneous internally. Thus the subdivision comprises the immediate environment in which homes are embedded and the aesthetic qualities associated with their design may influence household utility. Moreover, subdivision design impacts the quality of a site’s linkages to destinations within the neighbourhood through its affect on travel times and the travel experience.
The hedonic method has been widely used to quantify the value of neighbourhood environmental attributes and linkages. The theoretical context for its application to housing markets was pioneered by Rosen (1974) and rests on the premise that a home can be considered to be comprised of a bundle of distinct characteristics and that its market value is the sum of the values assigned to each attribute. The implicit price of a given attribute can be inferred by observing how sale prices vary between homes with differing quantities of the attribute, holding the quantity of other attributes constant. One of the key advantages of the hedonic method is that the resulting attribute values are based on the actual behaviour of home buyers; thus it accounts for the complex real-world tradeoffs that preference surveys are unable to fully replicate.
Several prior studies have used the hedonic approach to attempt to quantify the premiums that homes within TND communities command relative to those in alternative forms of development. For example, Tu and Eppli (1999) found that homes in the Kentlands, one of the earliest and best known examples of New Urbanism/TND, sold for approximately 12 per cent more than those in conventional developments in the surrounding area. The authors later performed a more comprehensive analysis that included two additional TNDs and again found that, ceteris paribus, buyers paid higher prices for homes in the TND communities than in conventional developments (Tu and Eppli, 2001). In contrast, Ryan and Weber (2007) studied new development in low-income Chicago neighbourhoods and found that homes in TNDs sold at a discount to those in more conventional infill developments, which suggests that TND may not command pricing premiums in all contexts.
Hedonic studies focusing on the pricing of homes in TNDs themselves have been inhibited because relatively few exist and the small volume of sales in these communities make it difficult to derive precise marginal implicit price estimates. Other researchers have sought to overcome this limitation by estimating the pricing premiums attributable to the broader neighbourhood design characteristics embodied in the TND concept. For example, in a study set in Washington County, Oregon, Song and Knaap (2003) found that some elements associated with TND such as smaller blocks, more evenly distributed land uses, better street connectivity, pedestrian accessibility and light rail access resulted in higher prices, while others, including higher densities and higher proportions of commercial, public and multifamily land uses, resulted in discounts. In a study limited to a single design feature, Guttery (2002) found that homes in the Dallas–Fort Worth area with rear alleyways, which are often advocated by TND, sold at a significant discount.
Subsequent studies demonstrated that the premiums for neighbourhood attributes associated with the TND are not universal, but depend on geographical context. For example, Song and Quercia (2008) found that better street connectivity and pedestrian access were valued more highly in Washington County, Oregon areas classified as ‘traditional’ and ‘neo-traditional’ neighbourhoods, while more homogeneous land uses and lower densities commanded premiums in areas deemed to be ‘conventional’ suburbs. Similarly, in a study set in King County, Washington, Matthews and Turnbull (2007) demonstrated that more grid-iron like street patterns resulted in price premiums on the west side of the study area, which includes the more pedestrian-oriented neighbourhoods of Seattle. In contrast, both grid-like street designs and proximity to retail uses were found to diminish housing prices on the east side—an affluent conventional suburban area.
In sum, the results produced to date suggest that TND, and the specific design features it embodies, command premiums in some, but not all, contexts. In addition, due to its limited geographical focus, prior work provides little guidance as to whether TND would command the same premiums in the rapidly growing, auto-oriented metropolises of the Sunbelt. The cross-sectional research designs are also incapable of shedding light on the question of whether ‘pent-up’ demand exists for TND. Rising premiums over time would provide more explicit evidence that TND is being undersupplied. A more nuanced understanding of the market context is clearly required to convince housing developers that a market exists and to guide policy-makers in their efforts to stimulate it. The empirical analysis that follows provides additional insight into the market potential for TND by examining the market for traditional development itself in a rapidly growing south-western urban area. A brief overview of Tucson is provided next in order to establish the context for the empirical analysis.
3. Background: Tucson, Arizona
3.1 Overview and Housing Market
The Tucson metropolitan area, defined by the Census Bureau as Pima County, lies within the Sonoran Desert in Southern Arizona just 60 miles to the north of the Mexican border. The majority of the county, which encompasses nearly 9000 square miles, is undeveloped. The Tucson urbanised area is situated in the eastern portion of the county and is ringed by mountain ranges. The area chosen as the focus for this study roughly corresponds to the contiguously developed portion of the urbanised area surrounding the Tucson urban core.
Prior to World War II, Tucson was a small and isolated outpost with a population of just 73,000. The metro experienced rapid growth after the war in conjunction with the advent of refrigerated air conditioning. Its population swelled more than seven-fold between 1940 and 1980 and approximately 1 million residents live in the MSA today. Tucson’s growth in recent decades has been fuelled by both Hispanic immigration and internal migration, and the metro has emerged as a major retirement destination. Like most south-western metropolises, Tucson’s pattern of development is dispersed and the urbanised area encompasses more than 500 square miles as growth has been accommodated in a horizontal manner. While some central neighbourhoods have relatively high densities, most residents live in low-density, suburban-style settings. Tucson’s employment base is also dispersed and its undersized CBD functions primarily as a centre for government services.
Tucson’s housing market is generally differentiated from north to south, with the highest prices and wealthiest residents found in the foothills of the Santa Catalina Mountains to the north-east of the urban core. Historically, median home prices in Tucson have been similar to the nation overall, but at the beginning of the study period prices lagged the national average due to a prolonged market slump during the early-to-mid 1990s. By the late 1990s, the market began to recover and supply and demand were roughly balanced during the first several years of the study. By the mid 2000s, prices began to escalate at a double digit pace, fuelled by population growth, low interest rates, lax lending standards and speculation. Prices rose by more than 25 per cent in 2005 alone, driving them above the national average. The market peaked during late 2006 and prices began to decline gradually in 2007. Subsequent to the end of the study, prices have fallen by an additional 35 per cent. 1
3.2 Subdivision Development Patterns
Tucson’s pattern of historical development is exemplified in Figure 1, which depicts the period during which each of its subdivisions was recorded. Subdivision development prior to 1920 was largely constrained to areas immediately adjacent to the CBD, although pockets of development can be observed outside the core as well. Between 1920 and 1945, development expanded outward from the CBD, primarily along the flat basin lands to the south, north and east, as the Tucson Mountains constrained development to the west. The metro’s rapid growth following World War II is evidenced by the large quantity of land devoted to new sub-divisions between 1946 and 1970 and substantial ‘leap-frog’ development is apparent during this era. During recent decades, infill development has backfilled many of the bypassed parcels, but development has continued to occur primarily at the expanding urban fringe in the burgeoning suburbs of Oro Valley and Marana to the north, and in Sahaurita, located approximately 20 miles to the south of the CBD.
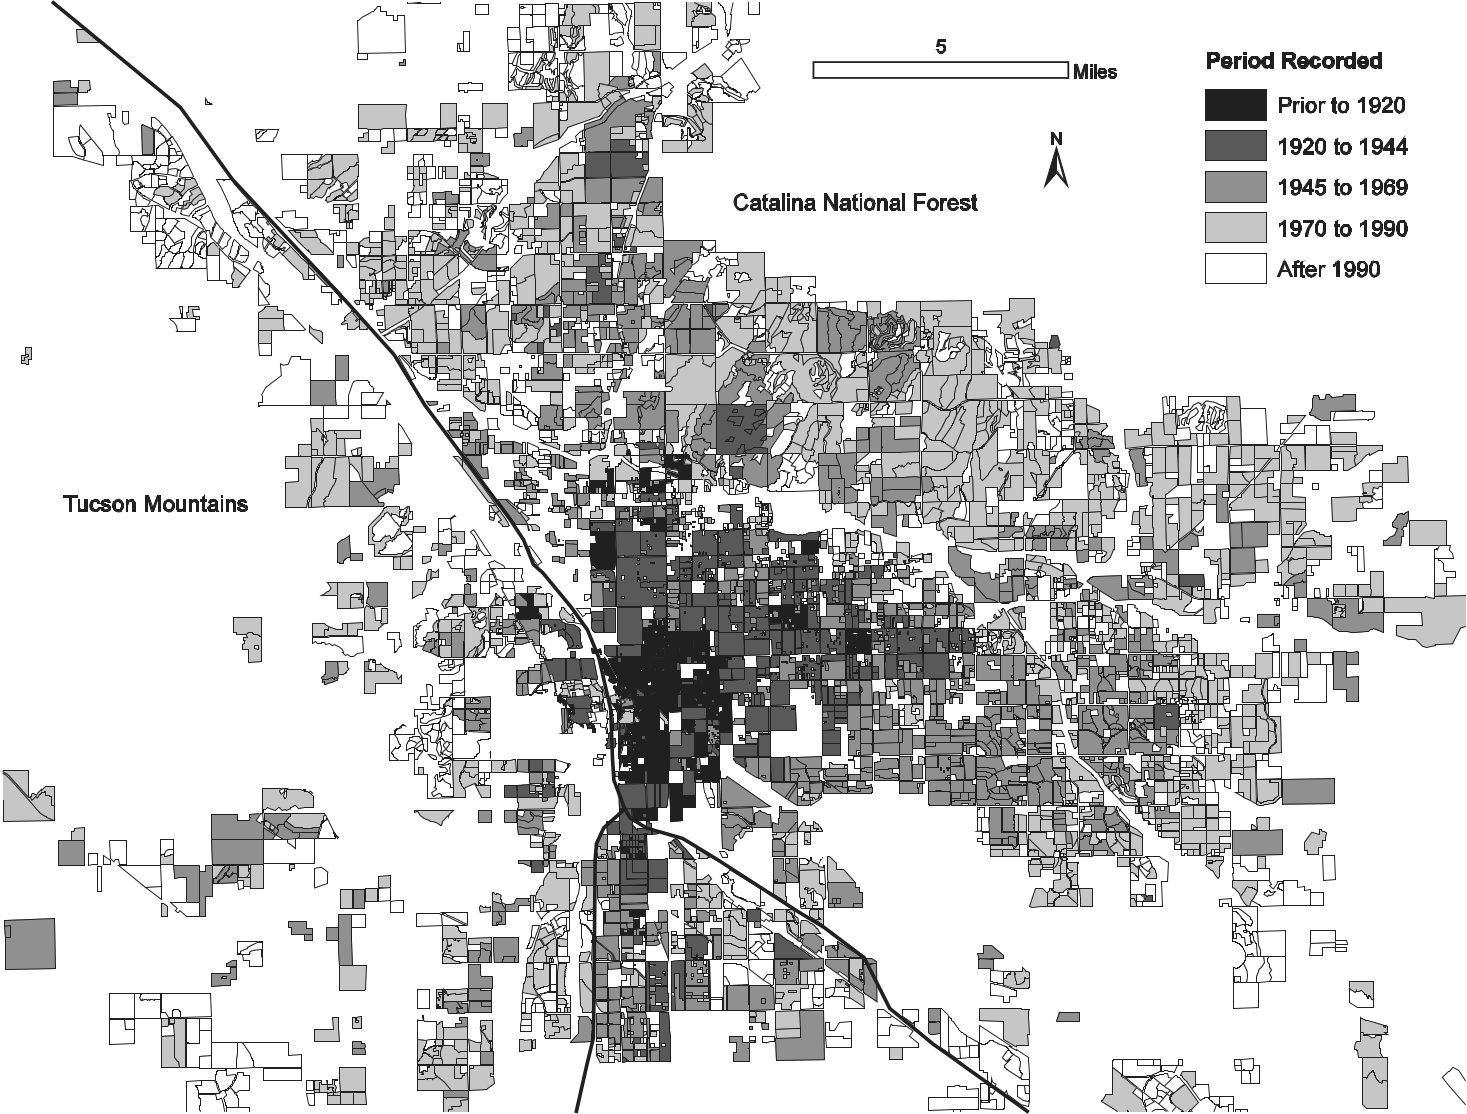
Tucson subdivisions, by period recorded.
The design of Tucson’s subdivisions has evolved through time in a manner similar to other Sunbelt cities (see Figure 2). Early subdivisions often followed the design principles of the Spanish-Mexican tradition, with homes sited on small lots and built to the front of the property line (City of Tucson, 1996). With rising Anglo-American migration near the turn of the 20th century, Tucson’s subdivisions began to follow Anglo site-planning concepts and were generally compact with streets and rear alleyways laid out in a grid-like pattern. These subdivisions were well connected with the surrounding neighbourhood and adjacent commercial land uses. Subdivisions platted during the great depression and ensuing period of war began to transition towards more auto-centric forms as Tucson’s streetcar service was discontinued during the early 1930s and its routes replaced by buses. However, because automobiles were out of financial reach for many households, these subdivisions were typically more compact and walkable than their modern counterparts.
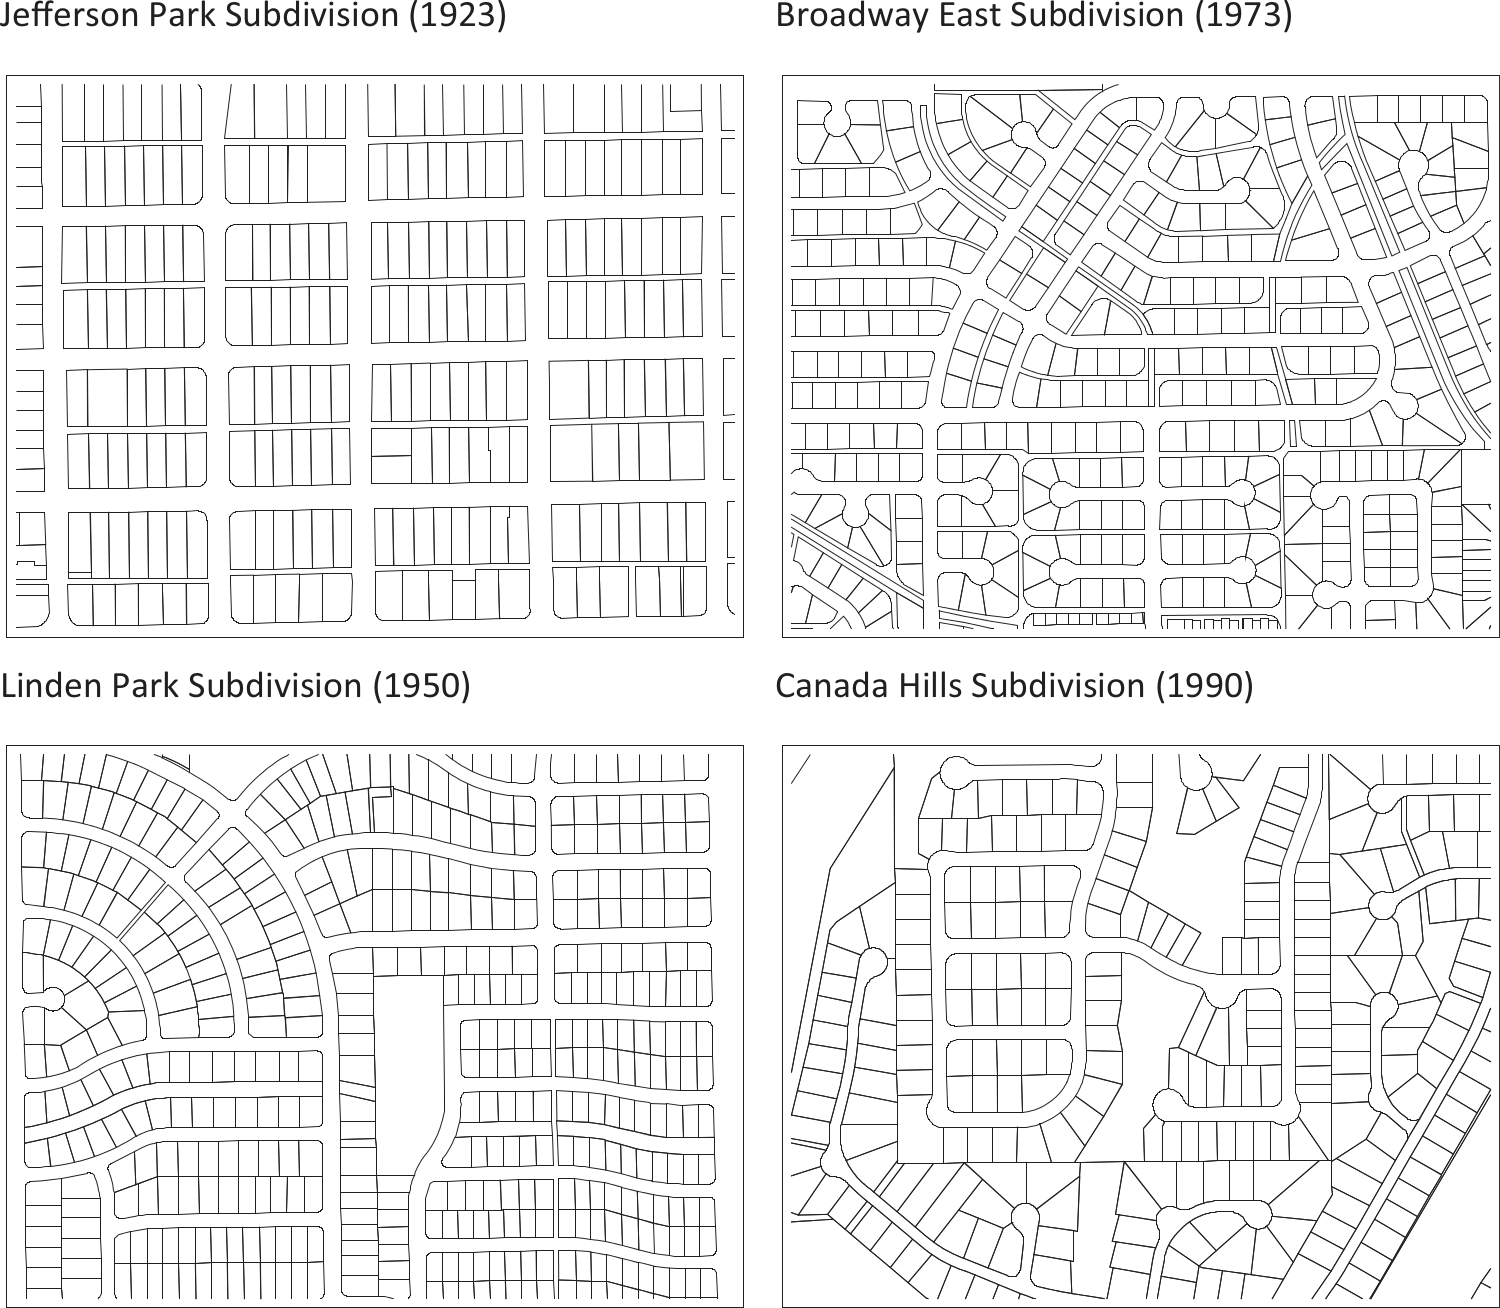
The evolution of subdivision design.
Residential developers responded to rapid population growth following World War II by hastily platting subdivisions in a largely unplanned manner as zoning and subdivision regulations were weak or non-existent in the areas developed during this period. These subdivisions were more explicitly designed with the automobile in mind—the grid pattern began to break down, sidewalks disappeared and developers began to experiment with cul-de-sacs (City of Tucson, 2007). During the 1970s, lot sizes increased substantially and subdivisions became more internally oriented, as curvilinear designs and abundant cul-de-sacs became the norm and connectivity to surrounding land uses was reduced. During the final decades of the 20th century, master-planned subdivisions incorporating more internal amenities and access restrictions to protect their borders became prevalent and, in some cases, connectivity to adjacent land uses was effectively severed by gates and walls.
4. Research Design
4.1 Overview
The objectives of the empirical analysis are two-fold. The first is to determine whether the design features shared by subdivisions recorded during a given era affect home prices. If home buyers value traditional development, homes in subdivisions recorded prior to the automobile era should command premium prices over those in more recently platted subdivisions, holding other factors constant. The second objective is to assess whether the premiums attributable to the design features embodied in traditional subdivisions have increased through time, which would signify a favourable supply/demand balance relative to conventional suburban designs and would provide evidence that pent-up demand exists for traditional development.
The empirical analysis begins with an illustrative analysis of median home prices by subdivision vintage. Next, hedonic models, which explicitly control for the structural and locational attributes of the homes, are estimated in order to isolate the pricing effects attributable to subdivision design-related features. By including variables in the hedonic representing the decade during which the home’s subdivision was platted, it is possible to ascertain the premiums or discounts that buyers pay for the shared features embodied in subdivisions of a given vintage. The hedonic models are also segmented by time-period—which permits changes in the premiums/discounts to be measured. The data and methods are discussed more fully next.
4.2 Data
The data used in the analysis consist of approximately 75,000 existing single-family home transactions that occurred in the study area between 1998 and 2007. Data preparation began by creating a sub-divisions database using a GIS file maintained by Pima County, which includes the date recorded for every subdivision in the county. A total of 3096 subdivisions with existing single-family homes were found within the study area.
The subdivisions database was then matched to the Pima County Assessor’s master residential file in order to create single-family home counts and variables measuring the average size, lot size and structural class of homes within each sub-division. Subdivisions with fewer than 11 homes were removed from the database as those below this size threshold were deemed too small to represent a meaningful unit of analysis, and only subdivisions platted prior to the beginning of the study period were retained in order to ensure that sales were drawn from a consistent set of sub-divisions across the three time-periods considered in the analysis. Finally, subdivisions with average structural quality ratings greater than 4, lot sizes greater than 1 acre (4047 square metres), and homes averaging more than 3000 square feet (279 square metres) were removed because the marginal implicit prices of the attributes of homes found in these upper-echelon subdivisions may differ from those of standard ‘tract’ subdivision homes (McMillen, 2008). The final subdivision database contains records for approximately 1600 distinct subdivisions.
The next step involved matching the sub-divisions database to a sales database maintained by the Pima County Assessor, which includes records for all real estate transactions in the county as they are required by law to be recorded. Sales records that did not represent existing single-family homes or ‘arms-length’ transactions were eliminated from the dataset. The sales records were then matched to the assessor’s annual master residential files in order to identify the structural attributes of the home at the time of sale. Only homes sited on lots of two acres or less (8094 square metres) were retained and a total of 200 records with missing or implausible structural characteristics values were removed from the database. Thirty additional observations were eliminated due to extremely high or low sale prices, as they are most likely to reflect coding errors or non-arms-length transactions. Finally, the locational attributes of each property were derived through a GIS and appended to the sales records. The final sales database consists of 74,643 distinct records.
4.3 Hedonic Models
The hedonic specification employed in the empirical analysis takes the following general form

where, lnP is the natural log of the sale price; T is a vector of dummy variables representing the year and quarter during which the transaction occurred; H is a vector of structural attributes associated with the home; L is a vector of neighbourhood and locational characteristics; and S is a vector of subdivision characteristics. The α represents the constant term; the betas are the coefficients to be estimated for each variable within a respective vector; and μ is the stochastic error term. 2
While there is no clear consensus as to the correct functional form in hedonic house price models, the semi-log specification was chosen as it has been used widely in hedonic applications and has proved to produce reasonable results (Cropper et al., 1988). This functional form allows the value of each attribute to vary with the quantities of the other characteristics. Moreover, it has the advantage of easily interpretable coefficients, which correspond to the approximate percentage change in price attributable to a one unit change in the value of an independent variable.
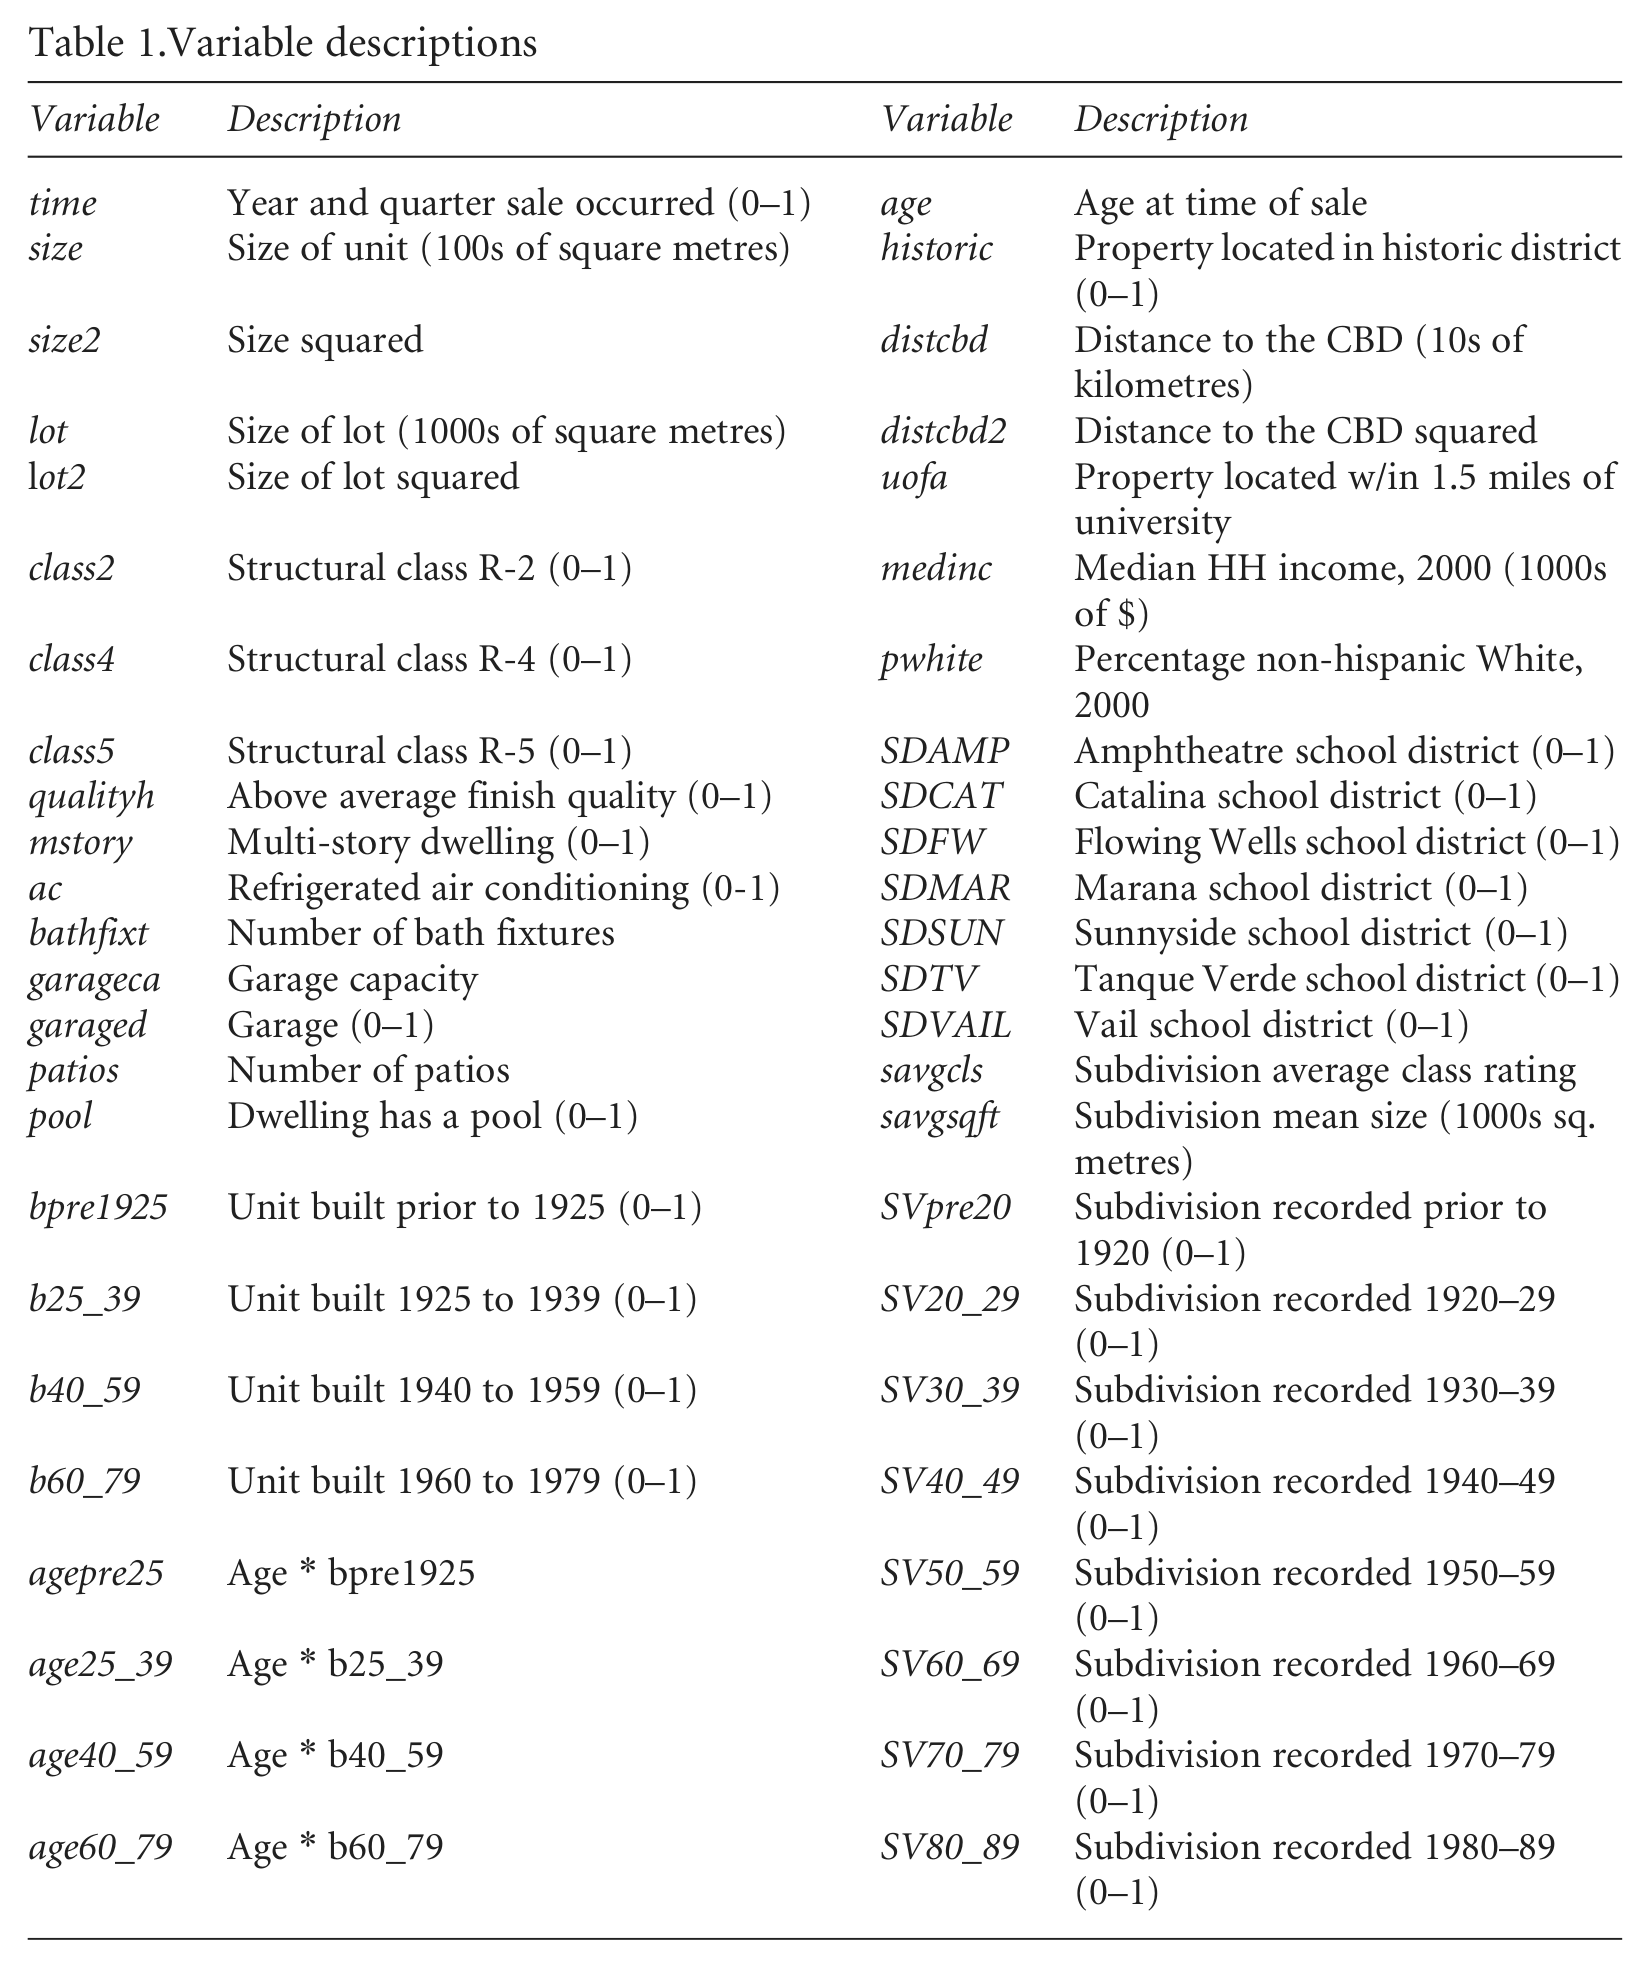
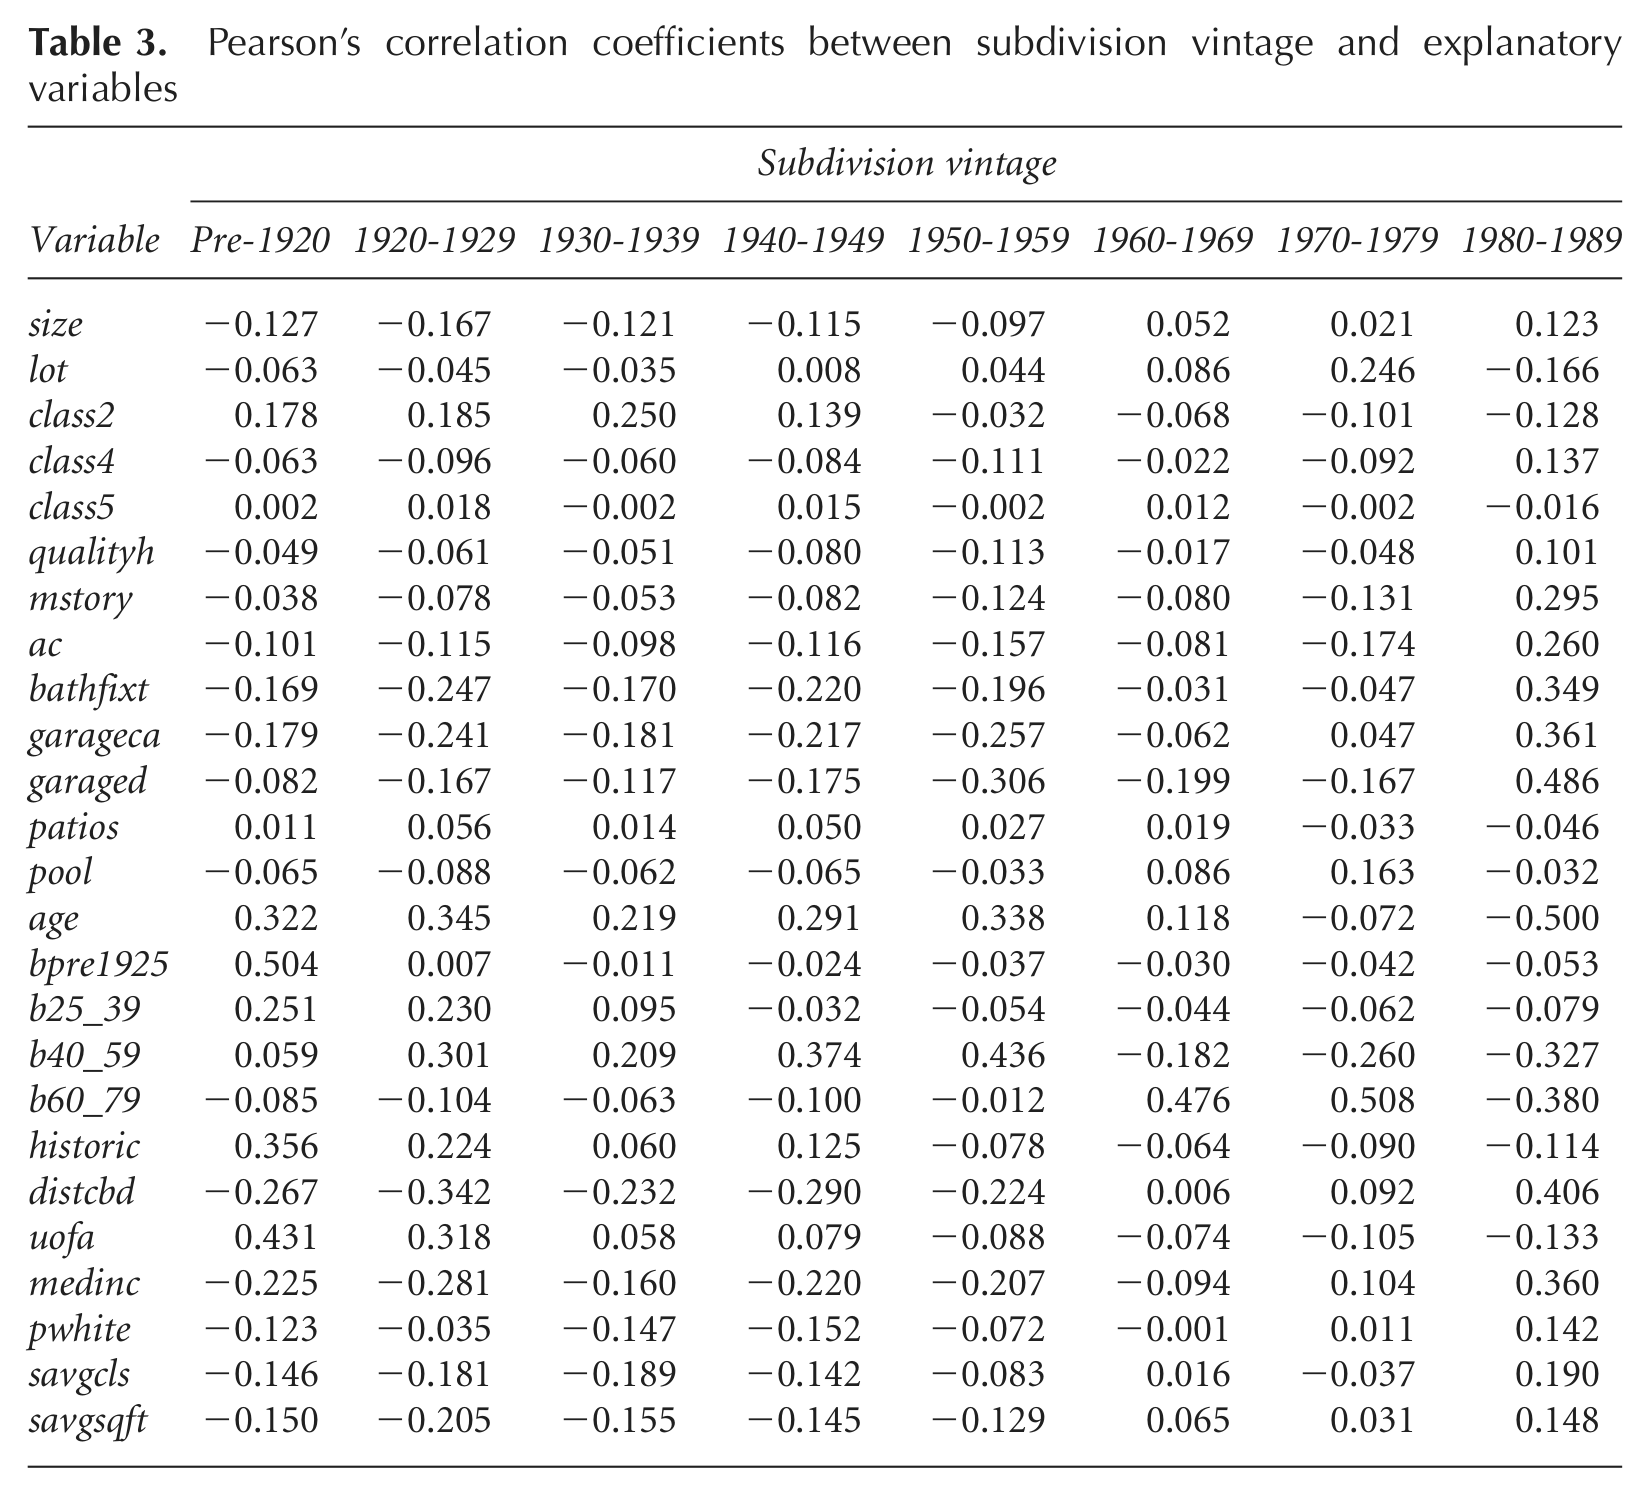
Variable descriptions, descriptive statistics and correlations between the key independent variables are shown in Tables 1, 2 and 3 respectively. The S vector is of primary interest in this study as it includes dummy variables representing the decade during which each sale observation’s subdivision was platted. These variables will capture the effects of subdivision design-related attributes as well as any other attributes shared by homes in a given vintage that are not explicitly included in the regression. Thus it is critically important to control for the locational and structural attributes of the homes, as they are correlated with subdivision vintage.
Variable descriptions
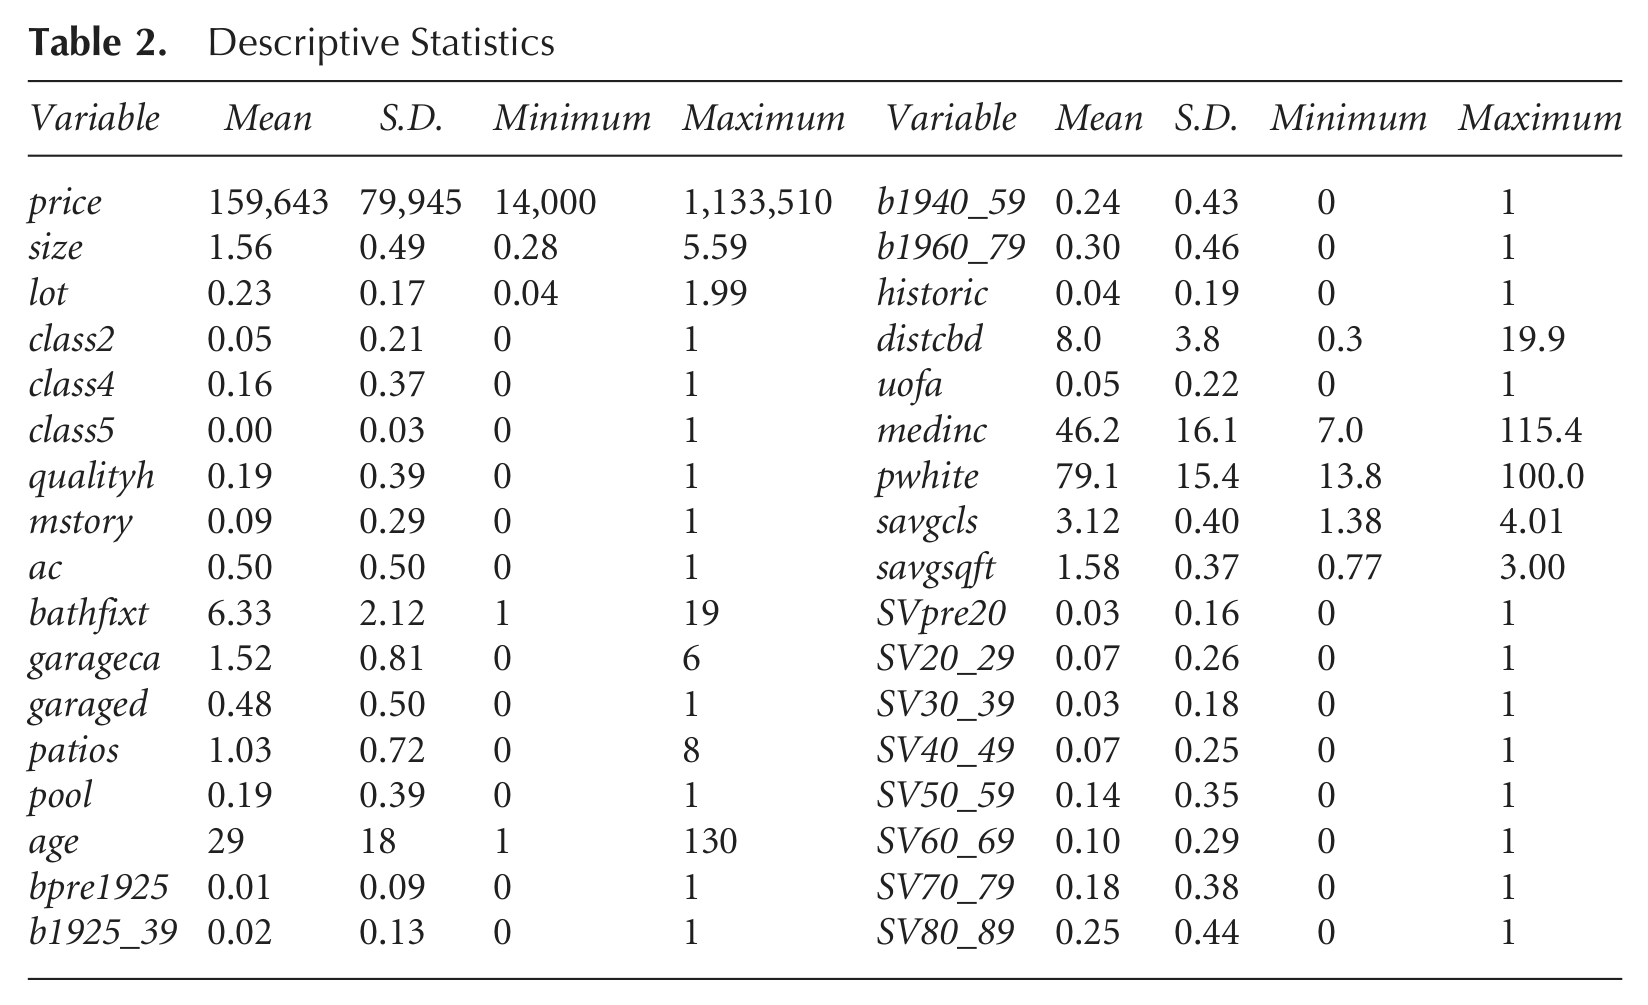
Descriptive Statistics
Pearson’s correlation coefficients between subdivision vintage and explanatory variables
The L vector includes controls for neighbourhood demographic characteristics, fixed effects for the study area’s eight school districts, proximity to the University of Arizona—a major activity centre—and variables measuring the distance, and squared distance, between each home and the CBD in order to capture the accessibility advantages of central locations. In addition, a variable indicating properties located within designated historical districts is included to control for the pricing effects associated with historical status. The H vector contains control variables for site and structural characteristics typically found in hedonic models, as well as several additional control variables as described next.
It is particularly important to control for structural attributes as homes in old sub-divisions are likely to differ systematically from those in new subdivisions. The ‘class’ variable represents the assessor’s rating of structural quality and thus controls for survivorship bias as higher-quality homes are more likely to have survived in older subdivisions than lower-quality. Homes in older subdivisions could also potentially sell for higher prices due to unobserved features stemming from renovations. Because the probability of renovation is likely to be closely related to the age of the home itself rather than to that of the subdivision in which it resides, and considerable variability in age exists within each subdivision vintage due to extended build-out periods and redevelopment, it is possible to separate the price effect attributable to unobserved characteristics shared by older homes from those of older subdivisions. This is accomplished by including more stringent controls for age. In addition to the standard age variable, the models include dummy variables representing the ‘era’ during which the home was built, which may have an independent effect on price as homes constructed during a given period share design features and construction materials (Coulson and McMillen, 2008). Age and era are also interacted with one another, allowing the price effect of an additional year of age to vary with the era during which the home was built.
The sample is disaggregated into three equal time-periods of 40 months. This serves two purposes. First, the marginal implicit prices for explanatory variables may not be constant over the entire 10 year time-period. 3 While it is difficult to define structural breaks precisely, dividing the observations into three periods reduces the potential for bias. The periods correspond to different phases in the market cycle: the first reflects a balanced market and moderately growing prices; the second was characterised by accelerating appreciation as the housing bubble began to inflate; and the third corresponds to the period surrounding the market peak. The second reason for disaggregating the sample is that this permits evaluation of change through time in the subdivision vintage coefficients. Growing premiums for homes in a given vintage would signify a faster rate of appreciation and hence a favourable supply and demand balance for the design features it embodies.
Initial models were estimated using ordinary least squares (OLS). However, an analysis of the residuals revealed the presence of spatial autocorrelation, which reduces the efficiency of estimation and can bias the resulting standard errors of the coefficients. Spatial dependence is typically controlled for by using either a spatial lag model, which includes an additional explanatory variable measuring the weighted prices of nearby home sales, or through a spatial error model, which addresses the problem through a modification of the error term (Anselin, 1988). Lagrange multiplier tests revealed that the spatial error model was most appropriate in this case. 4 Therefore, the final models were estimated using a spatial error specification using the maximum likelihood estimator. This specification also helps to control for omitted spatial variables, which could bias the resulting coefficient estimates. The only change to the general hedonic equation presented earlier is to the error term, which becomes

where, μ is a disturbance term that is assumed to follow a spatial autoregressive process, λ is the spatial parameter to be estimated, and W is a spatial weights matrix that determines which observations are considered in the computation. 5
5. Research Findings
5.1 Median Price Analysis
Annual median prices by subdivision vintage are shown in Table 4. These figures are intended to provide a context within which the results of the hedonic models can be situated. These data indicate a clear relationship between home prices and sub-division vintage. Based on the 2007 figures, Tucson’s newest subdivisions command the highest prices, while subdivisions recorded between the 1930s and 1950s achieve the lowest. Homes in traditionally designed pre-war subdivisions were priced at a substantial discount to the market overall, but this differential narrows for the oldest sub-divisions.
Results: median price analysis
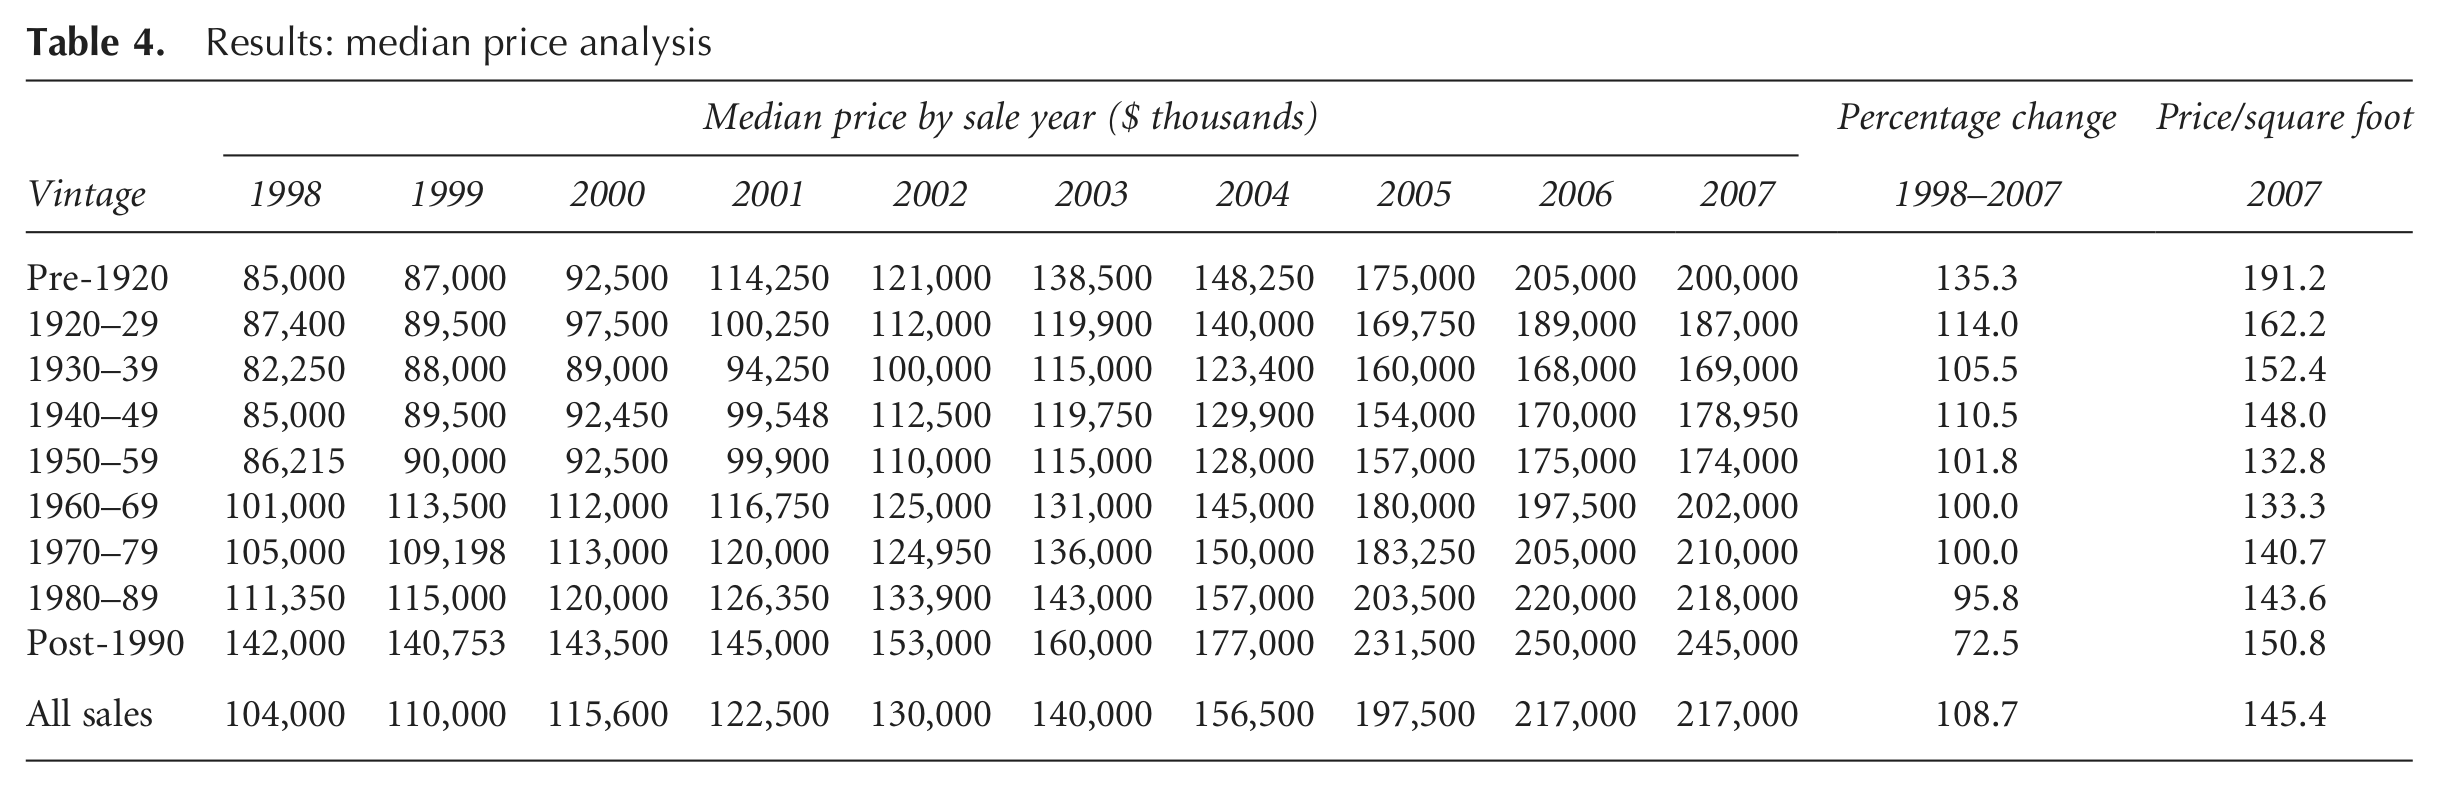
The discounts for homes in pre-war sub-divisions are not surprising given that they tend to be on average older, smaller, of lower quality and have fewer amenities than those found in modern subdivisions (see Table 3). When 2007 prices are expressed on a per square foot basis, the price differences narrow considerably. Moreover, homes in subdivisions platted prior to 1950 are shown to command substantial price per square foot premiums. The 2007 median price per square foot for pre-1920 vintage subdivisions was 27 per cent higher than that of Tucson’s newest subdivisions, and 1920s and 1930s vintage subdivisions commanded 7.5 per cent and 11 per cent premiums respectively. Conversely, homes in 1950s and 1960s vintage subdivisions sold for the lowest median price per square foot—the discount to modern subdivisions is approximately 12 per cent.
The median price data also demonstrate that rates of appreciation varied widely across subdivision vintages over the course of the 10-year period. Homes in subdivisions recorded prior to 1920 appreciated at the fastest pace, while those in 1920s–1940s vintage subdivisions also experienced relatively strong price growth. Median prices in post-1990 subdivisions increased at the slowest rate. The lack of stronger appreciation may be attributable in part to the high volume of new construction at the urban periphery where these subdivisions tend to be concentrated.
The median price analysis demonstrates that homes in Tucson’s pre-auto-era subdivisions are priced at a substantial discount to those in modern subdivisions, but sell for premiums on a per square foot basis and appreciated at a faster rate than those in newer subdivisions over the study period. This suggests that homes in traditional developments are desirable to home buyers and have become more desirable with time. However, this does not provide direct evidence that home buyers value the design features embodied in traditional subdivisions, as the price dynamics may reflect the desirability of the home’s locational or structural attributes. The hedonic models explicitly control for these factors in order to distinguish more clearly the premiums/discounts attributable to design-related features alone.
5.2 Hedonic Model Results
Summary statistics for each of the hedonic models and the coefficient estimates for the explanatory variables are shown in Table 5. The models explain a large proportion of the variation in housing prices in Tucson as evidenced by adjusted R2s in the 0.90 range and the sigmas indicate reasonably strong predictive accuracy. It is also apparent that the explanatory power of the models diminishes progressively through time. This is likely to reflect growing imbalances in the market as the housing bubble inflated and the increasing noise in the hedonic may be attributable to speculative purchases and panic buying based more on the perceived investment merits of housing as opposed to the underlying use value of the homes themselves.
Results: hedonic models
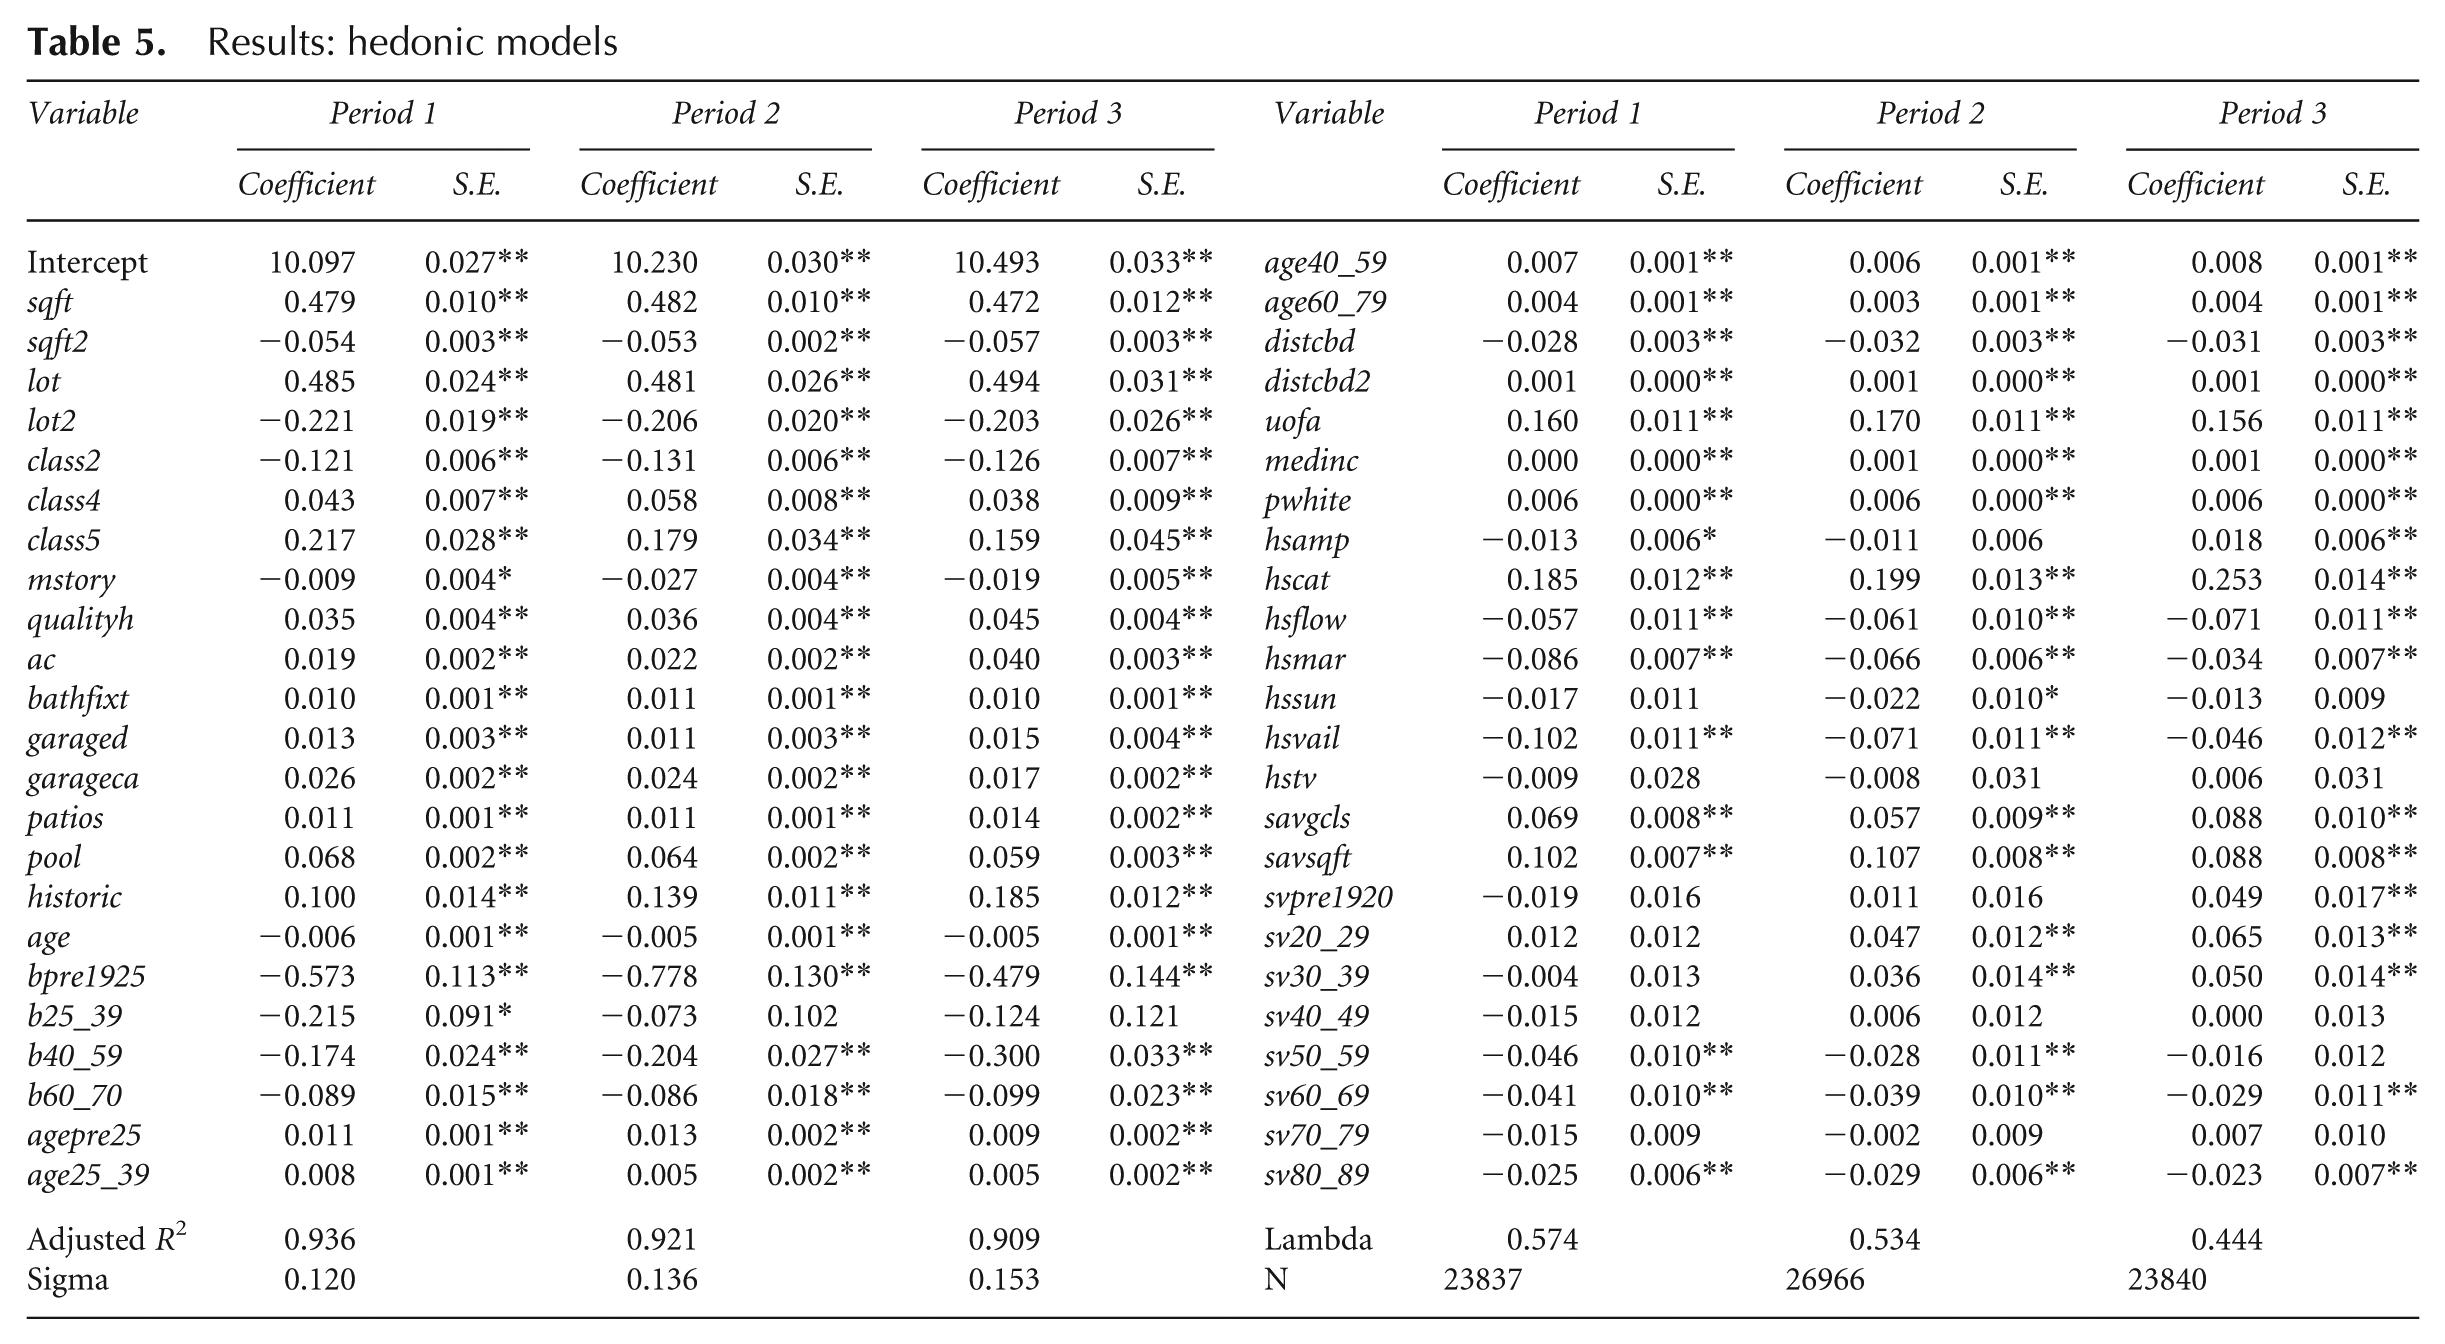
The coefficients for the control variables all have the correct signs and are of plausible magnitudes. 6 With few exceptions, the estimates are significant at the 0.01 level. As expected, greater size, larger lots, higher structural quality and the presence of amenities such as pools and patios increase sale prices, while greater distance to the CBD reduces them, although this effect diminishes with distance. Historical status is particularly valuable to home buyers in Tucson, which may be attributable to its scarcity. The coefficients for the variables measuring the average size and quality of homes within a subdivision are also positive and significant and demonstrate an externality effect, and the coefficients of the age and construction era variables are generally significant, as are the interaction terms between them. This confirms that both aspects are important—and that they jointly influence housing prices. A comparison of the coefficients across the three time-periods reveals that the marginal implicit prices for the majority of the variables are fairly stable although several parameters do exhibit substantial changes. For example, the coefficients for ‘historic’ and ‘SDCAT’ increased markedly, indicating growing premiums for homes located within historical districts and the Catalina school district, which is generally considered to be the area’s strongest and is situated within the highly desirable Foothills neighbourhood.
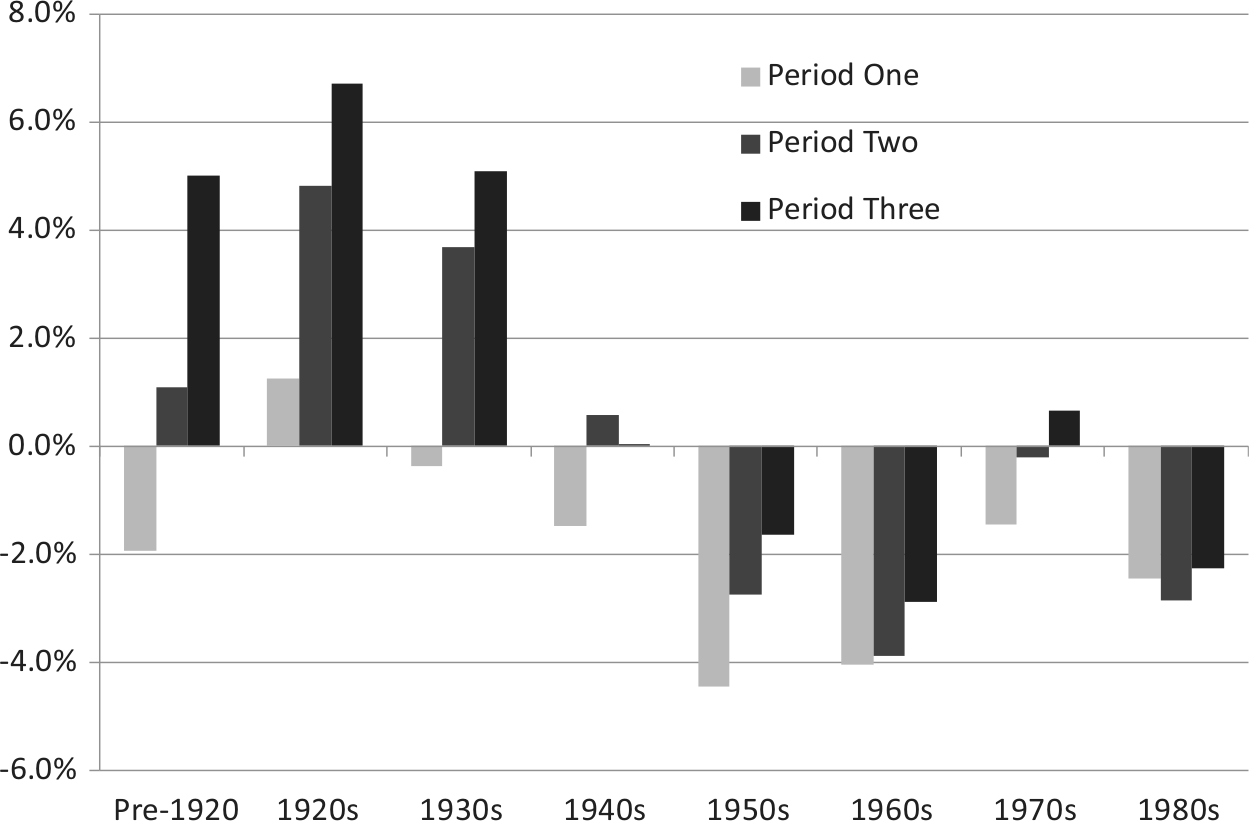
The regression coefficients for the sub-division vintage variables, shown last, are of primary interest. To the extent that the explanatory variables adequately control for differences in structural and locational characteristics of the homes, they capture the price influence attributable to the design features shared by subdivisions of a given vintage, and can be interpreted as the approximate percentage difference in price between homes in a given vintage compared with those in post-1990 vintage sub-divisions, the category withheld from the models. Figure 3 shows the exact percentage difference in price by vintage and period, which is calculated using the formula εβi − 1, where βi is the relevant coefficient estimate.
Price premium (discount) by subdivision vintage and period.
The coefficients for the subdivision vintage variables are statistically significant in most cases, indicating that subdivision design-related features do impact home prices. The estimates from model 3, which represents the final period of the analysis, confirm that home buyers in Tucson value the features embodied in ‘traditional’ developments platted prior to 1940. These subdivisions are more compact than their modern counterparts and were designed with walkability and connectivity in mind as walking and street cars represented the dominant forms of intraurban mobility during this era. Holding other factors constant, homes in subdivisions recorded prior to 1940 command statistically significant price premiums of 5–7 per cent over those in subdivisions platted since 1990.
Conversely, the design features associated with the early auto-oriented subdivisions recorded during the 1950s and 1960s are found to be the least desirable and require discounts of approximately 2–3 per cent relative to modern subdivisions. These subdivisions were often hastily designed and platted to accommodate Tucson’s rapid post-war growth and lacked the attention to planning exhibited in those platted during subsequent decades. The coefficient for 1940s vintage subdivisions, which represent a transitional phase between traditional and auto-oriented development, is not statistically different from zero.
The results clearly demonstrate that traditionally designed subdivisions command pricing premiums in Tucson. A comparison of the subdivision vintage coefficients across the three time-periods also reveals that the premiums for traditional neighbourhoods are of relatively recent origin as the estimates were not statistically significant at the 0.05 level during the first period and were actually negative for pre-1920 and 1930s vintage subdivisions. The coefficients increased during each of the two subsequent periods, indicating that homes in pre-war subdivisions were appreciating in value relative to those in modern sub-divisions. The differences in the coefficient estimates between the first and last period are statistically significant for all three of the pre-war subdivision vintages, as the 95 per cent confidence intervals constructed from the standard errors are non-overlapping. The coefficients for the 1940s–1970s vintage variables also increased slightly during the study period, but the magnitude of these changes is much smaller and the differences are not statistically significant.
Increasing relative prices for an attribute suggest an excess of demand over supply. Thus the growing premiums for pre-war subdivisions provide evidence that demand for the features embodied in more traditional forms of development has grown in Tucson, as the supply of homes in these subdivisions is essentially fixed. While this result could also reflect an oversupply of new construction near the periphery where post-1990 subdivisions are concentrated, the fact that the majority of the premiums arose during the second period suggests that this was not an overriding factor.
6. Conclusions
The present study has sought to enhance our understanding of the market context for TND and New Urbanism by studying the market for traditional development itself, which these movements strive to emulate. The hedonic results clearly demonstrate that home buyers in Tucson value the design features embodied in traditional development more highly than those associated with conventionally designed post-war sub-divisions. More specifically, homes within subdivisions platted prior to World War II were found to command prices premiums of approximately 5–7 per cent over those located in post-1990 vintage subdivisions, after controlling for the structural and locational attributes of the homes. Moreover, the premiums for pre-auto-era subdivisions grew substantially over the course of the 10-year study period, which suggests that demand for traditional design features has grown in Tucson.
Conversely, modern subdivision designs, which are more inward-looking and less well connected to surrounding land uses, but highly planned and incorporate more internal amenities for residents, command higher prices than subdivisions recorded in Tucson during the 1950s and 1960s. This suggests that the enhancements made to the auto-oriented subdivision designs in recent decades have made them more attractive to home buyers.
The results should be encouraging to the proponents of TND and developers interested in building ‘traditional’ neighourhoods. The significant and growing premiums for homes in traditionally designed subdivisions suggest that a market niche for TND may exist even in a sprawling south-western MSA such as Tucson. However, the present research does not provide conclusive evidence to support this argument—as the premiums associated with subdivision vintage may be conditional upon attributes of the broader neighbourhood as well. For example, homes in a small subdivision designed with traditional features located in a conventional suburban neighbourhood may not command the same premium as one located within the setting of a more ‘traditional’ neighbourhood.
The study period also coincided with an historical housing bubble in Tucson and growing market imbalances could have potentially influenced the estimated premiums during the final period of the analysis. It was not possible to extend this analysis due to changes in the sales data collection process in Pima County. Additional research is needed to confirm that traditional sub-divisions have continued to outperform conventional development during the ensuing housing market bust. Similar studies in other geographical contexts would also help to determine the extent to which the results of this study reflect a broader housing market trend.