
Abstract
Poor urban air quality in China has received global attention. This article analyses the extent to which the urban form of all provincial and prefectural cities in China affects urban air quality. A geographically weighted regression model was used to quantify the relationship between the urban form indices, as well as the satellite-derived pollutant column density of NO2 and SO2. The results show that urban form has a significant effect on the urban air quality in China. The effect of urban form on air quality varies among the cities in this vast region. The compact ratio index is negatively correlated with both NO2 and SO2 column density for most of the cities. An ‘X’- or ‘H’-shaped city has less air pollution than a rhomboid-shaped city when the city is located in northern or central China. In comparison, the fractal dimension index is not a statistically significant predictor of air quality. Urban form can have effects on air quality that are equivalent to some meteorological and socioeconomic factors.
Keywords
Introduction
China has rapidly become urbanised. Urban population has increased by 369 million in the past two decades. The urban gross industrial output in 2010 was 17 times higher than it was in 1990. Meanwhile, the length of urban roads increased from 94.8 thousand kilometres to 294.4 thousand kilometres, and the road surface area increased fourfold. Urban sprawl significantly changes the urban landscape and largely undermines environmental improvement efforts. Urban air pollution in China, which has been globally criticised by political and academic sources (Liu and Diamond, 2005; Hopke et al., 2008; Raupach et al., 2007), has become worse during the last two decades. The amount of sulfur dioxide (SO2) and nitrogen dioxide (NO2) emissions from Chinese cities in 2010 were 1.5 times and 2.5 times their values in 1990, respectively.
It has been argued that urban form can significantly affect urban air quality. Some empirical studies have focused on individual cities by modelling the environmental effects of different urban forms and organisations in various scenarios (Bento et al., 2005; Bandeira et al., 2011; Ewing et al., 2003; Holden and Norland, 2005; Permana et al., 2008). For example, it was revealed that a better satellite location in the Bangkok metropolitan region could reduce the vehicle kilometres travelled (VKT), thereby reducing pollutant emissions by 18%−26% (Dissanayake and Morikawa, 2008). Compact and corridor urban forms were more likely to have lower air pollution compared to sprawling urban forms (Manins et al., 1998; Marshall, 2008; De Ridder et al., 2008; Kahyaoglu-Koracin et al., 2009). Some empirical studies compared the relationship between the urban form of cities and urban air quality. For instance, Bechle et al. observed that cities with contiguous built-up areas tend to have lower urban NO2 concentrations (Bechle et al., 2011). Clark et al. (2011) investigated 111 U.S. urban areas and suggested that population centrality was associated with lower population-weighted ozone and PM2.5. Stone Jr, (2008) surveyed 45 metropolitan regions in the U.S. and concluded that the average number of high ozone days per year was approximately 62% higher in sprawling cities than in compact cities. Bereitschaft (2011) examined 86 metropolitan and 19 megapolitan areas and found that ‘sprawl-like’ urban forms (i.e., lower residential density, lower street network connectivity, less contiguous urban development) generally had higher non-point source pollutant emissions, but these emissions were unrelated to the air quality. Recently, some empirical studies have examined the effect of urban fabric (such as frontal area density, building orientation and building height) on local meteorology and air quality (Edussuriya et al., 2011; Hang et al., 2009; Taseiko et al., 2009).
The relationship between urban form and urban air quality has attracted attention from many urban planners and environmentalists. While most empirical studies on urban areas have concentrated on metropolitan areas in developed countries, the urbanisation in rapidly transitioning countries may have a more profound effect on the urban air environment and deserves more attention. This article aims to explore the correlation between urban form and urban air quality in China, which is a typical developing and transitioning country. Although most previous research has focused on revealing the relationship between urban form and air quality of only one city, the object of this article is to understand the complex relationship between urban form and air quality of a large number of cities. Geographically weighted regression (GWR) analysis was applied to test the statistical significance between the metrics of urban form and the SO2 and NO2 column density for 287 Chinese cities. The methods for measuring urban form and processing urban air quality data are introduced below. Some key meteorological and socioeconomic factors are also included in the GWR model. The results and some key findings are then discussed.
Methods
Urban form index
The Chinese classification of cities is based on administrative jurisdiction. In 2008, there were four provincial-level municipalities, 283 prefecture-level cities, two special administrative regions (Hong Kong and Macau) and 370 county-level cities in China. In this article, 287 cities, including the four provincial-level cities and the 283 prefecture-level cities, were considered. The county-level cities were ignored because their population is much smaller than the others, and their air quality is more influenced by larger-scale regional development. The two special administrative regions were excluded because of their unique political conditions and socioeconomic development trajectories.
Urban form is defined as the spatial format of urban built-up areas rather than that of the overall administrative territory. Vector maps of urban form were drawn by human-computer interactive interpretation of remote sensing images from LandsatTM and China–Brazil Earth Resources Satellite Images (CBERS) with a spatial scale of 1:100,000. Rivers less than 1 kilometre in width running through cities were processed as constructed urban areas. Rivers greater than 1 kilometre in width were excluded from the analysis, and the urban form index for these cities was calculated as the mean of the two resulting subareas of the city. These cities include Wuhan, Chongqing and Nanjing.
Several indices have been developed to quantify the morphological characteristics of a city. Three typical indices, i.e., the compact ratio index, the fractal dimension index and the Boyce-Clark shape index, were applied in this study.
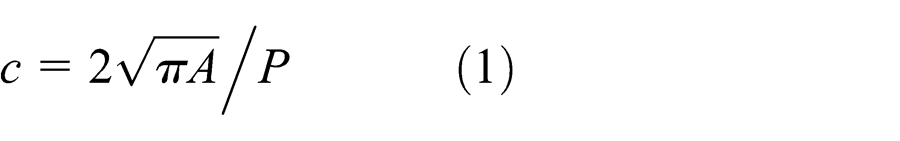
where A is the urban area and P is the urban perimeter. The compact ratio index, c, increases as a city becomes more compact. This calculation takes the circular case as a reference, which is the most compact form. The compact ratio index of a circular city has a value of 1, and lower compact ratio values indicate a more sprawling spatial layout.
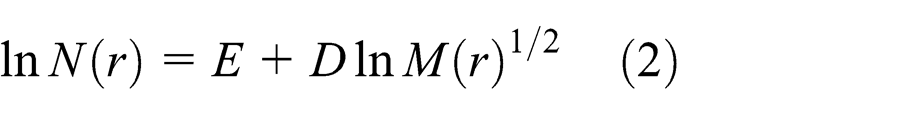
where E is a constant, D is the fractal dimension of the urban area, N(r) is the number of grid cells covering the urban boundary, and M(r) is the number of grid cells covering the urban area. Higher values of the fractal dimension index indicate more complex urban boundaries. In this article, 17 grid sizes were used to cover each urban area. The length and width of grid cells ranged from 100 m to 900 m in increments of 50 m. The fractal dimension index of each city was calculated based on all 17 pairs of lnN(r) and lnM(r)1/2.
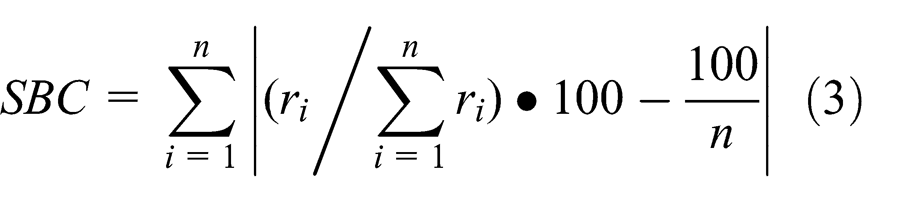
where SBC is the Boyce-Clark shape index, ri is the radius from the urban centroid to the urban boundary, and n is the number of equally spaced radials. For this article, 32 equally spaced radials were computed for each city, and the angle of each adjacent radius was 11.25 degrees.
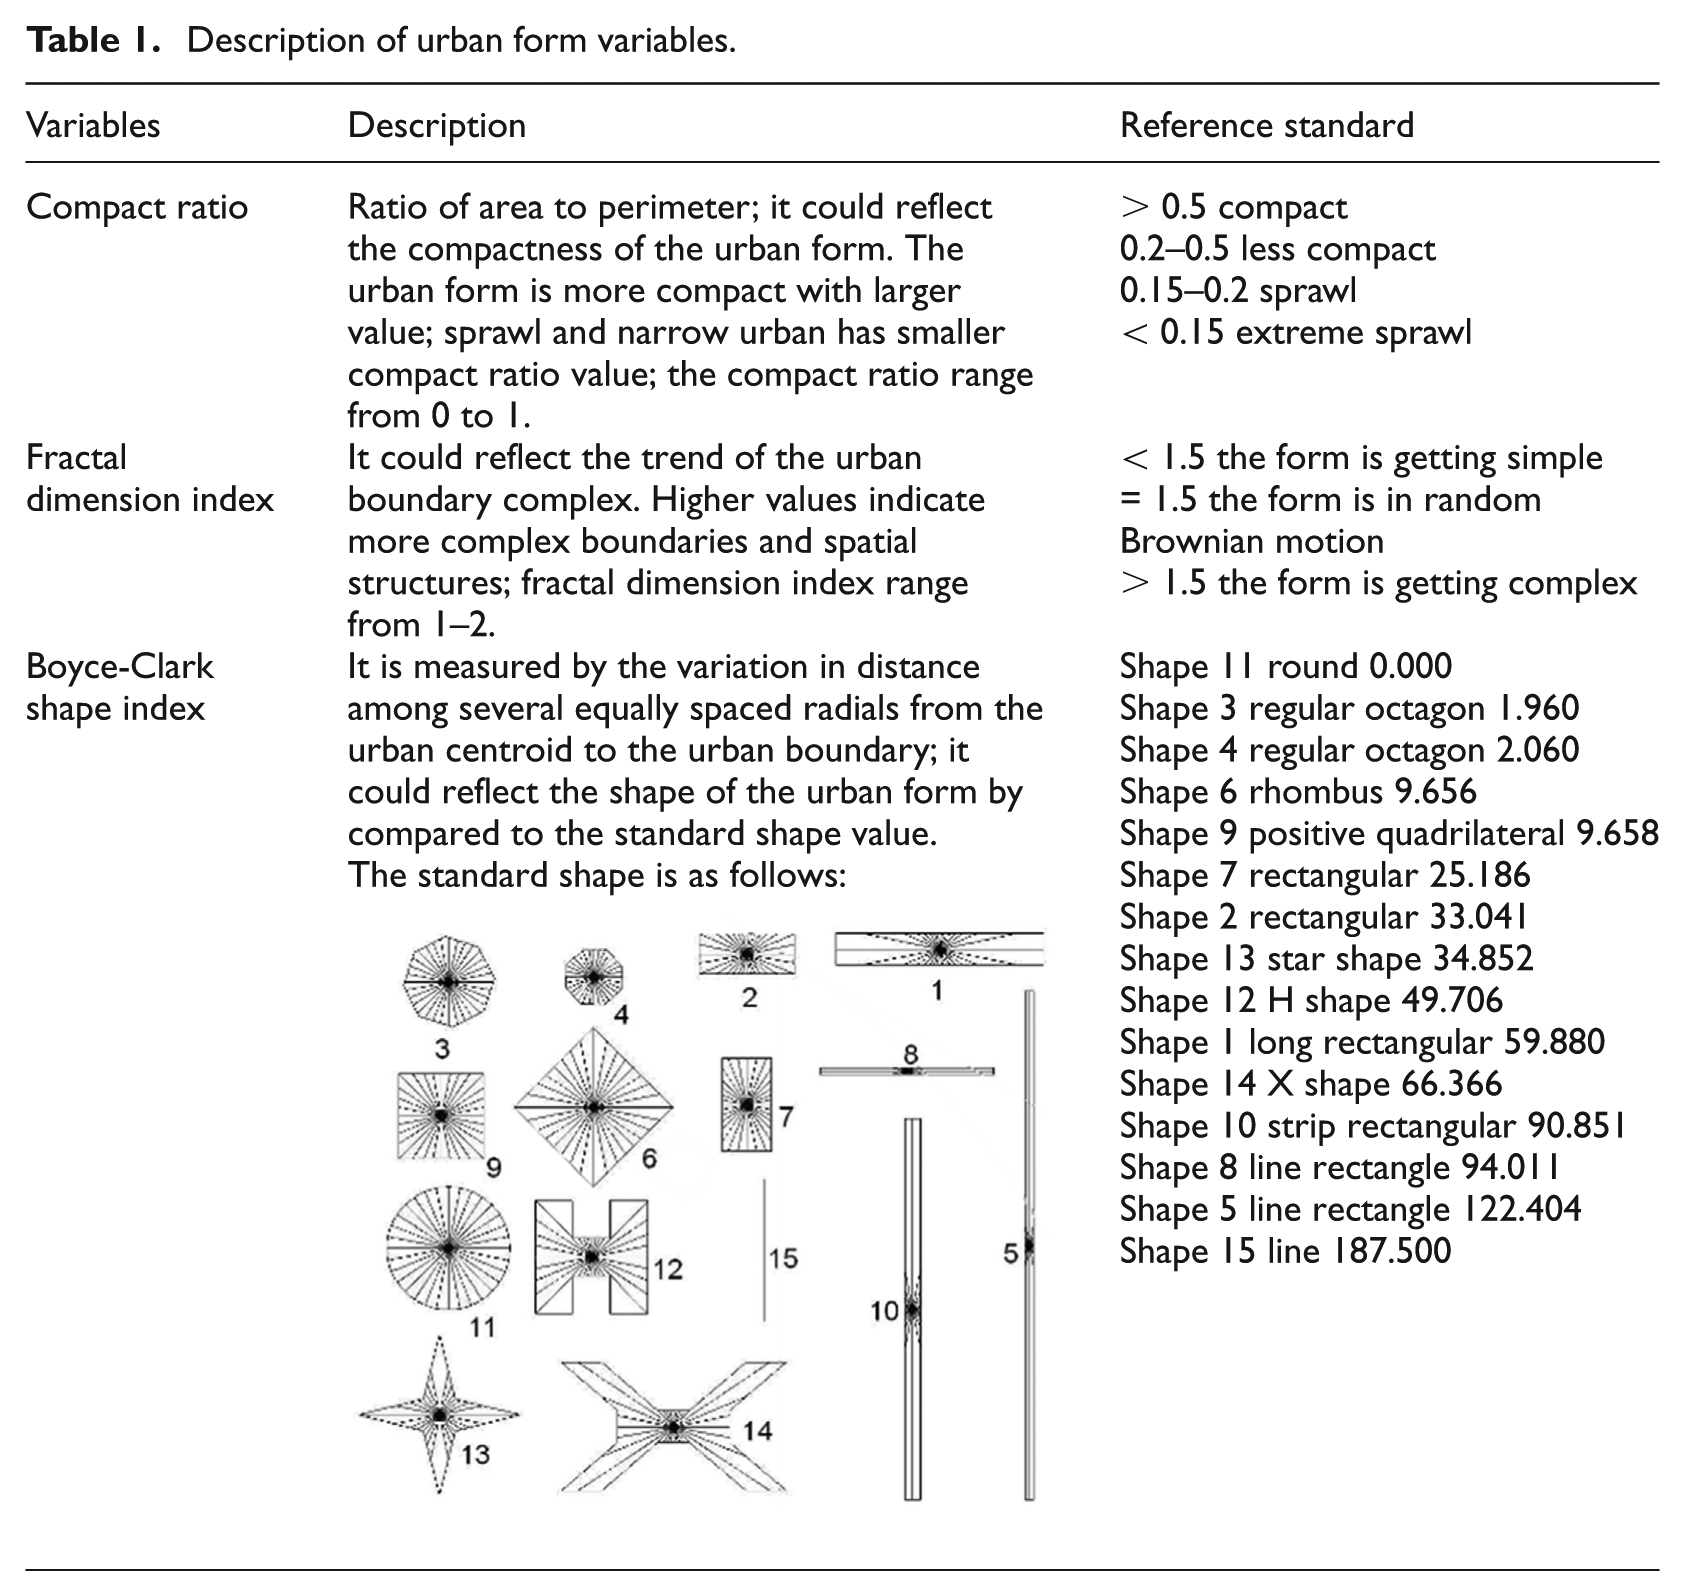
Each urban form index in this article represented one particular feature of the urban form. The compact ratio reflected the compactness of the urban area. The fractal dimension index showed the irregularity of the urban boundary. The Boyce-Clark shape index indicated the urban built-up area shape by comparing the Boyce-Clark shape value with the standard graphics shown in Table 1.
Description of urban form variables.
Urban air quality indicators
NO2 and SO2 were selected as urban air quality indicators because the two key urban atmospheric pollutants are required to be monitored and controlled for all Chinese cities. The pollutant data were acquired by interpretation of environmental remote sensing satellites. The reason we used the satellite data instead of in-situ monitoring data was because more than 200 cities were analysed by satellites, whereas the Chinese government only has the air monitoring data of 120 main cities, which was insufficient for analysis in this study.
Pollutant column density data were extracted from the Air Quality Monitoring and Forecasting in China (AMFIC) project, which addressed atmospheric environmental monitoring over China by satellites and used in-situ air quality measurements and models to generate consistent air quality information over all of China. The SO2 data in the study were the annual SO2 troposphere column means from the SCIAMACHY DIOS V1.0.3, with 0.25*0.25 degree resolution in 2007. The NO2 data were the annual NO2 troposphere column means from SCIAMACHY TM4, with 1*1 degree resolution in 2008. The SO2 column density data were obtained in 2007, different from the NO2 column density data, because it was the latest SO2 data available from the AMFIC. There was little difference between the SO2 in 2007 and in 2008 in a comparison of the monitoring data of nearly 100 cities. Therefore, the SO2 in 2007 could be used as an alternative. The urban air quality was thereafter calculated as the arithmetic mean value of the pollutant grids covered by the vectored urban area of each city. Eighty-seven cities were excluded from the 287 cities, either because their built-up areas were too small to match the resolution of SO2 data or because the cities were in spatial neighbourhood relationships covered by the same concentration raster, leading to coarser resolution of the concentration.
Developing the relationship between urban forms and urban air quality
The dynamics of the urban air environment are complicated, and the effect of the urban form may be an important factor for understanding these dynamics. Air pollution is a regional problem, and the spatial autocorrelation, which is significant in vast China, could not be solved in traditional linear regression. Therefore, the geographically weighted regression (GWR) was used to detect the impacts of the urban form on the air quality. The GWR model contributes to the modelling of spatially heterogeneous processes. GWR extends the linear regression model by allowing local rather than global parameters to be estimated (Fotheringham et al., 1998). In essence, it is a least multiple method using the local weight based on the spatial location matrix, with the weight representing the distance between the estimated point location and the observed location. The GWR model was expressed as the following formula:
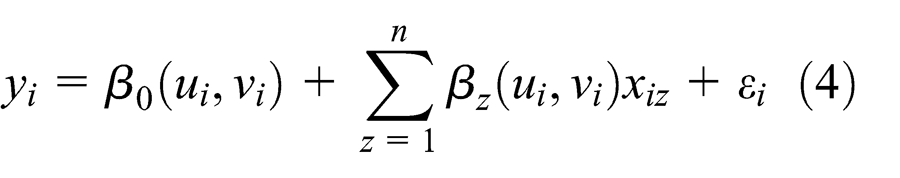
where yi denotes the dependent variable, in this case, the total column density of SO2 and NO2 at location i, β0(ui,vi) denotes the intercept coefficient at location i, xiz is the value of the zth explanatory variable at location i, and βz(ui,vi) is the location regression coefficient for the zth explanatory variable. Furthermore, (ui,vi) denotes Cartesian x and y point coordinates and εi is the random location specific error term. When GWR was used, the parameters were estimated by solving:
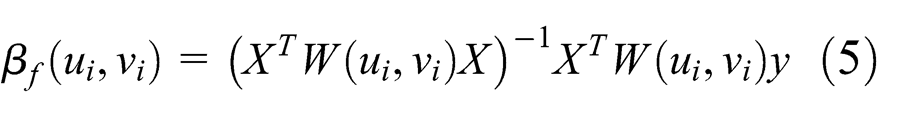
where βf(ui,vi) is the estimate of the location-specific parameter, W(ui,vi) is an n by n spatial weight matrix whose off-diagonal elements are zero, and the diagonal elements denote the geographical weights of observed data at location i. The geographic weight structure (ui,vi) is based on a Gaussian Kernel function such that the influence of data points in the proximity of i is given larger weights in the estimation. To improve the computational efficiency, an adaptive bi-square function was selected to calculate the weight between cities instead of a Gaussian function. The formula is as follows:
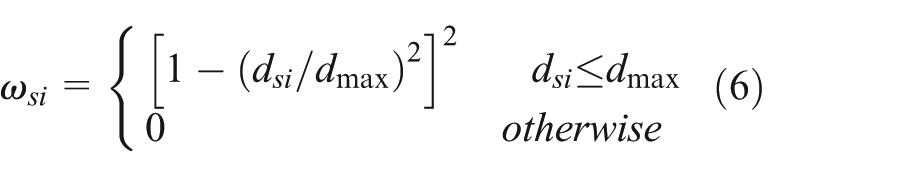
where dmax is the maximum distance from the ith farthest city to the regression city (i is the selected optimal neighbouring city).
These factors must meet the criteria of AIC minimisation, in which the optimal number of nearest neighbours was determined through selecting the model with the lowest Akaike Information Criterion (AIC) score (Hurvich et al., 1998), given as:
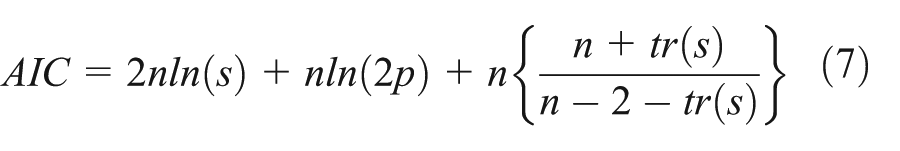
Here, tr(s) is the trace of the hat matrix. Lastly, pseudo t tests were selected to check the significance of estimated local parameters (Fotheringham et al., 2002).
The meteorological and socioeconomic factors were proven to have strong theoretical or empirical ties to urban air quality (Hofmann et al., 2009; Jacob and Winner, 2009; Giorgi and Meleux, 2007). The meteorological factors including precipitation, temperature, atmospheric pressure and relative humidity were analysed in this study. Topography was selected as a typical air quality influencing factor because topography influences atmospheric flows and correlated with elevation and wind speed. Socioeconomic indicators were also included in the GWR analysis. Population density, reflecting both the population aggregation and density of human activities, has been shown to be an important factor for urban air quality (Clark et al., 2011). The per capita GDP, an indicator of urban development, is regarded as an important factor in determining urban air quality (Stern and Common, 2001; Carson et al., 1997; Bechle et al., 2011). The GDP per square kilometre could reflect the economic activity intensity (Bereitschaft, 2011). Economic activity intensity directly affects the air pollutant concentration. The urban scale, represented by the population, also affects urban air quality.
The meteorological data were extracted from 194 national benchmark meteorological stations of the China Meteorological Administration System. The meteorological data were from 2008. To obtain a spatially continuous meteorological configuration of Chinese cities, the data were spatially interpolated to generate data series between the 194 monitoring stations (cf. SM for details). The meteorological data used for each city were the arithmetic means of the grid values corresponding to the urban area. The elevation data corresponded to a 90 m grid size and were extracted from the Resource and Environment Science Data Center in the Chinese Academy of Sciences. The elevation of each city was calculated as the arithmetic mean of the elevations in the urban grid cells. The degree of land surface relief was calculated based on the elevation data using the method found in the literature (Feng et al., 2007). The socioeconomic data were extracted from the China City Statistical Yearbook 2009 and the China Urban Construction Yearbook 2009.
Results
The configuration of urban forms in China
The urban forms of China’s 287 cities varied significantly. The maximum compact ratio index was only 0.6 (e.g., Dongguan, Shenzhen and Beijing), and the minimum compact ratio index was 0.07 (e.g., Tianshui and Jiayuguan). The interquartile range was 0.22–0.34, as the compact ratio index of 97% of the cities was below 0.5.
The calculation of the urban fractal dimension implies irregular and sometimes fragmented urban boundaries, although there was moderate variation in the index values. The lowest fractal dimension was 1.06 (e.g., Jingchang, Kelamayi and Tianshui). The highest fractal dimension was 1.39 (e.g., Shiyan and Xianning).
Significant variation in the shape index among cities suggests a diversity of urban forms in China: approximately 40% of the cities showed a rhombus or rhomboid form (e.g., Beijing, Shanghai, Chengdu and Nanjing); 25% of cities were approximately rectangular (e.g., Datong, Shuangyashan and Daqing); 20% of the cities were shaped like an ‘H’ (e.g., Guangzhou, Wuhan and Changsha); and 15% of the cities were shaped like an ‘X’ or had a constellation form (e.g., Qingdao, Wenzhou and Zhoushan).
Spatial features of the urban air quality
The urban air quality differed significantly among Chinese cities. The highest pollution column density occurred in most economically developed regions, including the Yangtze River delta, the Pearl River delta and the Capital economic zone, and some metropolitan areas in middle-east China, as shown in Figure 1. The city with the most NO2 pollution was Shanghai, which is also the most developed city in China. The number of automobiles in Shanghai increased 12-fold during the past two decades, and most of the NO2 comes from automobile emissions. The most SO2-polluted city was Tianjin, which is a well-known industrial city in northern China. The pollution column density of NO2 and SO2 in the worst city were 60 times and 145 times those of the cleanest city, respectively. The average column densities of NO2 and SO2 in metropolitan areas were 1.84 times and 1.29 times those of other cities, respectively.
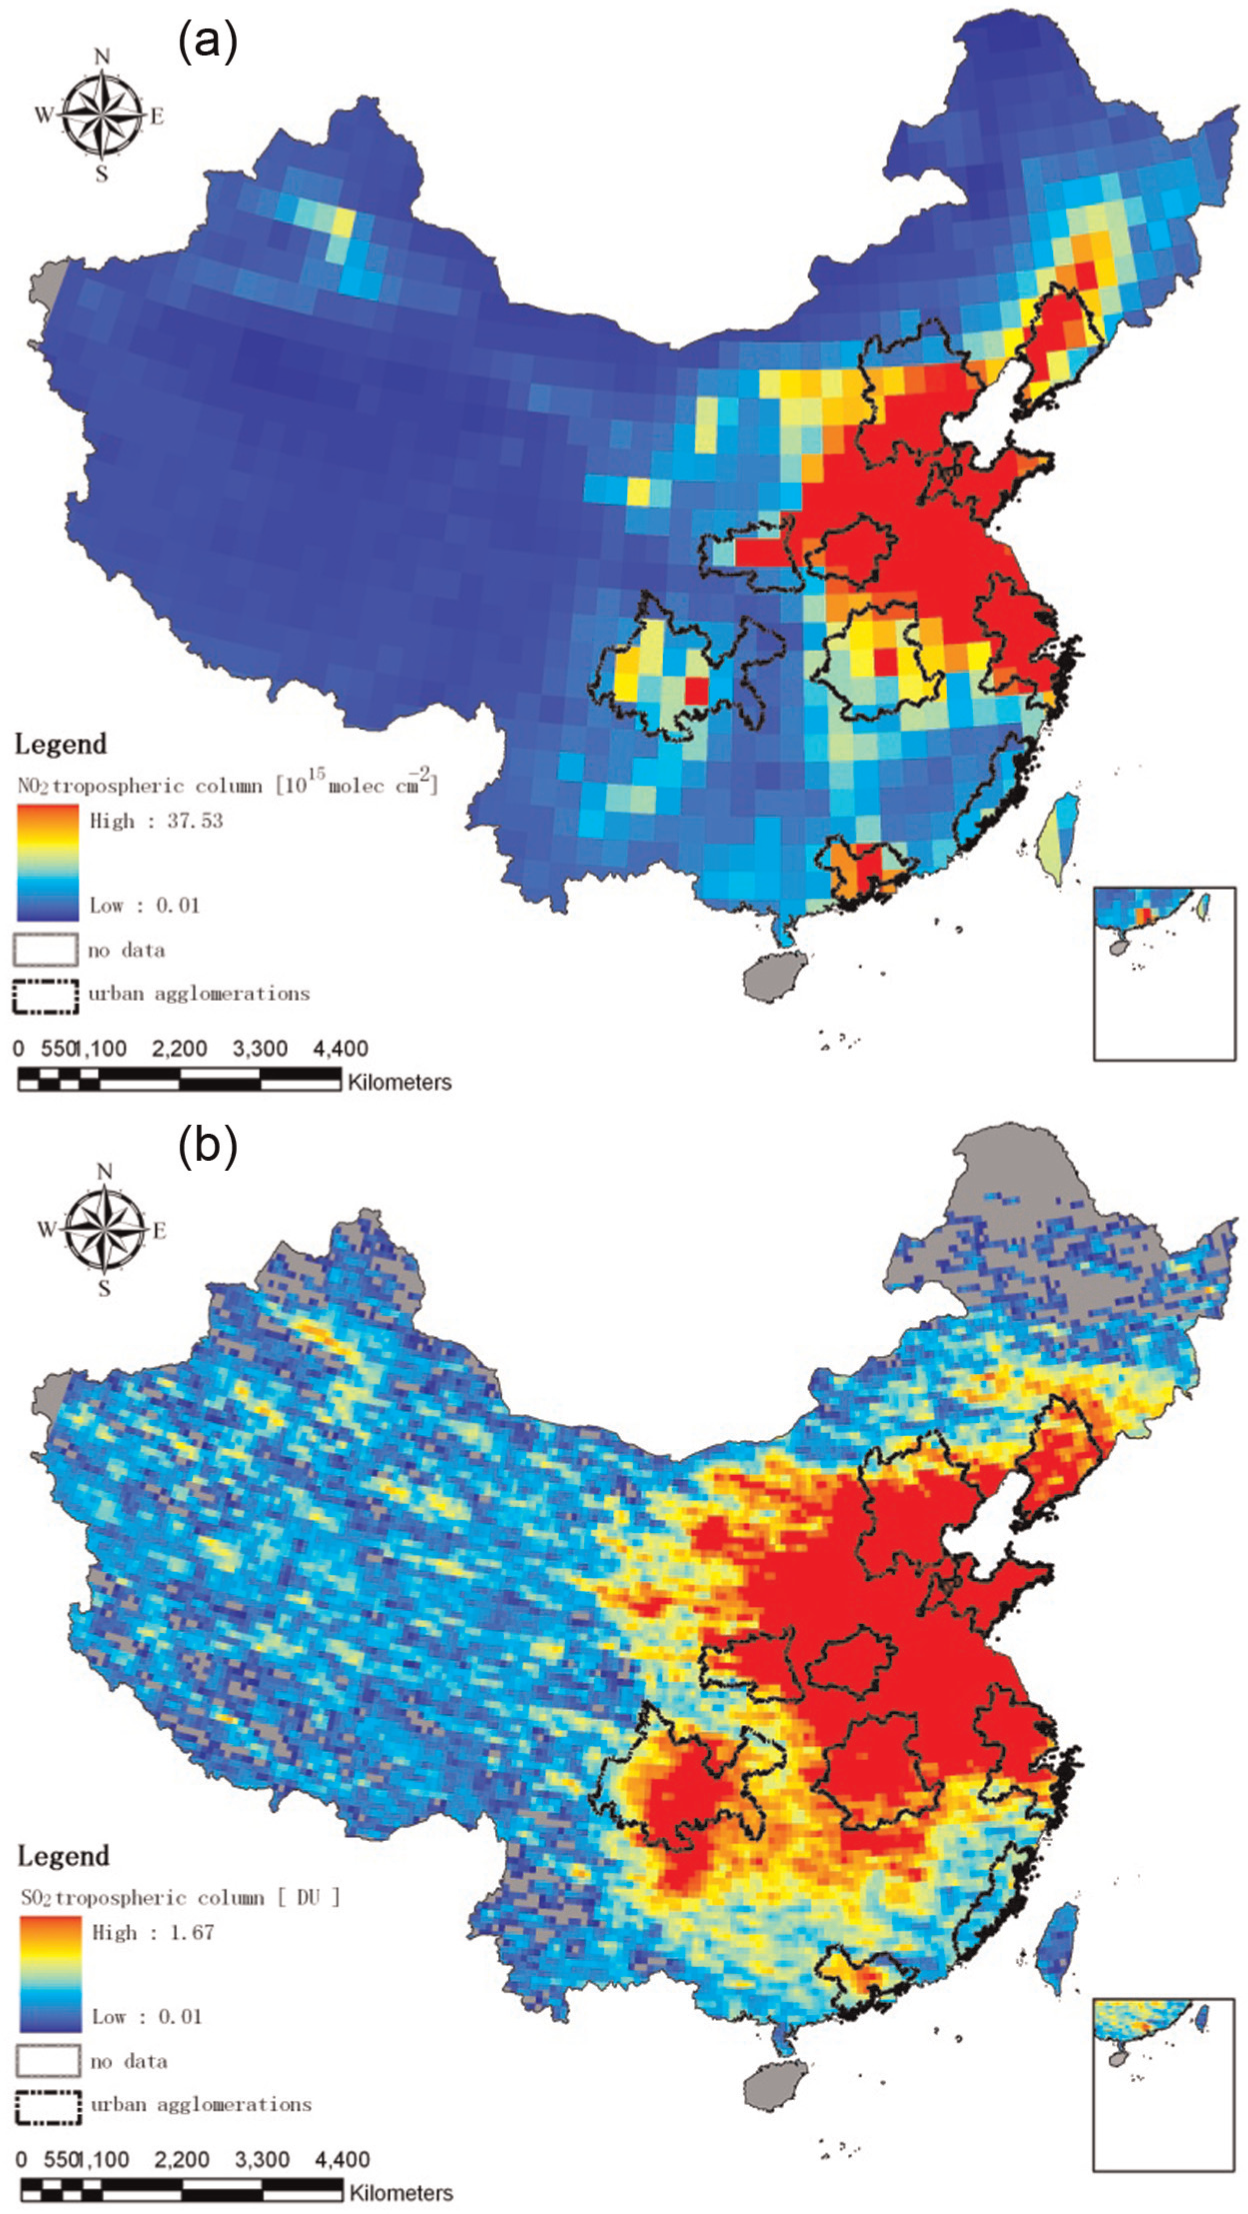
The NO2 (a) and SO2 (b) column density in China urban areas.
A correlation analysis found that larger cities had higher NO2 and SO2 pollution (cf. Table 2). More intensified economic activities, as measured by the industrial output per square kilometre, led to lower air quality. Meanwhile, more developed cities, as measured by per capita GDP, often had more serious NO2 pollution. Significant positive correlation was found between the economic activity density and the urban NO2 and SO2 column density. The urban air quality was also related to meteorological conditions. In particular, the NO2 and SO2 pollution levels were less severe in cities with more rainfall and more severe in cities with less land surface relief.
Relationship between urban features and urban air quality.
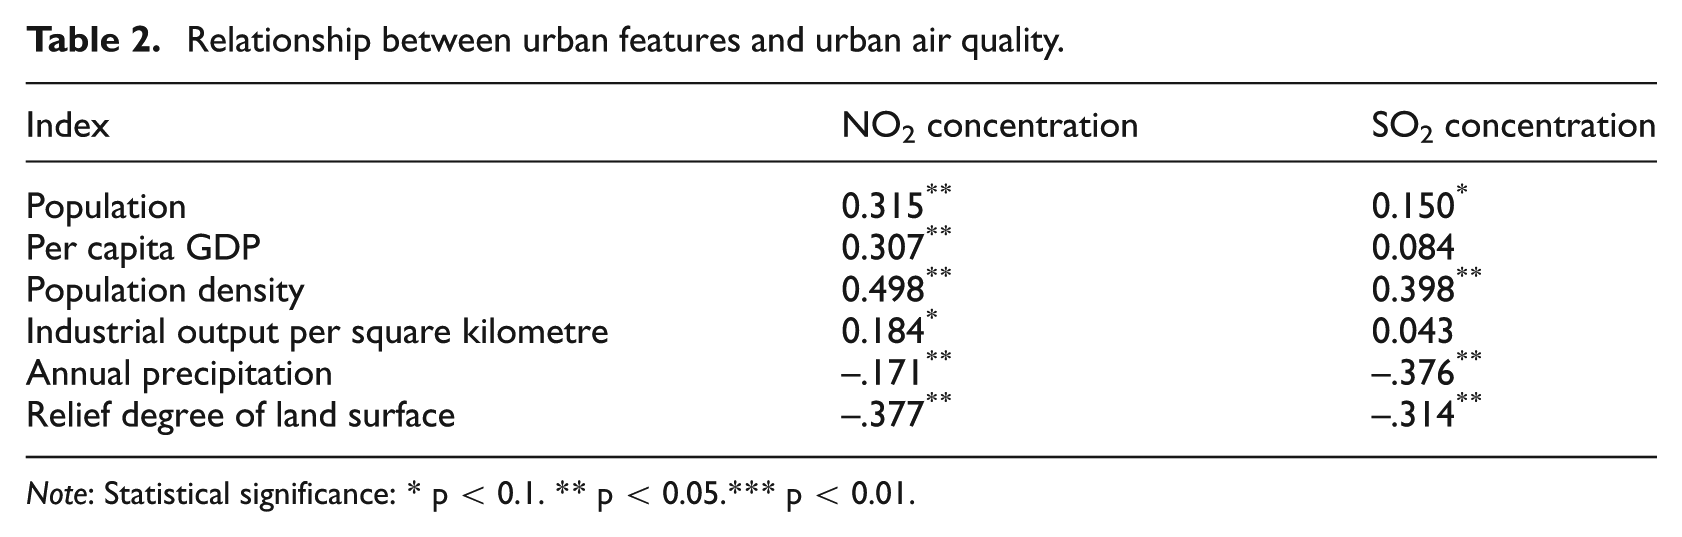
Note: Statistical significance: * p < 0.1. ** p < 0.05.*** p < 0.01.
Correlations between urban form and urban air quality
The correlation analysis indicated that urban form was closely associated with the average column density of NO2 and SO2 (cf. Table 3). The correlation coefficient between the compact ratio index and the NO2 and SO2 column density showed that the air quality was better in more compact cities. The NO2 column density of the most extensive city was three times higher than that of the most compact city, whereas the SO2 column density was nearly two times higher in the most extensive city (see Figure 2). Therefore, it could be inferred that urban sprawl had a negative impact on urban air quality. The data showed that compact cites had lower pollution, and this was probably because a more compact urban layout may improve industrial efficiency and reduce the amount of traffic. In urban China, most of the NO2 originates from industrial production and urban transportation (Zhang, 2007). Some empirical studies showed that when industrial enterprises are located together as an agglomeration (Acs et al., 2009), they may be able to obtain pollution treatment technologies at a lower cost than factories scattered throughout the cities (Porter, 2000; Porter, 1998; Krugman, 1991). The aggregated factories would also facilitate the construction of environmental facilities. Meanwhile, a compact urban form may reduce urban traffic because the availability of public transportation may reduce the number of kilometres travelled by vehicles.
Relationship between urban form and urban air pollution.
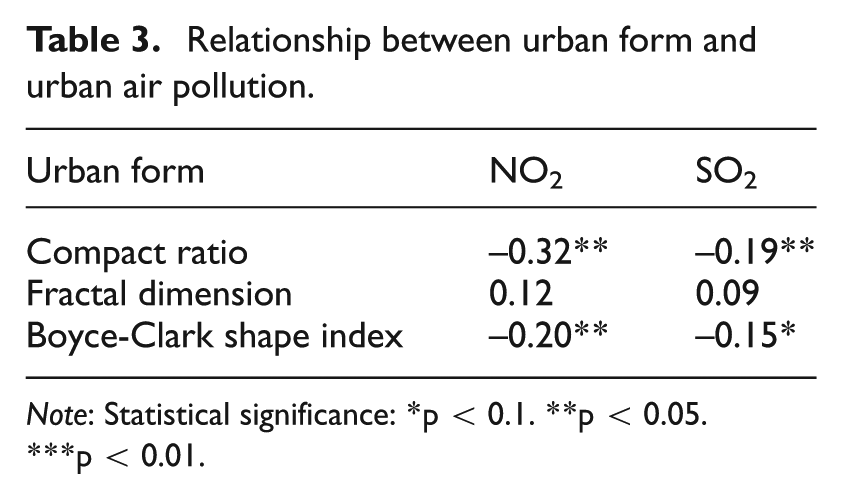
Note: Statistical significance: *p < 0.1. **p < 0.05. ***p < 0.01.
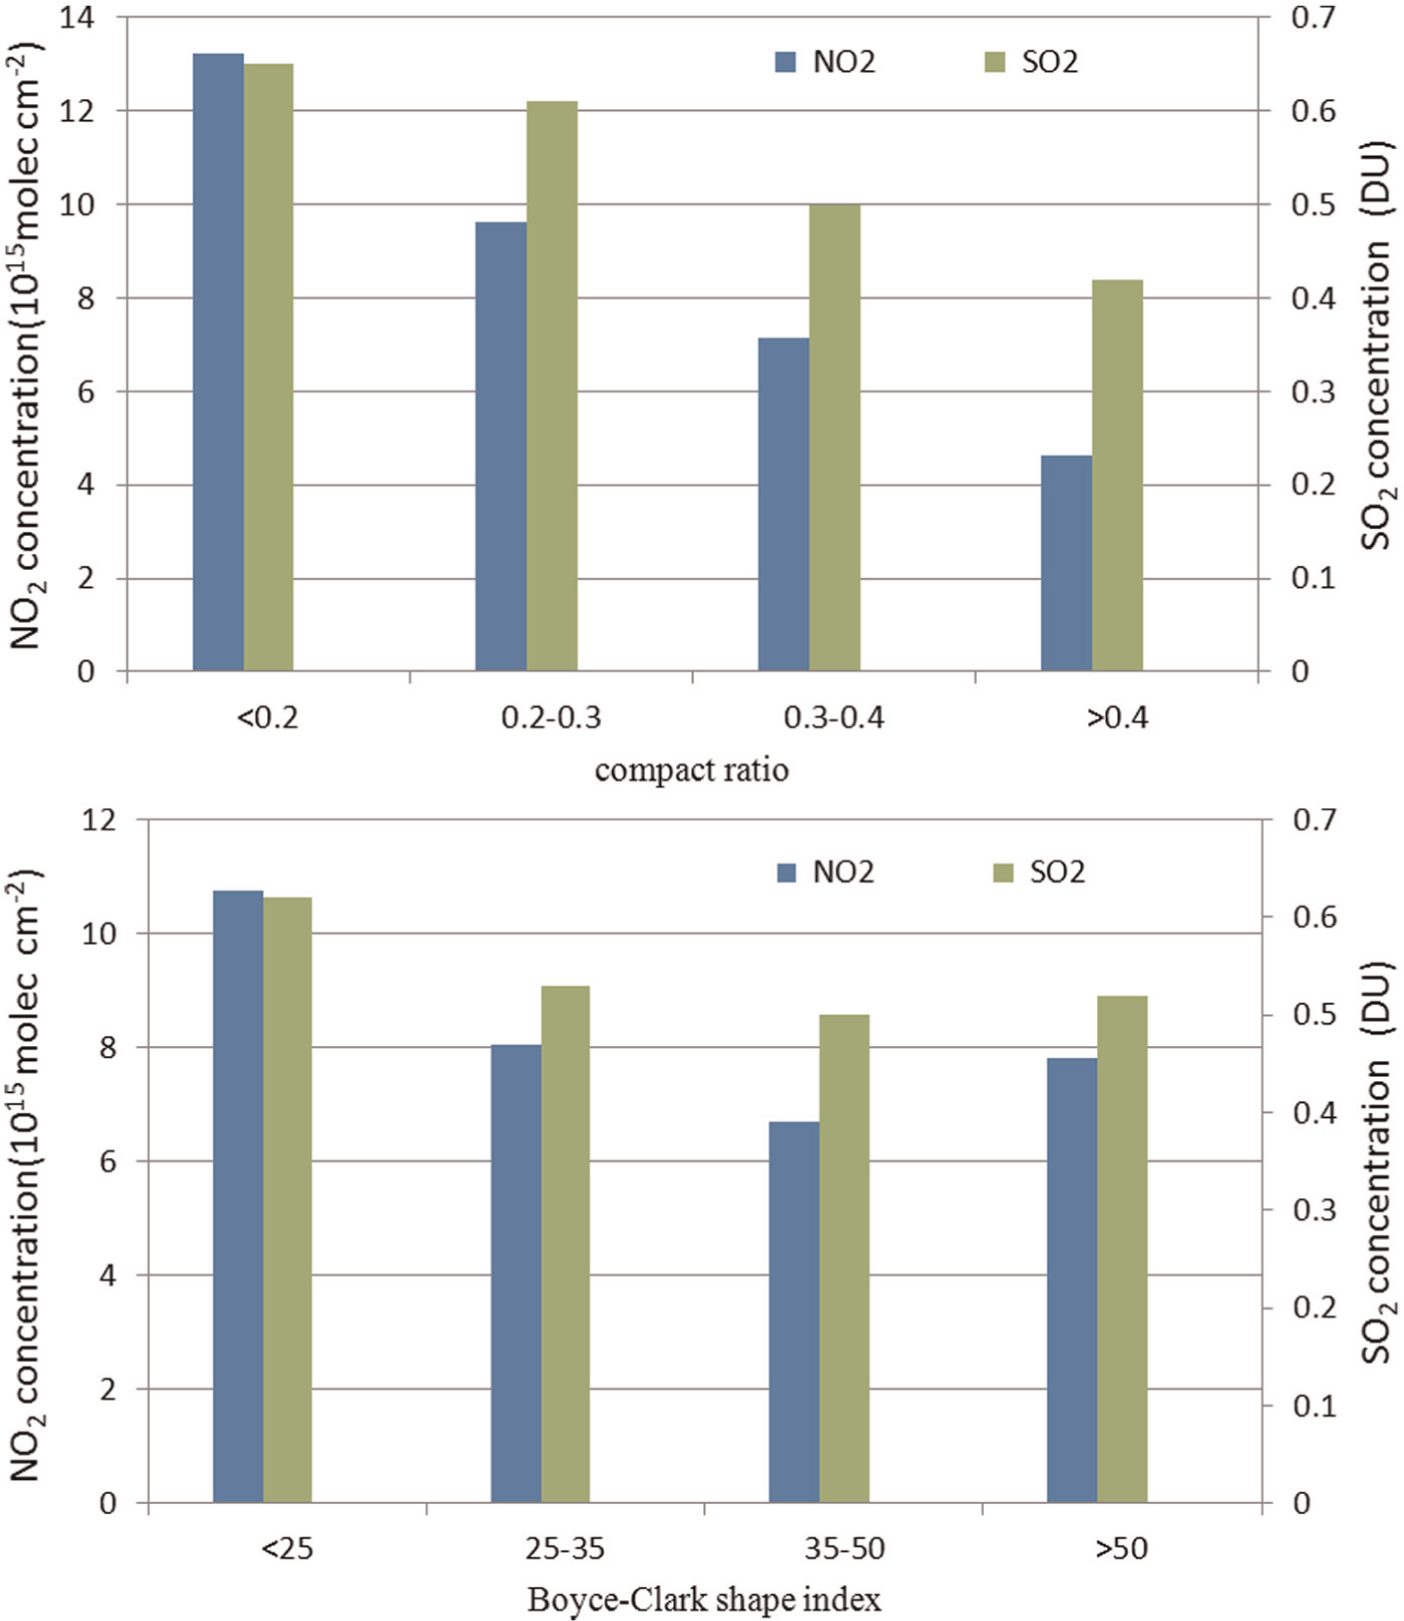
Average air pollutant column density in different urban forms.
There was no apparent relationship between air pollution and the fractal dimension, possibly because the urban boundaries had no significant impact on the pollutant emission sources or meteorological conditions. Therefore, the fractal dimension index is not relevant to China’s urban air quality.
The results suggest that ‘H’- or ‘X’-shaped cities had much lower atmospheric pollution than rhomboid-shaped cities, with average NO2 and SO2 column density in the ‘X’-shaped cities that were 60% and 80% lower than those in the rhomboid cities, respectively (see Figure 2). This was probably because transportation was the main NO2 emission source in urban areas, and the negative relationship between the Boyce-Clark shape index and the NO2 column density may be a result of differences in transportation organisation in cites with different shapes (He et al., 2002). The ‘H’- and ‘X’- shaped cities usually had more than one urban centre. Research has shown that the polycentric urban form could reduce commuting distance and lead to less automobile pollution in the polycentric cities than in monocentric cities (Loo and Chow, 2011; Gordon et al., 1986).
The Moran’s I, a statistic designed for the measurement of spatial autocorrelation, could test the significant spatial autocorrelations of the NO2 and SO2 column density. The Moran’s I values of the NO2 and SO2 column density were 0.66 and 0.92, respectively. Neither the population density nor the per capita GDP of the socioeconomic factors were considered in the analysis to avoid collinearity according to the correlation analysis result. The relief degree of land surface factor was excluded for the same reason. The fractal dimension index was not used in the GWR analysis because there was no apparent relationship between air pollution and the fractal dimension. Therefore, the compact ratio, the Boyce-Clark shape index, the population, the industrial output per square kilometres and the precipitation were used in the GWR model. The results showed that the GWR model performed better than the global regression model. In the global regression model of NO2, the AIC was 529.88, and in the GWR model, the AIC converged to 338.58. The adjusted R2 of NO2 was 0.75 in the GWR model, which was higher than the global regression model (0.31). In the global regression model of SO2, the AIC was 515.83, and in the GWR model, the AIC converged to 302.22. The adjusted R2 of the SO2 rose from 0.30 in the global regression model to 0.77 in the GWR model.
For most of the cities, both the NO2 column density and the SO2 column density decreased with more compact urban form. On average, one unit increase of the compact ratio led to a decrease of 20.56 and 0.54 of the NO2 and SO2 column density, respectively. The NO2 and SO2 column density increased with greater economic activity, but this increase could be compensated by a more compact urban development (see Table 4 and Table 5). The effect of the compact ratio on NO2 was largest in northern and central China, and this may be because the compact urban layout led to less urban traffic and a high efficiency utility of energy than the sprawling cities. The effect of the compact ratio on SO2 was largest in northeast China, and we speculate that the aggregated heavy industries achieved high efficiency of energy utility because of a compact urban layout. The result of a small number of cities in southwest China was different from most of the cities, and the air quality of these cities became worse with higher compact ratios. The reason may be that the built-up areas of these cities grew along the valleys, and the scatted urban built-up areas helped the pollutants to disperse in the mountainous terrain (see Figure 3).
Geographically weighted regressions coefficients of NO2 column density.
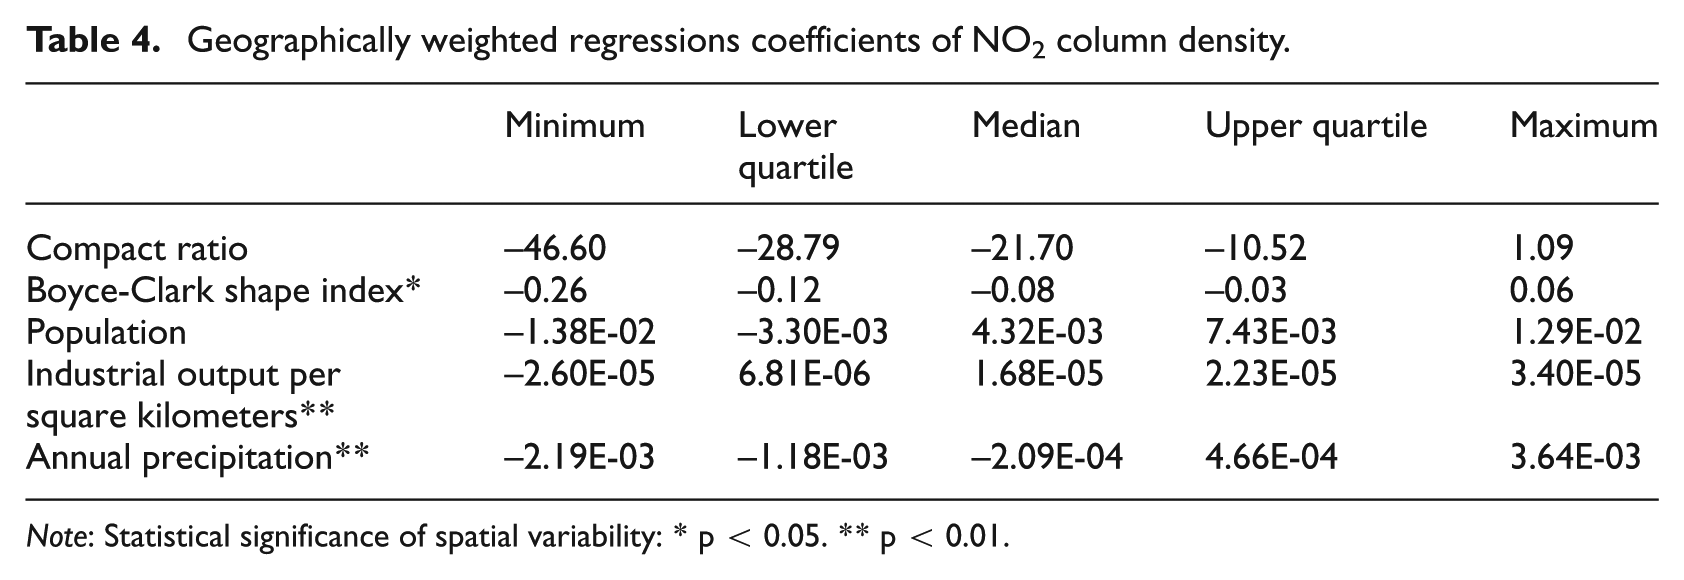
Note: Statistical significance of spatial variability: * p < 0.05. ** p < 0.01.
Geographically weighted regressions coefficients of SO2 column density.
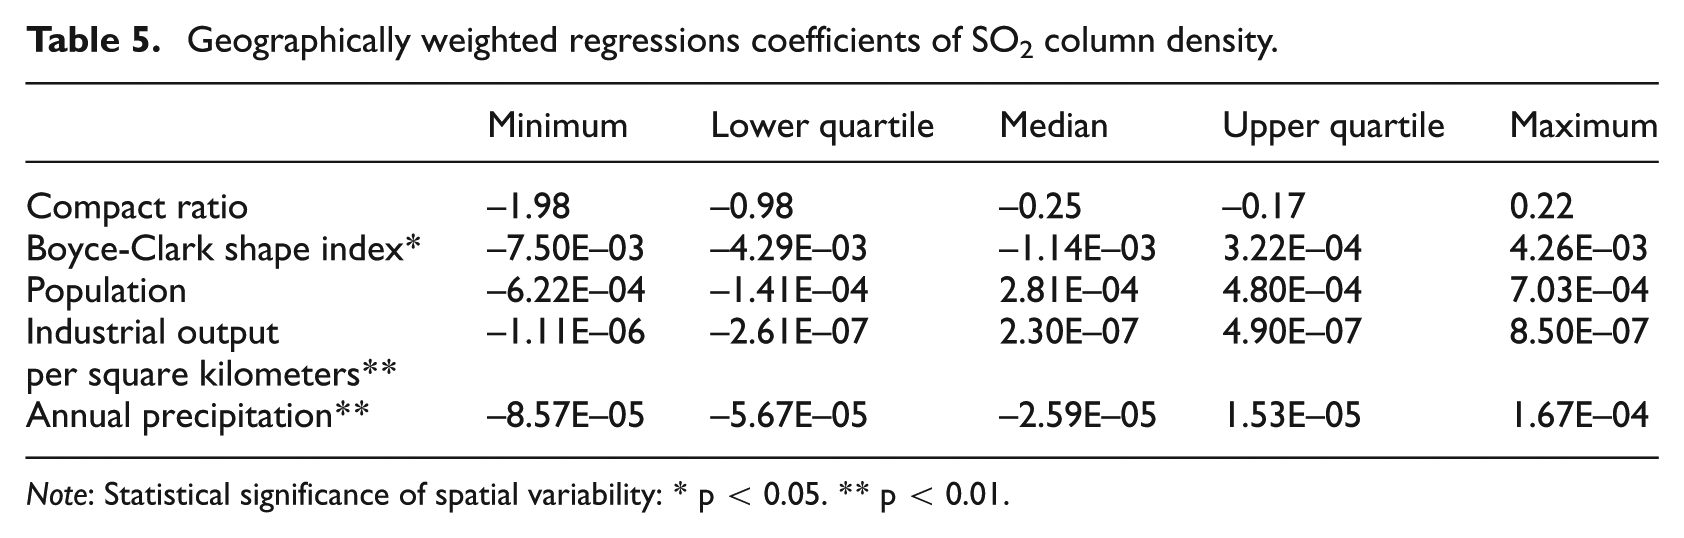
Note: Statistical significance of spatial variability: * p < 0.05. ** p < 0.01.
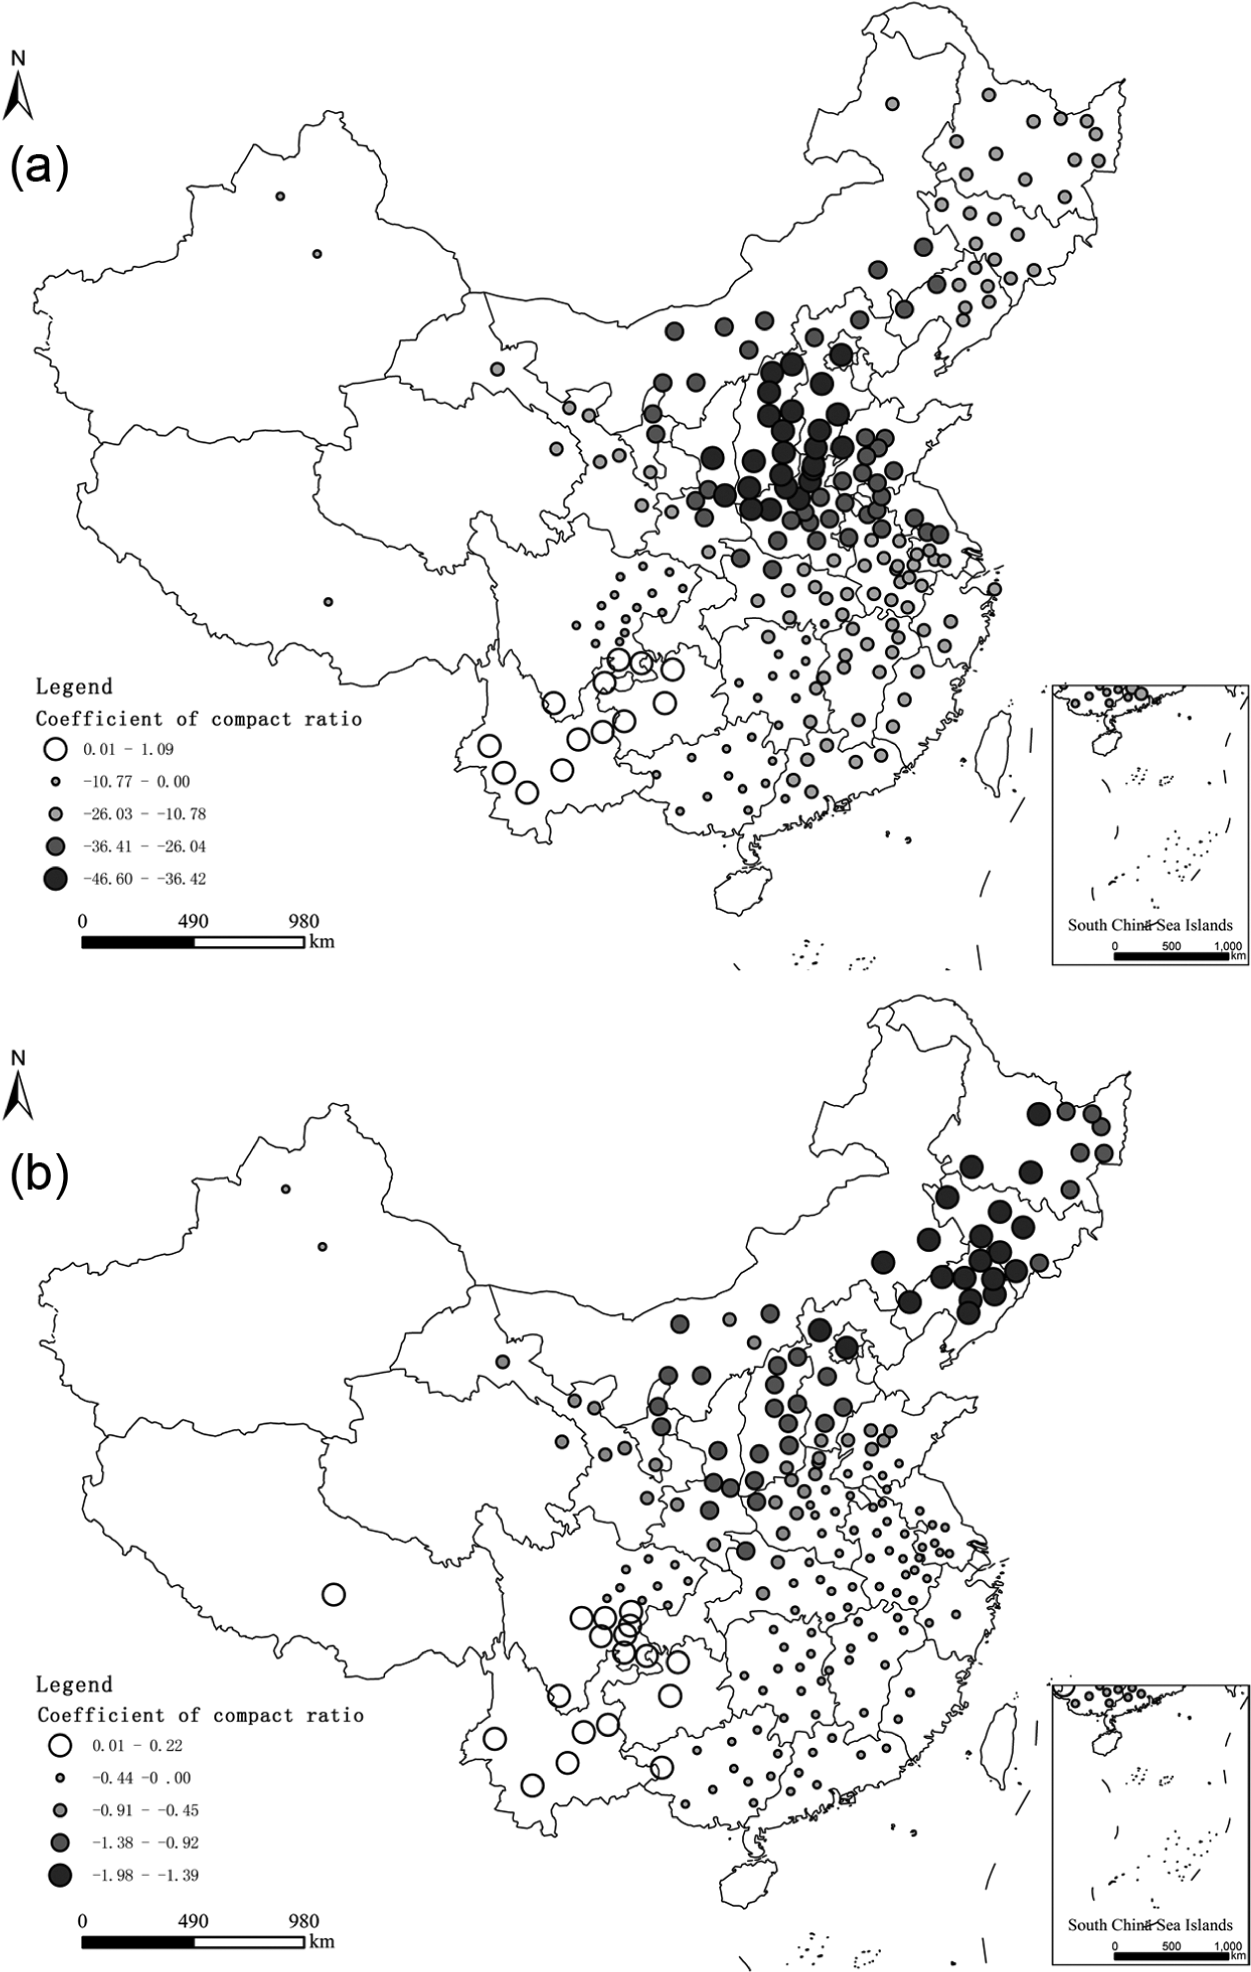
Spatial distribution of parameters for compact ratio on NO2(a) and SO2(b).
On average, a one unit increase of the Boyce-Clark shape index led to decreases of 0.08 and 0.0015 of the NO2 and SO2 column density, respectively. The effect of urban shape on NO2 column density was comparable to that of the meteorological conditions (see Table 4 and Table 5). The spatial coefficients of the Boyce-Clark shape index on NO2 were highest in Hebei, Shanxi and Shannxi Province, where most of the cities were located on plains. This may be because the polycentric urban layout led to fewer traffic jams and better traffic flow than the mono-centric cities in the plain terrain. The effect of the Boyce-Clark shape index on SO2 was largest in northern China, suggesting that cities with heavy industries should take polycentric urban layouts into account in urban planning. The air quality of cities in southern China became worse with larger Boyce-Clark shape index values. This was probably because the line-rectangle urban layout led to inconvenient traffic and inefficient industrial production and organisation, which were deemed as the main source of NO2 and SO2 in China’s urban centres (Figure 4).
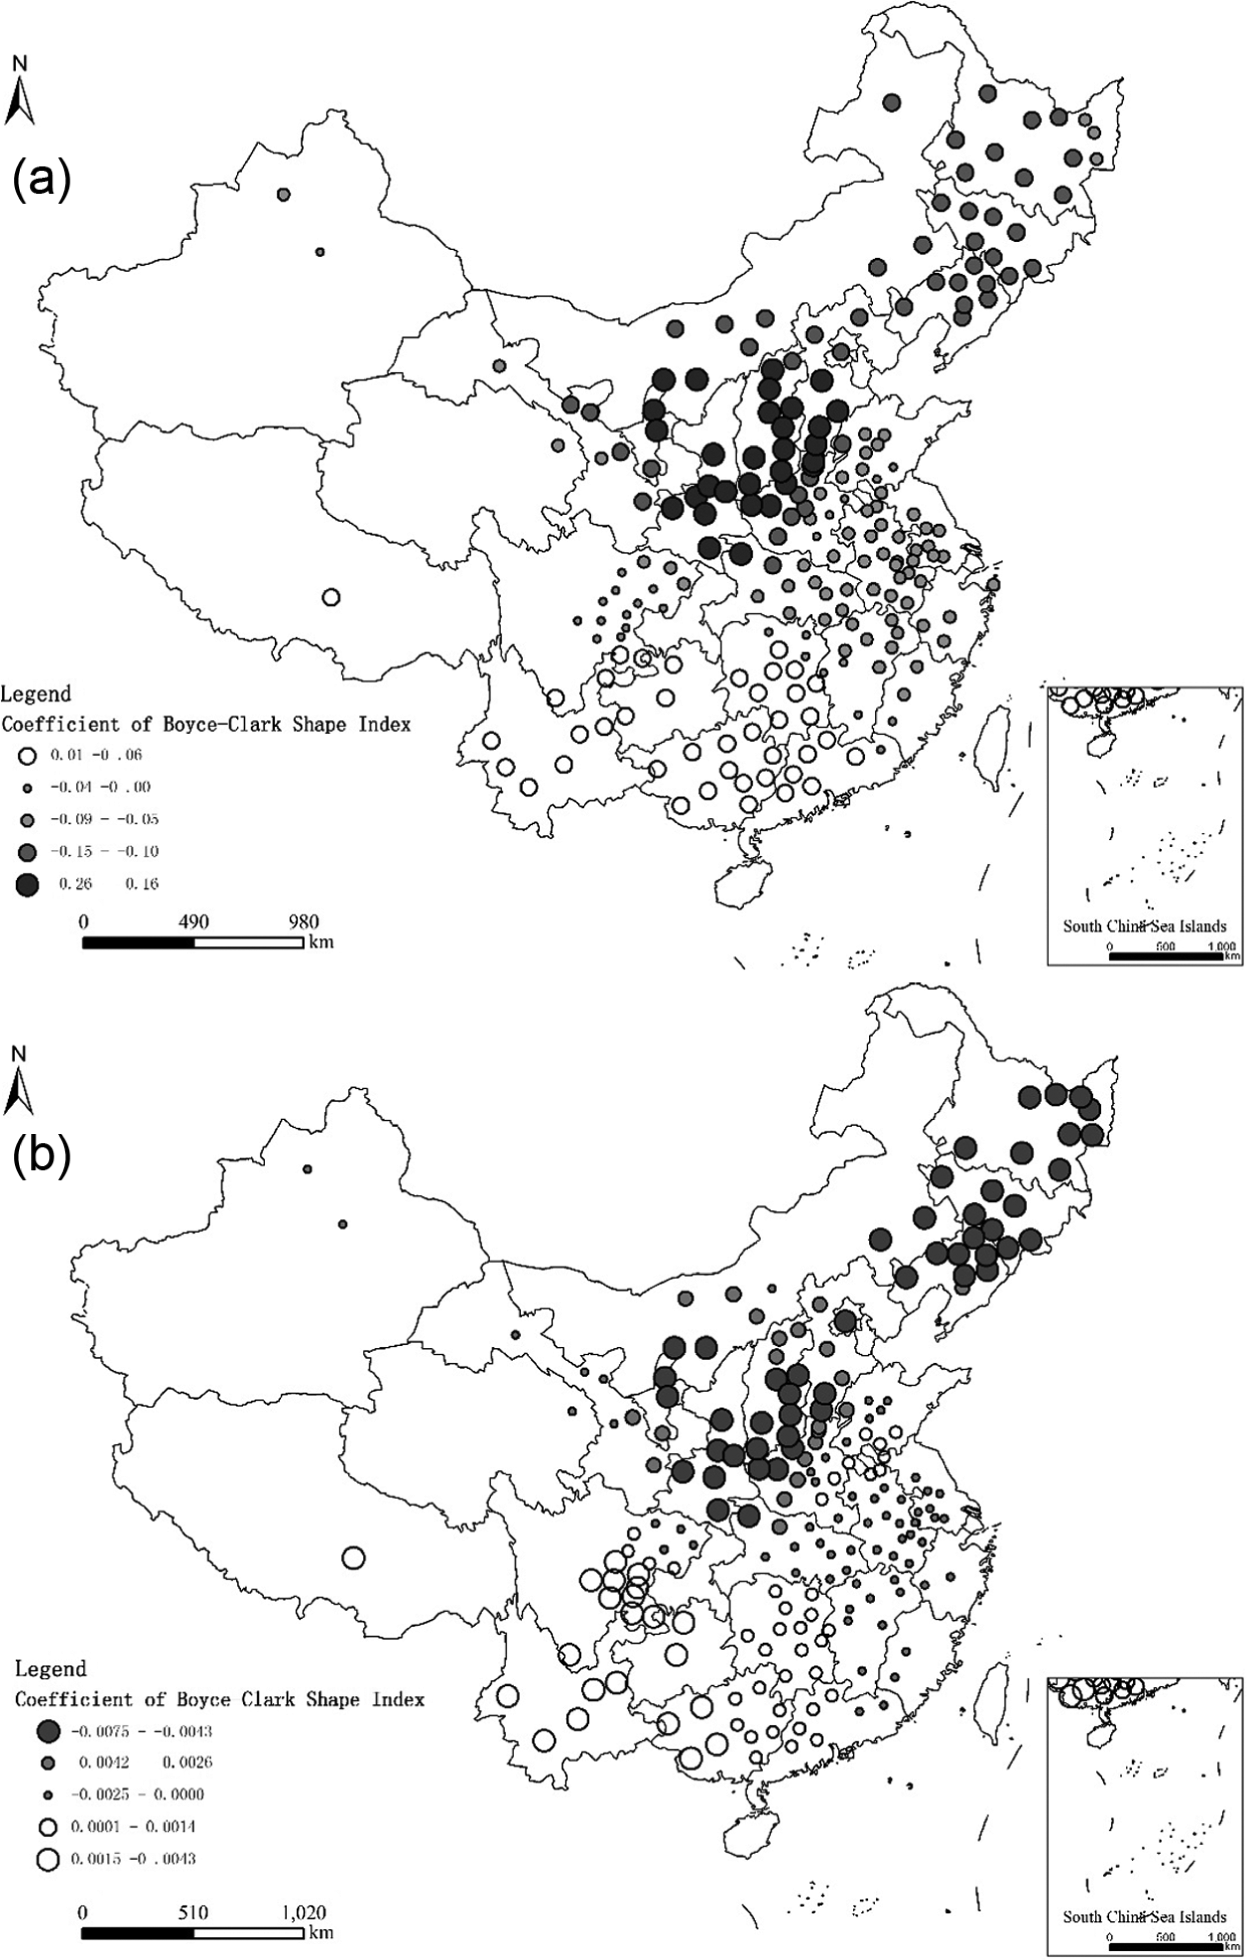
Spatial distribution of parameters for Boyce-Clark Shape index on NO2(a) and SO2(b).
Discussion
The urban compact ratio index had a remarkable effect on the urban NO2 and SO2 column density in China. However, research on cities in developed countries has not found a similar significant relationship between the compact ratio index and NO2 and SO2 column density (Clark et al., 2011). There may be two underlying reasons for this disparity. First, it costs much more to install pollution control facilities and to develop environmental infrastructures in sprawling cities. Expenditures aimed at controlling or reducing air pollution have not been able to keep pace with the rapid urbanisation in transitioning China, and advanced energy efficiency and pollution control technologies have not been widely applied in Chinese cities. Second, studies in developed countries often use another urban form index (i.e., the population centrality index) along with the compact ratio index. Because the population centrality index is highly related to the compact ratio index, only one of these factors was retained when a stepwise multiple regression analysis was applied. In these cases, the urban compact ratio index was excluded from the model because of multicollinearity with similar indices used in the model. However, in this study, the correlation coefficient was analysed in advance. The urban form indexes, the selected socioeconomic factors and the meteorological factors used in the GWR were not significantly related to each other.
Conclusions
This study shows that urban form has a significant effect on urban air quality in China. The magnitude of the effect is comparable to some of the anthropogenic and meteorological factors, which are regarded as important factors to urban air pollution. The effects of urban form on air quality varied over China, and the spatial heterogeneity could be solved by GWR analysis. The key findings of this study suggest that urban spatial regulations should favour a compact form and a polycentric shape (such as ‘H’ shape) for most of the cities in northern and central China. However, for some cities in southern China, a scattered urban layout may reduce the air pollution. Although the spatial precision of the satellite estimates used may be too coarse to reflect urban-scale concentrations, this article still attempted to reveal the relationship between urban form and NO2 and SO2 column density. Meanwhile, it was the first research that explored the relationship between urban form features and air quality using a statistical method with massive data of the provincial and prefectural cities in China. Urban form and its impact on air quality are particularly important for new urban development, urban renewal or (re-)directing urban development at the planning stage. It is unreasonable to recommend a certain type of urban form without knowledge of the city location over China. The urban form that is beneficial to air quality of each city needs to be researched according to the specific conditions and location. Further studies may enrich the understanding of the association between urban air quality and urban form metrics, such as indicators of spatial structure and urban fabric. Furthermore, additional air pollutants, such as particulate matter (PM2.5, PM10 or TSP), should be considered in the future because the effects of urban form may vary among different air pollutants. Finally, more cross-country comparative analyses would help to distinguish the differences between cities at different development stages.
Footnotes
Acknowledgements
The authors are very grateful for the valuable comments and suggestions of the anonymous reviewers. The authors also thank the Managing Editor Dr. Shenjing He and Editorial Assistant Ruth Harkin for their help.
Funding
This research was supported by the National Natural Science Foundation of China (No. 41101138) and the Beijing Municipal Social Science Foundation (No. 14CSB010).
Supplementary Material
Figure S1 Distribution of urban built-up areas in China
Figure S2 Distribution of national benchmark meteorological stations in China
Notes
References
Supplementary Material
Please find the following supplemental material available below.
For Open Access articles published under a Creative Commons License, all supplemental material carries the same license as the article it is associated with.
For non-Open Access articles published, all supplemental material carries a non-exclusive license, and permission requests for re-use of supplemental material or any part of supplemental material shall be sent directly to the copyright owner as specified in the copyright notice associated with the article.