






Abstract
Much of the focus of research on creative industries’ influence upon urban land use has been around the investment in specific regeneration projects or flagship developments rather than addressing the nature and location of the infrastructure, networks and agents engaged. In other words, the complexity of the institutional/temporal and spatial interaction among the involved elements is overlooked or not well understood. This paper presents an agent-based model named CID-USST (Creative Industries Development-Urban Spatial Structure Transformation) that examines the dynamics of the interaction between the development of creative industries and urban spatial structure by outputting a set of adaptive scenarios through time and space. It reveals that the spatial distribution of both the creative firms and the creative workers evolves in a repeating up-and-down pattern even when the exogenous urban economic condition is set to be steady. Moreover, the analysis also points to the policy implication that more open job/rent market information will lead to more rapid geographical clustering of the creative firms and the creative workers, which possibly may reduce the time cost in their spatial evolvement, and perhaps accelerate innovation if we accept that geographical proximity can enhance knowledge and information spill-over.
Introduction
The concept of ‘creative industries’ can be dated back to ‘culture industry’ coined by Horkheimer and Adorno (1973) in the 1940s. However, it was not until the late 1990s that ‘culture industries’ finally evolved into ‘creative industries’ (O’Connor, 2007). In contrast to the long history of the definition (Roodhouse, 2006), it took only a short period for creative industries to gain global prevalence (Cunningham, 2009). The underlying rationale of promoting creative industries, growth and innovation, was further fuelled by the argument of the ‘creative city’ (Landry, 2000) and the ‘creative class’ (Florida 2002). As a result, cities and regions around the world are trying to develop, facilitate or promote concentrations of creative, innovative and/or knowledge-intensive industries in order to become more competitive and sustainable (Girard et al., 2012). However, much of the focus has been around the investment in specific regeneration projects or flagship developments rather than addressing the nature of the infrastructure, networks and agents engaged (Comunian, 2011).
For urban scholars and urban policy makers, one question arising from these practices is: how will the wide promotion of creative industries in the urban realm restructure the urban space and what are the implications for urban land use and creative industries’ development?
In order to answer this question, one stream of study has been focusing on culture-led urban regeneration. However, this branch tends to be site-oriented and the focus is on economic restructuring (Pratt, 2009; Walks, 2011), social inclusion/exclusion, city reimaging and city marketing (Miles and Paddison, 2005). The overall urban land-use arrangement and policy formulation for promoting creative industries are seldom touched upon in these studies. Another stream of research trying to answer the previous question addresses the theory of industries’ clustering, featured by arguments such as creative/innovation milieu, agglomeration economy and local buzz (Mommaas, 2004; Pratt, 2011). This approach helps to explain the mechanism of creative industries’ spatial clustering but does not answer the meta-question of where the creative industries tend to cluster. An effort in this direction results from the ‘soft’ condition theory (Florida, 2002; Landry, 2000), which argues that locations of high ‘soft’ quality such as cultural diversity, tolerance level and living amenity help to explain where the creative industries tend to cluster; and traditional ‘hard’ location factors such as transport services and shopping services exert a fundamental influence in clustering (Dainov and Sauka, 2010).
The mixing of ‘hard’ and ‘soft’ factors inevitably leads to a difficulty in applying traditional location theory with economic benefit-cost analysis as its analytical instrument. The theory of path-dependent networks (Musterd, 2004; Waitt and Gibson, 2009) provides a new possibility, but the central issue of creative industries’ spatiality is always overlooked.
All the previous issues present us with the reality that the interaction of creative industries with urban land use is complex and multifaceted (Comunian, 2011; Liu and Silva, 2013). This means that it is necessary and promising to explore the interactions resulting from bottom-up dynamics by looking into the specific properties of the interested parties involved, and bringing all these aspects under one framework. One such classic bottom-up approach to urban spatial structure study, cellular automata (CA) models, has been widely applied (Wahyudi and Liu, 2016). Yet, some authors state that traditional CA is less suited to capture the macro socio-economic driving factors of urban growth (Han et al., 2009) and has been used in urban economic theory (Arsanjani and Helbich et al., 2013); more importantly, usually human decision making (as in behavioural models mimicking behavioural decision trees) is not presented and, in more traditional CA models, the location of all the cells tends to be static (Tan and Liu et al., 2015). Agent-based modelling (ABM) allows modellers to simulate the complex socio-economic and spatial interactions among distinctive agents by integrating the underlying driving force from both market and government (Crooks and Heppenstall, 2012). These merits have popularised the development of agent-based models to understand urban spatial dynamics, in particular linking spatial structure and economic decisions (Silva and Wu, 2012; Tan et al., 2015). In these models, the modellers tend to focus on the mechanism of the direct influences upon urban land use resulting from government, landowners, residents (households), farmers, industries (firms) and developers. The indirect influence of the interactions among these social parties are concerned but not well represented in the model. For instance, in some models even though industries are included (Jjumba and Dragićević, 2012; Robinson et al., 2012; Zhang et al., 2013), the mechanism of their relationship with urban macro-economy, urban employment rate and the workers’ (residents’) income is overlooked.
This paper further advances previous work by proposing an agent-based model, developed in the environment of NetLogo 5.0 and named Creative Industries Development-Urban Spatial Structure Transformation (CID-USST), to the case study of Nanjing. It not only looks into the individual agents, including the creative firms, the creative workers and urban government, to capture their direct influence upon urban land-use change, but also probes into the underlying mechanisms of the mutual socio-economic dependence of these parties in the process of urban land-use change. First, the interaction among firms, workers and urban policy is interpreted as a complex dynamic process consisting of a series of elements: the firms’ dependence on the workers to generate profit and the workers’ dependence upon the firms to gain income; mutual adaptation between governmental behaviours (supportive policies and urban land-use planning) and locational decisions of the other agents (firms and workers); co-evolution of urban land use and the behaviours of the three agents (the firms, the workers and the urban government). Second, the aggregate change of the urban spatial structure is an emergent phenomenon resulting from these micro-level interactions. Third, the model treats the interaction as a continuous process over time. Fourth, by considering the overall regulatory policies and the land-use plans implemented by the government, the top-down process is integrated into the bottom-up process represented by the micro-level interactions among the agents. However, as factors that define the in-city spatial preference of the agents involved vary across cities/countries (Dainov and Sauka, 2010), it is necessary to place the research into a specific socio-economic and institutional context. This research is in the context of Nanjing, a metropolis in the Yangtze River Delta, the most developed region in eastern China.
Study area and required data sets
The study area, Nanjing
Nanjing is a growth pole in the Yangtze River Delta, one of the three most developed regions in China (Figure 1). Within this urban agglomeration, Shanghai is the core which represents the first rank in the urban hierarchy of this region. Nanjing (together with Hangzhou) ranks second. Thus, the case of Nanjing is expected to capture the dynamics of cities in the second tier of the urban hierarchy in China (He, 2014).

The location of the study area.
The prefecture of Nanjing includes two counties and 11 administrative districts. It covers 6587 km2 with a population of 8.01 million in 2010 (Nanjing Bureau of Statistics, 2011). As the determinants that define the office location of creative firms and the residence location of creative workers vary across different sub-sectors (Dainov and Sauka, 2010; Musterd, 2004), this research is narrowed down to the two primarily promoted sub-sectors: software design and animation design. Within ‘Nanjing Metropolis’, there are approximately 1200 firms and 84,000 workers engaged in these two sub-sectors, and the estimated productivity is £20,000 per capita in 2010.
Required key data sets
The required data for this study were collected by fieldwork which began in April 2011 (Table 1). The spatial data set, including the GIS database of Nanjing Metropolis and the urban land-use map, was collected from Nanjing Urban Planning Bureau. The former stores the basic information of the geography of Nanjing, such as the river and lake system, the transport networks and the cultural facilities, etc. By referring to these data, we have divided the urban space of Nanjing into five districts: CBD, inner urban area, outer urban area, inner suburb and outer suburb, which form the foundation for dividing the simulated urban space into five districts in the model. In addition, through spatial analysis using the negative exponential formula (Levy et al., 2013), the geographical factors that fundamentally affect the workers’ housing location preference and the firms’ office location preference.
The key data sets used in this study.

The business directory records all the registered firms in Nanjing as of 2010. It is used to calibrate the ‘birth rate’ function of creative firms (section ‘Model framework’). To determine the action rules of location preferences, instead of theoretical derivation, this study uses the approach of empirical analysis of data (O’Sullivan et al., 2012) collected through questionnaire investigation. In the fieldwork, two different types of questionnaires were used to investigate the firms and the workers. By random sampling, managers from 70 out of around 1221 firms were asked to select the decisive factors for their office location choice and give each a weight, with 68 valid cases. Using a similar approach, 350 out of around 84,000 workers replied with answers to the question of what are the most critical factors that determine their housing location preference, with 310 valid cases.
Analysis of these data identified eight key factors that fundamentally influence the firms’ office location preference (Liu et al., 2016). Sorted by importance from high to low, they are: (1) government policy guidance; (2) urban road transport (bus line); (3) high-speed public transport (underground); (4) cooperation and trade milieu among firms; (5) geographical proximity; (6) land/office rent; (7) sharing of talent pool; (8) physical environment. In contrast, six factors are identified which determine the workers’ residence location. With the first as the most important, they are: (1) public transport (bus line and underground); (2) convenience for buying daily supplies; (3) housing rent/price; (4) physical environment quality; (5) allocation/inheritance; (6) cultural facility.
By surveying documents of development policies and land-use plans, and development schemes collected from Nanjing Urban Planning Bureau, it was possible to verify that the urban government’s influence upon creative firms, creative workers and urban land use is implemented via two approaches: supportive policies and land-use planning. These supportive policies include tax reduction, lower land rent, and trade/creative milieu promotion. In the model land-use planning includes four aspects: urban regeneration (referring to the renewal of derelict sites so that they can be occupied by firms/workers again), land expropriation for new development projects (turning farmland into available land for office/housing), density control (each plot has a maximum plot rate), and land resource control (land quota released to market is controlled by the government) (Zhao and Wu, 2005). In addition, in a semi-structured style we also interviewed two government officials from the Urban Planning Bureau of Nanjing, who presented us with the government’s strategic vision of urban land use towards 2020.
Model framework and model parameters
Model framework
This model includes three agent classes: the creative firms, the creative workers and the urban government. The citizens, as a potential agent class, however, have not been included. This decision was taken because more than 85% of the investigated citizens (492 randomly sampled cases) prefer to act by following unconditionally what the government propose, and approximately another additional 5% support the government’s plans if the compensation for residential relocation/land expropriation is exercised by referring to market value.
Taking the empirical evidence from Nanjing as the foundation, a framework of the complex interactions among the three agent classes in terms of urban land use, as illustrated by Figure 2, is proposed. In the model, the urban space is composed of small grids/plots and each plot has a set value describing its property, such as housing/office rent, distance to the nearest underground station, proximity to similar industries/groups, etc. The urban government exerts influence upon the creative firms and the creative workers indirectly through allocation of supportive policies as leverage to and implementation of plans upon urban land plots. Liu and Silva (2013) have explained this framework in detail.

The interactions among the agents.
While more details regarding of the condition-action rules of all the agents, the definition of the utility function, the endogenous variables, and the quantification of the influence on the properties of land plots resulting from the agents’ spatial movement have been presented by Liu and Silva (2014), the next paragraphs set out the key characteristics:
The creative firms and the creative workers are mutually dependent. The creative firms have to employ workers to generate profits to support its costs for office operation; and the creative workers need the firms to offer job positions to earn a living. In addition, throughout the dynamics, every firm needs to compete with other firms for an office.
Similarly, each worker has to look for a residence in the housing market. Their final location choice is determined by the location utility which is calculated by a utility function with the determining factors (eight for the firms and six for the workers, as revealed by the fieldwork data analysis) as its independent variables.
The location movement of these firms and workers, as a result, will change the properties of all the land plots influenced. Changing the properties of the involved plots’, in turn, will create a new urban land environment which will render new conditions to all the agents to react to accordingly.
Model parameters
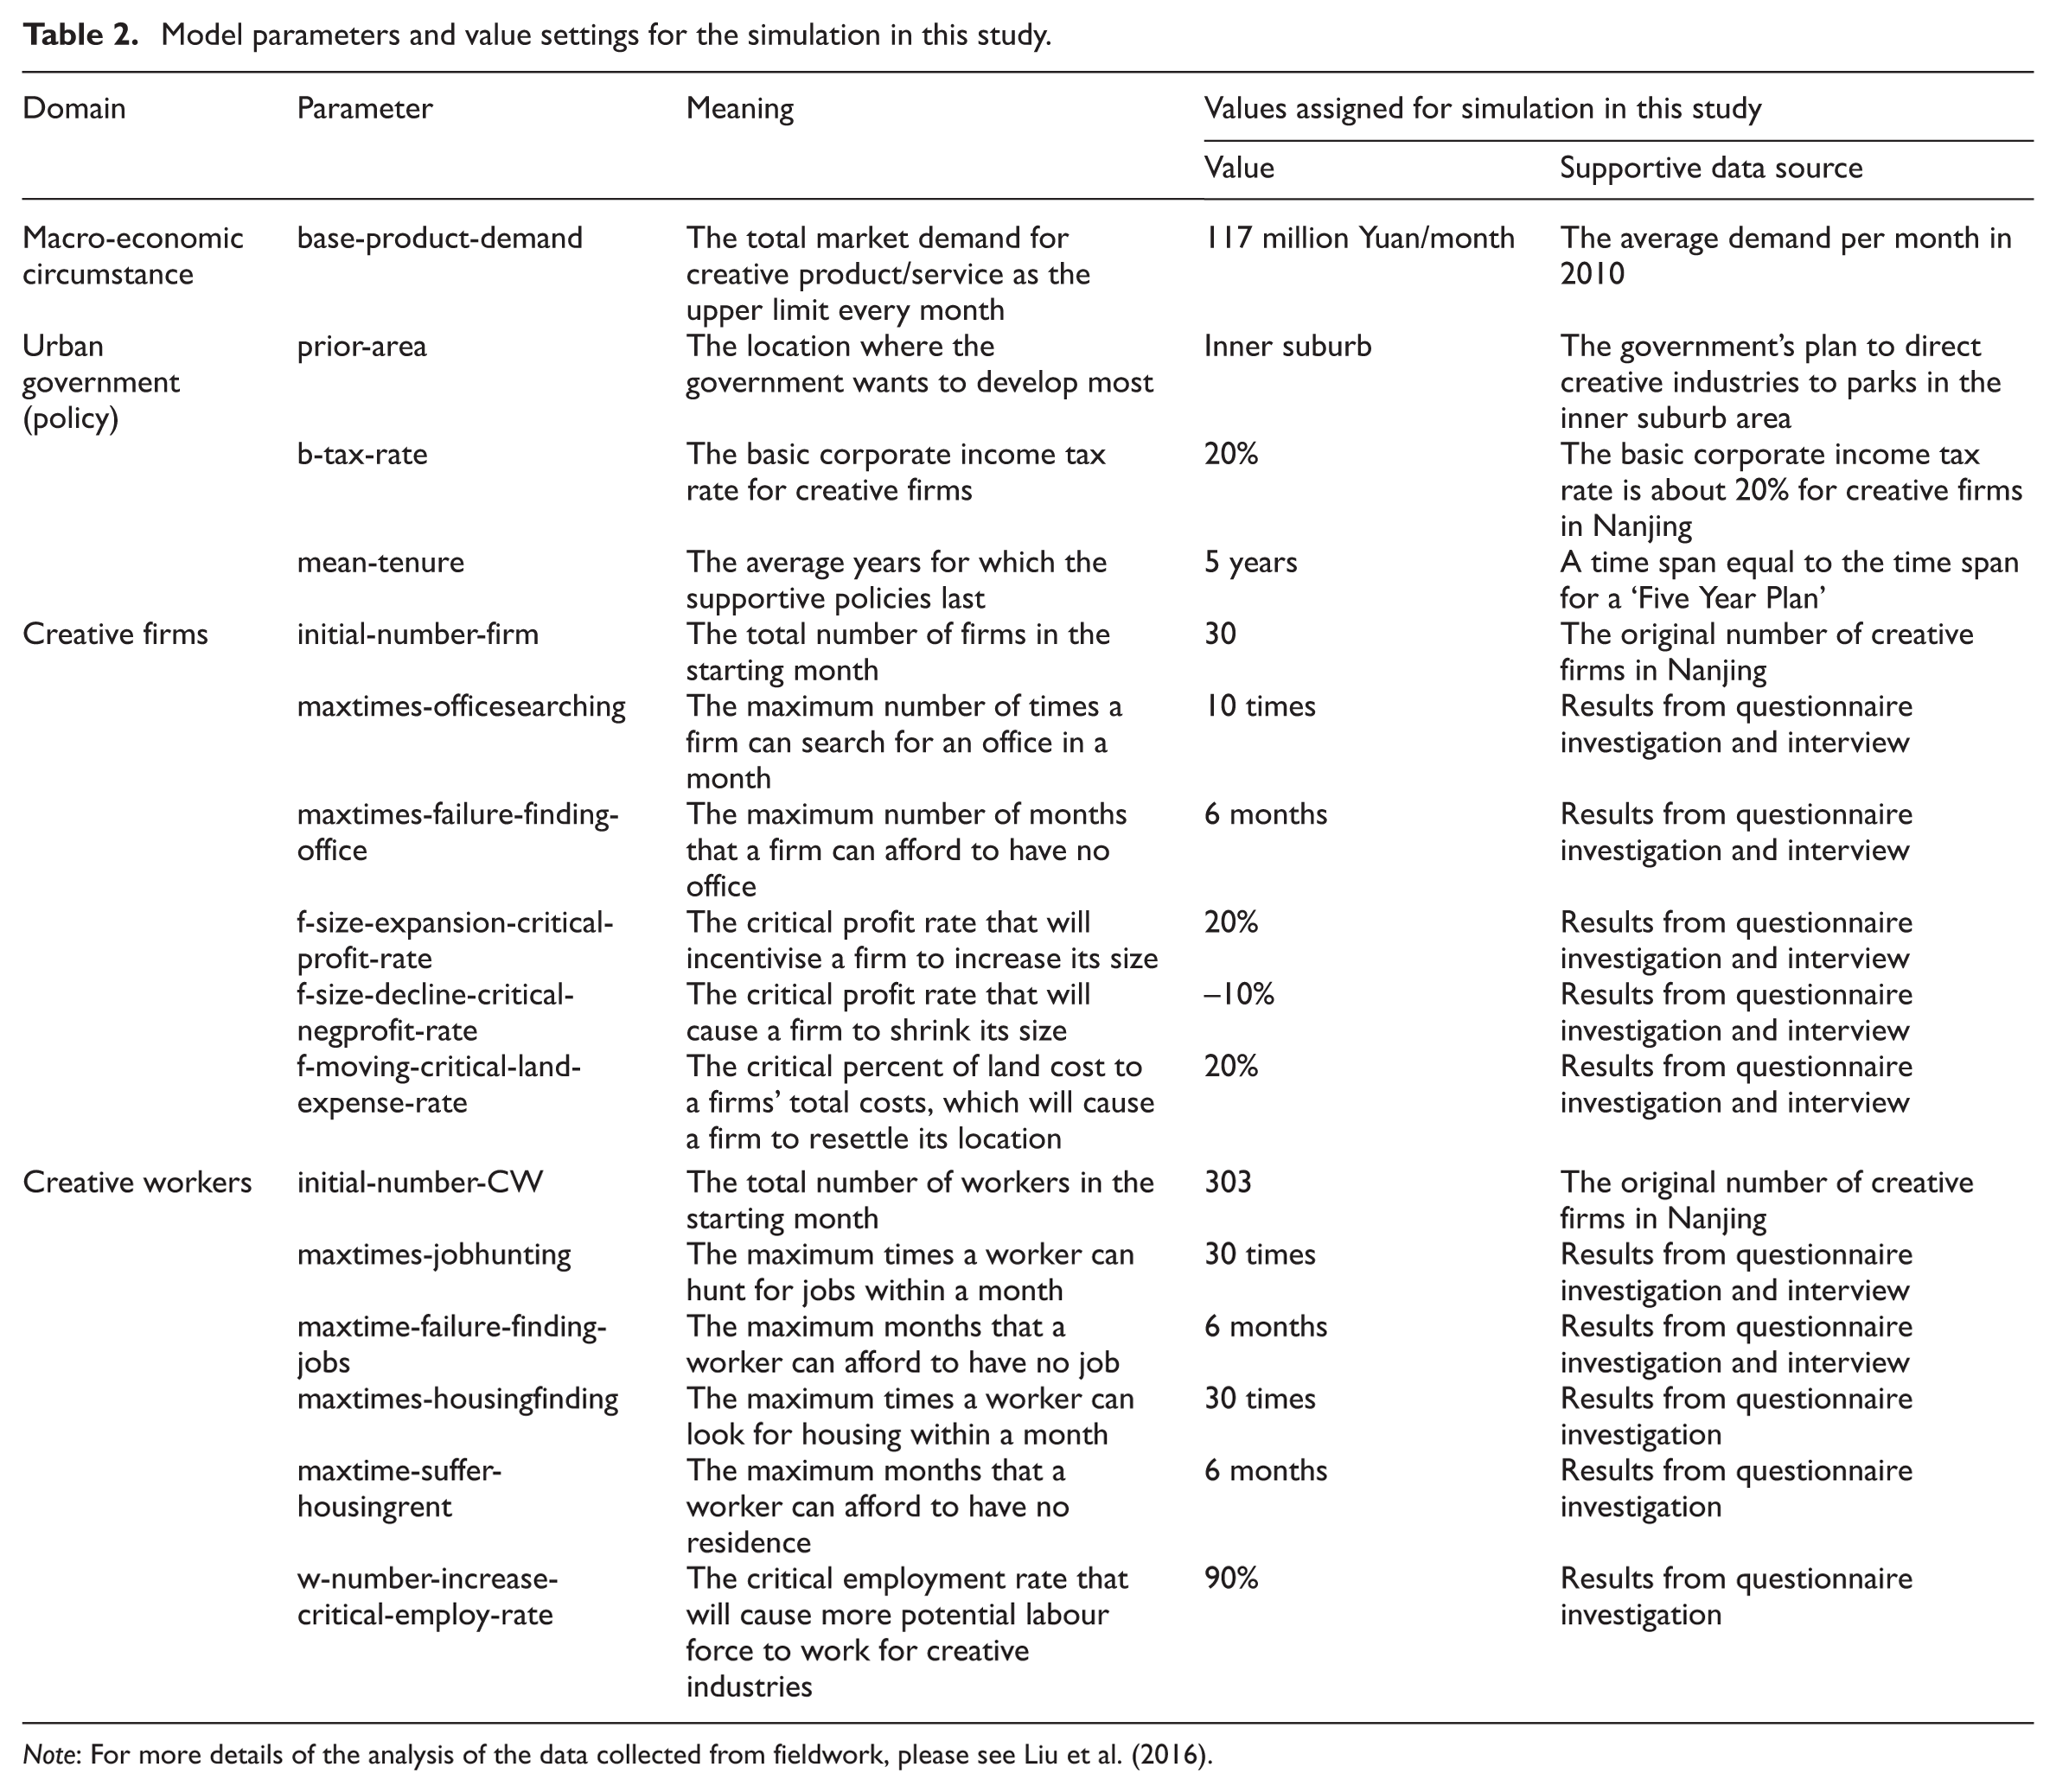
The model parameters, the values of which are open to change by the model user, relate to four aspects: one for setting the macro-economic circumstance and the other three for setting the critical values which closely related to the condition-action rules for the three agent classes (Table 2). Regarding the macro-economic circumstance, one parameter, ‘base-product-demand’, is used. It refers to the total market demand for creative product/services every month, which is the upper bound of the total production that the simulated firms can generate in the system.
Model parameters and value settings for the simulation in this study.
Note: For more details of the analysis of the data collected from fieldwork, please see Liu et al. (2016).
As explained, in this model the government exerts influence upon other agent classes through land-use plan and supportive policies. Correspondingly, three parameters are specified to reflect this consideration: the ‘prior-area’ defines the location/area with high probability of being (re)developed by the government with funding support. The ‘mean-tenure’ is the average years that all the supportive policies may last. In addition, all the creative firms in the model will be charged by the government with a income tax rate of ‘b-tax-rate’.
In practice, people’s daily activities are constrained by time. Therefore, in the model, while searching for offices a creative firm is unable to try indefinite times within one month. Instead, the times are limited to a certain value assigned to ‘maxtimes-officesearching’. And if this firm fails to find an office in a continuous ‘maxtimes-failure-finding-office’ months, then it will be excluded from the system (in modelling terms, it means the death of this agent). Once a firm succeeds in finding a suitable office, it will settle down and keep checking if the percent of land cost to its total sales value is greater than ‘f-moving-critical-land-expense-rate’. If so, it will move to a location with the highest location utility for itself. In the model, a firm’s size (number of employed workers) can also change, increasing if its profit rate is greater than ‘f-size-expansion-critical-profit-rate’ and decreasing if its profit rate is lower than ‘f-size-decline-critical-negprofit-rate’.
The workers’ ability to look for jobs and housing is also limited by time and energy. So the maximum times a worker can attend a job interview is defined by ‘maxtimes-jobhunting’ and searching for housing by ‘maxtimes-housingfinding’. If a worker fails to find a job within ‘maxtime-failure-finding-jobs’ months or cannot find a residence within ‘maxtime-suffer-housingrent’ months, it (as an agent) will, in modelling terms, be sentenced to death. In the model, it is designed that new creative workers will enter the system if the employment rate in creative industries is higher than ‘w-number-increase-critical-employ-rate’.
Model calibration and validation
As the model deals with the creative workers and the creative firms whose financial activities (such as payment) are generally monthly based, the model supposes each step represents one month. For model validation and dynamics analysis, we ran the model 30 times, which was considered a sufficient number of times for an agent-based model run (Abdou et al., 2012), and each time 120 steps (the time span of two periods of the ‘Five year Plan’).
The number and size/income of the firms and the workers
It is assumed that the birth of new firms happens only when the demand for a creative product/service is greater than the supply (generated by the workers). The growth rate is positively correlated to pd-s where:

By referring to the general logistic model of population growth explained by Mitchell (2009), the relationship between the birth number of new firms (Nf-birth) and the ratio (pd-s) at step t is defined as:

where Nf (t) is the total number of existing firms at step t. As the total production in each step varies, accordingly the growth rate
If we use Nf-death (t) (the value of which is equal to the real-time number of firms excluded from the modelled system) to denote the number of deaths of firms at step t, then the total firm number at step (t + 1) is:

Following the same principle, it is proposed that when the real-time employment rate (in the model) qe is greater than the critical value qc (parameter ‘w-num-increase-critical-employ-rate’ in the model), new workers will enter the system. Then the number of new workers at step t is calculated by:

where Nw(t) is the total number of existing workers at step t; and S0 is a constant which should be calibrated.
Then the total worker number at step (t + 1) is:
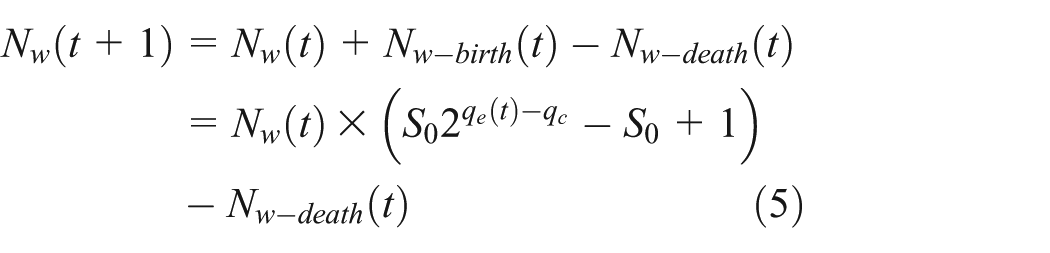
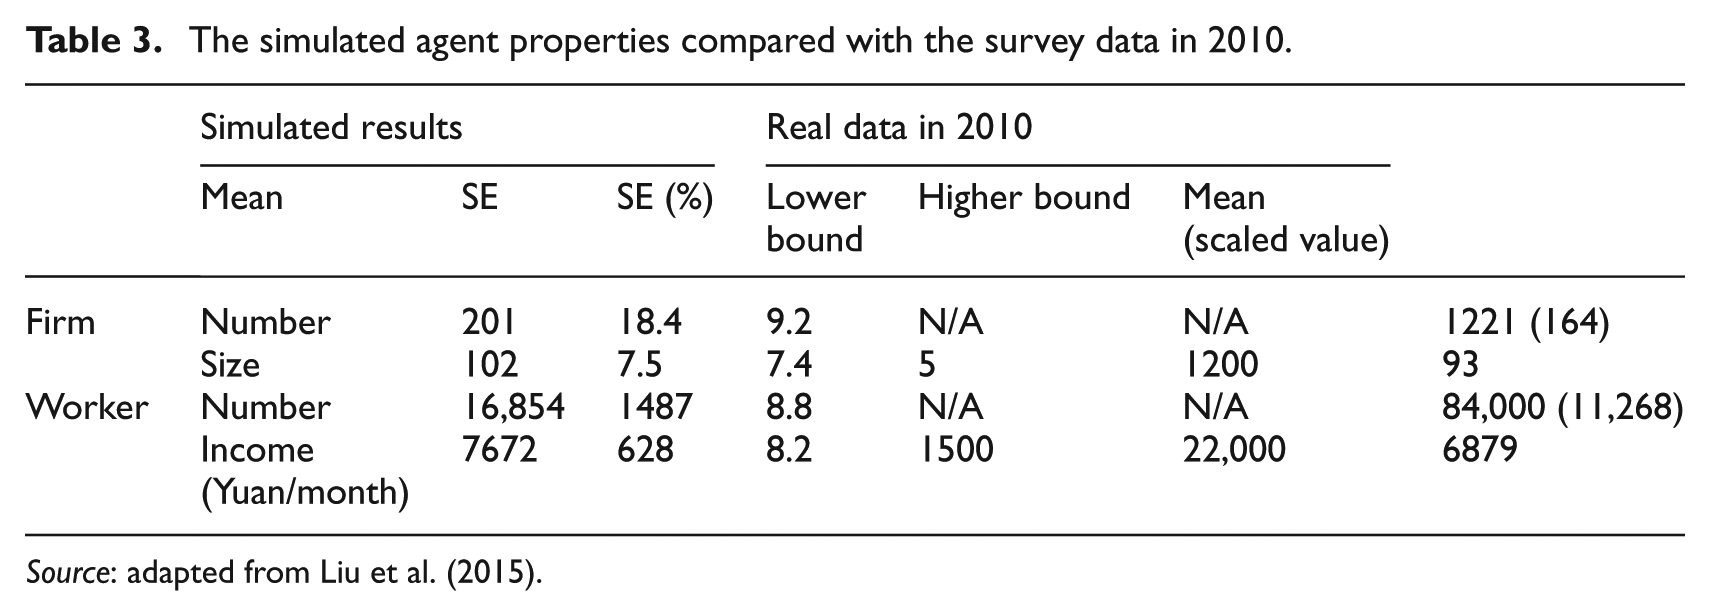
To calibrate S0, the model is run by setting its value to 1, 5, 10, 20 and 50, respectively. With different values, the model generates different results of the number of firms and workers. By comparing each result against the real data in Nanjing, it is then possible to figure out which value of generated result resembles the best fit to the real data. Nevertheless, the simulated urban space is 400 km2 while the research area covers 2982 km2. In order to make the simulated data comparable with the real data, we assume that the simulated system and the real system share the same density of firms and workers. Thus, the number of firms and workers can be scaled down to 164 and 11,268, respectively (Table 3), and, by comparing each simulated result with these scaled-down values, the calibrated value for S0 is 10.
The simulated agent properties compared with the survey data in 2010.
Source: adapted from Liu et al. (2015).
Nevertheless, the mean of the simulated firm number is 201 while the real number is 164, with a difference of 37 (20%). It seems that the simulated results do not fully accord with the real data. One possible explanation is that, in the real system, when the firm number increases there is a scale effect (this aspect is not considered in the model) which reduces the firm number and the worker number. As shown, there are 168,554 workers in the simulated system and the employment rate is about 81%. Thus the number of employed workers is 13,652, larger than 11,268, which is the value in the real system. With the exception of these two numbers, the other two numbers are acceptably consistent (with a difference of 4.6% and 5.4%, respectively).
The office rent and housing rent
In Table 4, the left part presents the simulated results of office rent and housing rent (the unit is ‘Yuan/month*m2’. One Yuan equals approximately £0.10) in the system. The standard errors of the two outputs are both smaller than 5%, which means that the system is stable in these two aspects. The right part of the table describes the real data from the questionnaire analysis. The percentage of the mean difference between these two systems is 1% for land price and 2.6% for housing rent. This indicates that the simulated data and the real data are very consistent.
The simulated office/housing rent compared with the survey data in 2010.

Source: adapted from Liu et al. (2015).
Spatial distribution of the agents
The spatial distribution of the agents in the simulated system and Nanjing are presented in Table 5. By comparing the simulated and real data in the column ‘Percentage’, it can be concluded that they are acceptably consistent in terms of the spatial distribution of the creative firms. However, the data of the creative workers’ spatial distribution does not seem to be consistent (see the shaded cell in Table 5). The possible cause is that the simulated results include the future period that is characterised by workers moving out from inner urban areas to suburban areas. In addition, the standard error of the simulated results in the CBD and the inner urban area is slightly higher than 10%. The possible conclusion is that, with the same initial conditions, most inner urban areas can still experience slightly different development patterns, an embodiment of uncertainty (for instance the uncertain consequences resulting from the complex and fierce competition among the firms in this study) in complex systems.
The simulated spatial distribution compared with the survey data, 2010.

Source: adapted from Liu et al. (2015).
The dynamics of the interaction between the development of creative industries and urban spatial structure
The value settings of the parameters for the analysis presented below are specified in Table 2. The empirical evidence to support these settings is mostly collected through questionnaire investigation and interviews, which was briefly described in section ‘Study area and required data sets’. The points below describe how the empirical findings that fed the parameter settings presented in Table 2 produced results that revealed: the dynamics of the spatial distribution pattern (section ‘The dynamics of the spatial distribution pattern’); the dynamics of the spatial clustering pattern (section ‘The dynamics of the spatial clustering pattern’); the dynamics of the office/housing rent (section ‘The dynamics of the office/housing rent’).
The dynamics of the spatial distribution pattern
A1 in Figure 3 shows that, at the early stages, the spatial distribution of the firms is not stable. Instead, it fluctuates fiercely, which indicates that the firms are experiencing fierce competition for proper locations. Thus, firms unable to pay the land rent are forced to leave; at the same time, new firms enter the system, which intensifies the competition and the frequency of movement. However, when the final winners are settled (after about 30 steps/months), the movement frequency declines, which produces a stable spatial distribution pattern of the firms.

The spatial number distribution and density distribution of the firms and the workers across time.
In accordance with the spatial distribution of the firms in Nanjing, the inner urban area is the most attractive among the five areas (CBD, inner urban area, outer urban area, inner suburb, outer suburb), as both the number distribution and the density distribution of the firms are highest in the inner urban area (line 2 in A1 of Figure 3 and line 2 in A2 of Figure 3). What is different from the real case is that the number of firms in the inner suburb (lines 4, 5 and 6 in A1 of Figure 3) ranks in second place, higher than that in the outer urban area (line 3 in A2 of Figure 3). This is a reflection of the parameter setting that the ‘inner suburb’ is the primarily policy-supported area. As policy is effective in directing the spatial movement of the firms (as revealed by the fieldwork investigation), the inner suburb tends to be more attractive and attracts a greater influx of firms. But its attractiveness is not strong enough to exceed that of the inner urban area.
As illustrated by B1 and B2 of Figure 3, the spatial distribution pattern of the workers is different from that of the firms. The early stage sees a steady (stage 1) increase in all five areas, which is in accordance with the increase of the number of workers. Following this period (stage 2), there is an irregular fluctuation which implies that the subsystem of the workers are undergoing self-organisation (from around step 10 to 30). After this process the system enters a period of regular cyclical fluctuation (stage 3). This means that there is still fierce competition among the workers in terms of both job hunting and residence renting.
Unlike the firms, most workers tend to live in the inner suburb (lines 4, 5 and 6 in B1 of Figure 3). This reflects the conclusion from the case study that housing price is a critical factor for housing location of workers (housing rent ranks third). As the income of the creative workers is only slightly higher than the average income level in Nanjing (revealed by fieldwork), a cheaper residence property is usually attractive to the workers. Yet, as the income gap among the creative workers is high and still expanding (in the simulated system), workers who earn much higher incomes tend to concentrate in the CBD (B2 of Figure 3) and in consequence raise the housing price (Figure 5). Thus, those workers with lower salaries are forced to move from the CBD to the inner suburbs where the price is much cheaper and transport and shopping is fairly convenient. In addition, as shown by B2 of Figure 3, even though areas further away from the CBD have slightly higher density of workers for short periods, it can still be seen that the density distribution basically follows the principle ‘the closer to the CBD the area is, the higher its worker density is’ (B2 of Figure 3).
The dynamics of the spatial clustering pattern
Figure 4 describes three scenarios of the spatial clustering pattern for both the firms and the workers across time by the statistic R (Wong and Lee, 2005). The value range of the R statistic is [0, 2.14). The smaller the calculated R is, the stronger the clustering pattern. In a general sense, at the beginning stage, the clustering pattern of both the firms and the workers is not stable because of the dynamic spatial movement and continuous change in the agent number. However, when this period ends, for both the clustering pattern turns to a stable status. The values of the R statistic imply that in all three scenarios, both the firms and the workers demonstrate a clustering trend (because the value shows decreasing trend compared with the original status and is less than 1). This illustrates the conclusion that the workers and the firms can achieve a clustering status through self-organisation. But the difference between them is that when the system reaches a comparatively stable status, the clustering pattern of the firms stays almost steady while the clustering pattern of the workers fluctuates repeatedly, which is a response to the number fluctuation of the workers.

Three scenarios of the spatial clustering pattern of the firms and the workers.
A comparison of scenario 1 and scenario 2 indicates that if the workers are able to try to look more frequently for a residence (within a month), first the time needed for the workers to reach a certain clustering level is shorter (see the R value in the starting period of the two scenarios); second, overall the workers show a stronger clustering trend (because the average R value is smaller); and third, the clustering pattern is more stable (smaller fluctuation amplitude) which means that the workers suffer less from the trouble of moving around. By comparing scenario 1 with scenario 3, it can be seen that if the firms have more chances to search for offices (within one month), the time for the firms to reach a certain strong clustering pattern is much less; and the final status shows a much stronger clustering pattern.
As explained by Liu and Silva (2014), the maximum times that a firm/worker can try each month to search for office/housing, to some extent can be regarded as the number of the expected information entries that the firms/workers can access (i.e. the locations and number of offices/houses(flats) suitable for a certain firm/worker). In this sense, it can be inferred that if the government can establish an information-sharing platform and offer relevant information (market information of offices and housing), then the clustering process for both the firms and the workers will be accelerated. Also, with the assumption that ‘geographical clustering’ can facilitate the generation of comparative advantage for the firms/workers, we can infer that the firms/workers can benefit from clustering earlier compared with the situation that they are not provided with this kind of information-sharing platform.
A vivid reflection of this idea is the establishment of the Nanjing Public Service Platform for Cultural Industry (http://www.njculture.net/index.html) by the Nanjing Urban Government. Through it, the creative firms can have the latest news on the development of creative industries in Nanjing, the relevant supportive policies and the available fundings from the government. The creative workers, as well as other citizens, can access the list of all creative firms, their business and locations, and the list of job opportunities, which facilitates job hunting for the potential workers. Work in enhancing information sharing has effectively promoted the increase in numbers of creative firms and the clustering of creative firms in industrial parks/bases. As of December 2013, there were 17,000 creative/cultural firms spatially clustered in more than 30 national or provincial industrial bases/parks in Nanjing.
The dynamics of office/housing rent
Following closely the boom in the number of firms and workers is a rise in land rent (office and house rent) and housing rent. However, as shown by Figure 5, neither grows without bound. When the system reaches a equilibrium status, the price (rent) reaches a relatively stable status. The maximum value of office rent is 92.2 Yuan/(m2*month) while the maximum housing rent is 32.4 Yuan/(m2*month).

The spatial distribution of office rent and housing rent across time.
Figure 5(a) also shows that the increasing range of office rent in the inner urban area (line 2) is greater than that in the other areas. This reflects the fact that the inner urban area has the highest firm density, as described in section ‘The office rent and housing rent’. In comparison with office rent, the increasing range of housing rent in the CBD is the highest. This is a clear resonance to the outcome that the CBD features a much higher worker density than the other areas (B2 of Figure 3). Even though the price (rent) changes through time in each area, the final results still follow the principle that the closer to the city centre, the higher the price/rent is.
By looking into the dynamic patterns of the resulting office rent and housing rent across time, it can be seen that they both experience two stages. At the first stage, office and housing rent in all the districts except the outer suburb (OS) undergoes an irregular but intensive oscillation (Figure 5). This reflects the fierce market competition among the firms for offices and among the workers for housing. As market demand increases, the overall price of both office and housing goes up, while the housing rent features a higher increase rate. After this boom stage, the two kinds of rent in the four districts decrease to a lower level but still higher than the original value. It may be inferred from this outcome that property price can be inflated in a very short period of time resulting from the boom of creative industries, but inevitably it will go down soon after. Therefore, in response to the boom of creative industries, urban governments may need to prepare adequate land for housing and offices but avoid running the risk of land oversupply stimulated by the illusion of possibly overestimated land demand and inflated land price.
Moreover, at the second stage when the system evolves to an equilibrium, the office rent remains almost unchanged, but housing rent fluctuates cyclically within a small range. The cycle is the same as the period of the number fluctuation of the workers. This phenomenon implies that, in terms of price, the housing letting market is more dynamic than the office rent market. This is a reflection of the frequent spatial movement of creative workers, driven by the rising price and the uncertainty of the creative labour market.
Discussion and concluding remarks
The rationale for the rapid spread and global promotion of creative industries is their potential for economic growth, urban regeneration and sustainable development. Nevertheless, few address the nature of the infrastructure, networks and agents engaged. As a result, policy initiatives usually result in negative competition, increasing vacancy rates, short-term usage and abandonment once the government subsidy/support stops. This research shifts the focus from economic growth and innovation to the complexity of the development of creative industries and its interaction with urban land space through time and across the urban spatial structure. It applies the CID-USST model, an agent-based model developed by Liu and Silva (2013, 2014), to probe into the features of the dynamics of urban land-use change resulting from the development of creative industries in Nanjing, China.
Different from other studies on industries’ influence upon urban land use (Jjumba and Dragićević, 2012; Robinson, et al., 2012; Zhang et al., 2013), this paper not only integrates factors of decision making (by the urban government) to the model and analysis, but also takes into account the mechanism of the relationship between firm-/worker-level behaviours with the overall performance of the urban economy, and the mutual dependence of the firms and the workers. These underlying connections influence urban land-use change indirectly and thus have been overlooked by the literature listed above. In addition, the spatial behaviours of the firms and the workers are different from those of other industries and vary across countries/cities. Even different sectors within creative industries can differ from each other in terms of location preference because of their heterogeneity. Thus, because of the data collected, the policies and government intentions reviewed, the analysis presented in this paper is confined to the specific case of Nanjing, and focuses only on cartoon design and software design, two most well-developed sectors in Nanjing.
This manipulation raises two immediate questions pertaining to the conclusions generated by this research. First, because of the nature of the ABM models (bottom-up models of local dynamics) and the subsequent calibration using local data, the characteristics of the spatial dynamics of the urban spatial structure only reflect the influence from the development of cartoon design and software design. And the proposed policy implications may be effective for only these two sub-sectors as well. Whether the other sub-sectors (creative industries) also follow the same or similar spatio-temporal patterns, or feature a completely different style, entails further empirical analysis. Second, as a specific case study, the generalisability of the conclusions to other case study cities with substantial industries of cartoon design and software design will require mode comparative analysis and model application to other cities/districts. Thus, it entails applying the research framework presented in this paper to more varied cases, to determine if common points can be found.
While applying the research framework to other cases, however, it is vital to bear in mind that the model framework proposed in this study includes only three agent classes: the creative firms, the creative workers and the urban government. The citizens, as an important interest group, are not included. This manipulation has the foundation that ‘more than 85% of citizens being willing to support urban plans implemented from urban government unconditionally’ (conclusion from questionnaire investigation in Nanjing. For more details please see Liu et al., 2015) and that the state-owned land ownership grants the government dominant power in terms of urban land-use rights as its context. So, in other cases, especially cases in countries where urban government power is comparatively weak, the inclusion of the agent class ‘citizens’ is a must. This means partial reorganisation of the model framework and the computer codes.
The generalised spatial environment in the model, a concentric abstract urban space, is another aspect with room for improvement. The limitation of this presupposed structure is obvious, especially in widely observed multi-centric cities/city regions. One solution to this is to use spatial information of urban geography in the model by integrating GIS technology. This is a promising prospect but the challenge lies in the data inter-operability and the synchronisation of the time interval between these two domains (some developments have already been implemented towards this goal, please see Liu et al., 2016). Furthermore, there are other possible improvements, such as endowing the agents with learning ability, inclusion of the social networks of the firms and the workers, etc.
Despite the limitations, this research provides a framework which not only captures the top-down decision process from the government, but also the bottom-up process which includes the intercommunication between the firms and the workers, and the competition among the firms and the workers in the office market and housing market, respectively. It offers new insights into the development of creative industries and its implications for urban land use. It reveals that the spatial distribution of both the creative firms and the creative workers evolves in a periodical pattern, even when the exogenous urban economic condition is steady (albeit the fluctuation of the spatial distribution of creative firms being very small and that of the workers suffering from intensive oscillation). As a result, after the boom period, the spatial distribution and the spatial clustering pattern of the workers fluctuate correspondingly; but for the firm, values of the two variables are almost steady. Scenario analysis further indicates that more open job/rent market information will lead to more rapid geographical clustering of the creative firms and the creative workers, which possibly may reduce time cost in their spatial evolvement. And, as geographical proximity can enhance the opportunity for face-to-face interviews, information exchange and so on (Dainov and Sauka, 2010), offering more information about land price to the firms and housing rent to the workers by the urban government can fundamentally accelerate innovation within creative industries.
Footnotes
Funding
We would like to give our special thanks for the support of the following institutions: (1) China Scholarship Council (CSC); (2) the University of Cambridge, in particular: Cambridge Trusts, the Lab of Interdisciplinary Spatial Analysis (LISA Lab), and the Department of Land Economy; (3) The Recruitment Program of Global Experts (Youth Group) of China (Grant No. D1218006); and (4) the Independent Research Grant from HUST (Grant No. 2015MS106).