
Abstract
Governments worldwide have responded to housing affordability challenges with supply-side solutions. Proponents of these approaches often draw on the notion of ‘filtering effects’ to argue that new supply naturally trickles down to lower-income households over time, improving affordability. This study examines the characteristics of Naturally Occurring Affordable Housing in Melbourne, Australia, analysing how dwelling age impacts rental cost. We specify a non-linear relationship between building age and rents through hedonic rent modelling, reflecting a premium for historic properties in inner Melbourne. We also conduct a cluster analysis of rental listings and measure affordability by cluster. Our results problematise the notion of filtering, finding that most contemporary affordable housing was initially built in the 1960s and 1970s as social housing or targeted at low-income households. We argue that filtering in this instance is not natural but is instead a reflection of historic government expenditure and past construction choices, or ‘filter up’.
Introduction
At the height of Australia’s post-2008 housing boom, policy experts took to the pages of The Conversation to debate whether eliminating zoning restrictions would reduce home prices by spurring new supply (Daley et al., 2018). Critics of this reasoning argued that the assumed mechanism by which new housing becomes affordable, known as filtering, stands on empirically weak grounds (Gurran et al., 2018). The debate remains unsettled, yet both sides appear to agree that more research on Australian rental housing markets is needed. In the international context, filtering refers ‘to the movement of housing stock from higher- to lower-income households as it ages and deteriorates’, with an understanding that ageing and deterioration drive prices down to affordable levels (CMHC, 2004). There is stark international disagreement surrounding the importance of filtering effects and the role of housing supply in achieving affordability generally. Support for filtering is perhaps most pronounced in the US, where scholars have raised concerns about ‘supply sceptics’ and confidently asserted that ‘adding more homes moderates price increases and therefore makes housing more affordable to low- and moderate-income families’ (Been et al., 2019: 25). In contrast, scholars from the UK have referred to the ‘supply-side preoccupation’ that serves predominantly to deflect policy attention from approaches that might mediate demand (Gallant et al., 2017: 2208). This study engages in this debate by examining rental housing affordability with respect to building age in Melbourne, Australia’s second largest city. The concept of filtering relies, in part, on the assumption that ageing units become more affordable, an assumption we explore empirically.
Ageing rental properties are considered an important source of what the grey literature calls ‘naturally occurring affordable housing’ (NOAH), or rental housing affordable to tenants on lower incomes that exists without public subsidy (Blue Cross Blue Shield Minnesota, n.d.). Particularly in North America, the idea that expensive new-build housing becomes increasingly affordable as it deteriorates has been part of the housing canon since at least the 1940s (Ratcliff, 1945). The process is sometimes used to explain neighbourhood succession (Kim et al., 2013). It is the only market mechanism that can increase the supply of housing that rents or sells below the economic cost of new dwellings. As such, the filtering phenomenon is often implicitly or explicitly used to justify new housing supply as an answer (or only answer) to housing affordability challenges. Despite this, filtering has been substantially critiqued for over-simplifying processes of housing consumption and trading (Baer and Williamson, 1988), and refuted as an effective solution to the housing problems of very low-income households, at least in the United States (Galster, 1996).
There has been relatively little research into filtering in Australia, the focus of our study. This is partially due to data limitations – in particular, the lack of Australian equivalent resources like the American Housing Survey in the US and GeoSwede in Sweden, which scholars have examined extensively for evidence of filtering (Rosenthal, 2014; Somerville and Holmes, 2001; Turner, 2008). Recent discussion in Australia of the spatial distribution of market-provided affordable housing options has focused on the suburbanisation of disadvantage, as lower-income households pursue less expensive housing on city peripheries (Randolph and Tice, 2014, 2017). Wood et al. (2006) highlighted a general shift in the distribution of rents upwards as the share of affordable rentals declined, which aligns with traditional supply and demand theories and impacts on prices (Wood et al., 2006). This loss of lower-cost rentals is exacerbated by the presence of higher-income households occupying the once more affordable dwellings, further reducing the limited availability of affordable rental stock for low-income people (Hulse et al., 2014). These findings challenge central arguments of filtering in that higher-income households are not necessarily choosing to occupy newer, higher-quality housing despite a construction boom (Gurran and Phibbs, 2016).
This study sets out to analyse the characteristics of unsubsidised affordable rental housing in Australia’s second largest city, Melbourne, paying close attention to the role of building age. We conduct random eigenvector spatial filtering models on rental listings data from two census years, 2011 and 2016, to specify a relationship between building age and rents. We then conduct a cluster analysis to develop a typology of the rental listings based on building age, socio-economic disadvantage, distance to the Central Business District (CBD) and other relevant variables. We compare the share of affordable listings across this typology to interrogate the interrelationship between building age, spatial polarisation and rental affordability. Our discussion includes Google Street View images of listings close to the empirical centroid of each cluster (e.g. the most representative listings in each cluster). This article begins with a brief overview of literature pertaining to filtering and building age in rental modelling before focusing on the characteristics of the Australian rental market. We then present our methodology and discuss findings. We conclude with a discussion of the policy implications of our results.
Literature review: Filtering, gentrification and the suburbanisation of disadvantage
Filtering models conceptualise housing markets as a chain of submarkets of differing products (apartments versus houses) at different levels of quality in different neighbourhoods. Filtering holds that a supply increase in a high-quality submarket brings prices down there, triggering a chain of responses that enables lower-income households to move into better-quality units. Major debates on filtering in the post-war era, however, concluded with researchers finding that ‘filtering is an inefficient vehicle for aiding lower-income tenants’ as its short-term benefits can be explained by idiosyncrasies across housing submarket interactions, while any long-term benefits are likely eroded by ‘neighbourhood downgrading’ (Galster, 1996: 1803). In this context, downgrading refers to property owners pursing greater returns by transitioning from providing higher-quality, more expensive housing, to offering less expensive housing at disproportionately lower upkeep costs; it also encompasses owner abandonment of the lowest quality housing (Galster, 2001). This perspective holds that supply increases in one quality submarket impact prices in the closest submarkets, meaning that an increase in supply of middle-quality or middle-priced housing is more likely to benefit tenants at the bottom of the housing quality ladder compared to new high-end supply (Galster, 1996). A tension between views of filtering as a short-term by-product of these sub-market interactions, and views of filtering as a market-based solution to housing affordability woes, animates recent research on the topic worldwide. The impact of building ageing on prices plays a central role in the evidence base of advocates of filtering as a supply-based solution to housing affordability. We review this evidence before considering perspectives critical of filtering as a policy solution, and research arguing that broader processes of urban change produce a mirage of filtering. This leads us to conclude our review with an overview of the unique dynamics of the Australian rental housing market that may contour the filtering process, before we discuss our methodology.
The evidence on building age as a vehicle for filtering
Filtering can be measured through changes in occupant incomes over time, or declines in the value of housing over time (Immergluck et al., 2018). Building age plays a more prominent role in the latter process. Rosenthal (2014) examined the American Housing Survey (AHS) from 1985 to 2011 to model the potential for filtering to lead to a viable supply of low-income housing. He argues that ‘the long-run rate of filtering has been driven almost entirely by age-related effects’ (Rosenthal, 2014: 703). His results rely on a significant, linear relationship specified between rents and building age using AHS data. Drawing on property tax role data, a proxy for home price sales, Kim et al. (2013) model the filtering of home prices in Florida during and after the Global Financial Crisis. They suggest that filtering is a neighbourhood phenomenon, spatially clustered and linked to race and foreclosures, yet their models do highlight a significant effect of building age (Kim et al., 2013). Their results, like Rosenthal’s, may be coloured by the American economy bottoming out at the end of both studies’ time spans, 2011. More recently, Immergluck et al. explore changes in the amount of low-cost rental housing in cities of the American South at a neighbourhood level, finding some evidence of the filtering hypothesis underway in the abandonment of low-cost rental units (Immergluck et al., 2018). The assumption of a strong association between building age and housing quality, and thus price, is a strong component of filtering theory supported by a significant number of recent studies.
Is it building age or neighbourhood change?
Other research posits that neighbourhood change better explains the appearance of filtering than building age or unit deterioration. Somerville and Holmes (2001) examined the AHS’s 1984 to 1994 waves to model the effects of building and neighbourhood attributes on a unit’s likelihood of filtering. They concluded that filtering outcomes are more sensitive to neighbourhood conditions than building attributes such as age (Somerville and Holmes, 2001). They also found that affordable units are more likely to ‘filter up’ (become unaffordable) in neighbourhoods with relatively lower proportions of affordable units. These results hint at patterns of spatial polarisation underway in the markets their sample drew from. Gentrification of inner cities in Canada led one scholar there to conclude that filtering in Canada reversed, with older, affordable units becoming more expensive (Skaburskis, 2006). Skaburskis (2006) draws on non-panel microdata across three decades to argue that a combination of market pressures and preferences related to gentrification in Canadian cities have eliminated, or will soon eliminate, the affordability of the country’s ageing housing stock. A subsequent study suggests that newer high rises, not older structures, are filtering to lower-income groups in Canada (Skaburskis and Nelson, 2014).
Scandinavian scholars have treated filtering as a conceptual antonym to gentrification (Hedin et al., 2012), and have associated it with neighbourhood-level disinvestment. Hedin et al. (2012) conclude their multi-decade panel study of neighbourhood change by stating that filtering mostly accelerated in already low-income parts of Sweden’s largest cities, contributing to greater urban polarisation there. Recent analysis of longitudinal data in Finland reveals that filtering does not create widespread routes of residential mobility for low-income residents (Turner and Wessel, 2019). The strongest evidence on filtering comes from a Swedish study drawing on a panel dataset of the entire population, Geoswede, to uncover how new construction may enable greater residential mobility for different types of households through a vacancy chain analysis (Turner, 2008). Turner (2008) concludes that high-end housing in inner cities and suburbs does not create vacancy chains that filter to lower-income communities.
Despite a rich history of apartment development trends in Australia, the country’s academic literature does not provide much insight on building ageing and its relationship with housing prices or rents, preventing research on the filtering hypothesis there. Restrictions on data availability play a significant role in explaining this gap (Rambaldi et al., 2011). Australian efforts to preserve historic architecture through planning overlays are, however, associated with 10–11% property price increases (Warren et al., 2017). We found only a single empirical study considering building age and housing markets in an Australian city. Costello (2014) sought to decompose land values from property sales prices in Perth. That study appears to contradict filtering theory by specifying a positive correlation between property price growth and building age (Costello, 2014); however, Costello did not design a model for that purpose.
Our first contribution is to utilise Australian empirical evidence in examining the role of building age in driving price filtering through housing markets. We ask: what is the relationship between building age and rents in the Australian private rental system? The literature’s discord on the relative importance of building age versus neighbourhood change in the filtering process leads us to consider a second, related question: how should the relationship between building age and rents be understood in spatially polarised cities such as Australia’s (Randolph and Tice, 2017)? The remainder of this review considers evidence relevant to the latter question.
Market dynamics of Australian cities
What international scholars might recognise as an ‘urban inversion’ (Ehrenhalt, 2012) is largely complete in Australian cities (Randolph and Tice, 2014, 2017). As Hulse and Reynolds (2018: 1667) argue: the contemporary story of disadvantaged suburbs in Melbourne, as in Australia’s other major cities, is not primarily about a cycle of decline, abandonment and reinvestment in inner cities. It is about suburban disadvantage in established areas further from city centres.
They identify a key role for buy-to-let investors who drove up house prices and, to a lesser extent, rental costs in disadvantaged locations. For many suburbs, these changes did not result in the displacement of these households to areas further from the CBD.
In Australia, rapidly appreciating land prices in central locations in capital cities have substantially offset any decline in the value of dwellings (Hulse and Yates, 2017). Consequently, there is very little evidence of filtering in inner and middle suburbs. Increasing land values have encouraged renovation, knock-down rebuild or the construction of poorly-located or extremely small dwellings aimed at niche markets like students (Pinnegar et al., 2010). Scholars have utilised Australia’s panel study of households to track residential relocations over time, finding that lower-income households move into more disadvantaged neighbourhoods for more affordable housing (Baker et al., 2016). Further, pockets of housing that may be considered affordable are often located nearby heavy industry or manufacturing, landfills, high traffic noise or environmental contamination; factors which have a long-held stigma that results in reduced property values and demand (Winson-Geideman et al., 2017).
The characteristics of rental stock are also different in Australia. Unlike in North America and Europe, there are few purpose-built rental dwellings and the multifamily asset sector does not exist. Despite this, Crook and Kemp (2014) draw many similarities between the Private Rental Systems of Australia, the UK and the US, as three liberal market economies typified by comparatively weak rent regulation and tenant security. Most Australian rental housing is provided through tax-supported ‘mum and dad’ residential investors, in the form of negative gearing. Similar to the UK, Australia exhibits a class of landlords who have purchased one or more residential properties as a vehicle for wealth creation and security during retirement (Ronald and Kadi, 2018). These investors can write off the losses from their residential investment properties through negative gearing and capital gains tax concessions (Verdouw et al., 2018). Unlike the UK, Australia has extremely low provision of social housing, at only 4.3% of housing stock (Groenhart and Burke, 2014), down from a peak of 8% in 1966 (Hayward, 1996). Dwellings frequently move in and out of rental tenure in this investor-focused policy context, and as a result, little is known about the condition and amenity that these homes yield.
The waves of development that provided Australian cities with much of their now deteriorating apartment stock can be characterised as investor-driven. Rapid post-war urban growth necessitated the production of a significant number of apartments as quickly and efficiently as possible (Hayward, 1996). Private builder practices in this period gave rise to Australia’s ‘six-pack flats’, frequently six-units long, two- or three-storey high walk-ups that consumed the maximum amount of floor area allowed under the planning scheme at the time, with simplistic, cost-efficient designs (Czarny, 2011; O’Hanlon, 2012). From their start, these units served immigrant and young families saving to purchase their first houses. That the city’s now deteriorating stock was built for these populations at the outset suggests that Australia’s NOAHs may be the by-product of a deteriorating sub-market. The following section outlines our methodological approaches to exploring this and other issues raised in this review.
Methodology
We empirically examine the assumption that older units become more affordable over time, an assumption underpinning filtering debates. Given that this relationship may be complicated by broader socio-spatial processes (Skaburskis, 2006; Skaburskis and Nelson, 2014), and that these processes have already transformed much of Melbourne (Randolph and Tice, 2017), we also sought to examine the availability of affordable rentals by building age and location jointly. To these ends, our research poses two questions. First, what is the relationship between building age and rents in Melbourne? Second, what are the implications of that relationship for the location, size and accessibility of affordable private rental housing in Melbourne? We answer our first question through hedonic price modelling, and explore our second question with a cluster analysis and Google Street View image search of cluster-representative listings. This section details both approaches.
Spatial eigenvector random effects modelling
Hedonic price modelling is conducted through regression, in which the dependent variable is the price or rent of units, and the predictors are unit attributes known to impact the price (e.g. number of bedrooms, baths, etc.). Our primary concern is specification of a model that provides a robust, unbiased estimate of the effect of building age on rents. Should such a properly specified model identify a negative, linear effect of building age on rent as found elsewhere (Kim et al, 2013; Rosenthal, 2014), then our results would offer further evidence that building age drives price filtering. Alternative results, in contrast, would raise questions or doubts as to the relevance of age-related filtering in explaining housing market dynamics.
Traditional hedonic price models utilising ordinary least squares bias results, as they fail to capture spatial effects (Orford, 2000). Established alternative approaches to addressing this bias include multilevel modelling (Leishman et al., 2013) and spatially lagged regression (Tse, 2002). However, our attempted multilevel models failed to converge due to a lack of adequate sample size within and across groups, while the latter approach did not produce uncorrelated residuals. To address spatial bias in a rigorous fashion, we thus turned to the newer random effects eigenvector spatial filtering (RE-ESF) model (Murakami and Griffith, 2015). This approach relies on the application of Moran’s eigenvectors to quantify spatial dependence within the dependent variable (Murakami and Griffith, 2019). The approach is computationally slow; however, Murakami and Griffith (2019) have developed a fast-RESF approach that can remove positive spatial dependence with 200 or more eigenvectors. We deployed this approach using Murakami’s R package (Murakami, 2019). Our RE-ESF models predict the natural log of rents provided in rental listings from the Australian Property Monitor (APM) for the years 2011 and 2016, as these years correspond with the Australian Census. Our model includes only random effects for postcode groupings, and the remaining variables are estimated as fixed effects.
The APM data provided key unit amenity information, which we include in our models, such as: number of bedrooms, number of bathrooms, building type (apartment, terrace, house, etc.) and number of parking spaces. We also identified all listings with descriptions that contained the words ‘renovation’ or ‘refurbishment’, and created an indicator variable to identify recently refurbished listings. We appended further information onto this dataset, as described below.
Building age
We solicited building age data from local governments, many of whom refused to share. Ultimately, we received usable data from 13 local councils out of 31 in Greater Melbourne. The resulting data coverage encompasses every local government area immediately outside of the City of Melbourne proper, which by itself consists only of the CBD and adjacent suburbs. These are the localities of Yarra, Maribyrnong, Darebin, Moonee Valley, Moreland, Stonnington and Port Phillip. Our data also includes outer suburbs to both the west (Wyndham) and east (Maroondah and Greater Dandenong) of the city. Middle suburbs are represented by data from Glen Eira, Monash and Hobsons Bay. These included municipalities constitute roughly 40% of the population of Greater Melbourne. We joined the APM listing data to building age data by address and achieved an 89% join rate.
Local amenity accessibility
We used the Housing Access Rating Tool (HART) to score each listing with respect to amenity accessibility (Palm et al., 2018). HART provides a composite amenity accessibility score for each parcel that ranges from 0 to 20. The score is calculated based on each listing’s walking distance to a suite of public and private amenities considered essential for daily life.
Neighbourhood spatial and social information
Our dataset includes several other spatial variables. In Melbourne, employment not related to serving residential populations (e.g. not food service or retail) is increasingly concentrated in and around the CBD (Watkins, 2014). As such, we estimated the Euclidian distance from every listing to the CBD, represented as Flinders Street Station, using R, software for statistics. We attempted to generate isochrone job accessibility measures, but we were unable to access temporally matching travel time skims covering the study area. We also included the neighbourhood-level Socio-Economic Indexes for Areas’ (SEIFA) Index of Relative Socio-economic Disadvantage (IRSD) score for each listing. IRSD functions as a powerful aggregation of indicators of community wellbeing used in Australian housing research (Hulse and Reynolds, 2018). We selected the state percentile rank of each suburb on ISRD to add to our listings dataset, as our empirical analysis is limited to urban Victoria. In this configuration, a higher score connotes less disadvantage. We explain our affordability definition below.
Cluster analysis
We also conducted a cluster analysis to understand how the relationship between building age and rents may be contextualised by the rapid socio-spatial polarisation of Melbourne, drawing upon the Hartigan-Wong clustering approach (Hartigan and Wong, 1979). First, we limited our data to those variables that we sought to cluster listings on: building age, distance to Flinders Street Station, year built, Housing Access Rating Tool score, suburb SEIFA percentile score and percent of suburb residents born abroad. We included the latter measure to account for the relationship between immigration patterns and affordability (Easthope et al., 2018). Second, we applied the k-means function in R to this data to produce preliminary clusters. K-means in R requires the analyst to pre-select the number of clusters. To find the optimal number of clusters, we repeated the analysis multiple times, specifying a different number of clusters: 1, 2, 3 … to 16. For each run we calculated the within-group sum of squares (WSS), or the amount of difference between observations within the same clusters in terms of variable inputs (age, SEIFA, etc.). The inclusion of an additional cluster almost always reduces the WSS, but with each added cluster the marginal improvement in the WSS diminishes. Analysts are encouraged to plot WSS by number of clusters, and to select the number of clusters wherein the marginal reduction in WSS starts to level off, similar to the scree test in factor analysis (Everitt and Hothorn, 2010). Based on this approach, we selected four clusters.
The answers to our first two questions led to a third: what are the characteristics of the naturally occurring affordable stock in inner Melbourne, as compared to unaffordable stock of otherwise similar sizes and in similar locations? To explore this question, we conducted Google Street View image searches of dozens of affordable and unaffordable units in inner Melbourne, starting with the most statistically central or representative observations in each of our four clusters. We identified the most representative listings using the flexclust package in R (Leisch et al., 2018). We incorporate these examples into our cluster analysis results, and utilise established construction typologies to identify six-pack flats and likely former public housing units (Vines et al., 1996).
Defining affordability levels within clusters
We use the 30/40 rule of affordability, a measure widely adopted by Australian government entities and academics (Rowley and Ong, 2012). The 30/40 rule holds that a dwelling is affordable when a household on the 40th percentile income of Australia’s national income distribution would pay no more than 30% of its income on that dwelling (Hulse et al., 2014). In Australia, where rents are reported on a weekly basis, this translates to an affordability benchmark of AU$377 a week in 2016 and AU$322 a week in 2011. Scholars recognise several limitations of the 30/40 rule, including no accounting for transport costs and insensitivity to the divergent housing needs and financial constraints of different demographic groups, such as seniors versus families with children (Palm and Whitzman, 2020). However, the 30/40 rule remains the most widely adopted definition of housing affordability in Australia, and is thus adopted in our approach with a caveat. Use of this measure limits our analysis to only making general claims about ageing rental units and affordability, as opposed to claims about the ability of ageing units to meet the needs of the many demographic groups that the 30/40 rule averages over.
Results
Our regressions suggest that a non-linear relationship between building age and rents exists in Melbourne. These results stem from a large percentage of listings from very old, high-rent dwellings. Roughly 12% of our 2016 listings are for buildings built prior to 1940, while these older buildings make up 17% of our 2011 listings. Removing pre-1940 stock from the analysis might enable us to specify a significant linear effect of building age on rent such as that specified by Rosenthal (2014), yet we felt dropping such a large share of the sample would be inappropriate. We present RE-ESF results for fixed effects in Table 1. We note that the data provided a much larger sample in 2011 versus 2016. This decrease in listings was even across space and by building type, leading us to conclude that the difference in sample size may reflect a tightening of the rental market between these years.
Random effects eigenvector spatial filtering model results on log rent.
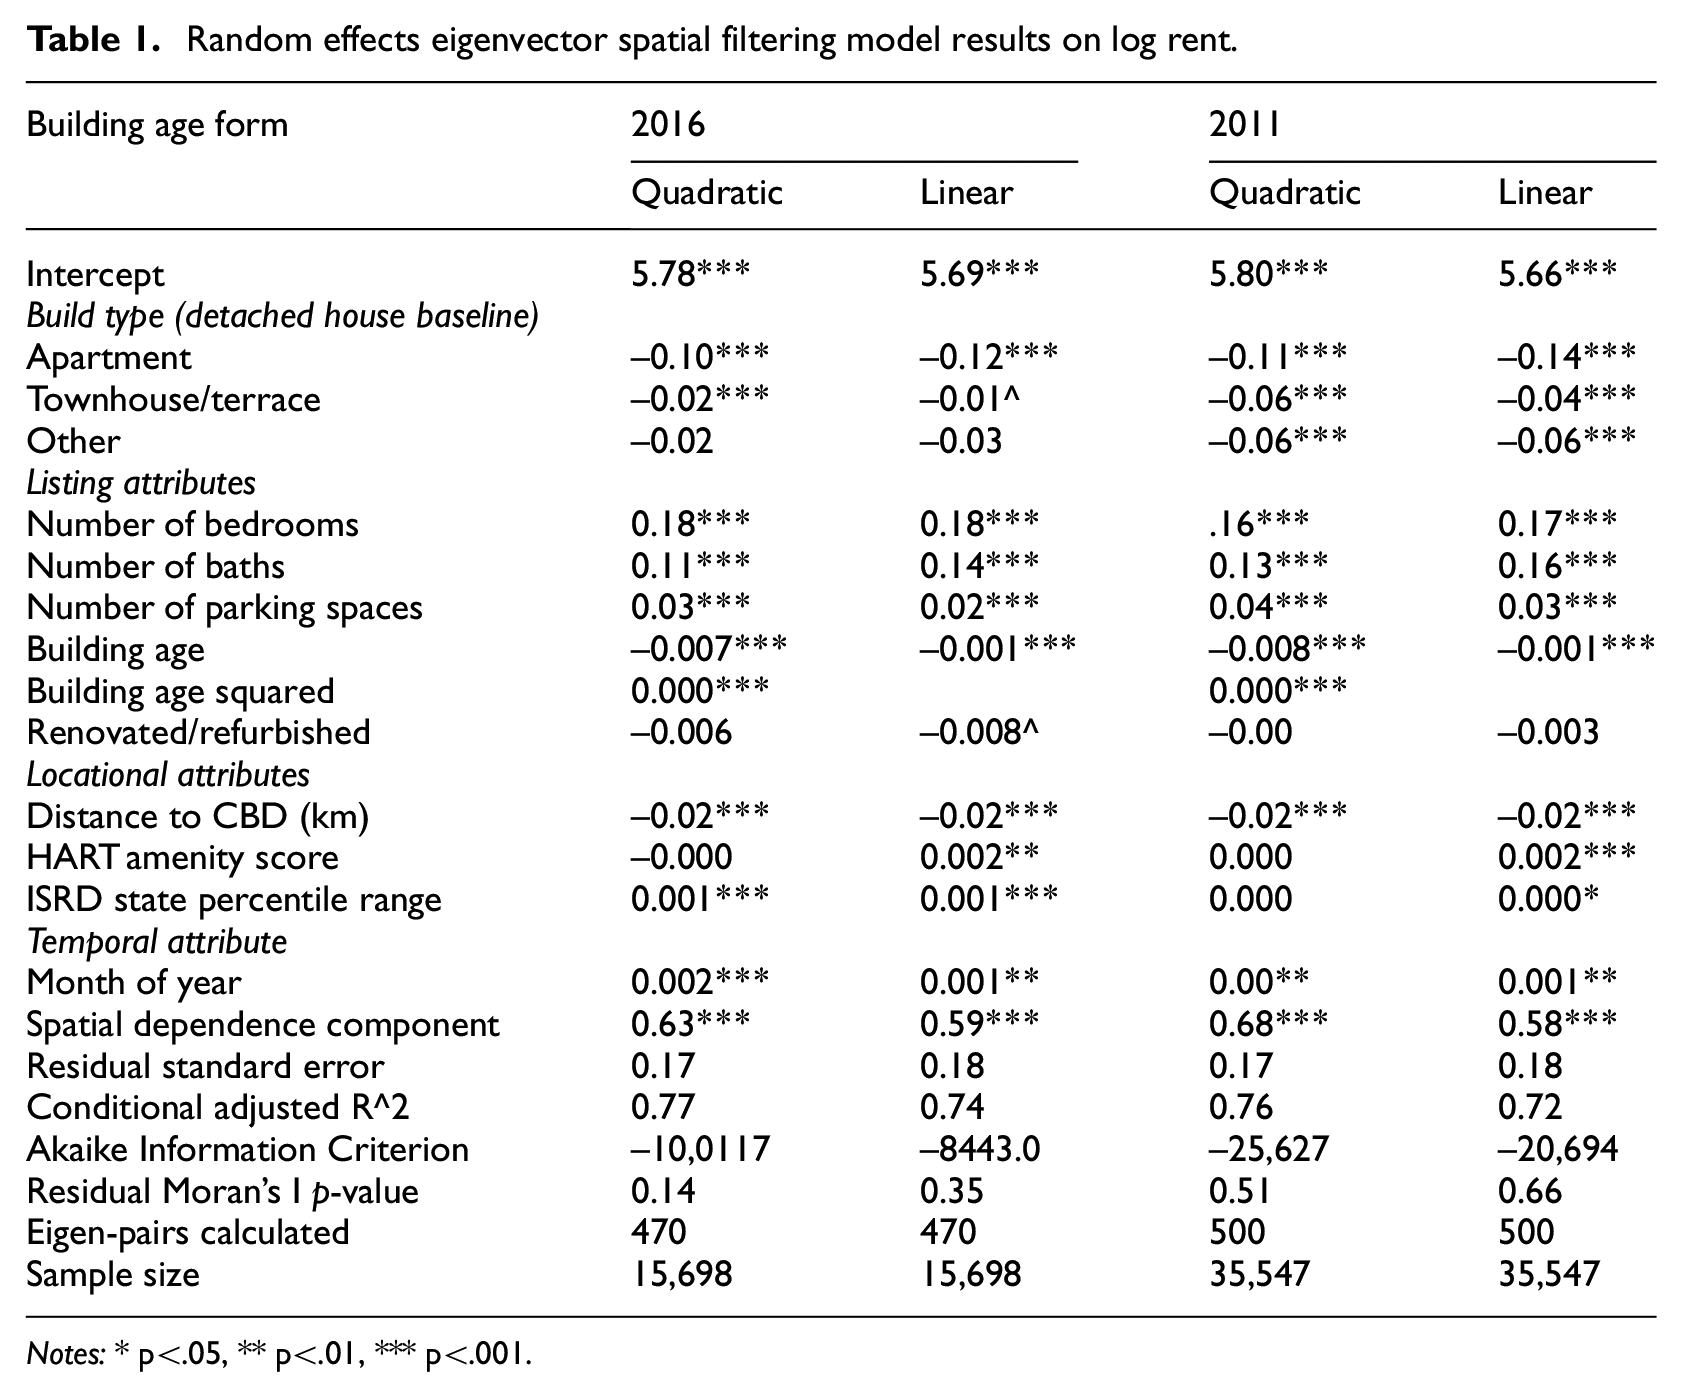
Notes: * p<.05, ** p<.01, *** p<.001.
The numbers of bedrooms, bathrooms and parking spaces correlate positively with rents, as do all non-apartment building types when apartments are the reference group. Our models specify a highly inelastic relationship between distance to the CBD and rents, with rents estimated to decline just 2% per kilometre away from Flinders Street Station. The IRSD rank is positive as expected, but only significant for 2016. Our amenity accessibility score is positive, but only significant in models with building age in a linear form. Mention of refurbishment or renovation in the listing is largely insignificant across our models.
The results in Table 1 indicate that a quadratic functional form for building age provides a more robust model fit. These models perform better according to both the AIC and adjusted R-squared statistics. These results suggest that the assumption that building ageing drives price filtering does not fit our case study. Instead, historic properties command a premium that makes them less affordable, even after controlling for recent renovations and refurbishments. Defenders of filtering as a source of affordable housing could point to the nadir in the relationship between building age and rent, at around 50 to 70 years of age, and argue for the existence of some price filtering in our results. The following cluster analysis, however, reveals that the affordable units in this age range were never built for the high price market, suggesting any hint of price filtering in our data is mostly a mirage created by trends in housing construction since the Second World War.
Cluster results
Table 2 presents the average value in each cluster for variables used to construct the clusters, along with the percent of listings affordable in each cluster. We order clusters by average distance to Flinders Street Station (the CBD) for illustrative purposes.
Summary of rental listings clusters by average value for input variables.
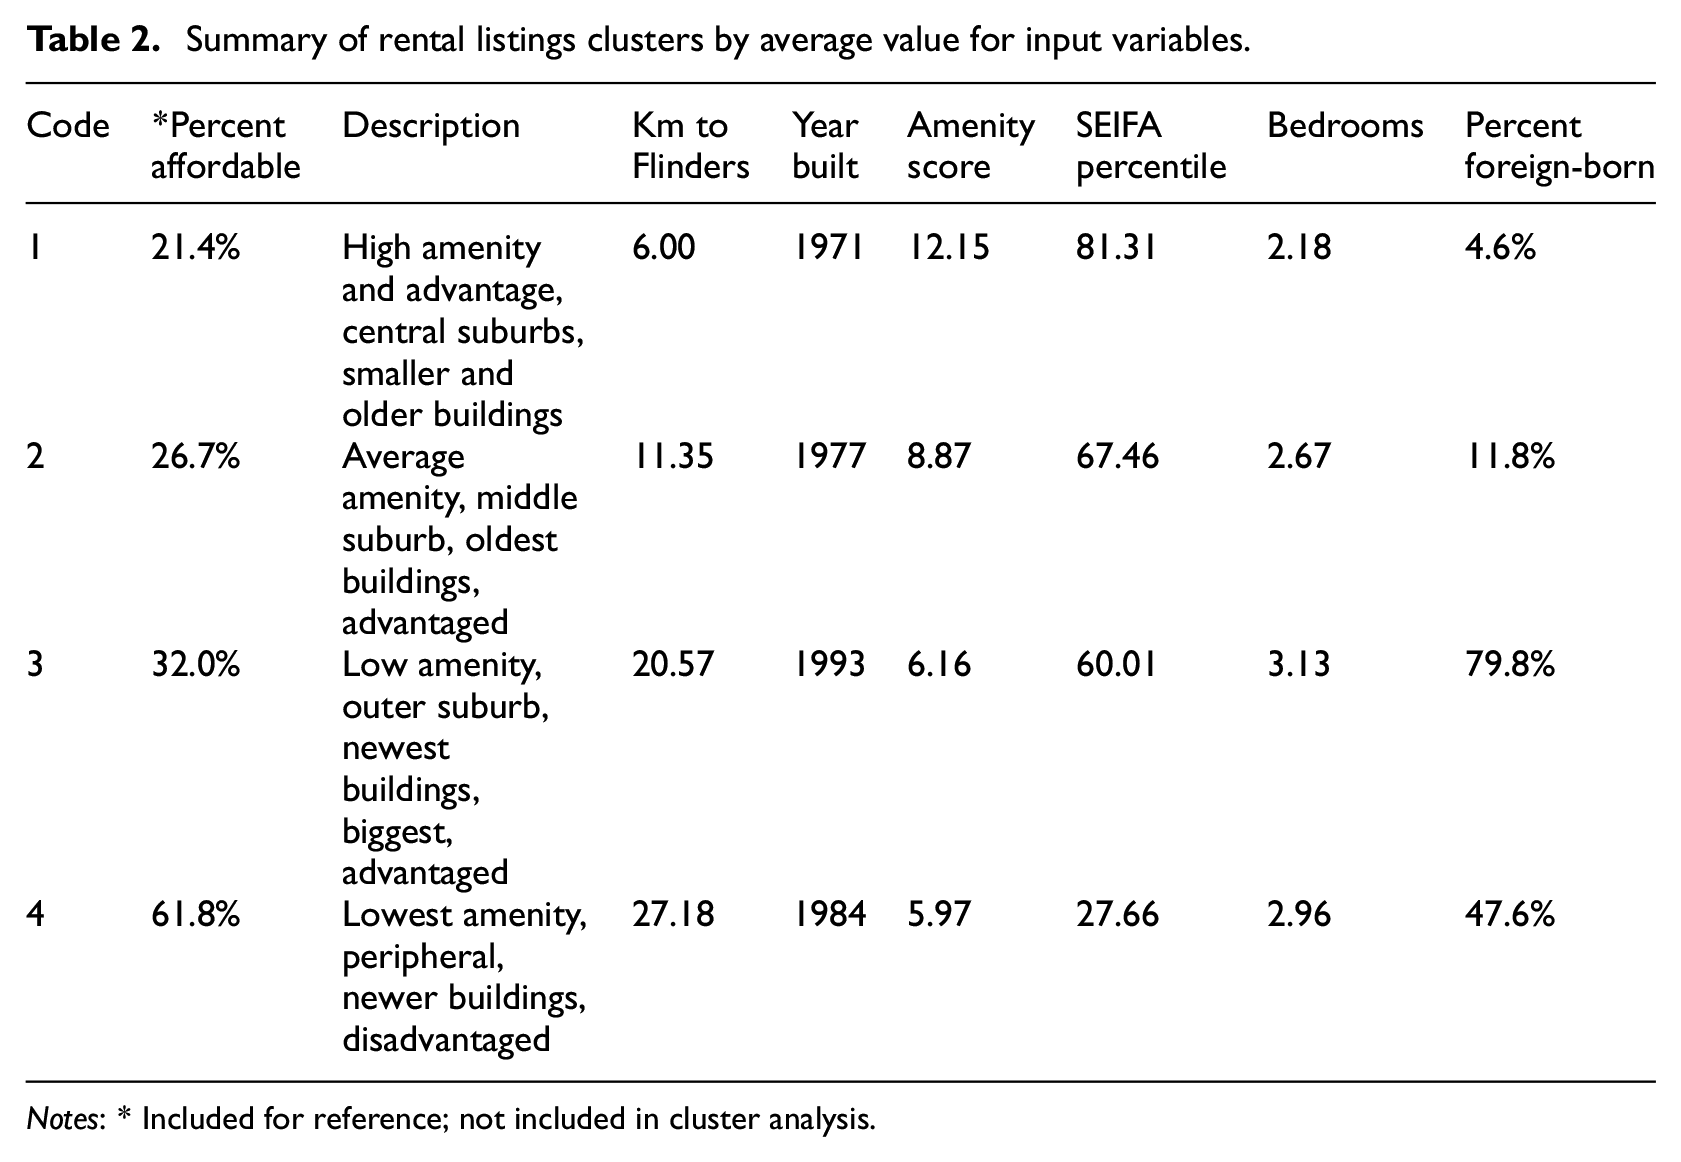
Notes: * Included for reference; not included in cluster analysis.
The results of the cluster analysis reveal a more complicated and variegated narrative than that reflected purely by filtering assumptions. We find instead that older, affordable listings reflect the architectural patterns of post-war, low-cost housing, as well as former public housing sold off in the 1960s. This suggests that a lower-cost housing submarket remained low cost, rather than filtering down from more expensive submarkets (Galster, 2001). The clusters also reflect what Randolph and Freestone (2012: 2557) referred to as a ‘complexly patterned polyglot residential mosaic … fragmented along class, geography, amenity and multicultural lines’.
Cluster 1
Cluster 1 is typified by one- and two-bedroom units built over a 150-year period in amenity-rich inner suburbs. We present representative affordable and unaffordable listings from Cluster 1 on the left half of Figure 1. The small share (21%) of dwellings that are affordable in this cluster mostly include six-pack flats constructed in the 1960s to meet the needs of young single people, immigrants or couples without children (Czarny, 2011). These units were designed to serve lower-income populations. The units were predominately purchased by investors and were usually built to maximise permissible site yield. Consequently, they reflect utility over aesthetics or quality of living (O’Hanlon, 2012). Many affordable listings in Cluster 1 possess the characteristics of walk-up public housing flats privatised in the 1960s (Hayward, 1996), recognisable by cheap construction approaches of single-brick veneer and the pre-cast concrete construction from a state-owned factory in Holmesglen (Vines et al., 1996). Most unaffordable Cluster 1 listings, in contrast, appeared to be a combination of newer apartments and historic terrace and row houses. That the affordable units in Cluster 1 are either six-pack flats or former public housing units suggests that architectural practices and housing submarket effects largely drive the nadir in the rents-building age relationship specified in our regressions. In this case, a large influx of low-cost and formerly public housing into the private, low-end market in the 1960s and 1970s has remained affordable despite surrounding gentrification.
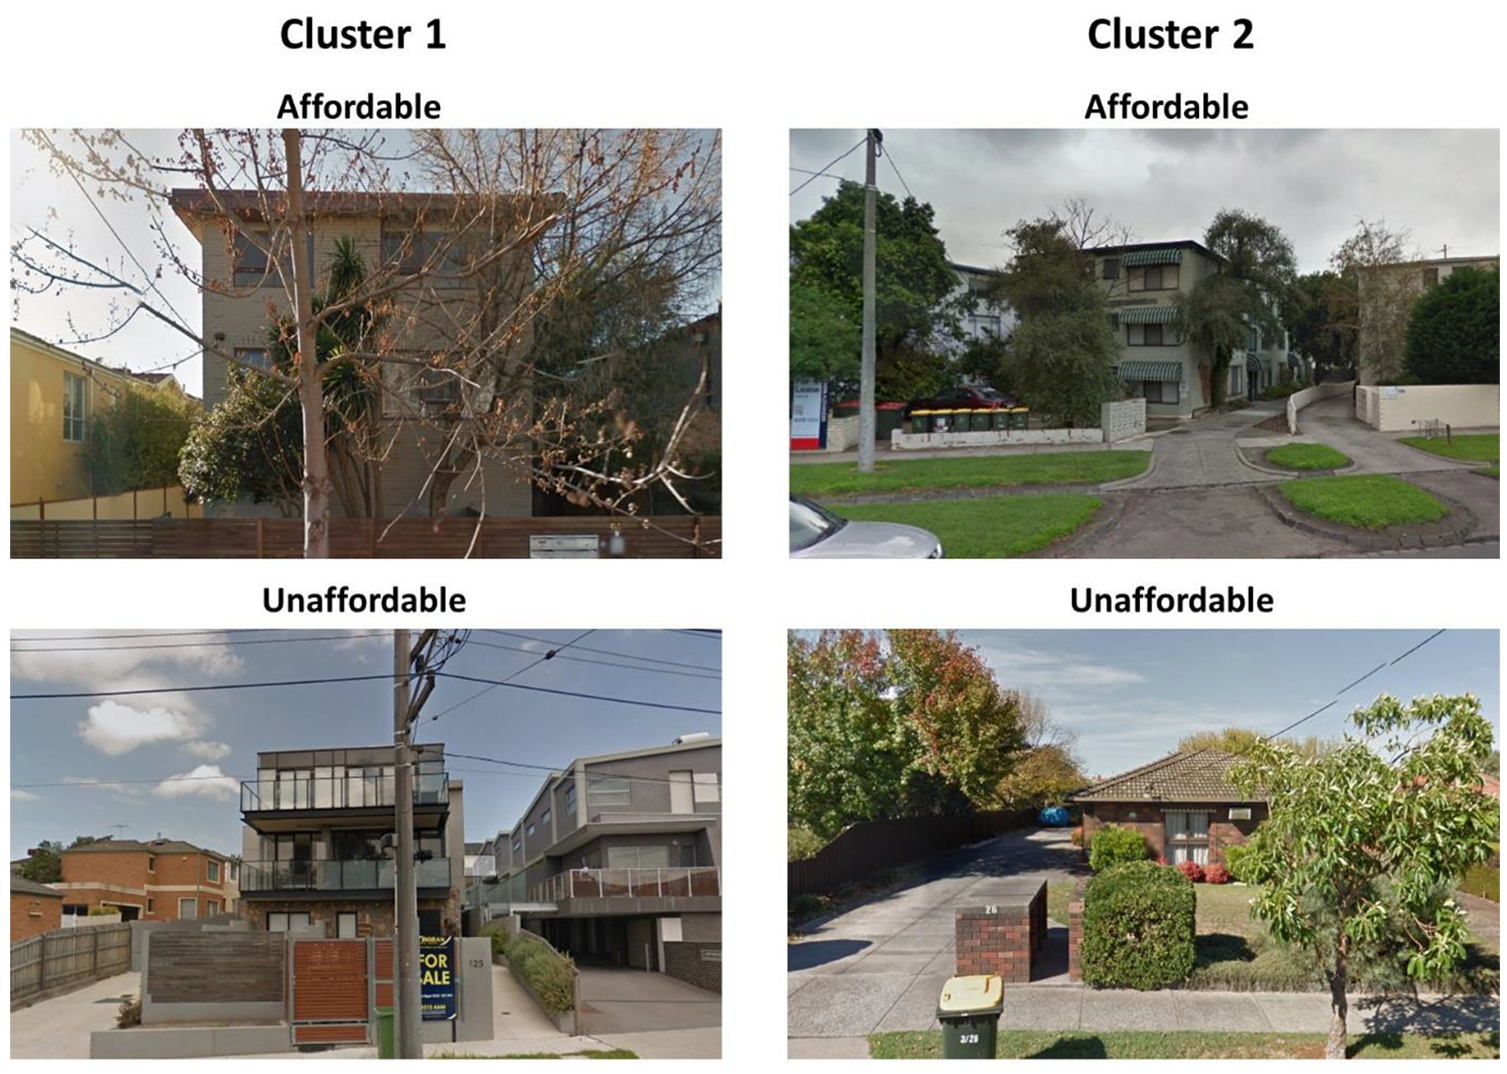
Representative affordable and unaffordable units in Clusters 1 and 2.
Cluster 2
Representative affordable and unaffordable listings for Cluster 2 are presented in the right-hand column of Figure 1. While large segments of these middle-ring suburbs have undergone renewal through processes of densification or renovation (Randolph and Freestone, 2012), pockets of unrenovated housing built in the 1950s remain and provide affordable housing in these areas. This housing was often built of brick and designed to rapidly house the population, and is considered ‘austerity’ housing, with cheap and ready building materials utilised at the expense of quality standards (Hayward, 1996; Vines et al., 1996). As in Cluster 1, many representative affordable listings in Cluster 2 included architectural features associated with the walk-up public housing stock privatised in the 1960s; a time period in which the state of Victoria sold approximately 43% of its public housing stock (Hayward, 1996).
Cluster 3
Both affordable and unaffordable dwellings in Cluster 3 were built in the late 1980s and early 1990s and are shown in Figure 2. They are located at the city periphery and are characterised by low access to amenity. These dwellings are relatively larger, typically detached houses and villas with three bedrooms, and are mostly one storey. Cluster 3 complicates the narrative of filtering, with indistinguishable age profiles between affordable and unaffordable listings.
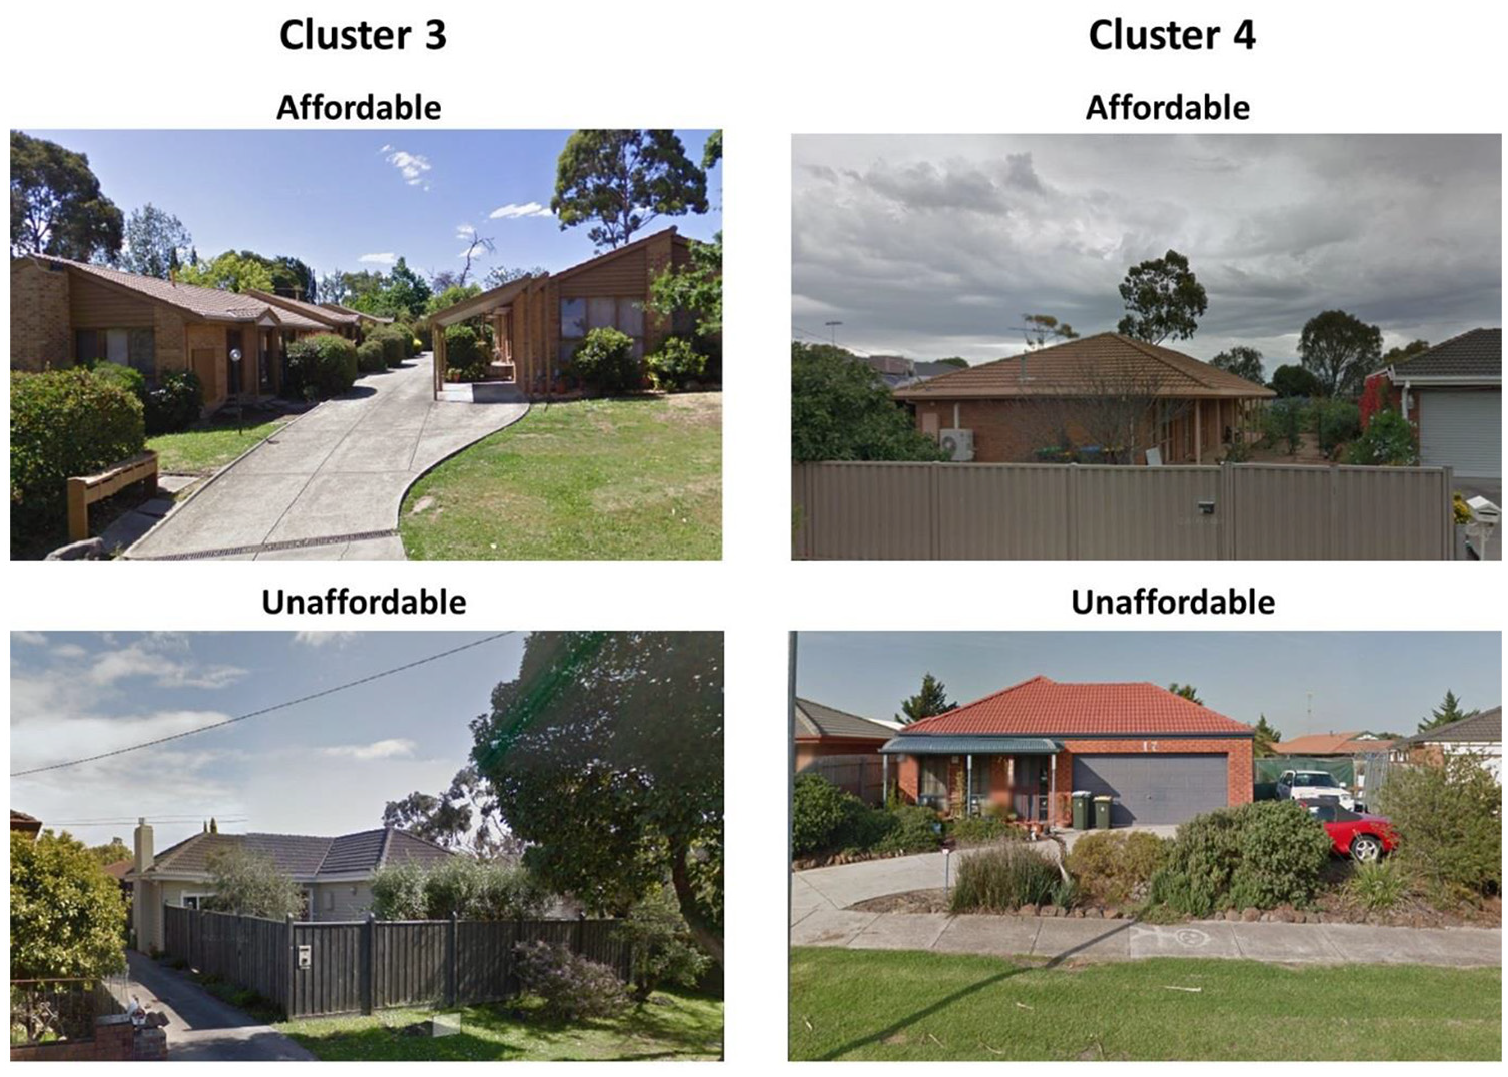
Representative affordable and unaffordable units in Clusters 3 and 4.
Cluster 4
Cluster 4 is the most disadvantaged of the four clusters. It consists of homes predominantly built during the 1980s and 1990s that are most likely to be naturally affordable (61%). This housing is located an average of 27 km from the CBD. From a visual standpoint, the affordable listings in this cluster are mostly mass-produced ‘estate-style’ housing, whilst the unaffordable listings in this cluster are more likely to reflect a ‘revival style’ that imitates older architectural trends (Vines et al., 1996). It is architectural style and other unit amenities that drive price differences within these outer suburbs, rather than building age.
Our cluster results highlight that location, not building age, primarily drives housing affordability across our case study. Cluster patterns help contextualise regression findings on the quadratic relationship between building age and rent in Melbourne. Only in the urban core does building age play a factor: most of the few affordable listings in inner and middle suburbs were built between 1955 and 1980. Pre-war housing and new housing, in contrast, is rarely affordable in these communities. Clusters 3 and 4 demonstrate that access to amenities and neighbourhood decline are far more likely to explain affordability than building age, as the age profiles of affordable and unaffordable listings in these areas are virtually indistinguishable.
Conclusion
Our results question the idea that affordability occurs ‘naturally’ over time. Returning to Galster (2001), if price filtering results from landlords downgrading units to lower-quality submarkets, our results contradict the basic premises of filtering. The bulk of private affordable housing in the urban core and middle suburbs of our case study did not filter, at least not from high-end to middle or low-end housing. These units always targeted the middle and lower segments of the rental market, either as low-cost ‘six-pack flats’ or as actual public housing units sold off to their tenants in the 1960s. In contrast, much new-build housing across countries like the US, Australia and the UK is targeted at higher-income segments of the market (Davidson and Lees, 2010; Freeman and Schuetz, 2017). Our research instead offers the international literature a clear example of housing ‘filtering up’. To our knowledge, this is one of the first examples of former public housing units serving as a reservoir of naturally affordable private rental units documented in the international literature. Our regression results add further weight to this argument. In a case study abounding with historic properties, the linear relationship between building age and rents underpinning price filtering does not hold up.
Our findings hold relevance to other parts of the world with housing markets that resemble Melbourne’s in either one of two ways. First, cities in which governments sold off or privatised public housing, such as in the UK, The Netherlands or Hong Kong, may find formerly public housing over-represented in their private market’s ‘naturally affordable’ stock. Second, urban rental markets with ample historic rental listings may exhibit a U-shaped relationship between building age and rents.
Otherwise, our findings suggest that the relationship between building age and rents in Australia more closely resembles that of Canada (Skaburskis, 2006; Skaburskis and Nelson, 2014) than of the United States (Rosenthal, 2014). Whereas filtering may just reflect neighbourhood decline in Scandinavia or the US (Galster, 2001; Hedin et al., 2012), in Australia the potential for filtering is strongly driven by architectural preferences and location.
Returning to the debate on the potential for new supply to improve housing affordability, our results re-enforce the perspective of Galster and others that supply increases in middle-quality submarkets are more likely to benefit lower-income households (Galster, 1996). Most of the affordable housing identified in inner Melbourne was once middle-income or low-income housing built during a rapid post-war housing boom. Policymakers interested in leveraging new supply to cool housing markets should thus focus on the production of middle-income and low-cost housing, as our results suggest housing built in these submarkets stays affordable over the long term.
Beyond that, programmes to provide grants for refurbishment in exchange for preserving affordable rents may help preserve this shrinking stock, an option now being piloted in the United States (Willis, 2020). Our results suggest that housing policymakers seeking to identify and preserve affordable lets in the private rental system should start with their own archives: formerly public housing. This housing may be well worth the investment from a policy standpoint, as much of the ageing, formerly public housing is in well-located areas. In contrast, low-rent housing identified in outer suburbs may be relatively new but characterised by poor accessibility to amenities. Research shows that housing in such locations usually serves to entrench disadvantage and increase non-housing costs such as transport (Dodson and Sipe, 2008).
The role of formerly public housing in the private rental system is poorly theorised with regards to filtering and other housing system concepts. This study begins filling this gap by demonstrating how sold-off public housing makes up a disproportionate share of the affordable private rental listings in the most expensive areas of a major city. Further research on the impacts of former public housing on the private rental market is needed. Additionally, the role of historic properties in the rental market – driving much of our empirical results – remains understudied and poorly understood.
Finally, we conclude by noting that we contribute new evidence on ‘filter up’ housing market dynamics because our approach incorporates historical, architectural and spatial context to regression results. Housing market theories developed without awareness of these contextual factors may do a disservice to policymakers and researchers who are working to solve housing problems across cities with diverse histories, built form and spatial trends.
Footnotes
Declaration of conflicting interests
The authors declared no potential conflicts of interest with respect to the research, authorship, and/or publication of this article.
Funding
The author(s) disclosed receipt of the following financial support for the research, authorship, and/or publication of this article: Lord Mayor’s Charitable Foundation, Launch Housing and Brotherhood of St Laurence.