






Abstract
A digital information explosion has transformed cities’ residential and educational markets in ways that are still being uncovered. Although urban stratification scholars have increasingly scrutinised whether emerging digital platforms disrupt or reproduce longstanding segregation patterns, direct links between one theoretically important form of digital information – school quality data – and neighbourhood and school segregation are rarely drawn. To clarify these dynamics, we leverage an exogenous digital information shock, in which the Los Angeles Times’ website revealed measures of a particularly important school quality proxy – schools’ value-added effectiveness – for nearly all elementary schools in the Los Angeles Unified School District. Results suggest that although the information shock had no detectable effects on residential sorting or neighbourhood racial segregation, it did exert modest effects on school sorting – particularly for Latino and Asian students – albeit not in ways that materially diminished school racial segregation because the racial compositions of high- and low-value-added schools were broadly similar both before and after the information shock. We conclude that the urban stratification implications of digital information may be more nuanced than often appreciated, with effects operating through mechanisms beyond residential segregation and reflecting racial heterogeneity in constraints and preferences vis-à-vis specific types of information.
Tectonic shifts in the USA during the 20th century, including the Great Migration, the post-war immigration boom, the decline of industrialisation and the rise of the knowledge economy, reshaped households’ residential preferences and constraints in ways that profoundly shaped race- and class-based segregation patterns. Twenty-first century America has been marked by new macro shocks: the simultaneous digital information explosion and choice-based policy expansion. Digital platforms like Zillow, Redfin and GreatSchools have largely supplanted traditional sources of neighbourhood and school information (Besbris et al., 2021; Schachner and Sampson, 2020). Meanwhile, housing and school vouchers, alongside a growing charter school sector and liberalising school enrolment regime, have empowered families to more readily act on digital information to make residential and educational decisions. The degree to which these novel shifts have reshaped segregation patterns is the subject of ongoing debates within urban research.
In the early days of digitalisation, optimists predicted that the ‘democratisation’ of neighbourhood and school quality information via digital platforms and the expansion of choice-based policies could level the playing field (Lane, 2019; Sawicki and Craig, 1996) and potentially reduce race- and class-based segregation. Digital resources might broaden access to higher-quality neighbourhood and school information and partially disintermediate discriminatory real estate brokers and social networks – both of which historically dominated contextual sorting processes in the USA (Besbris, 2020; Korver-Glenn, 2021). If true, then the strong, persistent links between household, school, and neighbourhood demographics might attenuate.
However, ecological analyses are incongruent with this story. The decrease in school and neighbourhood racial segregation among families in US metropolitan areas has stagnated in the 21st century, and by some measures has actually increased (Logan, 2013; Owens, 2017; Reardon and Owens, 2014), at the same time as choice-based public policies and digitalisation have become entrenched. A plausible direct link between digitalisation and increased segregation has emerged from recent studies that scrape and analyse Craigslist rental ads. This research suggests that: the quantity and quality of Craigslist ads is sharply higher in affluent White neighbourhoods; ads for market-rate, rather than affordable, subsidised units predominate; and racially coded ad language may constitute a new, digitalised form of racial steering (Besbris et al., 2021; Boeing et al., 2021; Kennedy et al., 2020).
Yet it may be premature to infer that digitalisation typically fuels urban inequities. Craigslist-based studies have not scrutinised the patterns and drivers of contemporary contextual sorting processes among the subset of households that has exhibited the steepest rise in residential segregation during the digital age: those with children (Owens, 2016, 2017). For these households, school information is likely to be a key driver of residential and educational decisions (Schachner and Sampson, 2020), and this information is increasingly procured for families through digital platforms beyond Craigslist (e.g. GreatSchools). Despite school quality information’s theoretical importance, research examining the effects of its digital dissemination on neighbourhood and school sorting and segregation remains scarce. Instead, scholars typically examine the effects of this information on other outcomes more tangentially related to segregation, including housing prices (Figlio and Lucas, 2004; Imberman and Lovenheim, 2016). Vanishingly few studies of digital school quality information ‘shocks’ examine their neighbourhood and school sorting and segregation effects simultaneously, even though the effects may meaningfully diverge across outcomes and contexts, especially in cities where exercising school choice is common.
To clarify these ambiguities, we ask: does the digital provision of publicly accessible information on schools’ value-added quality (i.e. their estimated causal effects on student learning) increase or decrease race-based segregation in both neighbourhoods and schools? To answer this question, we exploit a natural experiment in which the Los Angeles Times (LAT; 2022) calculated and digitally disseminated value-added measures for over 400 residentially zoned Los Angeles Unified School District (LAUSD) elementary schools on their free online platform in 2010 and 2011. We link these measures to geospatial boundaries of school catchment zones and census tracts, enabling us to gauge whether the rankings drove tract-level sociodemographic shifts after the information shock, based on American Community Survey (ACS) data. We also track school-level enrolment patterns and sociodemographic shifts pre and post shock, using annual data from the California Department of Education (CDE: 2000–2001 to 2012–2013).
Whereas prior studies suggest that information shocks revealing schools’ average test scores likely increase segregation, our results tell a more nuanced story. We find that the digital dissemination of information on schools’ value-added quality has null effects on neighbourhood sorting and segregation by race in Los Angeles. We do find detectable, if modest, effects on school enrolment patterns, particularly among Latino and Asian families, but the information-induced shifts do not appear to meaningfully change school segregation because the racial compositions of high- and low value-added schools were broadly similar. These patterns suggest that the urban stratification implications of digital information may be even more nuanced than previously assumed.
How new digital sources of information reshape or reproduce segregation processes
For over a century, a vibrant strand of urban inequality research has examined how household-level preferences and constraints interact with macroeconomic shifts and evolving normative, institutional, and informational conditions to produce race-based residential segregation (Galster, 2020). Much less is known about how information technology – specifically, the digitalisation of residential and educational markets – is impacting segregation in contemporary cities. The lack of resolution on how digital information interacts with households’ preferences and constraints to reshape urban inequities reflects theoretical ambiguities and thorny methodological challenges.
Theoretical expectations and emerging findings from Craigslist studies
In the digital revolution’s early days, some scholars and policymakers optimistically predicted that the ‘democratisation of data’ through online platforms could mitigate race- and class-based informational divides (Lane, 2019; Sawicki and Craig, 1996). This view held that institutional gatekeepers in the housing market and unequal social networks could be bypassed and that higher-quality information could be accessed online, yielding enhanced residential options for disadvantaged households. However, several decades into the digital age, most evidence suggests that racial segregation of neighbourhoods and schools in the USA has not materially declined (Krysan and Crowder, 2017; Logan, 2013; Owens, 2017; Reardon and Owens, 2014). Thus, the expansion of digital information may not only have failed to arrest these patterns; it may have exacerbated them.
There are theoretical reasons to believe that the latter proposition is true. The well-documented digital divide along race and class lines (Fairlie, 2004) may have meant that more advantaged households disproportionately accessed, and acted on, expanding digital information. Further, the content of the newly available digital information may have explicitly and implicitly stoked class- and race-based antipathies (Benjamin, 2019), further supporting advantaged households’ ability to identify – and fuelling their desire to access – privileged bastions. In contrast to the democratisation of data view, a fast-growing body of urban research supports this less sanguine perspective.
For example, several studies that scrape Craigslist rental ads find that digital information expansion in the housing market may have exacerbated residential segregation through multiple mechanisms. Craigslist’s informational benefits appear largely confined to more affluent households; households reliant on affordable/subsidised housing – disproportionately low-income – are much less likely to access relevant listings (Boeing and Waddell, 2017). Further, Whiter, more affluent communities exhibit a marked advantage vis-á-vis the quantity and quality of Craigslist unit listings (Boeing, 2020; Boeing et al., 2021). One study argues that Craigslist ads may employ a coded ‘racialised discourse’, generating new forms of residential steering (Kennedy et al., 2020).
However, this emerging body of Craigslist-based studies provides only a partial view of digital information’s segregative effects for two key reasons. First, most of the studies probe the discursive content of the digital information and its spatial patterns, rather than its actual sorting effects. Although it is possible that biases in the provision and interpretation of rental ad information have material effects on residential sorting, this possibility has rarely been tested (cf. Besbris et al., 2022). More direct, causal tests exploiting exogeneity are needed.
Second, aggregate analyses suggest that segregation is higher, and has grown more sharply during the digital age, among households with children compared to those without them (Owens, 2016, 2017). Given that family structure shapes residential preferences and constraints, aggregate estimates may obscure the varying effects of digitisation on different populations. The studies reviewed above may thus elide the informational sources and mechanisms shaping decisions of the group that is disproportionately driving residential segregation’s growth.
A strategic case: School quality information shocks’ effects on segregation
Examining the causal effects of school quality information’s digital dissemination constitutes a theoretically strategic case that helps mitigate the limitations described above. Since the late 1990s, the systematic collection and online dissemination of information on various school characteristics by state and local government agencies in the USA (Lareau and Goyette, 2014; Schachner and Sampson, 2020) and across the Global North (Ladd and Fiske, 2001) have rapidly expanded. Such dissemination has racial segregation implications only if it causes families (of at least one racial group) to sort themselves into schools or neighbourhoods that demographically diverge from their counterfactual (origin) school or neighbourhood.
Prior research suggests these criteria might be met, at least when the disseminated school quality information captures average test scores. Schools’ test score levels closely proxy the race and class composition of their students and accessing the ‘bundle’ of high-scoring, highly advantaged schools appears particularly desirable to White (Schachner, 2022b) and affluent (Rich and Jennings, 2015) families. Enrolling in these high-status schools historically required residentially relocating to their catchment zones, and affluent White families enjoyed a significant edge in pursing this school access strategy, given their well-documented advantages in navigating housing markets – particularly cost-prohibitive ones.
But contemporary dynamics of neighbourhood and school sorting are more complex, generating ambiguous expectations regarding the effect of digital school information on residential segregation. On the one hand, the expansion of school choice options and liberalised enrolment policies in many high-cost metros could reduce racial disparities in school-based residential decision-making, since neighbourhood residence and school access are no longer tightly linked. On the other hand, school-based residential decision-making may persist in ways that exacerbate segregation, if advantaged parents are disproportionately willing and able to pay a premium for geographic proximity to a high-scoring school close to their home or if they evaluate the prospects for home value appreciation based, in part, on how high-scoring the local public schools are.
Empirical evidence provides some support for the latter possibilities. Schachner and Sampson (2020) show that even in school choice-dominated Los Angeles, dissemination of schools’ average test scores may increase residential segregation, in part, because highly educated, highly skilled families, who are disproportionately White, tend to sort into neighbourhoods on the basis of them. Hasan and Kumar (2018) extend beyond Los Angeles, using the staggered roll-out of the widely used GreatSchools platform to assess the causal effects of the site’s school quality metrics – which rely heavily on average test scores – on zip code-based segregation. The platform’s expansion coincided with increased racial segregation.
Although these studies suggest that digitally supplying average test score information exacerbates neighbourhood and perhaps school segregation, average test score measures are only one type of information, and they are weakly correlated with schools’ causal effects on student learning (Deming, 2014). It would thus be premature to conclude that digitally providing school data increases segregation; the effects may depend on the specific type of school quality data provided.
The present study: Segregation effects of digitally disseminated school value-added quality information
Recent studies have attempted to clarify this possibility by assessing the effects of digitally disseminating data on school value-added in place of, or in addition to, the traditional average test score measures. The typical approach to measuring schools’ value-added quality entails estimating how much better or worse a school’s students performed on spring standardised tests (typically in Maths and/or English Language Arts (ELA)) compared to the scores that would be predicted based on its students’ baseline skill levels (i.e. test scores in the spring of year t − 1), sociodemographic characteristics, and special education status (Jennings et al., 2015; Lloyd and Schachner, 2021). Importantly, value-added measures of school quality tend to be much less strongly correlated with schools’ student sociodemographics and much more predictive of their causal effects on students’ short- and long-term outcomes than are average test score-based measures of school quality (Deming, 2014).
In the early 2010s, a natural experiment occurred, whereby LAT calculated and digitally disseminated measures capturing the value-added quality of teachers and schools for over 400 public elementary school campuses in LAUSD; the data were first released in late August 2010, and they were updated in April 2011. Scholars have subsequently leveraged this exogenous shock to gauge the effects of digital value-added information on housing prices and intra-school classroom sorting. One such study found that neighbourhood housing prices did not measurably shift in accordance with their catchment schools’ value-added ratings (Imberman and Lovenheim, 2016). Another study scrutinised within-school classroom sorting effects, finding that students who were already high-achieving became more likely to access the classrooms of teachers with high value-added ratings (Bergman and Hill, 2018). These two studies address important questions, but they do not directly tie digital school value-added quality information to neighbourhood and school segregation, as this study does.
The effect of digital school value-added quality information on neighbourhood and school segregation is more theoretically ambiguous in 21st-century Los Angeles than in other cities, during earlier time periods, because its core-city school district has seen the link between neighbourhood residence and school enrolment substantially attenuate over the past two decades. The expansion of charter schools, magnet schools, and inter- and intradistrict choice regimes has enabled LAUSD students to access a much larger school choice set than they had before. Overall, LAUSD could be characterised as evolving from an ‘enforced catchment area system’ during the 20th century to a hybrid system, somewhere between ‘open’ and ‘restricted’ choice (Boterman et al., 2019), during the 21st century. More detail on LAUSD’s hybrid choice system is provided in the Supplemental Material. It is important to note that by the 2000s, only about half of LAUSD students attended their assigned local school (Schachner, 2022b). It follows that digital information effects on neighbourhood sorting could be different from those on school sorting in Los Angeles and in the many other major cities across the Global North that have seen similar shifts in the school–neighbourhood link.
Concretely, digital value-added information could generate shifts in neighbourhood sorting and segregation if LAUSD families residentially relocate to the attendance zones of more highly rated schools. Another, rarely tested pattern is also plausible: value-added information could shape school sorting and segregation but not neighbourhood-related outcomes if, for example, Angelenos take advantage of the new information and increased school choice options to place their children in different schools from which they otherwise would have, without residentially relocating. This stationary variant of choice has received scrutiny in recent school segregation studies (Boterman, 2021; Oberti, 2020). However, most US studies examining exogenous school information shocks’ effects elide it.
This study employs the strategic case of LAUSD and the LAT information shock to clarify the complex digital information and segregation links in a choice-rich urban context. By estimating the effects of the same shock on both neighbourhood and school outcomes, using two different datasets, we clarify the potentially distinct effects of digital school quality information on multiple important domains of inequality. Moreover, by disaggregating analyses by race in a remarkably racially diverse context like Los Angeles, we illuminate how racial heterogeneity in informational preferences and constraints may operate. These unique features of our study help lay the groundwork for a richer theoretical model of digital information’s effects on urban stratification.
Data and methods
Key variables and analytical sample
To predict neighbourhood and school sorting and segregation shifts, our key independent variable is the estimate of public elementary schools’ value-added quality that was published online by LAT in April 2011 and is still accessible at https://projects.latimes.com/value-added/. The previous value-added estimates from late August 2010 were highly correlated with the April 2011 estimates but covered fewer schools and were likely published too close to the autumn 2010 semester to affect enrolment patterns during the 2010–2011 school year.
The 2011 value-added measures are based on longitudinal, student-level test score data for 2nd to 5th graders who were enrolled in LAUSD elementary schools between 2004–2005 and 2009–2010. The LAT value-added models generated a Maths-specific, ELA-specific and overall score (combining Maths and ELA) for each school. Each of the three scores was converted into quintile-based rankings, with schools labelled as least, less, average, more, and most effective vis-á-vis Maths, ELA or overall – relative to the other ranked schools. All quintile measures are time invariant, since schools were only ranked once, using student-level data pooled across six school years. For details on LAT’s value-added model specification, which generated estimates of both school- and teacher-level quality, see Buddin (2011).
This five-category classification scheme was easily interpretable by parents and freely accessible to anyone with internet access. The information was only disseminated online, not in the newspaper’s print edition, but the print edition did reference the online rankings in multiple articles. Visitors to the LAT website could easily organise all ranked schools by value-added quintile or could search for specific schools’ rankings. Prior studies document that the information shock was widely publicised in both English- and Spanish-language print publications and radio stations. It thus provides a valuable test of digital information’s effects on neighbourhood and school sorting.
Accounting for pre-shock school quality information: The academic performance index
These value-added measures were not the only school quality proxies available to Angelenos during the timeframe in question. Between the 1998–1999 and 2012–2013 school years, CDE calculated a standardised, widely disseminated measure of the average test scores (the type of measure that most prior work on school information effects employs) of nearly every public school in California, including all LAT-ranked schools. This measure, known as the Academic Performance Index (API), aggregates students’ performance on specific standardised test modules into one school-level API score for every school year. Although the precise methodology is obscure, the score itself – which ranges from 300 to 800 – is easily interpreted (see California Department of Education [CDE], 2012 for more details on the API methodology). API scores were published both in print and online by LAT on an annual basis for LAUSD schools. Countless news stories covered the API scores, which were also available for free on CDE’s website.
One might intuit that parents could closely approximate schools’ value-added rankings based on the API information that pre-dated the rankings’ release. However, this is not the case. Although both sets of metrics were intended to capture differences in school quality, schools with high average levels of test scores do not consistently exhibit higher rates of sociodemographically adjusted (i.e. value-added) growth in test scores. Indeed, Imberman and Lovenheim (2016) show that the API and LAT value-added rankings are not strongly correlated.
Despite this weak correlation, our multivariate models – described below – account for schools’ API rankings in predicting neighbourhood and school sorting outcomes for several reasons. First, prior work suggests that many Los Angeles parents were aware of the API rankings and a subset made neighbourhood and school decisions based on them during the 2000s and 2010s (Schachner and Sampson, 2020); excluding API-based controls could thus induce modest bias in our estimated effects of LAT rankings, particularly for certain groups. Relatedly, although our focus is primarily on the effects of the LAT value-added rankings, it is instructive to benchmark the magnitude of these effects to those generated by the ubiquitous API school quality rankings, which pre-dated the LAT rankings by over a decade. Lastly, the inclusion of both sets of rankings enables us to examine potential interaction effects between them that mimic the complex, multidimensional nature of contemporary school decision-making. The informational ecosystem changed considerably after the 2012–2013 school year, when the CDE discontinued its calculation and use of API scores, so we opt to end the present study’s timeframe at that point.
To generate API effect estimates that can be easily interpreted and directly benchmarked with the LAT value-added rankings’ effect estimates, we include API-based control variables operationalised in a manner that parallels the time-invariant, quintile-based construction of the LAT rankings. To this end, we first average schools’ annual API scores across the 2000–2001 to 2010–2011 school years (i.e. before the LAT information shock plausibly shaped sorting patterns) and then convert these mean scores into time-invariant quintile rankings. In addition to facilitating interpretation and benchmarking against the LAT rankings’ effects, the quintile-based construction also enables nonlinear effects of API rankings to be captured; prior research on contextual sorting suggests that neighbourhood and school features often exhibit highly nonlinear effects on residential and educational selection (Galster, 2020). Although a key trade-off of this decision is the inability to control for time-varying (i.e. lagged) measures of school API, the measure is very highly correlated from year to year, reflecting the strong link between student sociodemographics and average (rather than value-added) test scores. Thus, creating a pooled average across a full decade rather than using time-varying API scores obscures very little information about schools’ test score rank. Robustness check models, described below, that incorporate lagged, continuous operationalisations of API generate substantively similar inferences regarding LAT rankings’ effects on school and neighbourhood sorting, as do models that exclude any measure of API.
We link the LAT and API rankings, which exhibit a ∼0.10 correlation in our analytical sample (see transition matrix showing the joint distribution of value-added and API quintiles in the Supplemental Material – Table A1), to CDE annual school enrolment data from the school years 2000–2001 to 2012–2013. We then use multivariate models (described below) that assess quintile-based stratification in schools’ annual K–5 enrolment change both before (2000–2001 to 2010–2011) and after (2011–2012 and 2012–2013) the spring 2011 LAT information shock.
Our core school-level outcomes are total, and race-disaggregated, K–5 school enrolment. Including these enrolment measures helps us assess, first, whether schools’ total enrolment levels shift with value-added rankings and then, whether there is racial heterogeneity in enrolment shifts, with potentially important school segregation implications. We also examine the information shock’s impact on neighbourhood sorting. Specifically, we assign every census tract (in 2010 boundaries) within LAUSD to the elementary school whose catchment boundaries capture the largest portion of the tract’s elementary school-aged population (ages 5–9), and then characterise the tract by the school’s value-added quintile, if available. We examine the total, and race-disaggregated, number of children under age 10, within each tract pre and post information shock, using ACS 2007–2011 and 2012–2016 five-year average data, respectively. In robustness checks, we estimate the value-added rankings’ effects on all neighbourhood outcomes measured during later periods of time (i.e. ACS 2013–2017 and 2014–2018), in case the effects exhibit a temporal lag given the considerable time required to consider, prepare for, and complete a residential move.
We also run robustness check models that switch our outcomes from total and race-disaggregated school enrolment and neighbourhood child population levels to racial shares of our analytical sample schools’ K-5 enrolment and neighbourhoods’ child population. Our primary focus on enrolment and population levels (versus racial shares) maximises the study’s policy relevance at a time when large urban districts like LAUSD are suffering widely publicised enrolment woes and are considering whether certain informational interventions could partially mitigate them. However, we report the results of analyses predicting both levels and racial shares below.
Of the 470 LAT-ranked elementary schools, our core analytical sample consists of the 419 LAUSD schools that were matched with CDE’s official enrolment data for some portion of the study timeframe and enrolled at least one student across grades K–5 for every school year during the timeframe (see more detailed sample specification information in the Supplemental Material – Methodological Appendix). These 419 schools have: uninterrupted annual enrolment at K–5 for all 13 years; school-level value-added quintile rankings on the LAT website; and valid measures of all control variables below (School Year N = 5447). In robustness checks, we relax the uninterrupted annual enrolment restriction, bringing in LAT-ranked schools that opened after the 1999–2000 school year or had an unexplained gap in their enrolment data. Results remain substantively unchanged.
Our neighbourhood-level analytical sample begins with the 419 LAUSD public elementary schools in our core analytical sample and uses geospatial data on all of these schools’ catchment boundaries (as of the 2017–2018 school year) 1 to assign census tracts that are fully or partially subsumed by the catchment boundaries of the 419 campuses to one of these schools. A total of 1000 Los Angeles County tracts fit these parameters and contain values on all tract-level variables below.
Analytical strategy
School sorting models
To estimate the causal effect of LAT’s value-added school quality rankings on neighbourhood and school composition, we estimate the rankings’ effects on temporal shifts in key outcomes at both the neighbourhood (i.e. tract) and school levels. Our analytical approach for the school sorting models can be written as a three-level hierarchical linear model (HLM), with random intercepts and fixed slopes:
γ 02 (Average VA) jk ×Post-Shock ijk +
γ 03 (More Effective VA) jk ×Post-Shock ijk +
γ 04 (Most Effective VA) jk ×Post-Shock ijk +
γ 05 (Low API) jk +γ 06 (Average API) jk +γ 07 (High API)jk+
γ 08 (Highest API) jk +r0jk
The outcome is total K–5 enrolment in school year i (level 1), nested within school j (level 2), which is located within Los Angeles community area k (level 3; community area operationalisation is described in more detail below). In this model, δ 000 represents the fixed component of the community-level intercept, and v00k is the random error component of the community-level intercept. γ 00k represents the fixed component of the school-level intercept, r0jk is the random error component of the school-level intercept and eijk is the school year-specific error term. This model and all that follow assume that the random components of the community- and school-level intercepts and the school year-level residual are normally distributed with means of zero and variances of τ3 2 , τ2 2 and σ 2 , respectively.
The key parameters of interest are the four level-2 coefficients on schools’ value-added quintile rankings (γ01, γ02, γ03, γ04). Note, too, that these coefficients capture the enrolment effects of the value-added rankings interacted with a binary variable (‘Post-Shock’ above) indicating whether the school year is after the information shock occurs. The indicator equals 1 for school years 2011–2012 and 2012–2013 and 0 for 2000–2001 to 2010–2011 because the rankings were not publicised in this earlier period. Given that a one-year lagged measure of total K–5 enrolment is included in the models, a significant and positive coefficient on the value-added ranking × Post-shock interactions estimates the causal enrolment effect of a school receiving a given LAT quintile ranking compared to the lowest ranking– pending several assumptions. One key assumption is that there are no detectable pre-shock trends in the focal coefficients. Substantively, if temporal trends in school enrolment and population patterns diverged by value-added quintile ranking before these rankings were ever published, it would indicate that the information shock was, in fact, not an exogenous event or did not provide new information. We consider whether this ‘parallel’ trends assumption holds below.
To further mitigate potential internal validity threats, we include several control variables beyond API that could confound LAT value-added ranking effects on school enrolment. These controls include: academic year fixed effects; the calendar year the school opened; whether the school was a charter or had an on-site magnet school; and a parental education index (lagged one year), which is a time-varying measure calculated by CDE tracking the average educational attainment level of the parents of all students attending a given public school. The index ranges from 1 (within the school, the average student’s parents were not high school graduates) to 5 (the average student’s parents received graduate school training).
For models that predict total K–5 enrolment, we also control for schools’ racial composition (i.e. % Black, % Latino, % Asian; lagged one year) in case some families’ enrolment decisions reflect minority avoidance considerations. Models that predict race-disaggregated K–5 enrolment or racial shares do not include all of these racial composition controls, though robustness check models confirm the same substantive results regardless of whether or not they are all included. Lastly, we include fixed effects capturing the Los Angeles community area in which the schools are located. These community areas, described in the Supplemental Material – Methodological Appendix, are larger than census tracts and reflect socially meaningful community boundaries. Including the area fixed effects helps to adjust for difficult-to-measure spatial dynamics, including geographically accessible school choice sets.
Neighbourhood sorting models
To assess LAT ranking effects on neighbourhood, rather than school, sorting patterns, we switch to a two-level HLM predicting the total and race-disaggregated population under age 10 of tract i (level 1) in 2012–2016 nested within community area j (level 2). We incorporate this two-level nesting structure since error terms of geographically contiguous tracts are likely to be correlated. Note that a third level is unnecessary for tract-level models because, unlike the school model that contained 13 annual enrolment measures, we only have two measures of tract population under age 10 (one measure tracked before the shock, i.e. ACS 2007–2011, and one measure tracked after it – ACS 2012–2016, ACS 2013–2017 or ACS 2014–2018). The key coefficients are the main effects of LAT value-added quintile rankings for tracts’ assigned catchment schools; Post-Shock-quintile ranking interaction terms are unnecessary because the tract-level models only predict the outcome at one time point, post shock. For these models, we include several tract-level control variables measured in the pre-shock period (ACS 2007–2011) capturing housing market and sociodemographic factors revealed by prior research to shape residential decision-making among Angelenos with children (Schachner and Sampson, 2020) and US tracts’ sociodemographic trajectories (Schachner, 2022a). The most important control is the lagged measure of the outcome variable. Other control variables are listed in the Supplemental Material – Methodological Appendix.
Results
The descriptive statistics presented in the Supplemental Material – Tables A2 and A3 reveal overall and racially disaggregated means of child population and student enrolment levels, as well as on racial shares of neighbourhood children and elementary school populations, stratified by school value-added ranking. They also show changes in these variables from the pre- to post-shock periods across value-added rankings. The descriptive patterns of change reveal a detectable gradient emerging that corresponds to the digital information, at least for some groups. Neighbourhoods with schools ranked as most effective see larger gains in White child population from pre- to post-shock periods compared to neighbourhoods with less effective schools. Similarly, the most effective schools are the only LAUSD schools in the analytical sample to realise year-on-year total K–5 enrolment gains.
Figure 1 provides a descriptive portrait of how analytical sample schools’ annual enrolment changes vary by whether they were ranked in the top or bottom value-added ranking. Prior to the information shock, there is no clear evidence of a value-added-based difference in yearly enrolment change, which supports our parallel trends assumption. However, after the shock, the highest value-added schools see a moderation in enrolment declines, while the lowest ranked schools see continued enrolment loss. The descriptive patterns are thus congruent with the digital dissemination of value-added information spurring shifts in school enrolment decisions among a modest number of students. Some families who, in the absence of value-added information, would have sent their children to LAUSD schools with lower value-added rankings – or private, charter or non-district schools – may have instead enrolled them in LAUSD schools ranked as ‘most effective’. 2
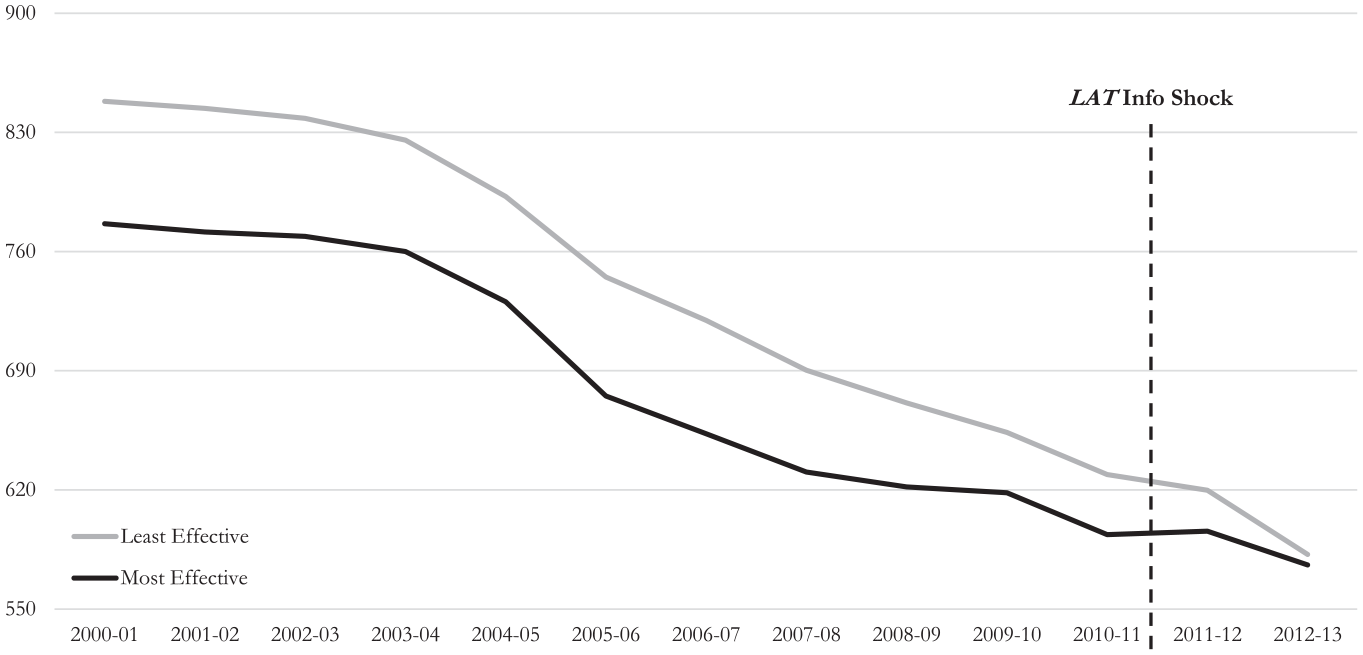
LAUSD K–5 school mean enrollment over time by Los Angeles Times value-added ranking, 2000–2001 to 2012–2013 school years (unadjusted).
Tract-level multivariate models
Table 1 presents our first set of multivariate models, gauging whether school value-added rankings stratified shifts in tracts’ populations of children under age 10. The key coefficients indicate that schools’ value-added rankings did not change the overall size of the child population residing in surrounding census tracts (Model 1). Models 2–5 predict population changes separately by child race/ethnicity. Again, no clear differences in population trends across value-added rankings emerge.
Two-level hierarchical linear models predicting neighbourhood outcomes, partial model output. Tract N = 1000, LA Community Area N = 144.
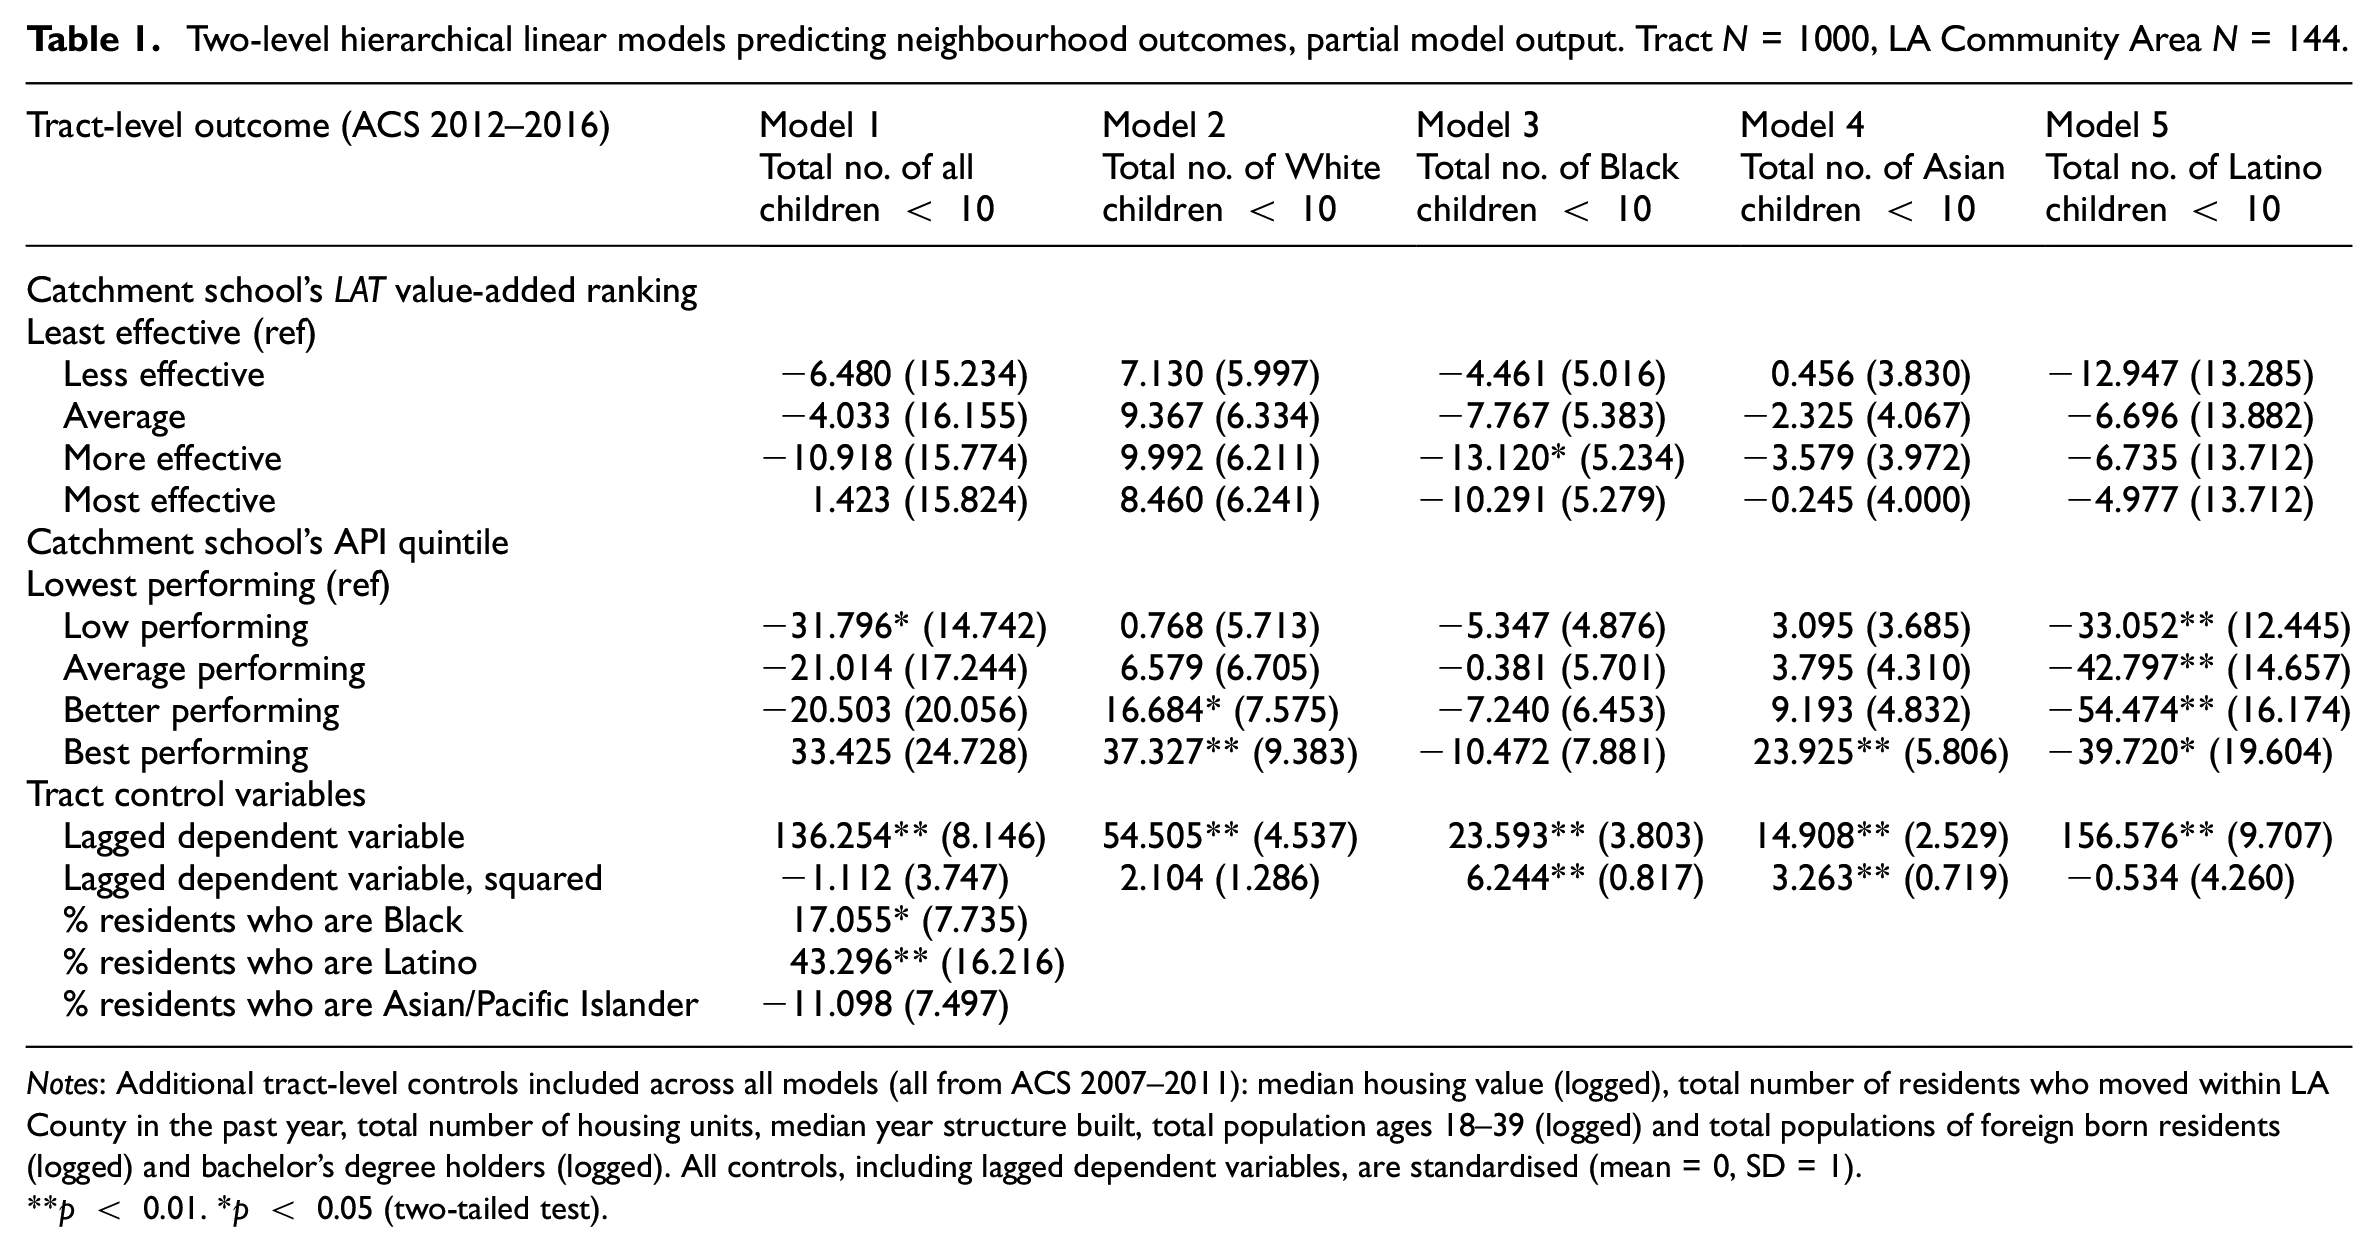
Notes: Additional tract-level controls included across all models (all from ACS 2007–2011): median housing value (logged), total number of residents who moved within LA County in the past year, total number of housing units, median year structure built, total population ages 18–39 (logged) and total populations of foreign born residents (logged) and bachelor’s degree holders (logged). All controls, including lagged dependent variables, are standardised (mean = 0, SD = 1).
** p < 0.01. *p < 0.05 (two-tailed test).
However, the middle panel shows that the more commonly scrutinised school test score level-based quality proxies may matter for some groups, in a nonlinear manner; neighbourhoods with local schools in the highest API quintiles gain more young White and Asian children over time, which we tentatively interpret as evidence that these groups exhibit disproportionate preferences for, and capacity to access, neighbourhoods in close proximity to advantaged, high-scoring schools. These types of neighbourhoods appear to lose larger numbers of Latino children over time, perhaps due to residential displacement.
Note that value-added rankings do not appear to shape these neighbourhood outcomes in subsequent timeframes either (results based on ACS 2013–2017 and 2014–2018 are presented in Table A4). The rankings also do not exhibit significant effects when the API control is operationalised as a continuous, rather than categorical, variable (Table A5), or when the outcome switches from race-disaggregated population levels to racial shares of children under 10 (see Tables A6 and A7).
School-level multivariate models
Different patterns emerge when examining school, rather than neighbourhood, outcomes (Table 2). After confirming that total K–5 enrolment and school racial composition in one year strongly predicts total K–5 enrolment in the next (Models 1–2), we gauge the independent effects of school quality rankings on enrolment levels. Starting with the longstanding test score level-based measure, API, we do not see significant effects of our API quintile measures for the total enrolment outcome (Model 3). Model 4 directly tests whether the focal value-added rankings independently shape elementary school enrolment patterns. Accounting for all controls, including the school’s API rankings, top LAT quintile-ranked elementary schools see a small but significant annual K-5 enrolment boost (estimated at ∼13 students) in the post-publication period, compared to otherwise similar schools ranked in the bottom quintile. When it comes to school enrolment, if not neighbourhood sorting, digitally disseminated value-added rankings do appear to matter, if modestly.
Three-level hierarchical linear models predicting school-year total K–5 enrolment (2000–2001 to 2012–2013).
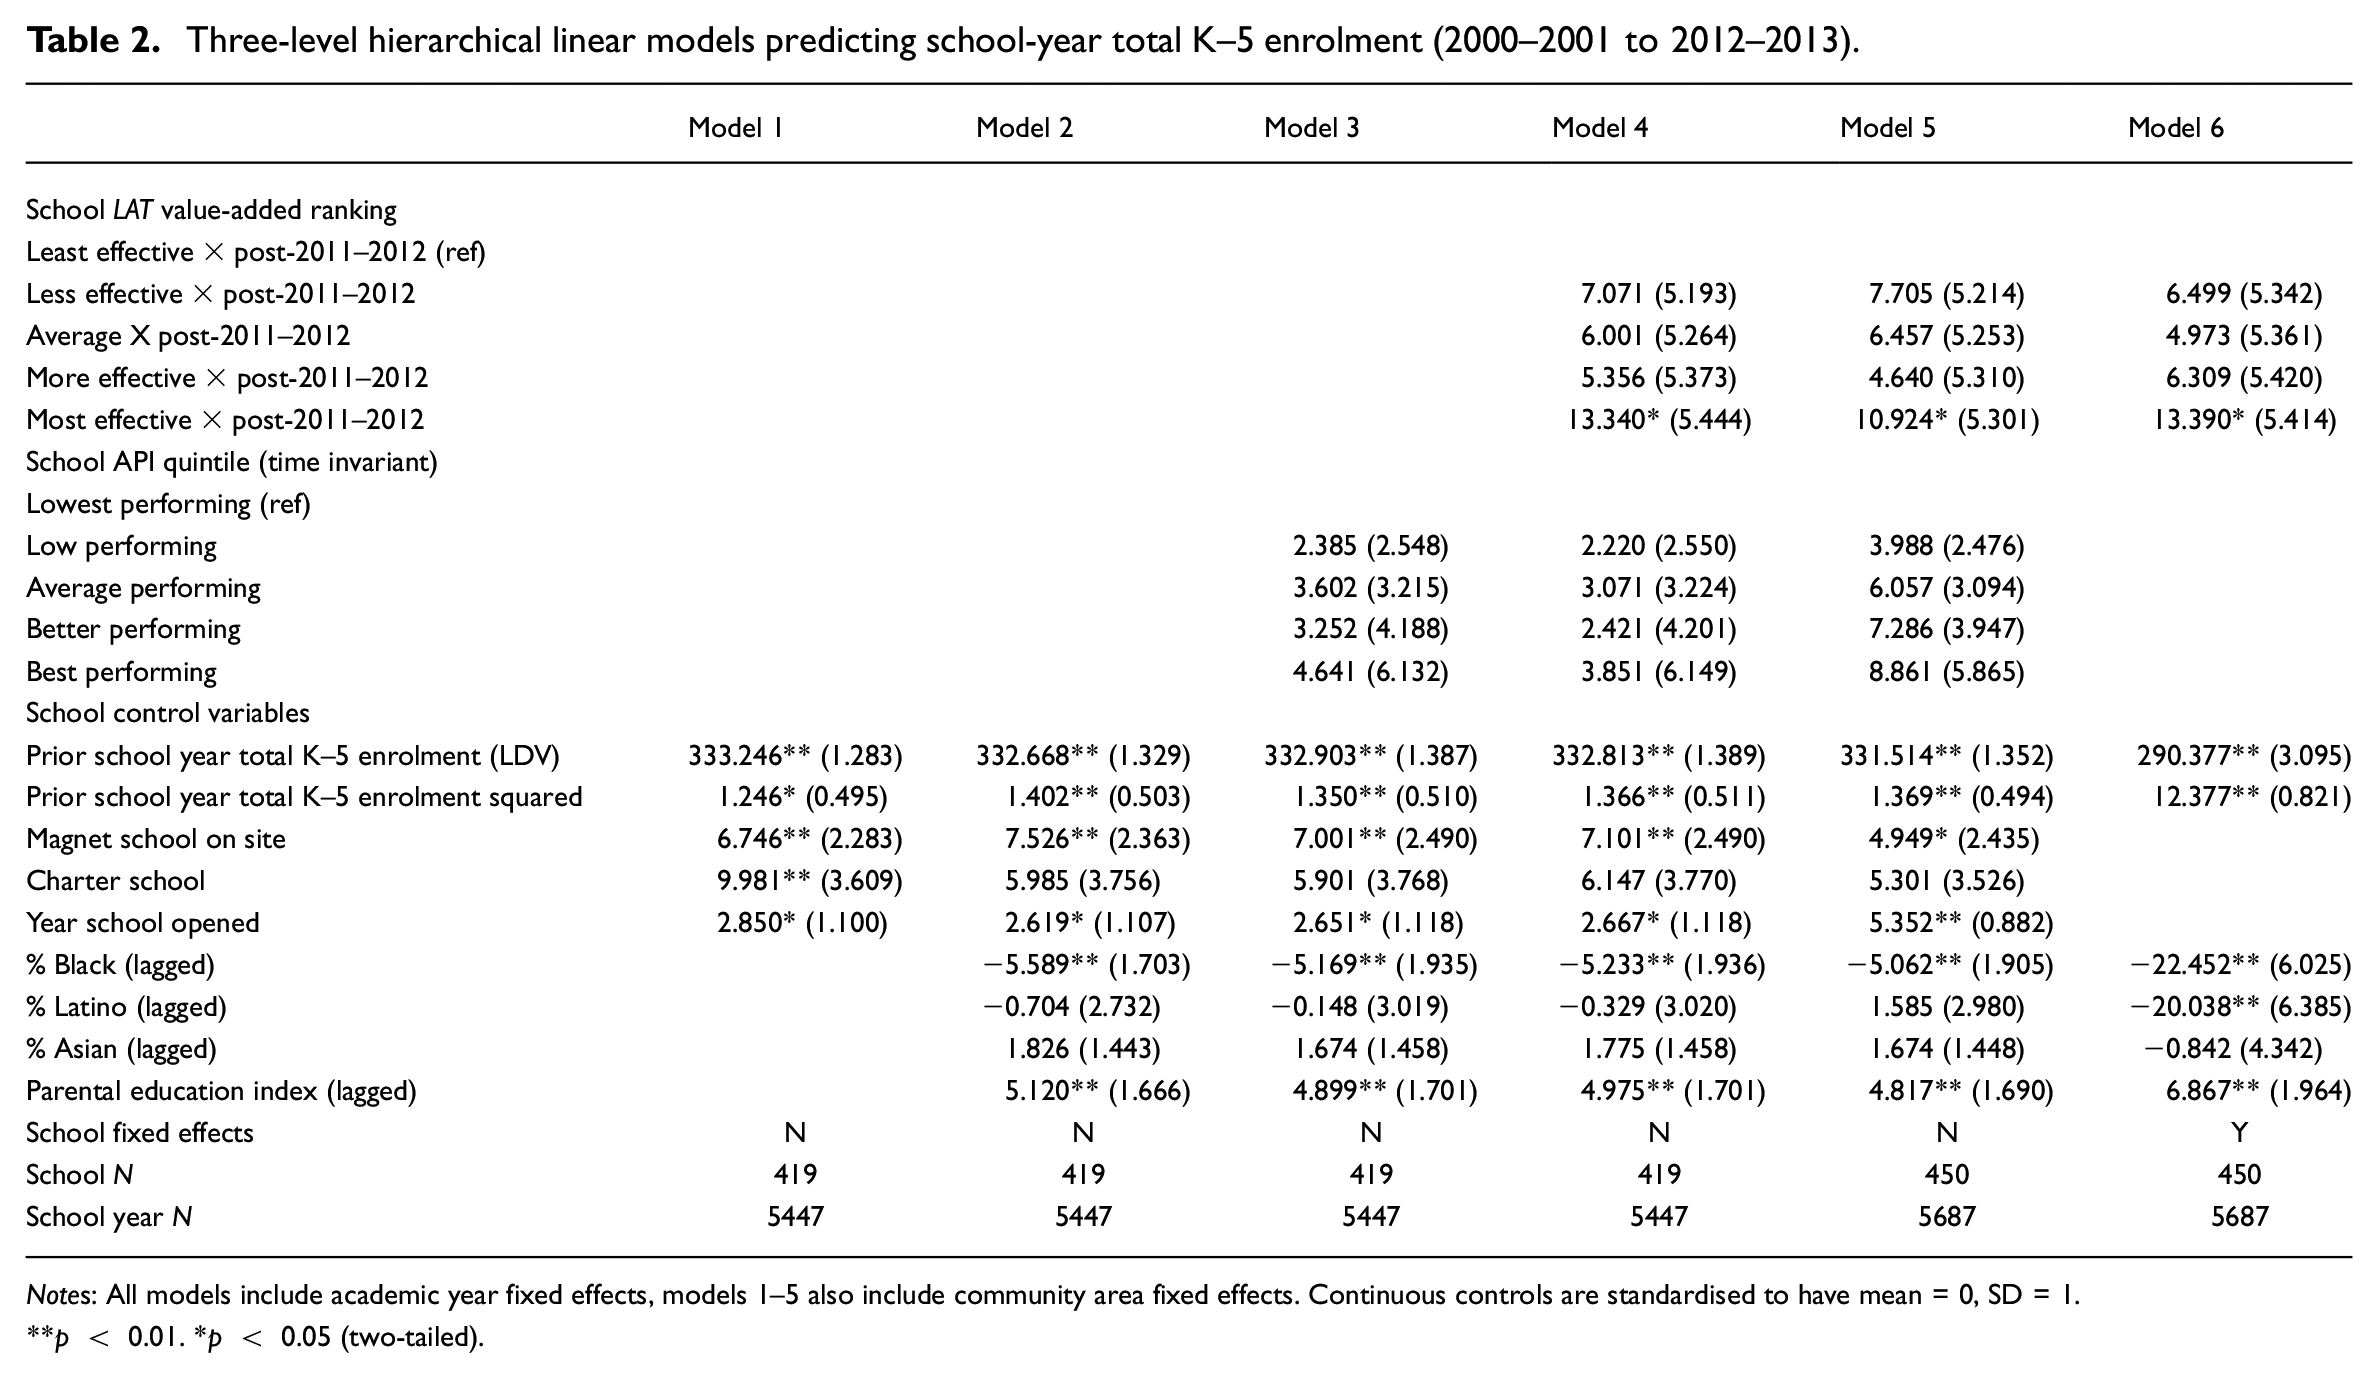
Notes: All models include academic year fixed effects, models 1–5 also include community area fixed effects. Continuous controls are standardised to have mean = 0, SD = 1.
** p < 0.01. *p < 0.05 (two-tailed).
We run several additional models to clarify whether the estimated value-added ranking effects on school enrolment growth in the 2011–2012 and 2012–2013 school years have a plausibly causal interpretation. First, we lift our analytical sample restriction pertaining to continuous K–5 enrolment, enabling us to add in 31 previously excluded LAUSD schools with value-added rankings (Model 5). In this larger analytical sample, the same patterns hold, although the focal coefficient on the most effective value-added ranking variable attenuates slightly. Finally, Model 6 preserves this larger analytical sample and adds in school-level fixed effects, which controls for all time-invariant features of schools that could confound the effects of the value-added rankings on post-2011–2012 enrolment patterns. The focal coefficient is nearly identical to that generated in Model 4: the highest value-added schools are estimated to gain approximately 13 students more than they otherwise would have been expected to enrol in pre-shock years.
Table A8 presents a series of robustness check models for the core analytical sample. Model 1 excludes the API control entirely. Models 2 and 3 restore it but use a lagged, continuous operationalisation rather than a categorical, time-invariant one, with the latter model adding in school fixed effects. Models 4 and 5 preserve the continuous API control but remove the school racial composition controls, with the latter model adding in school fixed effects. Across all five robustness check models, the focal coefficient on the highest value-added ranking variable remains significant, with a magnitude remaining in a narrow range of approximately 12–14 students.
Having increased confidence in our core results, we revisit the parallel trends assumption (see Table A9 models). Results suggest that the assumption holds; K–5 total and race-disaggregated enrolment growth is not significantly stratified by schools’LAT value-added rankings in the period before the rankings were published, but it is afterwards. The same table suggests that value-added ranking effects on total K–5 enrolment were stronger in the 2012–2013 school year than in 2011–2012. This pattern may reflect a temporal lag in parents and students adjusting their enrolment decisions based on value-added rankings.
Understanding mechanisms and implications for school segregation
We now shift to clarifying the mechanisms underlying the effects described above and, most crucially for this study’s objectives, the implications of the effects and mechanisms for school racial segregation. Starting with mechanisms, one might assume that value-added effects on enrolment are concentrated within schools of choice – that is, magnet and charter schools – given the greater ease with which parents can access them. If true, LAUSD charter and magnet schools that achieved higher value-added rankings may have seen the largest enrolment boosts.
However, multivariate models suggest otherwise. Table A10’s models show that within the traditional public sector, a top quintile ranking predicts an 18-student annual enrolment increase. Magnet and charter schools do not see significant value-added-associated enrolment gains. Pooled models with interaction terms reinforce this heterogeneity pattern, but the interaction terms’ coefficients do not reach conventional significance thresholds.
Another possible moderator of value-added rankings’ effects is perceptions of schools’ quality based on pre-existing rankings (i.e. API). One might expect that schools with the lowest API rankings that were subsequently rated as the highest value-added schools would see the biggest enrolment boosts associated with the value-added rankings’ publication. Table A11, which stratifies our analytical sample of schools by time-invariant API rankings, reveals a slightly more complicated pattern. Schools in the middle of the API distribution that were subsequently ranked as the highest value-added schools see the largest enrolment boosts (∼22 students). Models 5 and 6 provide additional nuance, with the latter revealing that among traditional public schools, average-API schools see significantly higher enrolment boosts associated with receiving the highest value-added ranking than otherwise similar schools with higher or lower API rankings. Table A12 suggests that schools’ sociodemographic characteristics do not moderate the value-added rankings’ effects on total K–5 enrolment.
Overall, these school heterogeneity analyses indicate that traditional public schools with average test score levels see the largest enrolment gains associated with a high value-added ranking. Magnet and charter schools and the highest and lowest API schools do not exhibit a clear value-added ranking impact on enrolment, perhaps because parents’ selection of them reflects strong preferences for other school features (e.g. for specialised programmes/curricula, extracurricular offerings, school reputation or more sociodemographically homogenous student populations).
We next shift to examining heterogeneity in the value-added rankings’ effects on enrolment by student characteristics – first by age and then most importantly by ethnic identity. Starting with the former, Table A13 reveals significant value-added ranking effects on enrolment in Grades 1–5 but not in Kindergarten. We infer that intra- or interdistrict transfers across traditional public schools among non-Kindergarteners – that do not necessarily coincide with residential relocations – may be the key mechanism by which value-added rankings shape school enrolment. Next, we assess value-added rankings’ effects on both trajectories in race-specific student enrolment levels, as well as on shifts in schools’ racial shares (Tables A14–A19).
Prior research on school segregation and opportunity hoarding often scrutinises White families’ decisions. Although one might expect Whites to disproportionately re-sort themselves based on value-added rankings, potentially fuelling segregation, our results tell a different story. Table A14, Models 1 and 2 reveal no detectable effects of value-added rankings on total White K–5 enrolment or White enrolment shares, both of which appear to instead grow disproportionately in schools with higher average test scores (i.e. API). Total Black K–5 enrolment and Black enrolment shares do not correspond to value-added rankings or to API rankings (Table A14, Models 3–4).
However, Table A15 suggests that both total Asian K–5 enrolment and share of students do appear to be very modestly but significantly boosted if a school was ranked in the highest value-added category; the former outcome is robust to the inclusion of school fixed effects. Table A16 shows that total Latino K–5 enrolment is significantly, if modestly, boosted based on schools’ value-added rankings, although the top category’s coefficient reaches the p < 0.05 threshold only when school fixed effects are included. Tables A17–A19 present robustness check models that include a continuous, time-varying rather than categorical, time-invariant operationalisation of the API control and replicate the same racial heterogeneity patterns.
Figure 2 provides additional evidence of the LAT rankings’ effects on Latino and Asian enrolment levels. The top panel’s graphs show that across the study’s entire timeframe, unadjusted year-to-year enrolment patterns among Whites and Blacks were virtually perfectly parallel between schools ranked in the ‘Least’ and ‘Most’ effective categories. But for Latinos, the year-to-year enrolment patterns are parallel only until the information shock occurred; afterwards, the Latino enrolment decline moderates for the most effective schools and continues unabated for the least effective ones. The Asian enrolment pattern is slightly more nuanced but similarly shows a sharper increase from 2010–2011 to 2011–2012 among schools ranked as the most versus least effective.
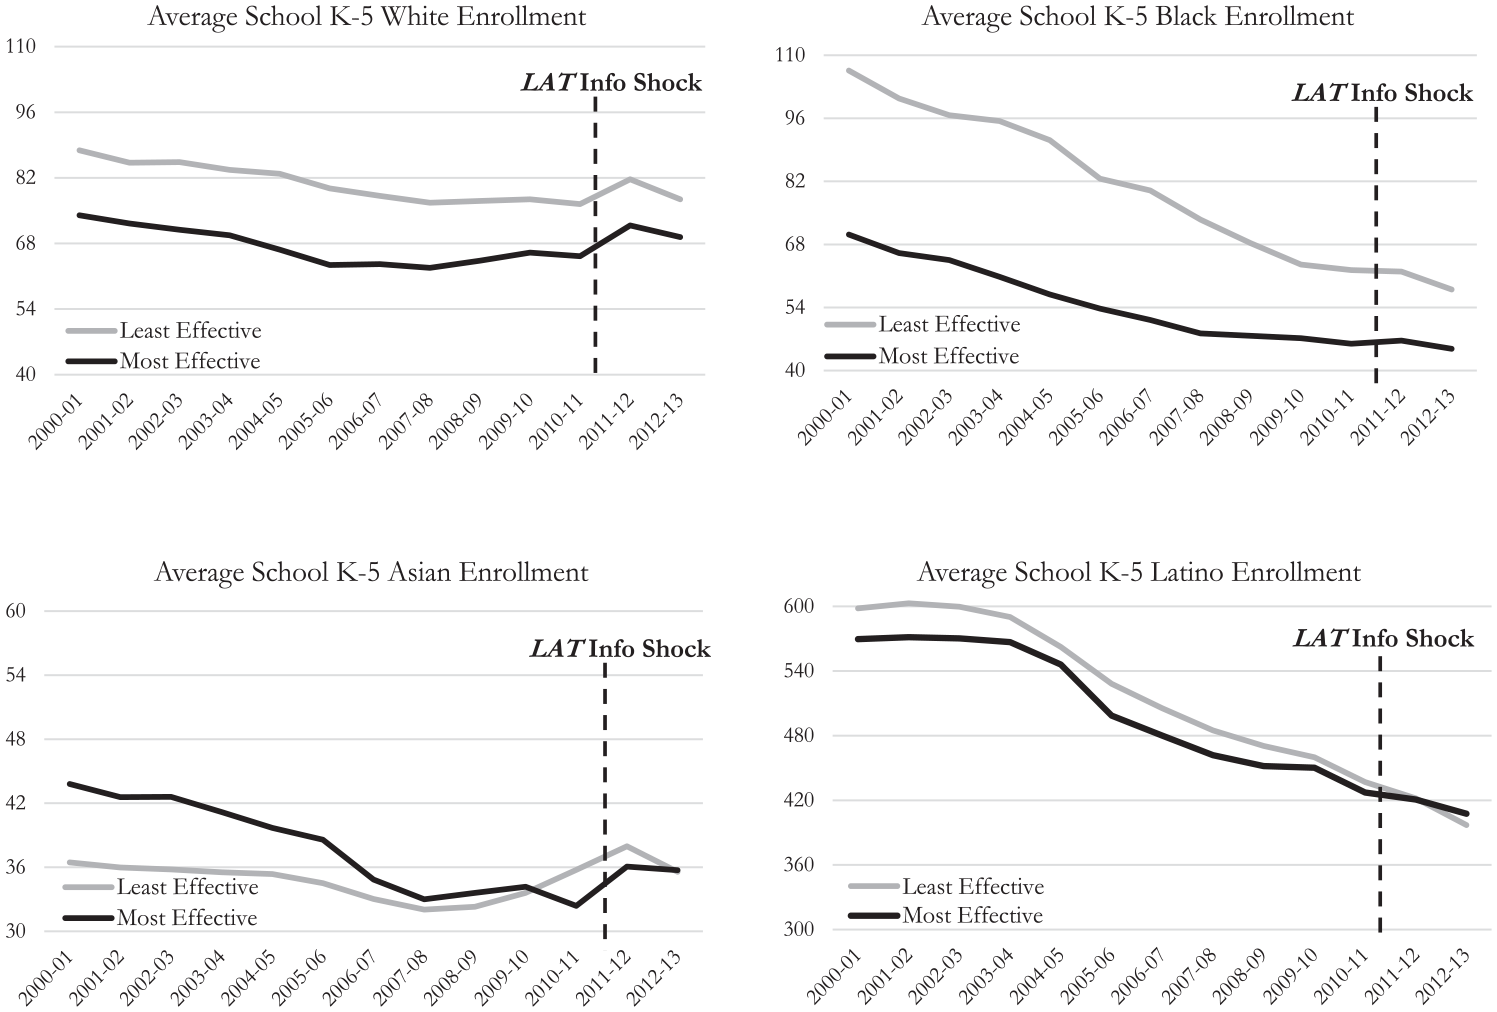
LAUSD school K–5 enrolment patterns over time by student race/ethnicity, 2000–2001 to 2012–2013 school years (unadjusted).
Aggregate school segregation implications
The results thus far suggest that LAT’s digital information shock may have led some Asian and Latino students to pursue intra- or interdistrict transfers, facilitating access to schools with higher value-added rankings. But the school segregation implications of these shifts hinge on whether the higher value-added schools gaining Latino and Asian students diverge in racial composition compared to the lower value-added schools the students may have selected in a non-information shock counterfactual.
We assess this possibility first by generating a yearly estimate of a commonly used measure capturing neighbourhood/school racial segregation: the Dissimilarity Index. These annual, unadjusted measures gauge the unevenness of Latino/White/Asian/Black total K–5 enrolment across all analytical sample schools relative to the pooled racial composition of all of these schools; higher index values indicate higher segregation levels. Figure A1 displays the unadjusted Dissimilarity Index values for all pairs of race/ethnic groups. The figure reveals stubbornly high levels of segregation throughout the study’s timeframe.
There is a very slight Latino–White and Asian–White Dissimilarity Index dip in the immediate post-shock school year, but counterfactual analysis suggests that these dips are likely not attributable to the digital information shock. When using coefficient estimates from our most complete model of K–5 Asian student enrolment (Table A15, Model 2) and K–5 Latino student enrolment (Table A16, Model 2) as inputs to generate a counterfactual estimate of what the Dissimilarity Index estimates would have been in the post-information shock school years (i.e. 2011–2012/2012–2013) had the value-added rankings remained unknown, we find that the re-sorting of Latino and Asian students to higher value-added counterfactual alternatives has trivial effects on our segregation measures. These trivial effects on segregation reflect both the modest magnitude of the value-added rankings’ boost on Latino and Asian enrolment, and the fact that, on average, schools in the ‘most’ and ‘least’ effective categories do not diverge sharply in racial composition (see Table A3, Panel B). Although the information shock appears to have shifted a small number of Latino and Asian students into higher value-added schools, it did not necessarily lead them into more racially mixed ones.
Discussion and conclusion
Whether the saturation of residential and educational markets with new digital information reshapes longstanding urban inequalities remains unresolved due to theoretical ambiguities and methodological challenges. We set out to clarify these issues by exploiting an exogenous digital information shock revealing the value-added quality of public elementary schools in LAUSD, a large and diverse core-city school district where school choice was increasingly available but residentially zoned schools remained intact.
Our results tell a nuanced story. The school value-added information shock had no detectable effects on residential sorting or neighbourhood segregation, yet it did fuel slightly increased enrolment within higher value-added schools, particularly among Latinos and Asians. The preexisting API rankings, on the other hand, predicted neighbourhood child population and school enrolment growth among White and Asian children. The introduction of API and value-added rankings over different time horizons, as well as unobserved capacity constraints shaping access to high-ranking schools and their surrounding neighbourhoods, precludes a direct comparison of how various race/ethnic groups interpret and act on each set of rankings. However, we believe that our findings reinforce the possibility of racial heterogeneity in preferences for particular school quality proxies that future research should directly probe. As noted earlier, prior research based on both neighbourhood and school sorting processes suggests that the average test score-based measures (like the API) and associated sociodemographic proxies are disproportionately appealing to affluent, and often White, families. Latino and Black families may place less emphasis on these measures, leaving room for new information – like value-added rankings – to play an amplified role in their school decisions; Asian families may weigh both types of school features simultaneously. Future research with distinct empirical designs is needed to further test these possibilities, to adjudicate between them and alternative explanations (e.g. meaningful differences in the interpretability of various ranking schemes, racially heterogeneous constraints in bringing school feature preferences to fruition) and to specifically assess whether any type of school quality rankings materially impact Black families’ residential or educational decision-making.
Setting aside the particular mechanisms explaining the sorting patterns, the racial segregation implications of the observed enrolment shifts were trivial because low- and high-value-added schools did not differ sharply in racial composition. Although this digital information shock failed to reshape short-term segregation dynamics, the shock may have still had implications for long-term urban stratification processes. This would be the case, for example, if the enrolment shifts spurred by the digital information shock led a higher proportion of Latino and Asian children to access higher-quality school contexts than would have otherwise been the case. Our results are congruent with this possibility. Importantly, recent research finds that sustained exposure to higher value-added schools yields meaningful effects on children’s cognitive and socioemotional trajectories (Jackson et al., 2020; Jennings et al., 2015; Lloyd and Schachner, 2021), with implications for their residential and income mobility as adults (Chetty et al., 2014).
Our findings thus suggest that digital information may have long-term implications for urban stratification that prior studies have missed by focusing primarily on short-term neighbourhood segregation shifts. To the extent that digital information increases disadvantaged groups’ access to high-quality schools, it may have durable, equity-enhancing effects – even if these effects do not reshape neighbourhood or school segregation patterns in the short term. In order to generate these equity-enhancing effects at any meaningful scale, the intervention must exert sorting effects that are much larger in magnitude than the LAT intervention appeared to be. Future research on educational information and sorting should examine why this particular intervention exerted such modest effects (e.g. due to low take-up of the information) and consider whether similar information delivered through other channels (e.g. a grassroots marketing campaign) may have been more impactful. Simulations of more ambitious informational interventions’ effects on disparities in exposure to high-quality neighbourhoods and schools would be useful, as would analyses that employ a longer time horizon (i.e. beyond the 2012–2013 school year) and probe a broader set of outcomes (e.g. academic achievement and educational attainment).
These studies would ideally overcome this one’s limitations by analysing student- and household-level data. Our lack of micro, student-level data precluded us from clarifying the extent to which modest enrolment boosts (/declines) associated with a high (/low) value-added ranking reflected: increased intradistrict transfers of LAUSD students from lower- to higher-value added schools; interdistrict transfers of students residing outside of LAUSD into the district’s highest value-added schools or interdistrict transfers from LAUSD low value-added schools to non-district schools; exits to private or charter schools among students who would have attended the ‘least effective’ schools; or residential relocations across district boundaries to access the highest value-added schools or avoid the lowest value-added ones. We also lacked schools’ enrolment capacity data, which would have enabled us to gauge whether the limited enrolment boosts generated by a high value-added ranking reflected constrained capacity within these schools. Qualitative methods – specifically, interviews with LAUSD families – could clarify these nuances as well, revealing precisely how families accessed, and acted upon, the digital information provided by LAT.
Applying this type of mixed-methods approach to digital information shocks in other metropolitan and national contexts would help bolster our findings’ external validity. We see the LAUSD case as generating close to an upper bound on the effects of digital value-added information on school enrolment patterns and close to a lower bound on its effects on residential sorting, given its vast scale and excess enrolment capacity, robust school choice system, large non-White population and high housing costs. In racially diverse districts with a less robust school choice system – as well as less cost-prohibitive and spatially fragmented housing markets – new value-added information may yield the type of residential re-sorting into higher value-added schools’ catchment zones (especially among Latino and Asian families) that was not seen in LAUSD, where school enrolment sorting was the primary channel through which the information generated modest effects. We believe that LAUSD’s dense school choice sets and rapidly liberalising, market-orientated approach to school enrolment during the 2000s and 2010s helped open this channel for accessing high value-added schools. The district’s well-documented enrolment declines likely contributed, as well, by creating ample capacity for additional students within high value-added schools. As these nuances become clearer, and as urban scholars identify what specific types of digital information have what specific types of effects on which groups in which specific spatial and temporal contexts, urban policymakers should reconceive how they use digital information to drive equity accordingly.
Supplemental Material
sj-pdf-1-usj-10.1177_00420980241274910 – Supplemental material for The implications of digital school quality information for neighbourhood and school segregation: Evidence from a natural experiment in Los Angeles
Supplemental material, sj-pdf-1-usj-10.1177_00420980241274910 for The implications of digital school quality information for neighbourhood and school segregation: Evidence from a natural experiment in Los Angeles by Jared N Schachner, Ann Owens and Gary D Painter in Urban Studies
Supplemental Material
sj-pdf-2-usj-10.1177_00420980241274910 – Supplemental material for The implications of digital school quality information for neighbourhood and school segregation: Evidence from a natural experiment in Los Angeles
Supplemental material, sj-pdf-2-usj-10.1177_00420980241274910 for The implications of digital school quality information for neighbourhood and school segregation: Evidence from a natural experiment in Los Angeles by Jared N Schachner, Ann Owens and Gary D Painter in Urban Studies
Footnotes
Acknowledgements
We thank the special issue editors, as well as participants in the Digitalisation and Segregation Conference in Cologne, Germany and the APPAM Fall 2022 Conference in Washington, DC, including Sarah A. Cordes, Kiara M. Nerenberg and Danielle Edwards, for helpful feedback.
Declaration of conflicting interests
The author(s) declared no potential conflicts of interest with respect to the research, authorship, and/or publication of this article.
Funding
The author(s) disclosed receipt of the following financial support for the research, authorship, and/or publication of this article. This research was supported by the USC Sol Price Center for Social Innovation, the Mansueto Institute for Urban Innovation at the University of Chicago and the Fritz Thyssen Foundation.

Supplemental material
Supplemental material for this article is available online.
Notes
References
Supplementary Material
Please find the following supplemental material available below.
For Open Access articles published under a Creative Commons License, all supplemental material carries the same license as the article it is associated with.
For non-Open Access articles published, all supplemental material carries a non-exclusive license, and permission requests for re-use of supplemental material or any part of supplemental material shall be sent directly to the copyright owner as specified in the copyright notice associated with the article.
