
Abstract
Floods pose significant threats in the United States, and the National Flood Insurance Program uses Special Flood Hazard Area (SFHA) designations to guide regulations intended to reduce flood damage. Yet the effect of SFHA regulation on housing markets is difficult to identify because floodplain status is correlated with flood risk and unobserved amenities. This study estimates SFHA policy effects on assessed housing values by combining parcel-level flood risk data, property-level housing information, and Federal Emergency Management Agency (FEMA) SFHA boundaries in Texas. Using a regression discontinuity (RD) design, we compare single-family homes just inside and just outside invariant SFHA boundaries to better separate local policy effects from flood risk and other confounding factors. Relative to a standard hedonic model, the RD analysis yields different estimates. The hedonic model suggests lower assessed values for coastal-county properties inside floodplains and no significant effect inland. In contrast, the RD estimates show no significant boundary effect in coastal counties and about a 2% assessed-value premium for homes inside SFHAs in inland counties. These findings suggest that assessed valuations do not consistently capitalize flood-zone designation and associated regulations, although they do not necessarily imply the same pattern for transaction prices.
Introduction
Flood-related events cause an estimated $32 billion in property damages annually in the United States (Wing et al., 2022). To mitigate flood damage, Congress established the National Flood Insurance Program (NFIP), which assesses flood risk, develops flood maps, and provides flood insurance. The Federal Emergency Management Agency (FEMA) which oversees the NFIP, provides technical assistance and guidance to communities, and uses the Special Flood Hazard Area (SFHA) to set boundaries for flood zones with a high probability of floods once every 100 years (100-year SFHA).
The 100-year SFHA is a crucial regulatory mechanism that subjects a property to local, state and Federal regulations, including Chapter 44 of The Code of Federal Regulations (FEMA, 2005). For example, homeowners applying for federally backed mortgages for properties inside floodplains are required to purchase flood insurance. A permit is required for any changes to improved or unimproved properties within floodplains, and new construction must be above the Base Flood Elevation (BFE). The expectation is that regulations shape individual behaviors that mitigate property, economic, and human costs.
Evidence-based decision-making requires robust analysis, but the impact of the NFIP on urban floodplain development is underdeveloped (Kousky 2019, Liu and Noonan 2022). We contribute empirical evidence on one aspect of the NFIP, its SFHA boundary setting, and how it affects housing development. While considerable scholarship examines the impact of location within a floodplain on housing values, these results do not necessarily identify the policy effect of flood-related land-use regulations (Beltrán et al., 2018; Bin and Polasky, 2004; Bin et al., 2008; Daniel et al., 2009) because it is difficult to isolate the impact of flood zoning policies from confounding factors, such as flood risk and unobserved amenities. Our interest here lies in identifying the effects of the SFHA policy (distinct from flood risk itself) on housing values and other aspects of housing development.
This study estimates the impacts of flood zoning policies by utilizing the regression discontinuity (RD) approach with two parcel-level datasets. One includes rich information on housing characteristics, such as the number of rooms, number of stories, and square footage, and the other offers a parcel-level flood risk measure that allows one to control for flood risk’s impact on the housing market. We leverage the RD method to minimize potential effects of unobserved amenities on housing prices. The RD design compares the outcomes of units just inside and outside the SFHA boundaries. Policy impacts are captured by the difference between the outcome variable estimates for the interior versus the exterior observations, which minimizes the differences in access to unobserved amenities. We also assess the impact of parcel-level flood risk, housing characteristics, and tract-level attributes.
We examine housing near SFHA boundaries in Texas, which is vulnerable to coastal flooding, hurricanes, tropical storms, flash flooding, and riverine flooding across a varied topography with multiple large urban areas and rural spaces. Our RD analysis of Texas homes near SFHA boundaries for years prior to FEMA’s adoption of the Risk Rating 2.0 system shows that ignoring confounding factors can yield misleading inferences about the effect of flood zoning policies on housing development. Results from a standard hedonic model, which fails to account fully for those confounding factors’ influence, show flood zoning policies lead to a price discount for parcels inside floodplains in coastal counties and no significant effect in inland counties. In contrast, our RD results show no significant effect in coastal counties, but such policies have an assessed-value premium effect for inland county homes inside floodplains.
Literature review
Flood hazards pose serious risks to housing, and flood management policies could mitigate risks (Keenan-Jones et al., 2025). Flood risks vary continuously over space, yet designating SFHAs distills flood information into a coarse signal based on flood zones. By providing a “false sense of security” (Kousky et al., 2020; Netusil et al., 2021) or under-informing the public, the binary SFHA designation is limited and perhaps counterproductive. Yet critiques on psychological or behavioral grounds are not generally accompanied by evidence that risk is similar on either side of the boundary. Policy discontinuities at SFHA boundaries—for example, mandatory flood insurance for federally backed mortgages—may not be reflected by discontinuities in risk or development.
Event-based studies show the price effects of flood risk are time-varying. After Hurricane Andrew, prices in SFHAs fell sharply before recovering, consistent with transitory updates to perceived risk (Hallström and Smith, 2005). Relatedly, property discounts following infrequent floods decay over time, indicating dynamic capitalization of risk information (Fletcher et al., 2022). Behavioral responses in insurance markets exhibit a similar pattern: take-up spikes after a flood and then reverts toward baseline (Gallagher, 2014).
Economic analyses have estimated SFHA effects on pricing (e.g., Beltrán et al., 2018; Bin and Polasky, 2004; Kousky, 2010; Gourevitch et al., 2023), but do not consider distance to boundary. Hedonic price models examine the price effect associated with buildings located inside floodplains (Atreya and Czajkowski, 2019; Bin and Landry, 2013), and, unlike Rambaldi et al. (2013), they often assume all parcels inside floodplains face the same flood risk (Bin and Landry, 2013; Bin and Polasky, 2004; Bin et al., 2008; Kousky, 2010; Netusil et al., 2019). Such studies interpret the estimated coefficient of the dummy variable indicating whether the home’s location is within the floodplain as the policy impact. SFHAs can be large and heterogeneous, making the use of spatially refined data crucial to reliably identifying relationships in the data (Johnston and Moeltner, 2019). However, because researchers usually cannot observe the flood risk independently, this effect can be attributed to the influence of true flood risk, the impact of flood zoning policies, or other unobserved amenities. Thus, the hedonic literature has produced mixed results regarding the effect of flood risk on housing prices (e.g., Atreya and Czajkowski, 2019; Bin and Landry, 2013). Studies show that properties inside floodplains sell for a lower price than an equivalent property outside (Bin and Polasky, 2004; Bin et al., 2008; Netusil et al., 2019). Conversely, Daniel et al. (2009) and Beltrán et al. (2018) find that the price discount for properties located within a floodplain varies considerably.
Related work addresses complex neighborhood effects and smoothing/time-variation with spatial and event-study designs (e.g., Fletcher et al., 2022; Hallström and Smith, 2005; Netusil et al., 2019), which our boundary-RD approach complements by isolating policy discontinuities at SFHA edges. This prior research shows complex pathways for housing prices to change over time as migration and sorting, flood events and updated risk perception, as well as policy changes occur. Accordingly, we focus on identifying policy effects where flood events and risks remain similar locally around SFHA boundaries.
Finally, this analysis builds upon work by Wilson and Kousky (2019) that identifies heterogeneity in the map adoption process that correlates with various socio-economic and political indicators. Because their study identifies major differences in mapping between coastal and inland counties, we split our sample into coastal and inland counties and analyze them separately.
Theory
The context surrounding housing markets and floodplains presents a host of overlapping and interdependent forces. Households and housing developers make decisions about what to build, while regulators promulgate rules under various constraints—which might only be coincidentally correlated with flood risk management. This complexity is compounded by differing priors about flood risk, evolving infrastructure and natural hazards, and limited local risk information often imperfectly conveyed through prices.
Further, the decision to renovate a house just inside an SFHA boundary versus renovating just outside the same boundary does not yield simple predictions. After severe flooding, investment patterns in damaged areas shift in ways consistent with regulatory and financing frictions, reinforcing the potential for attribute-level discontinuities at SFHA edges (McCoy and Zhao, 2018). From one vantage, increasing investment in housing outside the floodplain merits consideration because of lower perceived flood risk, laxer housing regulations, or to complement the correlated amenities of floodplain proximity, such as coastal access, riverfronts, and lakes (Beltrán et al., 2018). Conversely, renovating the house just inside the SFHA merits consideration due to the availability of discounted flood insurance (Michel-Kerjan and Kunreuther, 2011) or supply constraints making renovations easier than new construction.
NFIP flood maps have received criticism for implying risk discontinuities that do not exist. If the flood risk gradient is generally smooth, SFHA boundaries should map along a risk gradient. The floodplain boundary would be the isopleth associated with the arbitrary “100-year” flood risk level. This would generate an artificial spatial discontinuity (in terms of regulations, flood insurance premiums, and public information) because the flood risk gradient is smooth around this point. Yet it is also possible that natural or man-made features create important discontinuities in flood risk reflected in the SFHA boundaries.
An SFHA introduces changes for residents and developers on either side of the boundary. Conditional on an underlying smooth risk gradient around the boundary, the SFHA should create a discontinuity in demand at the boundary. Flood risk and local amenities are also capitalized into prices, leaving prices declining in risk and rising in the correlated amenities. But, conditional on a smooth risk gradient at the boundary, no boundary discontinuity in prices exists. Yet SFHA designation combines regulatory requirements with a coarse public signal about risk, leading to possible policy effects on housing values. If the SFHA signals flood risk information to the market, then demand should spike just outside of SFHA boundaries. Mandatory flood insurance might reinforce this if that cost (and not flood risk) is capitalized in housing values (Harrison et al., 2001). Regulatory frictions and supply restrictions can raise the value of the existing stock in SFHAs. Regulations associated with SFHAs might also induce discontinuities in housing value, size, and age. Newer housing may especially differ in its attributes, like size or number of rooms, just outside the boundary as demand spikes there. Regulations drive up housing costs inside the flood zone. If floodplain regulation effectively deters construction in the floodplain or diverts it away, we would expect greater housing density and younger ages just outside the boundary.
Constraining housing supply inside the SFHA leaves us with ambiguous price effects overall when combined with greater demand outside of the boundary. The net effect depends on whether the regulatory effects of SFHA designation (leading to higher prices just inside the boundary) are stronger than its more informational effects (leading to higher prices just outside the boundary).
In summary, we test three related predictions at SFHA boundaries:
Other forces may drive development differently than hypothesized above. Flood risks, information about flood risks, and flood policy associated with SFHAs may not be sufficiently salient to yield any boundary discontinuities. Often, observers lament that developers or homeowners appear blissfully untroubled by flood risks (e.g., Fletcher et al., 2022; Hino and Burke, 2021; Michel-Kerjan and Kunreuther, 2011). The unimportance of SFHA boundaries may stem from ignorance, high discount rates, ease of walking away from underwater property, lack of viable alternatives, or other reasons. If SFHAs do not matter to people, then the alternative hypotheses would see no discontinuities in housing development at the SFHA boundaries. Equivalently, the mix of incentives arising from risk information and policy responses may effectively cancel each other out. For instance, greater perceived flood risk might be compensated for by a greater belief in public bailouts. Because regulatory burdens and information salience can push in opposite directions on either side of the boundary, the net price jump is ambiguous ex ante—hence the value of a local RD that conditions on smooth risk.
Methodology
We leverage the RD approach to isolate flood-policy impacts from flood risk and unobserved amenities, and we compare its results to a standard hedonic price analysis (as described in Online Supplemental Appendix A5).
Regression discontinuity design
The RD model identifies the treatment effect where the treatment is determined by whether the level of the observed “assignment” variable is above or below a known cutoff (Thistlethwaite and Campbell, 1960). A key feature is that the probability of treatment changes discontinuously at the cutoff, which generates “variation” in treatment assignment assumed to be uncorrelated with confounding variables. The RD estimator captures this discontinuity at the cutoff.
Here, we use the SFHA boundaries as the cutoff because it divides the area into flood and non-flood zones, with only parcels inside floodplains subject to flood-related regulations. By controlling for flood risk and other covariates, we attribute the estimated boundary effect, the RD estimator, to the impact of flood zoning policies. Additionally, by focusing on the effect at the SFHA boundaries, we eliminate confounding effects resulting from unobserved amenities because these amenities will bring about identical effects on either side of the boundary due to the RD model estimating the outcome variable at the same point in space at the boundary (where the amenities would be the same). Consider a scenario where a floodplain contains a greenspace, which is unobservable to researchers, that enhances the desirability of nearby properties. This unobserved amenity effect could bias the analysis. For unobserved amenities with consistent effects on either side of the boundary, however, the RD design can effectively address this issue by focusing solely on houses located at the boundary with very similar access to an amenity. Still, boundary-local sampling does not guarantee identical housing bundles on either side of the cutoff, especially if past development responded to the boundary itself. For that reason, we report both limited-controls and attribute-adjusted RD estimates and treat the latter as our preferred comparison of more similar homes.
Because of its local nature, the RD estimator typically relies on local polynomial non-parametric regression. The RD analysis estimates two kernel-weighted local polynomials, one for observations inside the flood zone and another for observations outside, and it gives higher weights to observations close to the cutoff. The local polynomial estimates how the dependent variable, Y
i
, varies with distance, D
i
, to the SFHA boundary for each unit observation, i. Here, the SFHA boundary serves as the cutoff,

Intuitively, it measures the difference at the SFHA boundary between the expected value of the line,
Here, the observation unit i is at the parcel level for single-family residential properties. To minimize the effects of estimator bias, we report the robust estimator (Calonico et al., 2015), which not only addresses the bandwidth choice issue (Imbens and Kalyanaraman, 2012) but also derives a robust variance for our RD estimator.
Data sources
To obtain house-level attributes on parcels, distance from flood zone boundaries, and flood risk exposure, we use multiple sources. First, the National Flood Hazard Layer (NFHL) data from FEMA provides the digitized flood insurance rate map (DFIRM). We use 2014 and 2021 versions to identify a parcel’s flood zone status and calculate a parcel’s distance away from floodplain boundaries. There were 118 counties in Texas with a DFIRM in 2014 and 2021, and most were concentrated in the more populous and wetter eastern part of Texas (see Online Supplemental Appendix Figure A1 for a map).
Focusing on counties with a DFIRM in 2014 and 2021 lets us identify flood zones with time-consistent or invariant boundaries. Restricting the analysis to houses near fixed boundaries (i.e., the house existed in 2014 and its nearby SFHA boundary was unchanged) mitigates endogeneity concerns and avoids our estimates capturing the effects of changing SFHA boundaries.
To obtain housing characteristics such as land-use codes, year built, assessed land value, assessed improved value, total acreage of the parcel, building square footage, and parcel-level latitude and longitude, we rely on 2021 property-level data for single-family residential properties from CoreLogic. “Total Value” is the assessor’s estimate of market value (land + improvements) used for property taxation, not an observed transaction price. We use assessed values because they cover the full housing stock (avoiding transaction selection) and allow RD identification at SFHA boundaries with dense support. Online Supplemental Appendix Tables A2–A5 further decompose land and Improvement values. CoreLogic provides assessor valuations and property characteristics (not flood risk or zone status), but it does not reveal whether or how local assessors explicitly incorporate SFHA designation or parcel-level flood risk into those valuations. Our tract-level fixed effects therefore absorb area-specific assessment practices, but we do not directly observe a uniform county-level rule for how flood risk or SFHA designation enters mass appraisal.
Extant literature cannot isolate policy effects on housing markets because they treat all parcels inside the floodplain as having the same flood risk exposure, and the NFIP has been criticized for the oversimplified modeling analysis and limitations in reflecting actual flood risk (Noonan et al., 2022). To overcome the limitation on a house’s flood risk measure, we utilize the parcel-level flood risk data from First Street Foundation (FSF). The FSF risk data has been used to assess unpriced climate risk in housing markets, the social correlates of flood risk across the rural/urban continuum, and the distribution of risk and environmental justice (Noonan et al., 2022; Rhubart and Sun, 2021). FSF provides a probabilistic flood model that estimates each parcel’s probability of being flooded over the next 30 years. Further, FSF reports the likelihood of flooding above three specific flood-depth thresholds, with separate predictions for different years from 2020 to 2050. We employ the 2050 parcel-level flood risk data with a threshold ≥15 cm. Finally, we mapped all CoreLogic parcels and merged them with the FSF risk data based on the closest geographic match and with the DFIRMs based on distance to boundaries.
Invariant balanced boundary parcels
After merging the three datasets—DFIRMs, CoreLogic, and FSF flood risk—we narrowed the sample to single-family housing in “Invariant Balanced Boundary” parcels. We examine only those homes within 50 m of an SFHA boundary, which results in about 430,000 homes, and we call this the “Near Boundary sample.” Further narrowing, we include only those homes near a boundary where there are at least three homes within 100 m on both sides of the boundary. This “Balanced sample” includes about 90,000 homes. Finally, we examine homes in the Balanced sample within 50 m of an SFHA boundary that did not change from 2014 to 2021. This Invariant Balanced Boundary sample includes more than 77,000 homes, which we use in the RD analysis (see Online Supplemental Appendix A3 for further discussion).
Summary statistics
Table 1 reports summary statistics for the Whole sample and Invariant Balanced Boundary sample with parcels inside and outside SFHAs in both coastal and inland counties. It includes housing values (Total Value), parcel-level flood risk (FSF Risk), and control variables, such as distance from SFHA boundaries, number of rooms, bathrooms, bedrooms, and stories. Total Value is the sum of a house’s improvement value and land value, reported by local assessors. FSF Risk, ranging from 0 to 1, measures the probability of being flooded above 15 cm within 30 years.
Summary statistics.
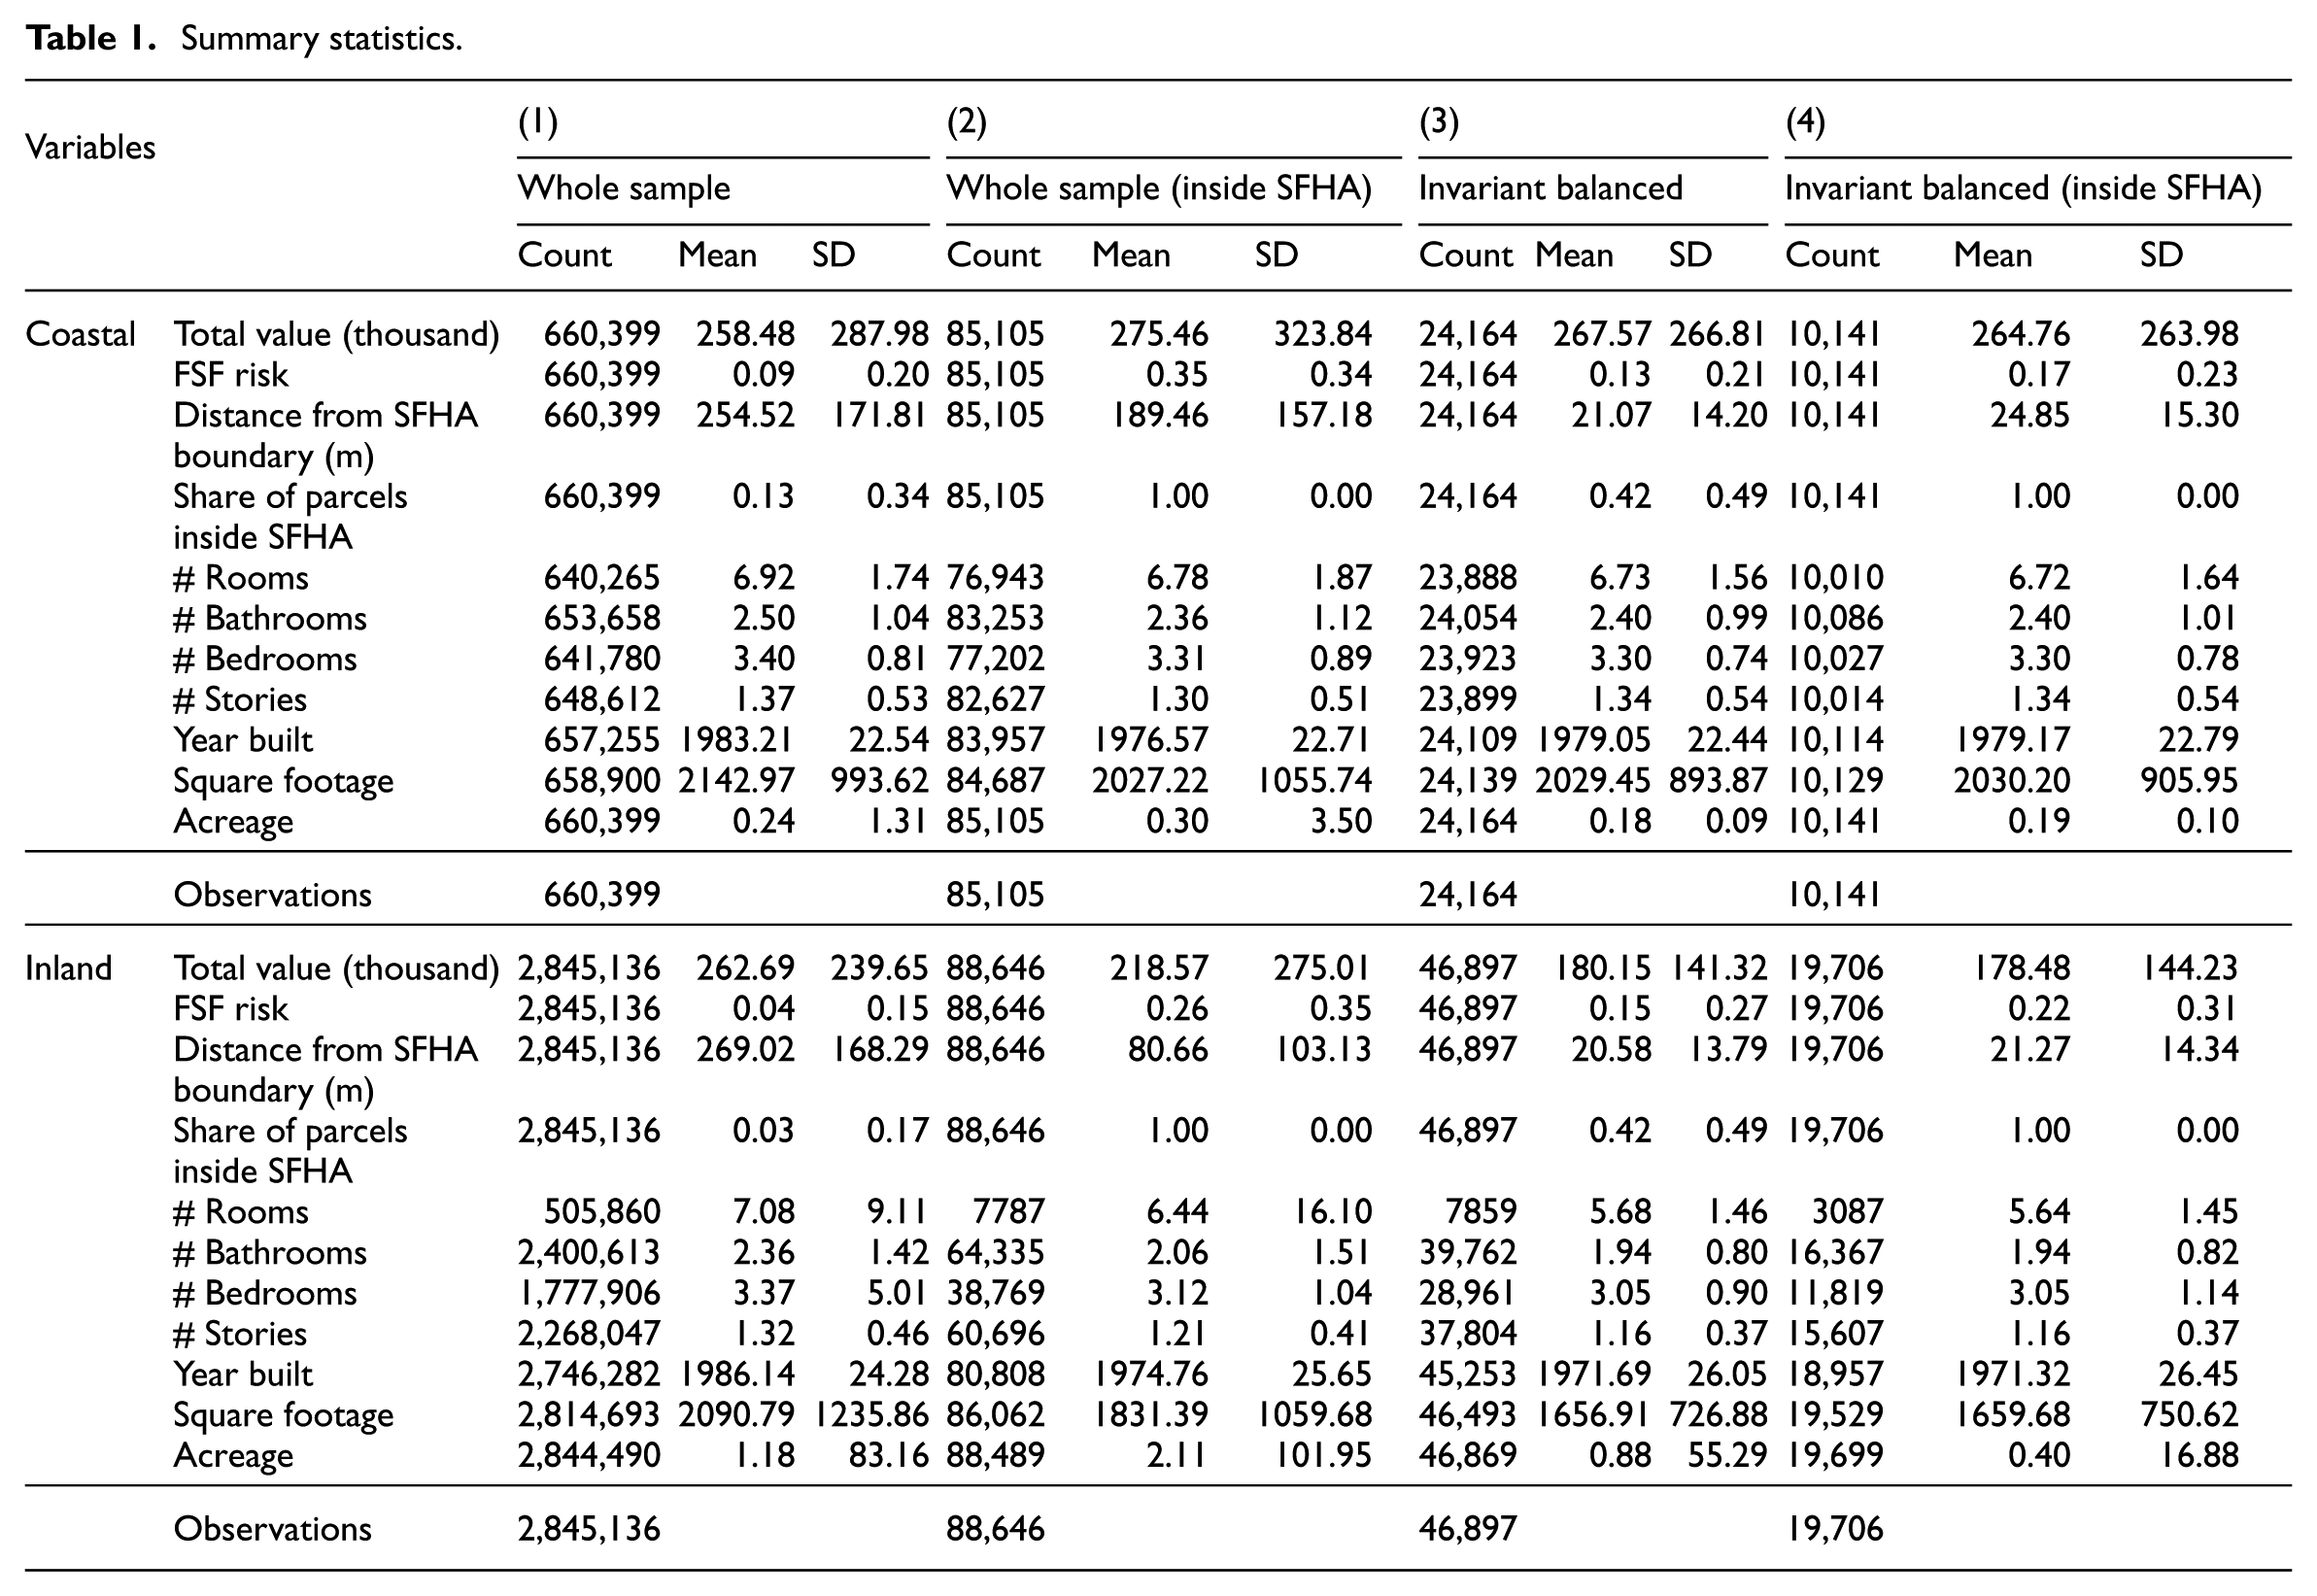
The coastal counties (top panel, Table 1) show a Total Value mean similar for the parcels inside SFHAs in the Whole and Invariant Balanced Boundary samples. The Whole Sample Total Value mean for parcels outside an SFHA is lower than the other three categories.
The FSF flood risk mean is much higher in the Whole sample inside the SFHA than the Whole sample outside the SFHA (0.35 against 0.09), but the difference between the Invariant Balanced Boundary samples is much smaller (with the inside SFHA at 0.18 against 0.14 for outside). If we focus on those parcels inside SFHAs, the Whole sample on average has a higher flood risk than the Invariant Balanced Boundary sample. This aligns with expectations because the Invariant Balanced Boundary sample is restricted to parcels near boundaries and not those highest-risk areas deep inside flood zones.
The summary statistics for inland counties (bottom panel, Table 1), reveal the Total Value inside SFHA is lower than outside in the Whole sample, which differs from the result in the coastal counties. Conversely, the Total Value means for the inside and outside parcels in the Invariant Balanced samples are equal but also much lower than all other samples. Further, the FSF risk is much lower in the outside than the inside SFHA parcels in the Whole sample, but the difference is smaller between the similar comparison for the Unbalanced Boundary samples. Finally, the control variables show considerable variance across the different samples. For this reason, and the differing dynamics observed in Johnston and Moeltner (2019) and Wilson and Kousky (2019), we analyze these two samples separately.
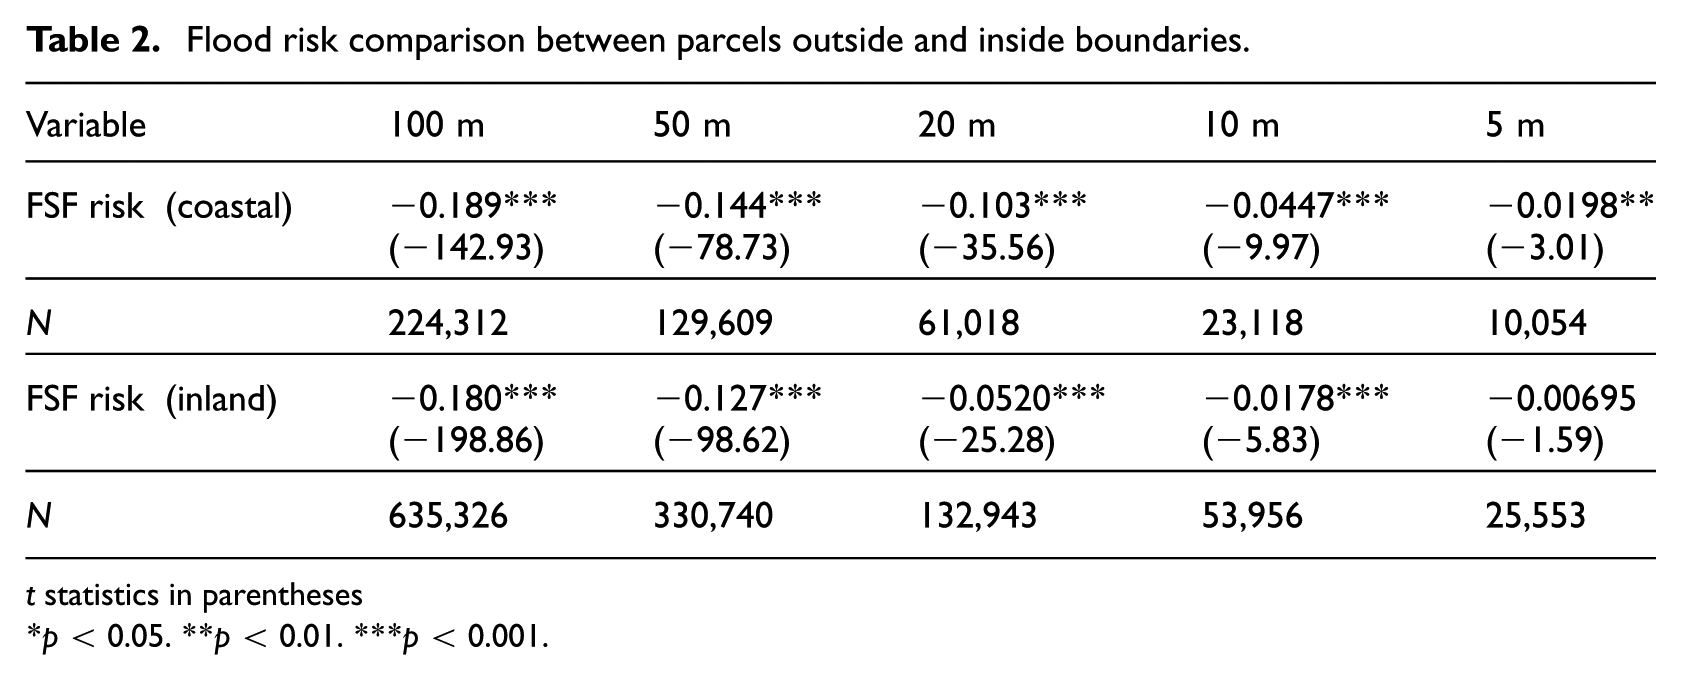
We conducted additional tests to compare the risk difference between properties just outside and inside floodplains. In Table 2, the risk gap is very sensitive to the distance from the boundary, and results indicate how risk differences converge quickly and steadily as the distance to the boundary narrows, If we restrict homes to those closer to the boundary, the risk difference between inside and outside parcels in coastal or inland samples gradually approaches zero. This suggests flood risk is sensitive to the distance from boundaries and that parcels’ flood risk inside floodplains are not identical. The results also indicate that SFHAs tend to capture high flood-risk areas while also showing a downward sloping risk gradient as one moves toward and past the SFHA boundary.
Flood risk comparison between parcels outside and inside boundaries.
t statistics in parentheses
p < 0.05. **p < 0.01. ***p < 0.001.
Estimation results
Here, we present the estimation results for the effect of flood zoning policies on housing values with a hedonic model and an RD design. We show that the hedonic model cannot fully control for correlated unobserved amenities, which can materially change the inferred effect of flood zoning policies on the housing market.
Applying a standard hedonic specification, we obtain the results for total value in Table 3. Using the log of housing value as our dependent variable, the specification uses SFHA status, FSF Risk, distance from SFHA boundaries, house square feet, parcel acres, numbers of rooms, bathrooms, bedrooms, and stories, an interaction term for SFHA status and distance to boundary, and Census tract-level fixed effects. We analyze the Whole and the Invariant Balanced samples.
Hedonic analysis for the log of total value.
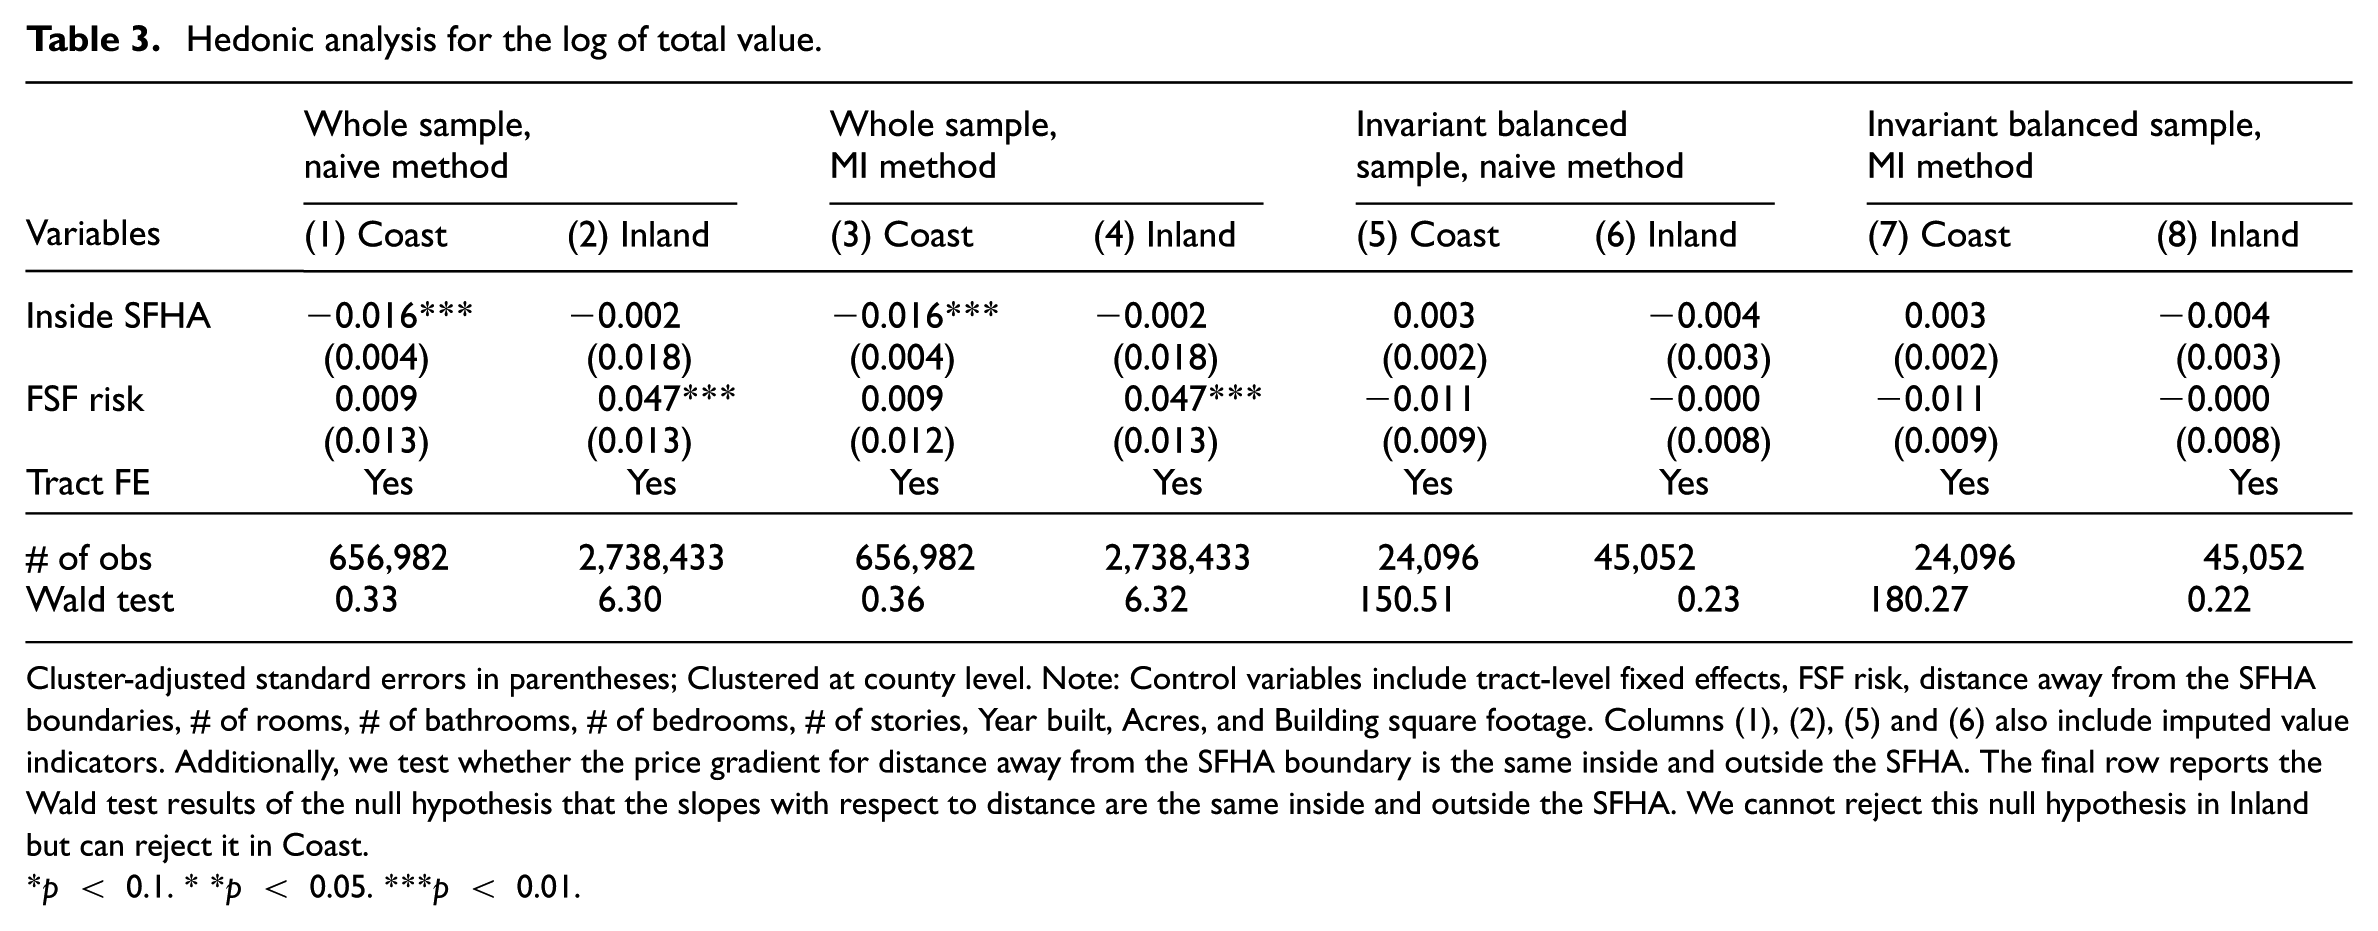
Cluster-adjusted standard errors in parentheses; Clustered at county level. Note: Control variables include tract-level fixed effects, FSF risk, distance away from the SFHA boundaries, # of rooms, # of bathrooms, # of bedrooms, # of stories, Year built, Acres, and Building square footage. Columns (1), (2), (5) and (6) also include imputed value indicators. Additionally, we test whether the price gradient for distance away from the SFHA boundary is the same inside and outside the SFHA. The final row reports the Wald test results of the null hypothesis that the slopes with respect to distance are the same inside and outside the SFHA. We cannot reject this null hypothesis in Inland but can reject it in Coast.
p < 0.1. **p < 0.05. ***p < 0.01.
Due to concerns about missing values for some control variables, two alternative techniques, “Naïve Method” and “Multiple Imputation (MI) Method,” impute missing values of four control variables (numbers of rooms, bathrooms, bedrooms, and stories; See Online Supplemental Appendix A5 for missing data handling). Table 3 results suggest the imputation approaches have little effect on the estimates.
The hedonic model shows mixed results for coastal and inland counties. According to Columns 1-4 for the whole sample, flood policies are associated with a price discount in coastal counties but not for inland counties. The estimates in Columns 5–8 (for the samples restricted to Invariant Balanced Boundaries) show a coefficient
For the single-family house Whole sample, the hedonic approach finds significant price discount effects for SFHA status in coastal counties. However, in Columns 2 and 4, we encounter counterintuitive findings regarding the influence of flood risk on housing values, where high flood risk appears to contribute to higher housing values. This unexpected outcome likely stems from the influence of unobserved amenities. Properties within floodplains benefit from closer proximity to these amenities, positively biasing the estimated FSF Risk effect.
We focus our analysis on the Invariant Balanced Boundaries samples (Columns 5–8). By narrowing the sample and concentrating on price differentials at the boundary, we address concerns related to correlated unobserved amenities. Consequently, the SFHA price discount for coastal county parcels dissipates, indicating the presence of unobserved amenities associated with SFHA status in coastal counties in the Whole sample. Similarly, the previously positive estimated effect of FSF Risk disappears, consistent with unobserved amenities being correlated with flood risk. While the restricted sample yields a more intuitive relationship between flood risk and housing prices, it does not fully resolve the identification challenge in a hedonic framework. Theoretically, only comparisons between parcels infinitesimally close on opposite sides of the SFHA boundary can eliminate such confounding, motivating our regression discontinuity design.
Regression discontinuity estimates
An RD design addresses the issue of correlated unobserved amenities by employing approximation techniques and focusing on boundary effects. The RD estimates in Table 4 contain several results, a model of Total Value with limited controls (Columns 1 and 2), a model for Total Value with controls for housing characteristics (Columns 3 and 4), and a model with FSF Risk as the dependent variable (Columns 5 and 6). The models in Columns 3 and 4 in Table 4 serve as the comparison to Columns 5–8 in Table 3. In contrast to the hedonic model, the RD approach reveals different results after addressing the impact of unobserved amenities. While the hedonic (Columns 5 and 7, Table 3) and RD (Column 3, Table 4) results exhibit insignificant effects of flood policies on housing values in coastal counties, the RD analysis shows a significant assessed-value premium effect on housing values in inland counties that was not seen in the hedonic results. Compared to the RD results, the hedonic approach yields a substantively different—and likely less reliable—inference regarding the effect of flood zoning policies on assessed housing values.
Regression discontinuity analysis for the log of total value (Columns 1–4) and FSF risk (Columns 5–6).
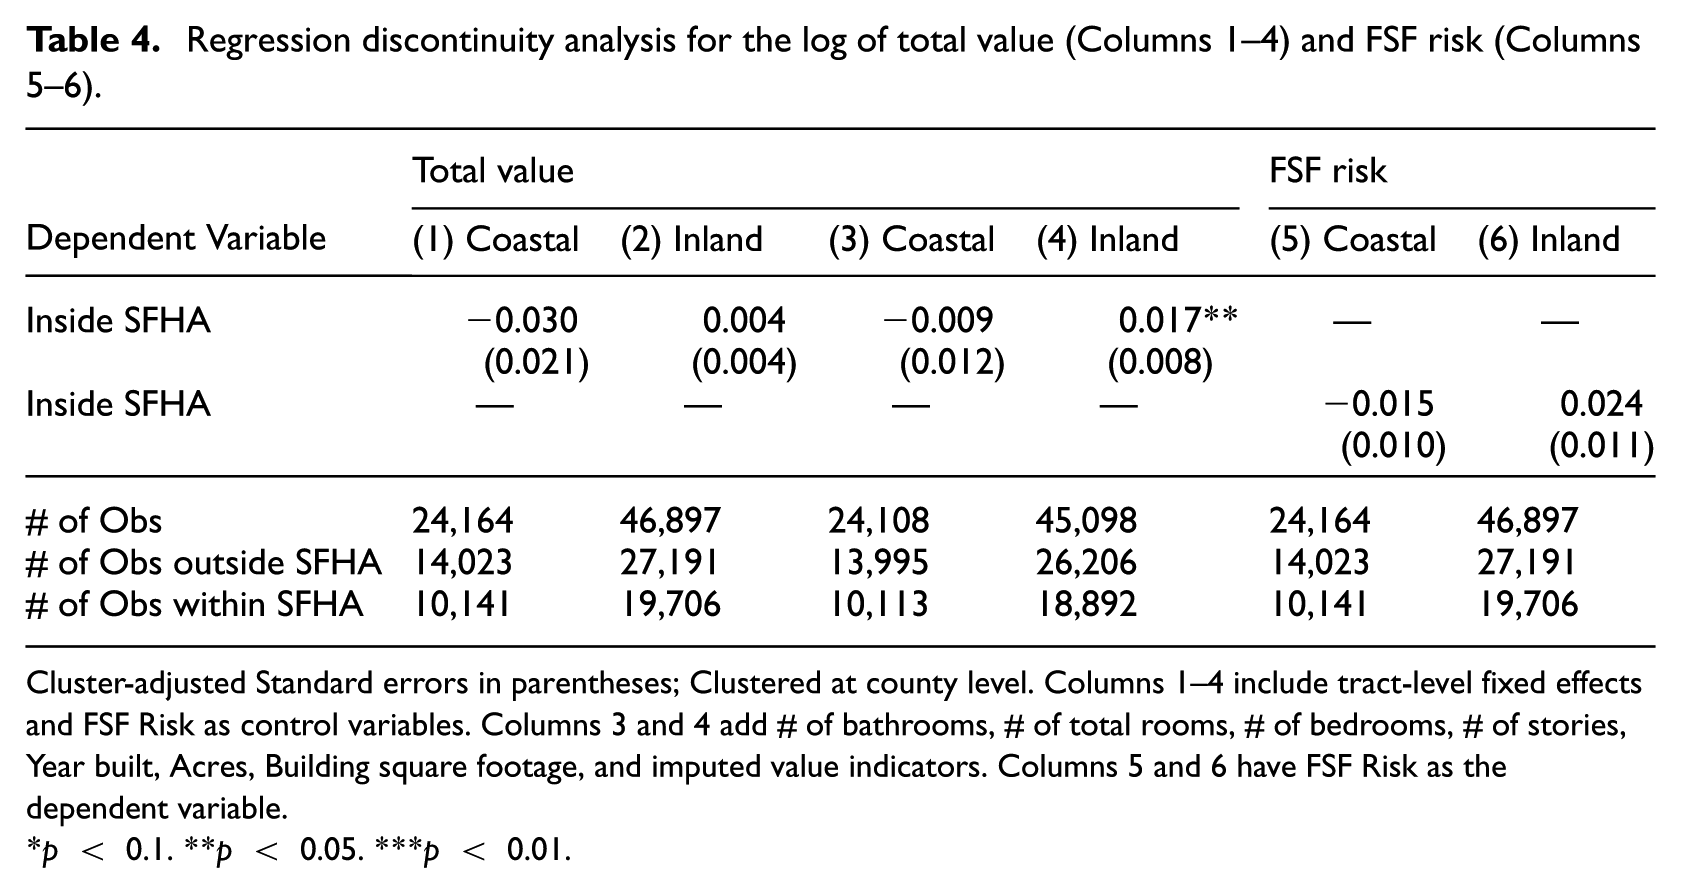
Cluster-adjusted Standard errors in parentheses; Clustered at county level. Columns 1–4 include tract-level fixed effects and FSF Risk as control variables. Columns 3 and 4 add # of bathrooms, # of total rooms, # of bedrooms, # of stories, Year built, Acres, Building square footage, and imputed value indicators. Columns 5 and 6 have FSF Risk as the dependent variable.
p < 0.1. **p < 0.05. ***p < 0.01.
Comparing results in Table 3 with those in Table 4 involves a change in estimation technique (hedonics vs RD) and a change in samples. Narrowing the analysis to parcels near SFHA boundaries helps isolate boundary effects and avoid confounders, irrespective of the estimation approach. Comparing Columns 1–4 of Table 4 with Columns 5–8 in Table 3 directly addresses the importance of limiting the sample to parcels near boundaries. Discarding observations far from floodplain boundaries yields estimates that suggest SFHA status is not capitalized into housing values. For coastal counties, those parcels far from SFHA boundaries tend to have larger differences in values. Dropping them shows that, conditional on the controls in the hedonics model, there is no discount to housing values associated with SFHA status.
Yet this conclusion about the importance of sample selection on mitigating omitted variables is not sufficient to explain the differences between the hedonic and RD results. Comparing Columns 7–8 of Table 3 with corresponding results in Table 4 (Columns 3–4) shows that—even with the same sample—the results change. The RD approach identifies significant housing value premiums (about 2%) for parcels in inland county SFHAs. These results indicate how narrowing the sample to the neighborhood of SFHA boundaries helps, but the hedonic model still fails to fully address potential unobservables. Further, the RD results are not appreciably sensitive to alternative calculations of the standard errors or different parameters in the kernel.
Table 4 also clarifies the scope of the RD design in this setting. Boundary-local sampling greatly improves comparability, but it does not guarantee identical housing bundles on either side of the cutoff. Columns 1 and 2 therefore capture the total discontinuity in assessed values at the boundary, while Columns 3 and 4 add housing attributes to compare more similar properties. The change in the inland estimate after conditioning on attributes indicates that some housing characteristics themselves vary discontinuously at SFHA boundaries.
To explore whether other housing attributes vary due to SFHA status, we repeated the RD analysis for these attributes as dependent variables in separate estimates (see Online Supplemental Appendix Tables A6 and A7). The results suggest a significant boundary effect exists for several housing attributes. Houses just inside the boundary are, on average, 2–5 years older, 2% smaller in square footage, have more rooms, and—for coastal counties—8% larger parcels. Such strong boundary effects can result from either SFHA policies shaping housing development or floodplain boundaries having systematically been drawn around housing that differed along these lines. It is difficult to verify the latter possibility given data limitations. Therefore, to interpret the boundary effects as causal impacts of flood zoning policies on the housing market, a conservative approach is to control for or “hold constant” houses’ attributes when comparing estimated property values just inside and just outside flood zones. Thus, Columns 3 and 4 in Table 4 should be considered our main results regarding the effect of SFHA policies on the housing market. Finally, the results in Columns 5 and 6 of Table 4 show that FSF risk is smooth at the SFHA boundary, which provides further evidence that policy discontinuities but not risk discontinuities are driving the results seen in Total Value.
The 2% premium in inland counties appears driven by discontinuities in improvement value, consistent with the argument that supply constraints are driving up the SFHA housing values inland, conditional on observed housing attributes. This may reflect scarcity of developed housing inside SFHAs or higher costs to build inside SFHAs not captured by our attribute variables.
Overall, the hedonic approach and RD analysis produce different results that highlight the potential impact of confounding factors such as unobserved amenities on housing values. Otherwise, the impacts of flood policies may be inconsistently estimated. Here, the housing market appears to have adapted to SFHA flood zones by altering housing attributes and housing values—though the impacts differ in coastal and inland counties. Housing value gradients are smooth at SFHA boundaries in coastal areas, seemingly the result of offsetting effects on land and improvement values and older homes on larger lots inside SFHAs. Conversely, housing value gradients are discontinuous at SFHA boundaries in inland areas. Housing values inside inland-county SFHAs exhibit a modest premium, consistent with bigger homes and supply constraints.
Discussion
Combining flood zone and housing data for millions of parcels affords the opportunity to understand complexities in how flood zoning captures flood risks and how it influences housing development. Although flood zones have been designated in high-risk areas, the distribution of flood risk around SFHA boundaries holds interest for at least two reasons. First, the smoothness of the flood risk gradient is itself interesting considering the meaning of SFHA status designation, the flood mapping process, and analysts’ use of SFHA status to proxy for flood risk. Second, the smoothness of the flood risk gradient helps us distinguish the (SFHA) policy effects from flood risk effects. For SFHA boundaries as thresholds in an otherwise smooth risk surface, SFHA status (locally) better reflects policy than flood risk.
Results in Table 2 reveal the risk distribution around SFHA boundaries. Relative to land outside flood zones, flood risks are higher deeper inside SFHAs, and the risk differential fades rapidly as one approaches the boundary. We can formalize a test for discontinuities in the risk gradient at the boundaries by conducting an RD analysis for FSF Risk as the dependent variable, akin to the analysis for Total Value. As expected, flood risks are smoothly distributed around SFHA boundaries. This RD approach helps us distinguish between the impacts of policy (being in an official floodplain) and other correlates (flood risk). It also provides evidence that flood zoning’s binary notion of flood risk misrepresents flood hazards. SFHA status correlates well with flood risk, but not around the boundary.
If flood management policies (via SFHAs) were to significantly impact housing development, we would see discontinuities in housing characteristics at the SFHA boundaries. This is especially true if the underlying construct that SFHAs purport to map—flood risk—was itself smoothly distributed on either side of the boundaries. Our empirical approach relies on an RD design to sharpen our focus to comparisons between homes just on either side of the boundary, removing from the sample millions of homes that likely differ on many other (unobservable) dimensions than just exposure to SFHA-based regulation. Thus, we interpret discontinuities in housing values evident at the boundaries as caused by flood management policies impacting the housing market.
We look at other housing characteristics using this technique to see how SFHA-related flood management policies affect other patterns in housing development. The results for numbers of rooms, year built, and size (see Online Supplemental Appendix A6 and A7) generally show significant discontinuities at boundaries. Taken broadly, SFHAs appear to significantly affect the size, age, and other attributes of this sample of single-family Texas homes. The effect sizes are modest, although economically significant, and exhibit important variation between coastal and inland regions. This analysis is conditional on housing already existing (prior to 2014) and does not test whether flood zones affect new developments, conversions, or demolition (Online Supplemental Appendix Table A6 offers indirect evidence that newer housing tends to accumulate just outside floodplains, suggesting flood zone policies effectively divert development away from floodplains). The finding that existing homes look different on either side of a flood zone boundary suggests that Texas floodplain designations influence housing patterns along these dimensions. At least for inland counties, the SFHAs themselves appear to account for slightly higher property values.
The discontinuity shown in this analysis is confined to (assessed) housing values in inland counties, which are higher inside SFHAs. While this is consistent with our hypotheses (namely additional construction costs and supply constraints induced by regulations inside SFHAs), this result does not hold for coastal counties. If SFHAs distort demand to favor housing outside of flood zones over housing inside them, then it is remarkable that this effect does not appear in coastal regions. Further, the greater housing values associated with inland-county SFHA boundaries suggests that any effect of floodplain designation and regulation to displace demand to outside of SFHAs is more than offset by upward pressure on property values inside the floodplain.
The consistently null results for coastal counties could reflect offsetting forces or, perhaps, a housing market largely unmoved by floodplain designation. The null effects in this cross-sectional snapshot might also be temporary, changing over time. Though it might seem at times that housing markets ignore the floodplain designation, heterogeneity and offsetting forces are likely better explanations. After all, the observed discontinuities for coastal counties on other housing characteristics (e.g., acreage, age, square footage) suggests that the housing market is not ignoring flood zone designations. Coastal-county homes inside SFHAs have larger and more valuable lots but less valuable improvements. Those roughly offset, and controlling for those housing characteristics eliminates the boundary effect. This finding reinforces the importance of local governance and how it can be problematic to pool coastal and inland areas in analyzing flood risk management. Further, it bears emphasizing that we estimate local average treatment effects around SFHA boundaries, results that might not generalize to other properties far from boundaries.
Overall, this analysis isolates and estimates the effect of flood zoning policies on assessed housing value after controlling for flood risk and unobserved amenities. We find no significant boundary effect on assessed value in coastal counties and positive effects in inland counties. Because the outcome is assessor-reported market value (not sales price), these findings speak directly to public valuation practice: assessed values near SFHA boundaries do not consistently incorporate designation and associated regulations in the same way across Texas. More generally, while assessors rely on mass-appraisal systems, our analysis does not reveal any common statewide rule for how flood risk or SFHA designation is incorporated into those valuations. By contrasting these RD results with a conventional hedonic analysis, we also show that models more exposed to unobserved amenity bias can yield substantively different estimates of the effects of flood zoning policies on the housing market. We interpret the inland result as consistent with supply constraints caused by regulations in floodplains. These mixed results for housing value effects of SFHA designations between coastal and inland counties offer important contributions to a literature that has relied on much smaller or more selective samples and often struggles to disentangle the confounding amenity effects from the floodplain designation.
The implications of our findings for flood preparedness policies are more limited than a simple market-boost interpretation. In coastal counties, the lack of a significant boundary discontinuity in assessed values does not imply that floodplain regulation is irrelevant. The attribute results suggest meaningful differences in age, size, and lot characteristics of homes on either side of the boundary. In inland counties, the positive boundary effect on assessed values is consistent with higher construction costs or tighter supply inside SFHAs rather than with enhanced market attractiveness per se. A more cautious conclusion is that we do not find evidence of property blight or systematic disinvestment at SFHA boundaries, even though floodplain regulation appears to shape the type, cost, and timing of development. From a policy perspective, SFHA regulation may alter housing composition and unit costs without producing uniform reductions in assessed values.
The different patterns for inland and coastal counties merit further investigation. The role of supply constraints accompanying floodplain designations, and how they differ between coastal and inland areas, is particularly important for informing flood management and policy. FEMA’s recently adopted Risk Rating 2.0 policy changes its pricing methodology for flood insurance to decouple insurance premiums from SFHA status. This reform makes sense given the lack of risk discontinuity at SFHA boundaries as shown here. Yet insurance mandates and floodplain management are still based on SFHAs and their boundaries. Thus, as better flood risk information becomes available, we expect the regulations and mandates accompanying floodplain designations to drive development patterns more than their information effects.
Supplemental Material
sj-docx-1-usj-10.1177_00420980261448667 – Supplemental material for Impacts of flood zoning policies on housing markets: Evidence from the national flood insurance program
Supplemental material, sj-docx-1-usj-10.1177_00420980261448667 for Impacts of flood zoning policies on housing markets: Evidence from the national flood insurance program by Pin Sun, Douglas Noonan and Lilliard E. Richardson in Urban Studies
Footnotes
Acknowledgements
The authors acknowledge the First Street Foundation for providing access to parcel-level flood risk data. We also thank the participants and discussants at various conferences—including the Southern Economic Association (Florida), the Association for Public Policy Analysis & Management (Washington, DC, USA), the Urban Economic Association North American Meeting (World Bank, Washington, DC, USA), and the 8th Annual Conference on Environmental Politics and Governance (Penn State)—for their valuable feedback and insights.
Author contributions
All three authors have been involved in research design, literature review, writing, and editing. Pin Sun primarily handled the data collection, analysis, and creation of the maps and figures.
Funding
The authors disclosed receipt of the following financial support for the research, authorship, and/or publication of this article: Pin Sun gratefully acknowledges financial support from the National Natural Science Foundation of China (Grant No. 72503244), and the Research Fund of Renmin University of China (Grant No. 24XNF059).
Declaration of conflicting interests
The authors declared no potential conflicts of interest with respect to the research, authorship, and/or publication of this article.
Data availability statement
The First Street flood risk data are available from the First Street Foundation with a data agreement. The flood maps are available from the State of Texas and FEMA. GIS data are available from the Census Bureau. The housing attributes and housing value assessments are proprietary data available from CoreLogic.
Supplemental material
Supplemental material for this article is available online.
References
Supplementary Material
Please find the following supplemental material available below.
For Open Access articles published under a Creative Commons License, all supplemental material carries the same license as the article it is associated with.
For non-Open Access articles published, all supplemental material carries a non-exclusive license, and permission requests for re-use of supplemental material or any part of supplemental material shall be sent directly to the copyright owner as specified in the copyright notice associated with the article.