
Abstract
This article examines the evolution of wealth inequalities across regions in Britain, and in particular the role of house price inflation, homeownership and mortgage debt in driving these wealth inequalities. Drawing on descriptive and regression analysis of eight waves of the UK Wealth and Assets Survey from 2006 to 2022, our findings indicate that (net) wealth inequalities rose more rapidly (and from higher levels) in London than in the rest of Britain. We argue that that this discrepancy can be significantly attributed to housing: not only did London experience higher rates of house price inflation but these gains were shared amongst a smaller subset of property owners and were levered with relatively high levels of mortgage debt. Moreover, London also has a disproportionately large number of asset-poor, low-income renters, which further exacerbates wealth inequalities. We also find that increases in homeownership rates at the regional scale are consistently associated with a compression of (net) wealth inequalities. Our findings highlight the need for more research that considers the distinctive features of different regions, and particularly ‘superstar cities’, in conditioning the relationships between house price inflation and wealth inequalities.
Introduction
In Capital in the Twenty-First Century, Piketty (2013) demonstrated how after dropping to historic lows in the post-war decades, wealth inequalities have risen again since the 1980s. Because the rate of return on capital exceeded that on labour (r > g), those with existing capital saw their incomes and wealth rise while those who relied on labour alone fell behind. Although this is an abstract concept to most people, the socio-economic consequences of these wealth inequalities are rapidly becoming the major driver of contemporary socio-economic inequality (Savage et al., 2024).
If wealth inequalities are the major driver of contemporary socio-economic inequality, then housing is arguably the major driver of wealth inequalities. Following on Piketty’s heels, an array of studies convincingly argued for house price inflation as a key factor driving (housing) wealth inequalities. It is now conventional wisdom that since the 1980s, rapid house price inflation has increased the wealth of homeowners at the expense of renters and, in doing so, has widened wealth inequalities whilst undermining access to homeownership (Bonnet et al., 2014).
More recently, geographers have layered a spatial dimension onto this thesis, showing how, post Global Financial Crisis (GFC), house prices have risen more rapidly in areas that were already more expensive (though see Levin and Pryce, 2011 for contrasting evidence). Some have gone on to link this spatial divergence in house prices to a rise in wealth inequalities. For example, in their study of the post-GFC housing market in Spain, Arundel et al. (2024) concluded that ‘more expensive areas saw greater absolute gains [in house prices] and higher rates of appreciation’, with ‘the housing market not only reflecting socio-economic divides but amplifying inequality through divergent wealth accumulation among homeowners.’
Such conclusions, however, are limited by a lack of empirical studies that directly examine the relationship between house price inflation and wealth inequalities at the sub-national scale. This is an issue because the relationship between house price inflation and wealth inequalities is neither direct nor linear. Rather, it is mediated by a range of housing (and non-housing)-related factors including mortgage debt, homeownership rates and pre-existing distribution of housing wealth. Unless we know who owns these houses, and how much debt/leverage they have, then we can only guess at the relationship between house price inflation and wealth inequality.
This article addresses this gap. Drawing on eight waves of the UK Wealth and Assets Survey (WAS; 2006–2022), we empirically examine the role of homeownership, house price inflation and mortgage debt in driving inequalities between the upper and lower wealth quartiles (75:25) across the 11 regions of Britain. 1 Britain is an especially interesting case study because of the extreme contrast between London and the rest of the country (McCann, 2020). Indeed, London represents the archetype of the ‘global city’ (Sassen, 2013) or ‘superstar city’ (Le Galès and Pierson, 2019); one that has economically pulled away from its surrounding hinterland.
In addition to descriptive analysis, we also conduct regression analysis (structural equation model), which allows us to tentatively isolate the effect of different variables in explaining variation in (housing) wealth inequalities within regions over time. The key contribution of this article is to demonstrate how the distinct political-economic features of London have led to different dynamics between house price inflation, housing tenure and wealth inequalities. In particular, we argue that not only did London (like other superstar cities) experience higher levels of house price inflation – this is well known – but that the transmission mechanism between housing price inflation and wealth inequalities was stronger in London than in the rest of the country.
We attribute this strong transmission mechanism between house price inflation and wealth inequalities to several distinguishing features of London’s political economy. First, the fact that housing wealth in London was already unequally distributed in the first place – as reflected most notably in low homeownership rates – meant that house price gains were shared amongst a smaller and wealthier proportion of the population. Second, the returns that London homeowners made on their housing wealth were likely further levered by their relatively high levels of mortgage debt. Third, London has a disproportionately high number of asset-poor households whose ability to accumulate wealth is constrained by high rental costs.
The other contribution of this article is to demonstrate that across all regions in Britain, a decline in homeownership rates is associated with a widening of wealth inequalities. It remains unclear, however, the extent to which the decline in homeownership rates causes wealth inequalities to widen (e.g. through exposing renters to rising rents) or whether the decline in homeownership rates is simply a reflection of widening wealth inequalities caused by other factors.
The remainder of the article is structured as follows. The second section selectively reviews research on the relationship between housing and wealth inequalities, at a (cross-)national and sub-national scale. The third section introduces the data and methodology. The fourth section 4 presents and discusses the results, and the fifth section concludes the article.
Literature review
(Housing) wealth inequalities at the (cross-)national scale
Most of the empirical literature directly examining the relationship between housing and wealth inequalities has been situated at either the national scale, through tracking different indicators within a single country over time (e.g. Arundel, 2017), or at the cross-national scale through comparing these trends across different countries (e.g. Bonnet et al., 2014) and modelling them with regression and decomposition analyses (e.g. Pfeffer and Waitkus, 2021). These studies have demonstrated that despite being more evenly distributed than financial wealth, housing wealth is the central driver of overall wealth inequality. Analysing 15 advanced economies that make up the Luxembourg Wealth Survey, Pfeffer and Waitkus (2021) found that cross-national variation in wealth inequalities (measured using Gini coefficient) was centrally determined by the unequal distribution of housing equity. This is echoed in the UK case, where the top two wealth deciles consistently hold more than 60% of net property wealth, while the top four possess more than 85% (Arundel, 2017).
House price inflation has been an important driver of the increasingly unequal distribution of housing wealth. In the simplest terms, house price inflation works to transfer income from future homeowners (i.e. current renters) to present homeowners/landlords who get the benefit of a largely passive increase in property values when they sell or release equity. House price inflation is partly a reflection of rising rents, which further limits the ability of private renters to accumulate wealth. Consequently, positive house price inflation will generally widen the wealth gap between tenures, and since homeowners generally have more overall wealth than renters, will widen wealth inequalities overall. Again, the (cross-)national evidence broadly supports this logic. Looking across different Western countries, Rognlie (2014) and Bonnet et al. (2014) found that growth-in-the-capital-to-income ratios (as identified by Piketty) can be almost entirely explained by rises in house prices. Likewise, Fuller et al.’s (2020) study of Western European countries found house price inflation to be a significant driver of wealth-to-income ratios (whilst homeownership rates were insignificant).
However, the exact strength (and perhaps even direction) of the relationship between house price inflation and wealth inequalities will depend upon a range of mediating factors – two of which relate specifically to housing. First is the level and distribution of mortgage debt. As well as increasing overall house prices (e.g. Kohl, 2018), higher levels of mortgage debt will accentuate the effect of house price inflation on a homeowner’s housing equity/wealth. Mortgage debt is a boon to homeowners if house prices rise, but it can be equally detrimental if house prices fall: indeed, if house price decreases are concentrated on highly indebted, equity-poor homeowners then they could actually widen wealth inequalities (see Carpantier et al., 2018).
The second mediating factor is the pre-existing distribution of housing wealth. If housing wealth is unequally distributed in the first instance, then the effect of any subsequent house price inflation on wealth inequalities will be stronger, as those gains will be concentrated among a smaller group of homeowners/landlords. For this reason, widespread homeownership has been promoted as a means of widening access to property ownership and equalising the wealth distribution (Arundel and Ronald, 2021; Kohl, 2018). The empirical evidence clearly demonstrates that countries with higher homeownership rates also have lower rates of wealth inequality since housing wealth is more evenly spread (Pfeffer and Waitkus, 2021).
The factors driving the correlation between homeownership and wealth inequalities are unclear though. Some economists argue that the attractiveness of homeownership vis-a-vis renting encourages lower-wealth households to save more (and consume less), thus compressing wealth inequalities (e.g. Kindermann and Kohls, 2016). This thesis attributes causal agency to homeownership as a wealth-equalising institution, albeit a socially and politically constructed one. This incentive to save privately (via homeownership) is strengthened in the presence of a weak welfare state – and particularly a weak state pension – hence why those countries with strong welfare states counterintuitively report higher levels of wealth inequality (Kaas et al., 2019).
Alternatively, one could argue that homeownership is merely an effect or reflection of higher wealth inequalities: namely, that for a variety of reasons identified by Piketty and others wealth becomes more unequally distributed, and as a result, fewer people can afford to become homeowners. Later, we discuss these two competing explanations in the context of our analysis. For now, though, it will suffice to conclude that regardless of which way the causal arrow points, low levels of homeownership have the effect of concentrating house price gains among a smaller proportion of the population. This means that house price inflation combined with low levels of homeownership can have powerful effects in terms of driving wealth inequalities.
Sub-national/regional scale: Superstar cities versus the rest
Over the last half-century, economic geographies have been fundamentally refined by the rise of ‘global cities’ (Sassen, 2013) or ‘superstar cities’ (Le Galès and Pierson, 2019), as these high-income, globally connected metropolitan areas have economically pulled away from the rest of their respective countries. This divergence was driven by broader global economic changes, most notably globalisation, financialisation and deindustrialisation, all of which conferred economic advantage to these global cities at the expense of their hinterlands (Le Galès and Pierson, 2019).
Of course, the economic spoils in these superstar cities have not been evenly spread. When it comes to income inequalities, there is a substantial academic literature demonstrating that global cities have become more unequal than other parts of the country, a trend that is exacerbated by high rental costs and the influx of the super-rich (Atkinson, 2021; Le Galès and Pierson, 2019).
This polarisation of incomes has also been reflected in the changing class structure of these cities. Looking at London, Hamnett (2024) found ‘asymmetrical polarisation’ of the population whereby continued growth of the (presumably, higher-income) professional and managerial class in inner London was accompanied by the growth of (presumably lower-income) self-employed and routine workers in outer London.
While there is a substantial literature on the socio-demographics and income inequalities in these superstar cities, there are very few studies on their wealth inequalities or how these compare with other regions in the country. In the UK context, we could only find one paper (Bourquin et al., 2024) and one blogpost (D’Arcy, 2018) that explored wealth inequalities within regions, and neither in great depth. Instead of measuring within-region wealth inequalities directly, housing scholars have used house prices as a proxy for wealth inequality. From the 1990s, house prices in superstar cities have diverged from the rest of the country, a trend that continued post GFC as declining interest rates diverted risk-averse capital into these cities’ housing markets (Amaral et al., 2025). This divergence in house prices has been reversed somewhat by post-COVID trends in suburbanisation and increases in interest rates, which have both hit superstar cities particularly hard (e.g. Hudson, 2024).
Using house price inflation as a proxy for (housing) wealth has allowed scholars to achieve great geographical precision by drawing on granular house price datasets and contrasting house price trajectories of low-value geographies versus high-value neighbourhoods (Amaral et al., 2025; Arundel et al., 2024; Levin and Pryce, 2011). Others have supplemented this with population data analysis to explore the characteristics of those purchasing homes in different housing markets (Arundel and Hochstenbach, 2020; Wind and Hedman, 2018). In the Norwegian context, for example, Galster and Wessel (2024, 2025) found that over the period of 2010–2018, homeowners residing in urbanised areas (especially Oslo) were better positioned to accumulate wealth than the rest of the population.
The limitation with these studies, however, is that they do not actually measure (housing) wealth inequalities at the sub-national scale. Consequently, they are unable to directly examine the relationship between house price inflation and wealth inequalities. This is an issue because, as we have discussed, the relationship between house price inflation and wealth inequalities is neither direct nor linear but is mediated by a range of other factors. Whilst it is assumed that house price inflation will translate into higher levels of wealth inequality, this may not be the case if homeownership rates are very high, or if house price inflation is concentrated on relatively low-wealth neighbourhoods with high degrees of leverage.
The explanation for this research gap is obvious: data. Very few datasets comprehensively track the wealth and assets of populations, and those that do tend to survey a small sample of the population, thus precluding analysis at lower spatial scales. As Bourquin et al. (2024) put it in their comprehensive survey of UK income and wealth inequalities, household surveys are: not large enough to provide robust estimates below the level of the nation/region … There are other sources of data that can help us learn about spatial disparities in income and wealth, but none of them tells us about inequalities within geographical areas as well as between them.
We face significant data limitations too and have had to make several assumptions and methodological compromises accordingly (see below). Nevertheless, by operationalising measures of regional (housing) wealth inequalities (and other associated variables), we are able to make a distinctive contribution to literatures at both spatial scales above. At the national scale, we mobilise the comparative leverage of 11 different regions over eight waves to more accurately probe the relationship between housing and wealth inequalities across Britain. Further, by tracking wealth inequalities and various housing-related factors at the regional scale, we are also able to explore how these trends vary across these regions, with a particular focus on the divergence between London and the rest of Britain.
Data and methodology
This article involves a combination of descriptive and regression analysis. In contrast to the existing literature on housing and wealth inequalities which takes the household or country as the unit of analysis, both aspects of this article adopt a regional lens, comprising the 11 different regions of Britain. Britain makes an interesting case study, first because of its emphatic pursuit of homeownership and house price inflation as a means of generating economic growth, spreading wealth and promoting asset-based welfare – a pursuit which, needless to say, is riddled with contradictions (Arundel and Ronald, 2021; Crouch, 2009) – and second because of the distinctive features of London. With a population of approximately 9 million, the political economy of Greater London (herein ‘London’) represents the most extreme Western example of a superstar city that is detached socially and economically from the rest of the country (McCann, 2020). To capture the distinctive political economy of London, we conduct all regression analysis including and excluding this superstar city.
As noted, the obvious reason why previous literature has spent much less time examining the relationship between housing market dynamics and wealth accumulation at a regional scale is the absence of reliable data. Using the WAS data, this article partially addresses this gap, examining how house price inflation and homeownership rates condition wealth inequalities across 11 regions in Britain while controlling for a range of factors including gross domestic product (GDP), income inequality and region-invariant factors.
Launched in 2006 by the Office for National Statistics, the WAS measures the economic well-being of households in terms of their assets, savings, debt and planning for retirement, and provides time series data for the distribution of wealth across regions within Britain. All measures of wealth are net of any debt, including mortgage debt. Using WAS data tables from 2006–2008 to 2020–2022 for the top 25th, 50th and 75th percentile points of the wealth distribution, we calculate two total wealth inequality (TWI) ratios for 11 regions: first, the 75p/25p ratio, which gives the share of total net wealth received by the top 75th percentile household divided by the total net wealth received by the bottom 25th percentile household; second, the 50p/25p, which ratio gives the middle and the lower 25th percentile end of the wealth distribution. Due to sample size limitations, we are unable to compute more precise measures of the upper end of the wealth distribution, such as the 90p/10p ratio (as adopted by Piketty, 2013).
Focussing on the top 75th percentile means that housing is likely to act as a stronger driver of wealth inequality than if we had examined the top 90th or 99th percentile. This is because as we move up the very top end of the wealth distribution, housing becomes a less central component of total wealth. In 2016–2018, for instance, housing made up 47% of total wealth for the 7th decile, 29% for the top decile but less than 10% for those with over £5 million in assets (Advani et al., 2021). The wealth of the very highest percentiles is therefore more likely to be driven by the performance of financial and business assets rather than by housing.
Since all forms of wealth are self-reported, this raises issues around imprecision. Nonetheless, the evidence indicates that these are unlikely to be an overriding concern in the case of this study. 2 The total sample size ranges from 15,100 households (Wave 8) to 30,500 households (Wave 1), which when spread across 11 regions equate to an acceptable sample size, and overall the 75p/25p metric follows coherent trends.
Table 1 presents model variables with full descriptions. While the 75p/25p and 50p/25p TWI ratios are the two dependent variables, homeownership rate and house prices are the two main variables of interest in our empirical modelling. The UK house price index uses sales data collected on residential housing transactions (whether for cash or with a mortgage) from HM Land Registry and Registers of Scotland and is calculated by the Office for National Statistics. The index applies a hedonic regression model to the various sources of data on property price and attributes to produce estimates of the change in house prices in each period; it is adjusted to allow for differences between houses sold in different periods, for example the type or size of property. 3 Homeownership rate (the number of homeowner households divided by the total number of households in the region) is calculated from WAS data tables. In addition to the variables above, we also included a range of regional control variables such as GDP that measure regional prosperity. Using data from the annual Family Resource Survey (sample size: approx. 20,000 households), we include two measures of income inequality: the proportion of the top British income quintile before housing costs that reside in a region, weighted by that region’s population, 4 and the same measure for the bottom income quintile but after housing costs. 5
Model variables.
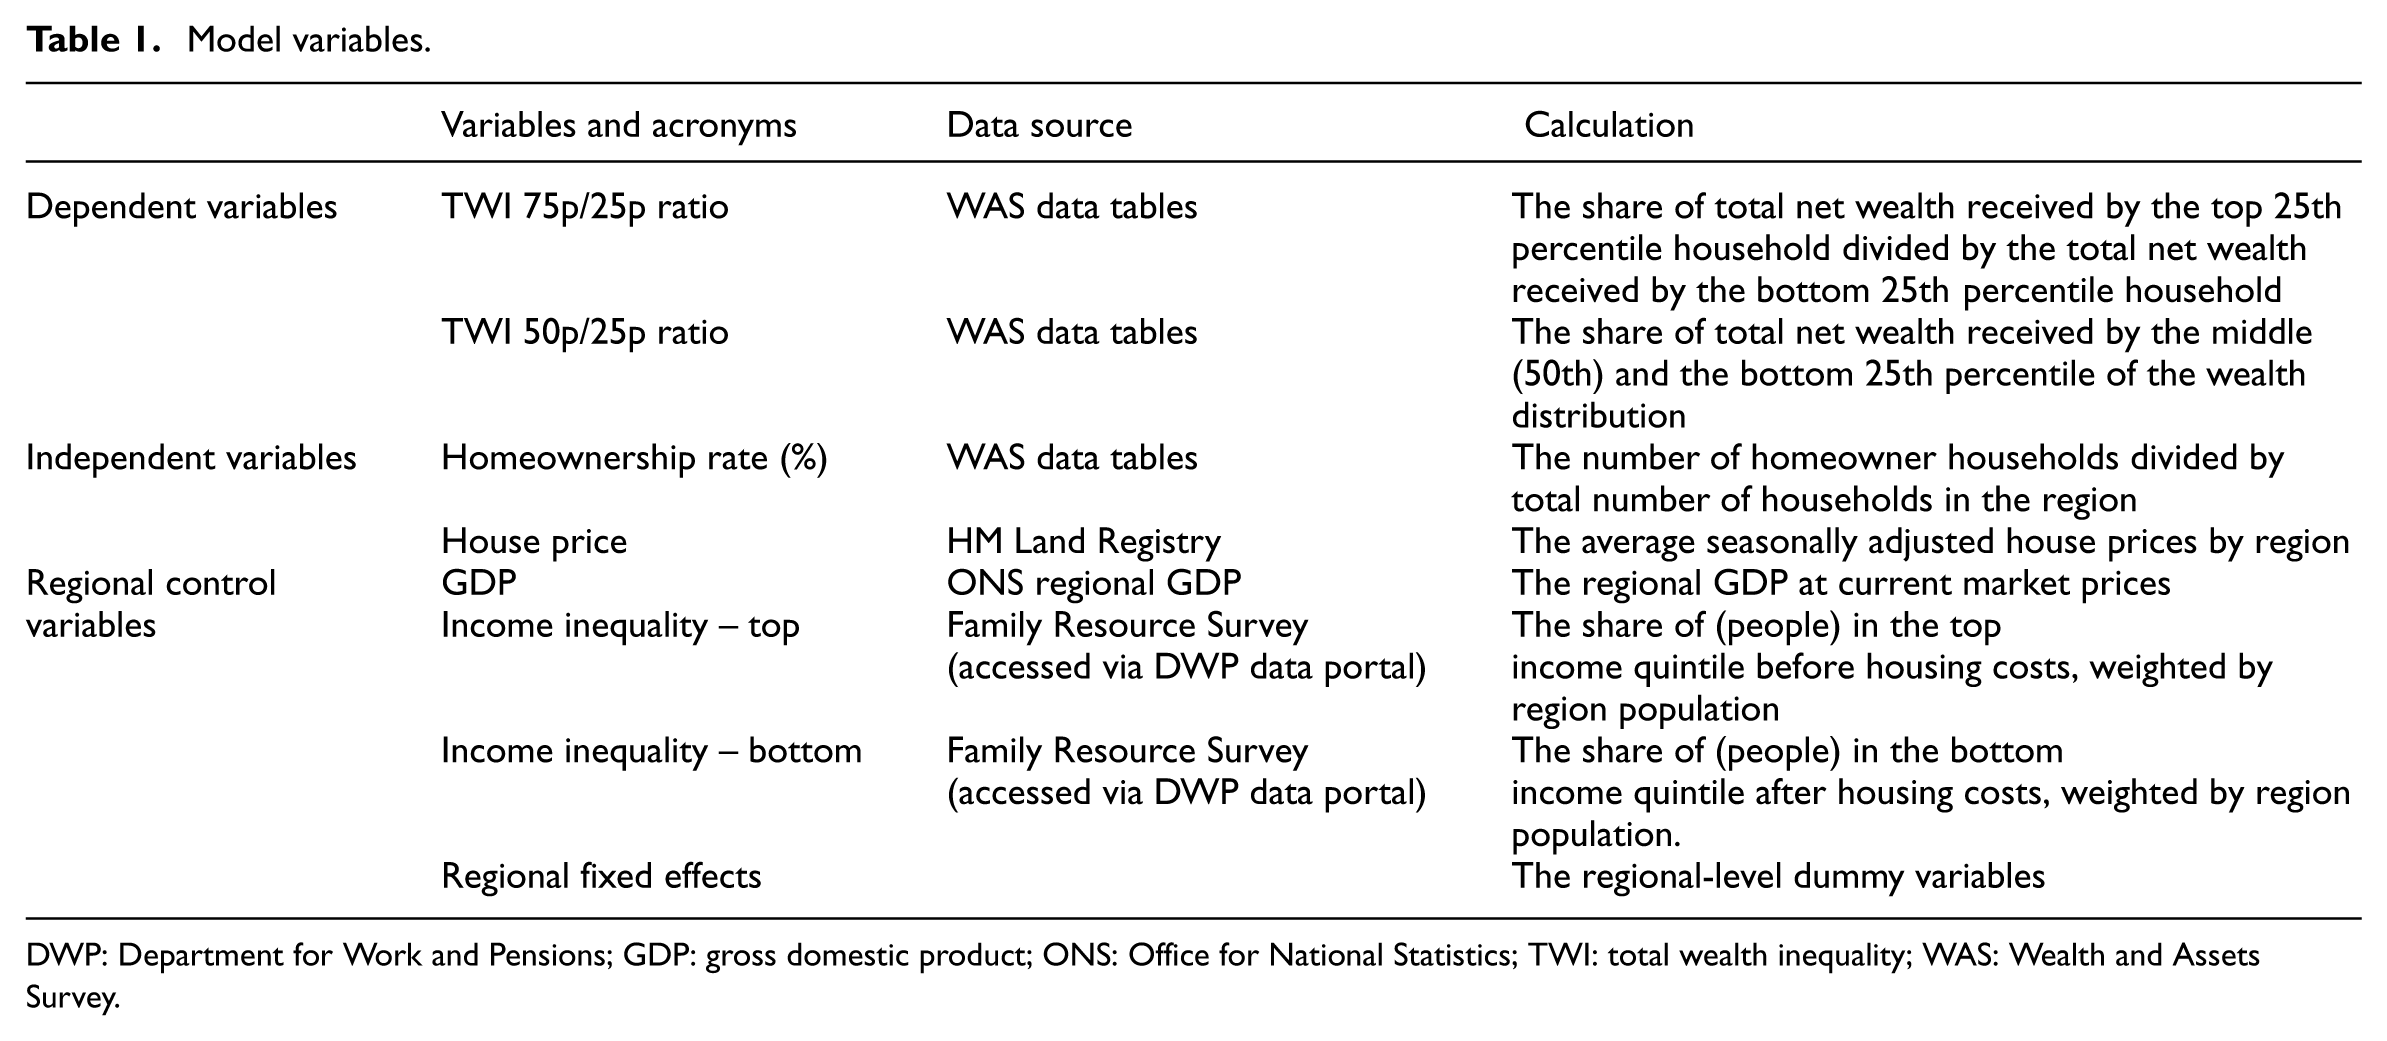
DWP: Department for Work and Pensions; GDP: gross domestic product; ONS: Office for National Statistics; TWI: total wealth inequality; WAS: Wealth and Assets Survey.
The descriptive statistics for our dataset are presented in Appendix Table A1. We only have data on the stock of mortgage lending across different regions from 2013 onwards, so while this variable is incorporated into our descriptive analysis, it is excluded from our regression analysis. Unfortunately, we do not have consistent and reliable regional data on wealth inheritance, so we are unable to include that as another control variable.
We pooled our data over the 2006–2008 to 2020–2022 period across 11 regions. Given the exceptional features of London’s political economy, we ran all regressions including and excluding London. Our analysis progresses in two steps. The first step provides a descriptive analysis of wealth inequalities in Britain and London, drawing inferences about the role of housing therein. Second, to probe the underlying causal mechanisms, we estimate a structural equation modelling analysis exploring the relationships between housing market factors – that is, house price inflation and homeownership rate as the prime explanatory variables – and TWI as mediated by regional GDP, income inequality and regional fixed effects.
Following Galster and Wessel (2024), we construct a conceptual framework as portrayed in Figure 1. Based on the literature review above, it hypothesises that higher house price inflation enhances regions’ wealth inequalities whereas a higher homeownership rate reduces wealth disparities. Figure 1 exhibits the pathways of housing market factors’ influence on TWI. House price inflation is likely to affect homeownership rate with a lag (path c in Figure 1). Lagged house price inflation and homeownership rate both have causal paths directly to TWI (path a and path b, respectively). Regional prosperity (or GDP) and income inequality affect both house price inflation (via paths d, f and i) and homeownership rate (via paths e, g and j). Hence, regional GDP, income inequality and regional fixed effects are exogenous predictors with causal paths both indirectly to TWI via intervening variables of house price and homeownership rate. GDP (via path l) and income inequality (via path h for top income quintile and path k for bottom income quintile in Figure 1) also directly affect TWI.
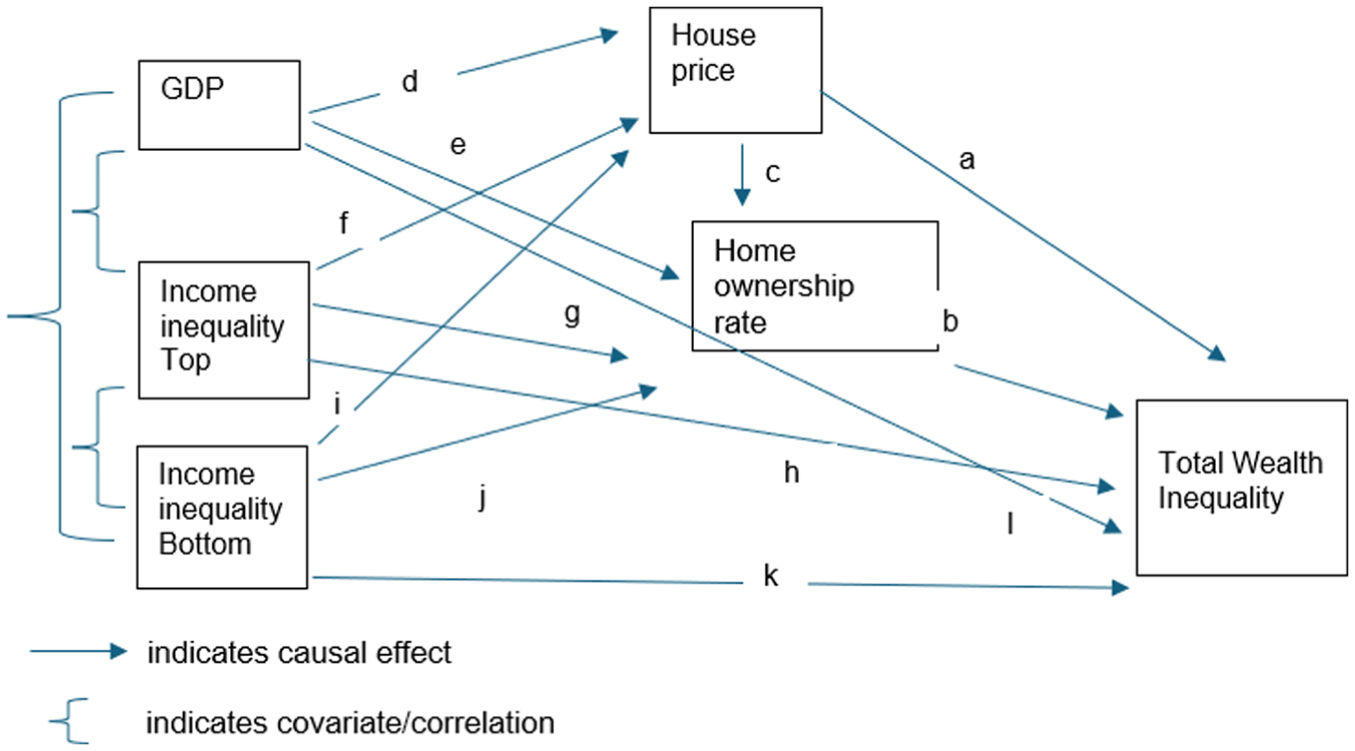
Conceptual framework for the role of housing market in wealth inequality.
To quantify the role of housing market dynamics on TWI through these direct and indirect paths, we estimate a linear-log structural equation model, where all independent variables are log-transformed but the dependent variable of TWI ratio is not.
Descriptive and regression analysis
This section presents our analysis of wealth inequalities in Britain and London, drawing inferences about the role of housing therein. It starts with the descriptive analysis before moving onto the formal regression analysis.
Economic performance of Britain and London
For Britain, the last two decades have seen a trio of ruptures – the GFC, Brexit and COVID-19 – and yet the defining trend has been a constant one of economic stagnation, with average wages only returning back to their pre-GFC levels in 2023 (Resolution Foundation & Centre for Economic Performance, LSE, 2023). At the same time though, powered by declining interest rates, wealth has risen considerably: by 2020, total private wealth in Britain equalled seven times GDP, compared to five times GDP in 2005.
These stagnant incomes and rising wealth continue to be distributed unequally between regions, more so than in any other Western country (McCann, 2020). For example, in 2020–2022 the median household wealth in the richest region (South-East England) was almost double that of the poorest region (North-East; Francis-Devine, 2025).
Wealth inequalities in Britain and London
Like most other advanced economies, wealth inequalities in the UK declined over the first 70 years of the 20th century, before plateauing from the early 1980s onwards (Bourquin et al., 2024; Piketty, 2013). Before drawing any sanguine conclusions though, two caveats are in order. First, wealth inequalities in Britain have remained at very high levels, much higher than income inequalities (albeit marginally lower than wealth inequalities in other G7 countries). Second, even if the wealth inequality ratio has not increased significantly since 1980, the absolute distance between different parts of the wealth distribution has (Bourquin et al., 2024). For example, in the decade after 2006–2008, despite wealth inequality ratios remaining stable, the mean wealth of the 10th wealth decile grew by 8.9 times the typical full-time salary, while that of the 5th decile only grew by two-thirds the typical full-time salary (Bourquin et al., 2024).
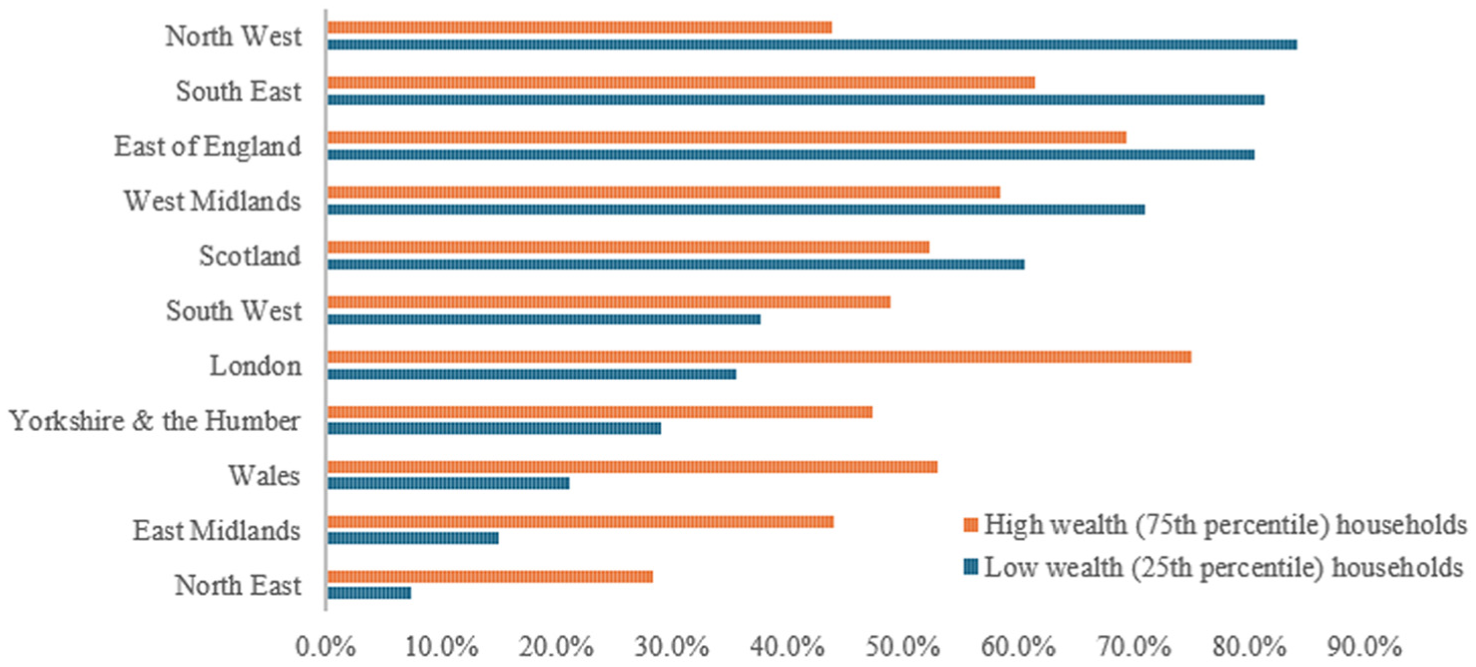
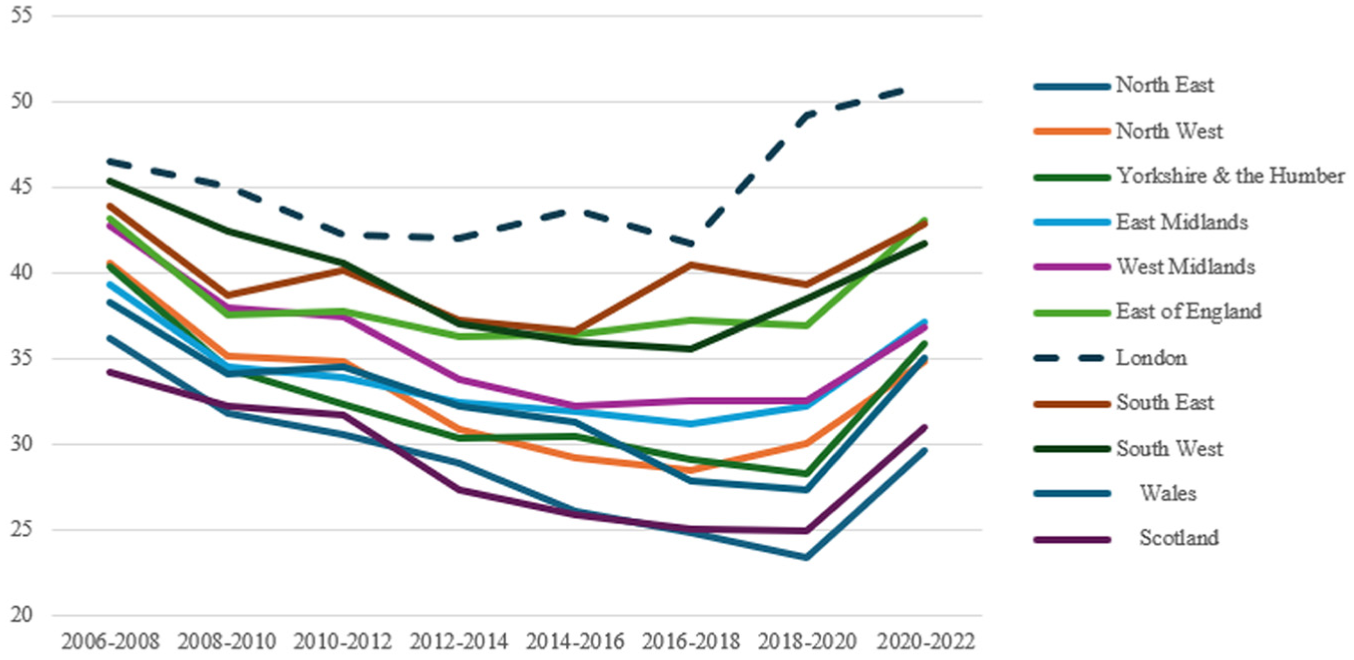
Wealth inequalities have been consistently higher in London than in the rest of Britain. In 2006–2008, the top 75th percentile in London owned 20.1 times more wealth than the bottom 25th percentile, much higher than in other regions, including the neighbouring South-East of England where wealth inequalities actually decreased (see Figure 2). London has such high levels of wealth inequality not so much because it has lots of very wealthy people (as highlighted by Atkinson, 2021) but rather because this relative wealth co-exists with extreme poverty: London had a higher proportion of asset-poor adults (bottom 15%) than any other region (Bourquin et al., 2024), meaning that on average it is actually one of the poorer regions in Britain (Francis-Devine, 2025). This discrepancy between rich and poor has been exacerbated over the last 15 years (see Figure 3): while the wealth of London’s top 75th percentile increased by 75% by 2022 (higher than in any other region), that of London’s bottom 25th percentile increased by only 36%.
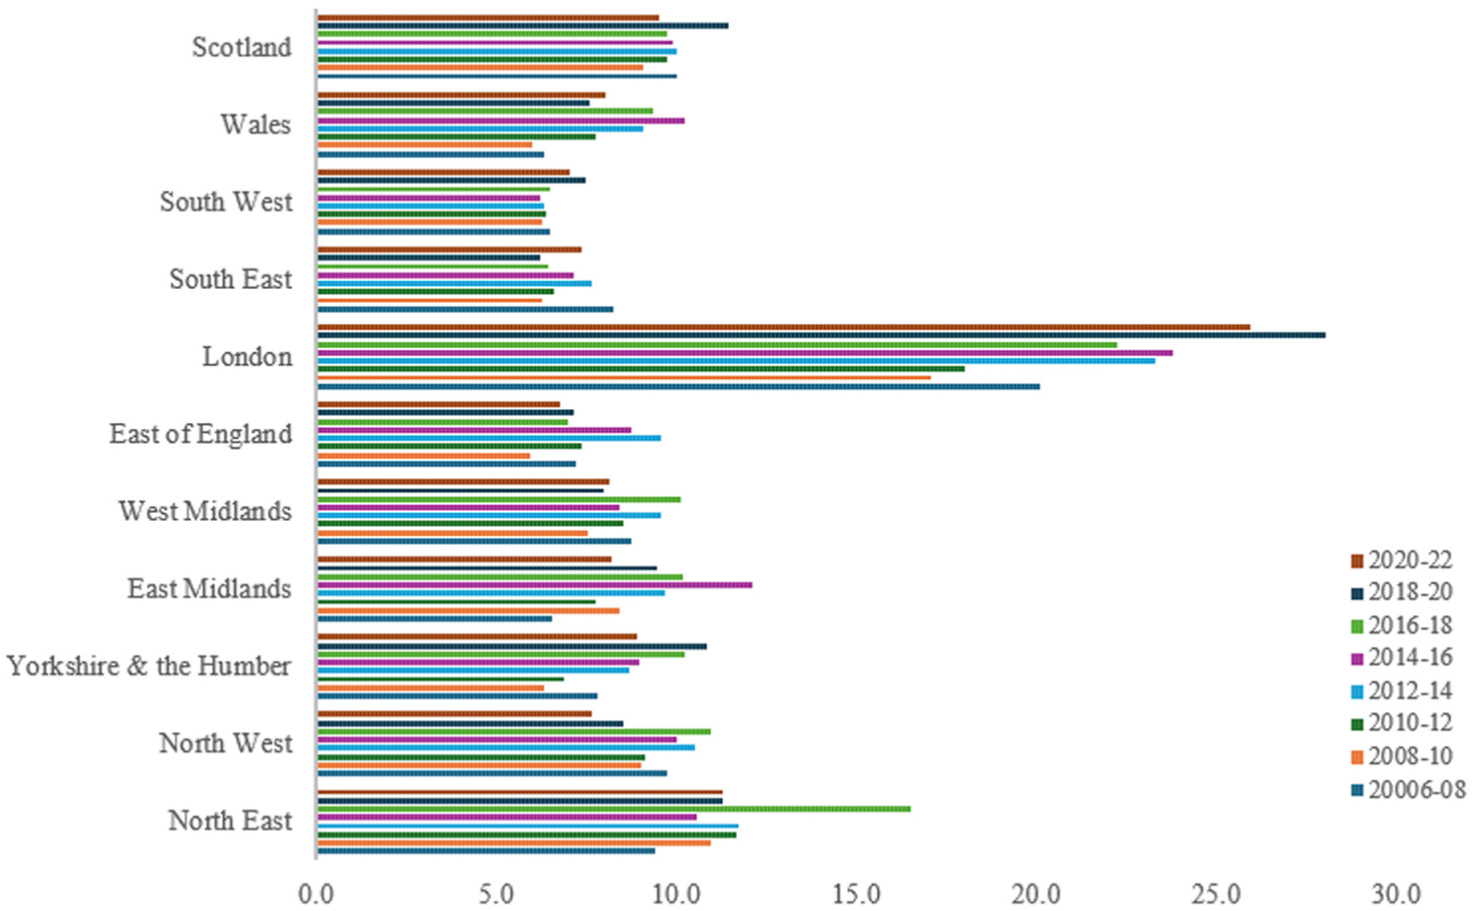
Total net wealth inequality (75p/25p) ratio by region from 2006–2008 to 2020–2022.
Change in total household net wealth by region: 2006–2008 to 2020–2022.
Income inequalities in Britain and London
What then explains the above trends in wealth inequality? The first key factor to consider is income inequality. Across Britain there has been no clear trend in income inequalities since 2006–2008 (Bourquin et al., 2024). Nevertheless, like wealth, incomes are much more unequally distributed in London than in the rest of the country (see Kemeny and Storper, 2020). In theory, this will allow high-income/high-wealth households in London to accumulate wealth more rapidly than low-income/low-wealth households, thus translating into increased wealth inequalities. Moreover, assuming low-income households are also renters, we would expect these inequalities to be exacerbated by the higher rental costs in London. Finally, since London has high levels of immigration compared to other regions, and since immigrants in London consist of both the very poor and the enormously wealthy, these inflows are likely to further widen income and wealth inequalities (Greater London Authority [GLA], 2025).
This narrative is generally borne out by Figure 4, which shows the proportion of top and bottom British income quintiles residing in London, weighted by population. The solid grey line shows that a high proportion (about a third) of London’s population is made up of top income quintile earners. As London’s population has grown (by about 1 million from 2006 to 2021), so the number of top-quintile earners has also increased proportionately (by over 500,000). At the other end of the income distribution, the dotted black line shows that after housing costs London also a relatively high proportion of bottom income quintile earners. Moreover, the large gap between the dotted black line (after housing costs) and the solid black line (before housing costs) indicates that high rent payments are fundamental in explaining the relatively high proportion of low-income households in London (and this is despite a substantial social housing sector which provides subsidised rents for 22% of all households; Department for Levelling Up, Housing and Communities, 2022).
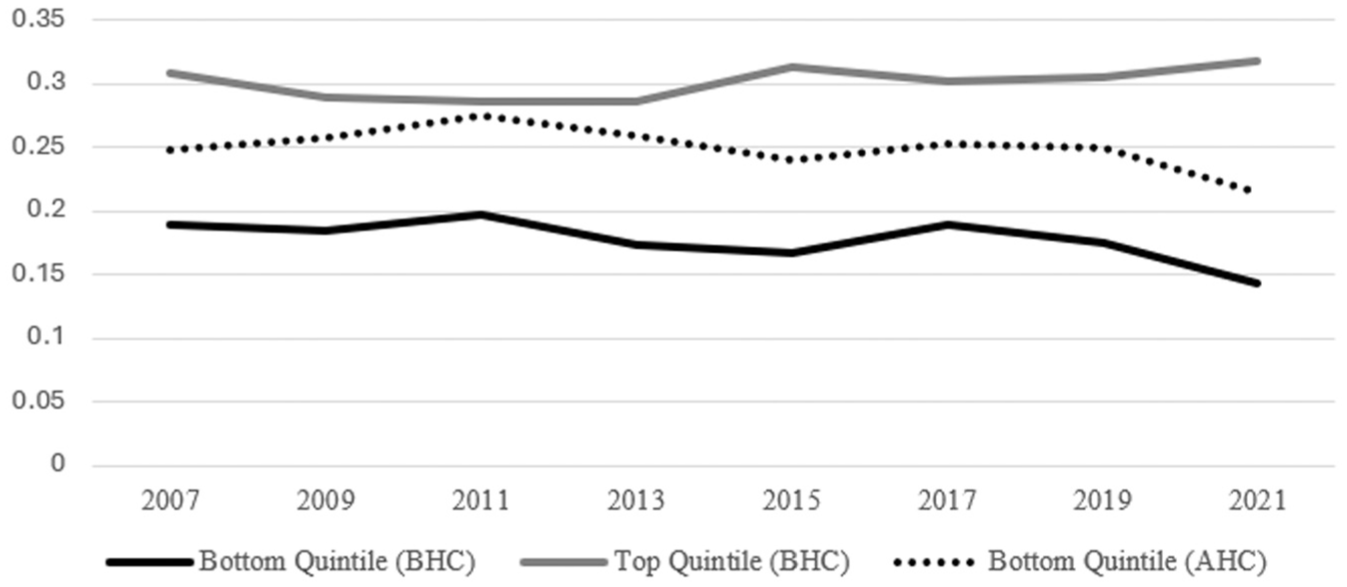
Share of bottom and top income quintiles in London.
In sum, then, the findings on income inequality in London broadly echo those on wealth inequality (and Hamnett (2024) on class structure): London has high levels of income inequality not only because it has lots of high-income households but crucially because these co-exist with lots of low-income households after they have paid their rent. These extreme income disparities (driven partly by high rents) are likely to have driven London’s high and widening wealth inequalities, but there are also a range of other factors relating to house price inflation that are likely to have been significant.
Relationship between house price inflation, homeownership and (housing) wealth inequalities
It is well known that post GFC, house prices have risen much more rapidly (and from much higher levels) in superstar cities like New York and Paris than in the rest of the country. Britain and London are no exception: while house prices in London increased cumulatively 132% over the period 2004–2022, in the North-East the total house price inflation was only 42% during the same period (see Figure 5). A comparison of regional house price indices reveals a stark divergence between London and the median region (represented by Wales), with average house prices in Wales 79% higher, a disparity that was significantly more pronounced prior to the COVID-19 period (2020–2022). It is also notable that flats (which are more likely to be inhabited by low-wealth households) increased in value less than detached and terrace houses (see Figure 5).
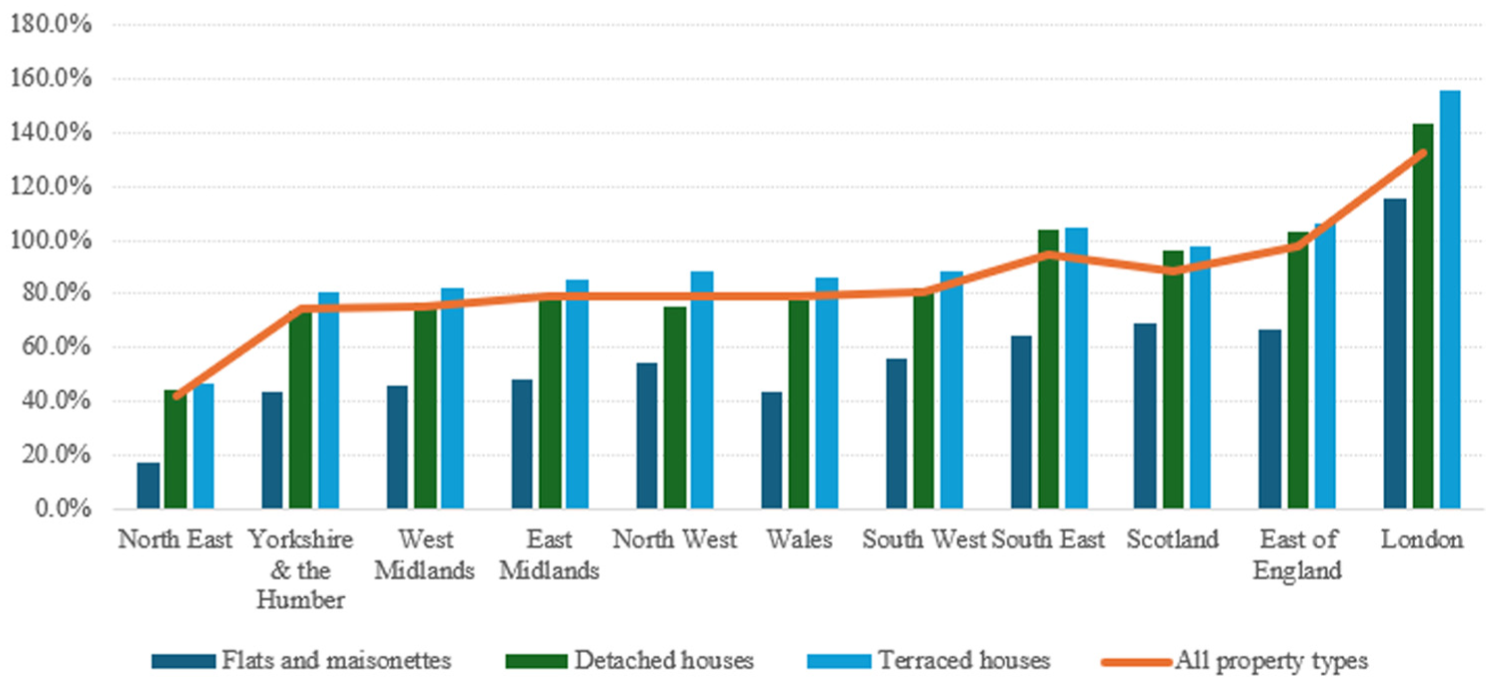
Total (nominal) house price inflation from 2004 to 2022, split by region and dwelling type.
To understand the relationship between house price inflation and (housing) wealth inequalities, we first need to consider who owns these properties, which in turn depends on the tenure structure of society. Whether cause or effect, the post-war decline in wealth inequalities was closely correlated with homeownership rates which more than doubled as house prices and incomes rose in check. Since the 1990s, house prices have accelerated much more rapidly than incomes (Lamont, 2023). Initially, homeownership rates kept pace, propped up by a highly liberalised mortgage market allowing first-time buyers to borrow relatively freely (Stephens, 2007). Post GFC, however, the tightening of mortgage lending has brought the tension between homeownership as a means of wealth accumulation versus wealth equalisation to the fore: since 2007–2008, rates of homeownership have fallen back to pre-1990 levels (Lamont, 2023), while homeowners have received an untaxed £3 trillion windfall (Corlett and Leslie, 2021). Thus, even if wealth inequality ratios have stabilised since the post-war decades, housing wealth has become increasingly important to those at the upper end of the distribution: in 1971, housing made up 22% of total wealth of the top 10% in the UK but 45% by 2012 (Bourquin et al., 2024).
From a regional perspective, homeownership rates are critical in explaining why London has the highest levels of wealth inequality and has seen the largest increases in wealth inequalities over our sample period. The outstanding feature of London, like other superstar cities, is its low levels of homeownership – particularly among younger people. Across our sample period, rates of homeownership in London ranged from 52% to 61%, compared to the neighbouring South-East where homeownership rates ranged from 71% to 74% (Figure 6). Consequently, house price gains in London were concentrated among a smaller and wealthier proportion of the population.
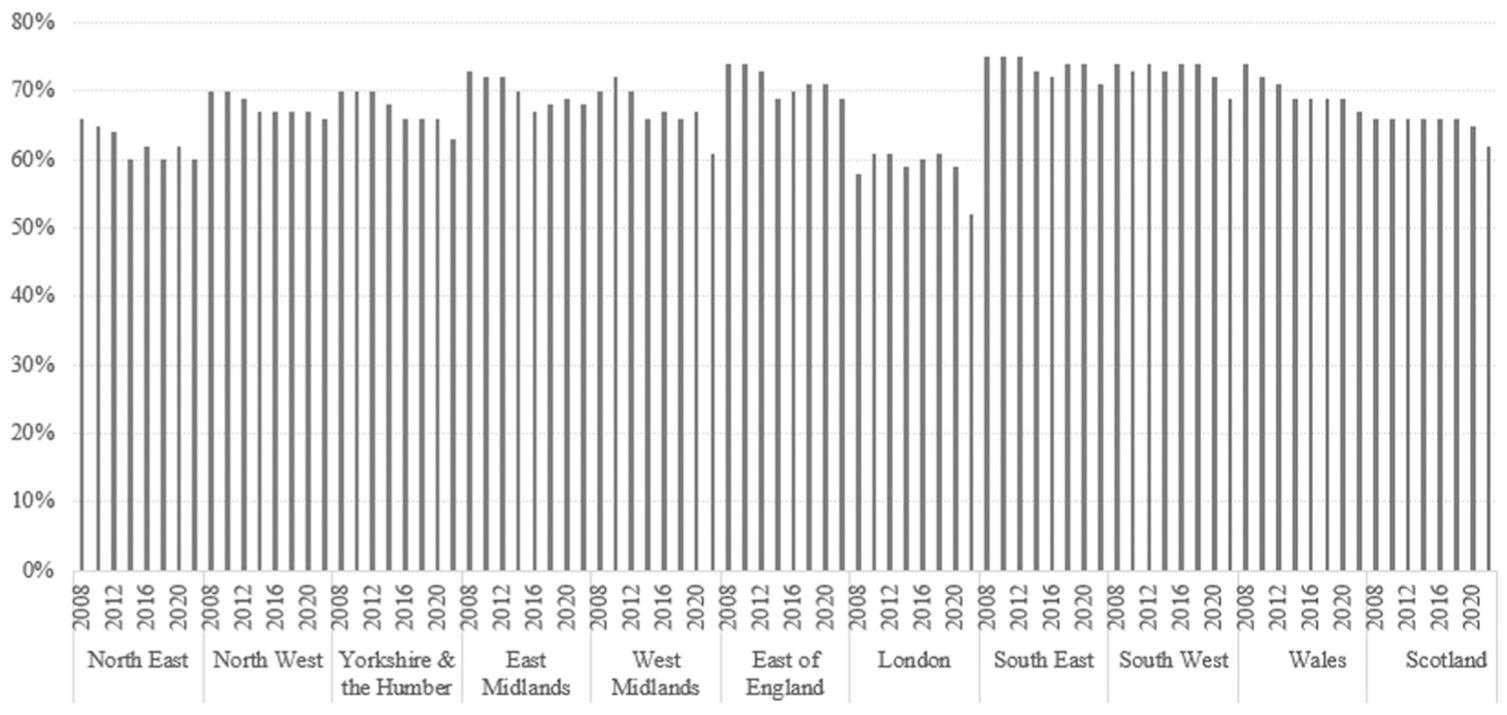
Homeownership rate by regions.
The unequal distribution of house price gains in London was also magnified by the fact that even among homeowners, housing wealth was more unequally distributed in London compared to the rest of Britain: between 2006 and 2020, the top 75th percentile of homeowners in London possessed (on average) 3.1 times the property wealth of the bottom 25th percentile of homeowners, the (joint) highest ratio of any region. 6 This can be partly explained by the relatively high proportion of multiple homeownership in London: according to the English Private Landlord Survey (2024), over a quarter (27%) of all landlords in England lived in London (and mostly owned properties in London).
The other key housing-related factor which mediates the relationship between house price inflation and wealth inequalities is mortgage debt. For homeowners and landlords, using higher levels of mortgage debt has the effect of multiplying equity gains (or losses), thus strengthening the transmission mechanism between house price inflation and wealth inequalities. We only have consistent regional data on the total stock of mortgage lending from 2013 onwards, but this shows that London is consistently above average in terms of total mortgage credit advanced as a proportion of total value of the housing stock (see Figure 7). Because of the much higher house prices, London (and the South-East) is outstanding in terms of the absolute amount of mortgage credit advanced, and in terms of the mortgage credit advanced relative to incomes (Miles, 2004; Office for National Statistics [ONS], 2015; 2022). Further, because of its low homeownership rates, this mortgage debt is concentrated among a smaller pool of borrowers whose equity/wealth gains from house price inflation will likely have been magnified through the enhanced use of leverage. 7
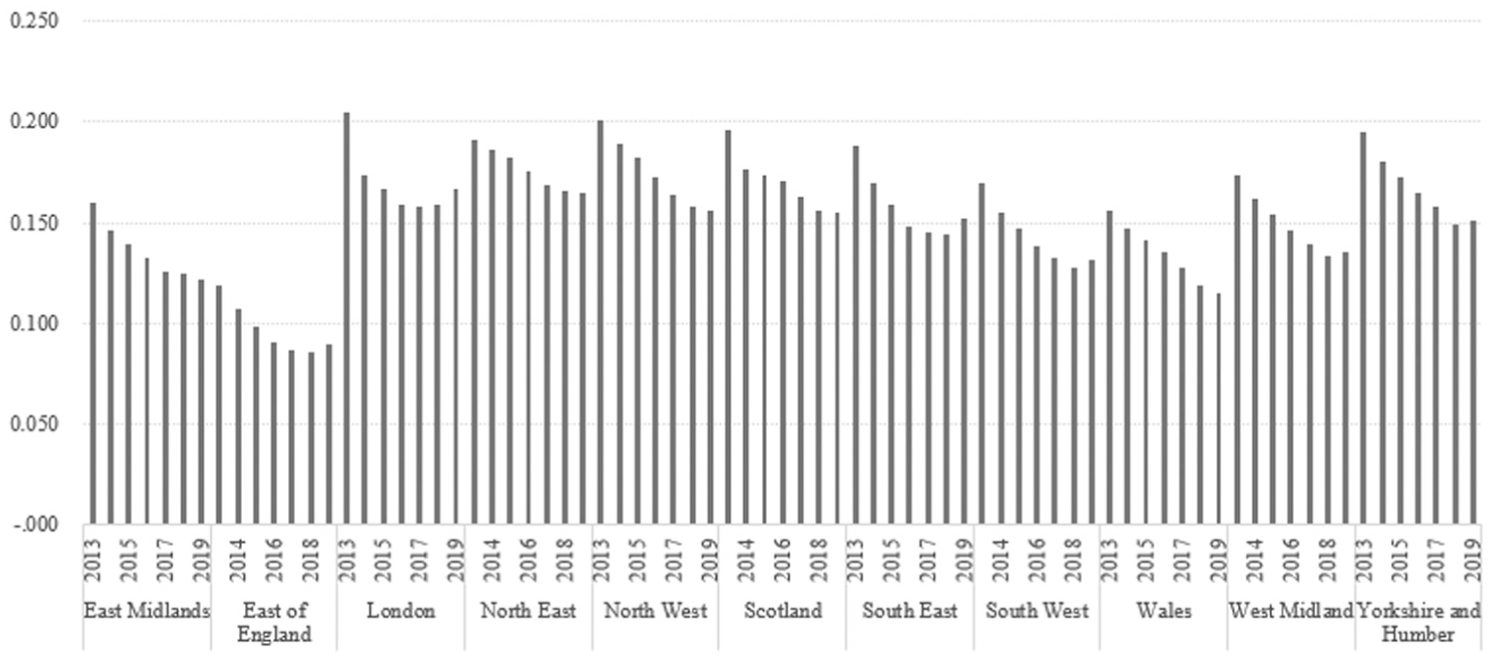
Mortgage indebtedness by region (= total stock of mortgage debt in region / (average house price in region × total dwellings in region)).
Together, these factors help explain Figure 8, which shows the growing importance of housing wealth in London. In 2006–2008, housing wealth made up 46% of total wealth in London, which was marginally higher than the rest of the country where it ranged from 32% (Scotland) to 45% (South-West). Over the subsequent 15 years, however, housing wealth has diminished as a proportion of total wealth in every region apart from London where, as of 2020–2022, it represented over half (51%) of total wealth (note the 2020–2022 uplift in regions outside of London which can be explained by the post-COVID house price increase in these regions). This finding also holds for the top of the wealth distribution: if we look at London’s 75th percentile then housing made up a staggering 88% of their total wealth in 2020–2022, up from 77% in 2006–2008.
Aggregate property wealth (net) as a percentage of total wealth (%).
In sum, over the period 2006–2022, wealth inequalities, homeownership rates and house prices all look very different in London compared to the rest of Britain. In London (as in other superstar cities), house prices started much higher and have grown much more rapidly than in the rest of Britain – this is well known. Interestingly though, the transmission mechanism between house price inflation and wealth inequalities also appears to have been stronger in London than in the rest of the country. Because homeownership rates were lower in London, house price inflation likely benefitted a significantly narrower (and wealthier) subset of landlords/homeowners. House price gains by homeowners and landlords in London were likely further levered by the relatively high levels of mortgage debt they deployed. Together, these findings help explain why wealth inequality rose more rapidly in London, and why housing wealth has made up a growing proportion of total wealth. We now turn to the regression model to probe these relationships further.
Regression analysis
We estimate the following linear-log structural equation model 8 using Stata.

Where
The results of regression analyses are presented in Table 2, where the direct and indirect influences as well as the total effects of explanatory variables on TWI ratios of 75p/25p and the 50p/25p are provided for the overall sample of 11 regions. Given our relatively small sample size (88 observations spread evenly across eight time periods), we must be cautious in interpreting the results. Nevertheless, combined with the descriptive analysis above, these results provide a distinct (if tentative) insight into the role of housing and other factors in driving wealth inequalities across regions. Consistent with the previous analysis, we run the regression first for all regions (Table 2) and then excluding London (Table 3).
Total wealth inequality ratios, homeownership rates and housing prices – all regions.
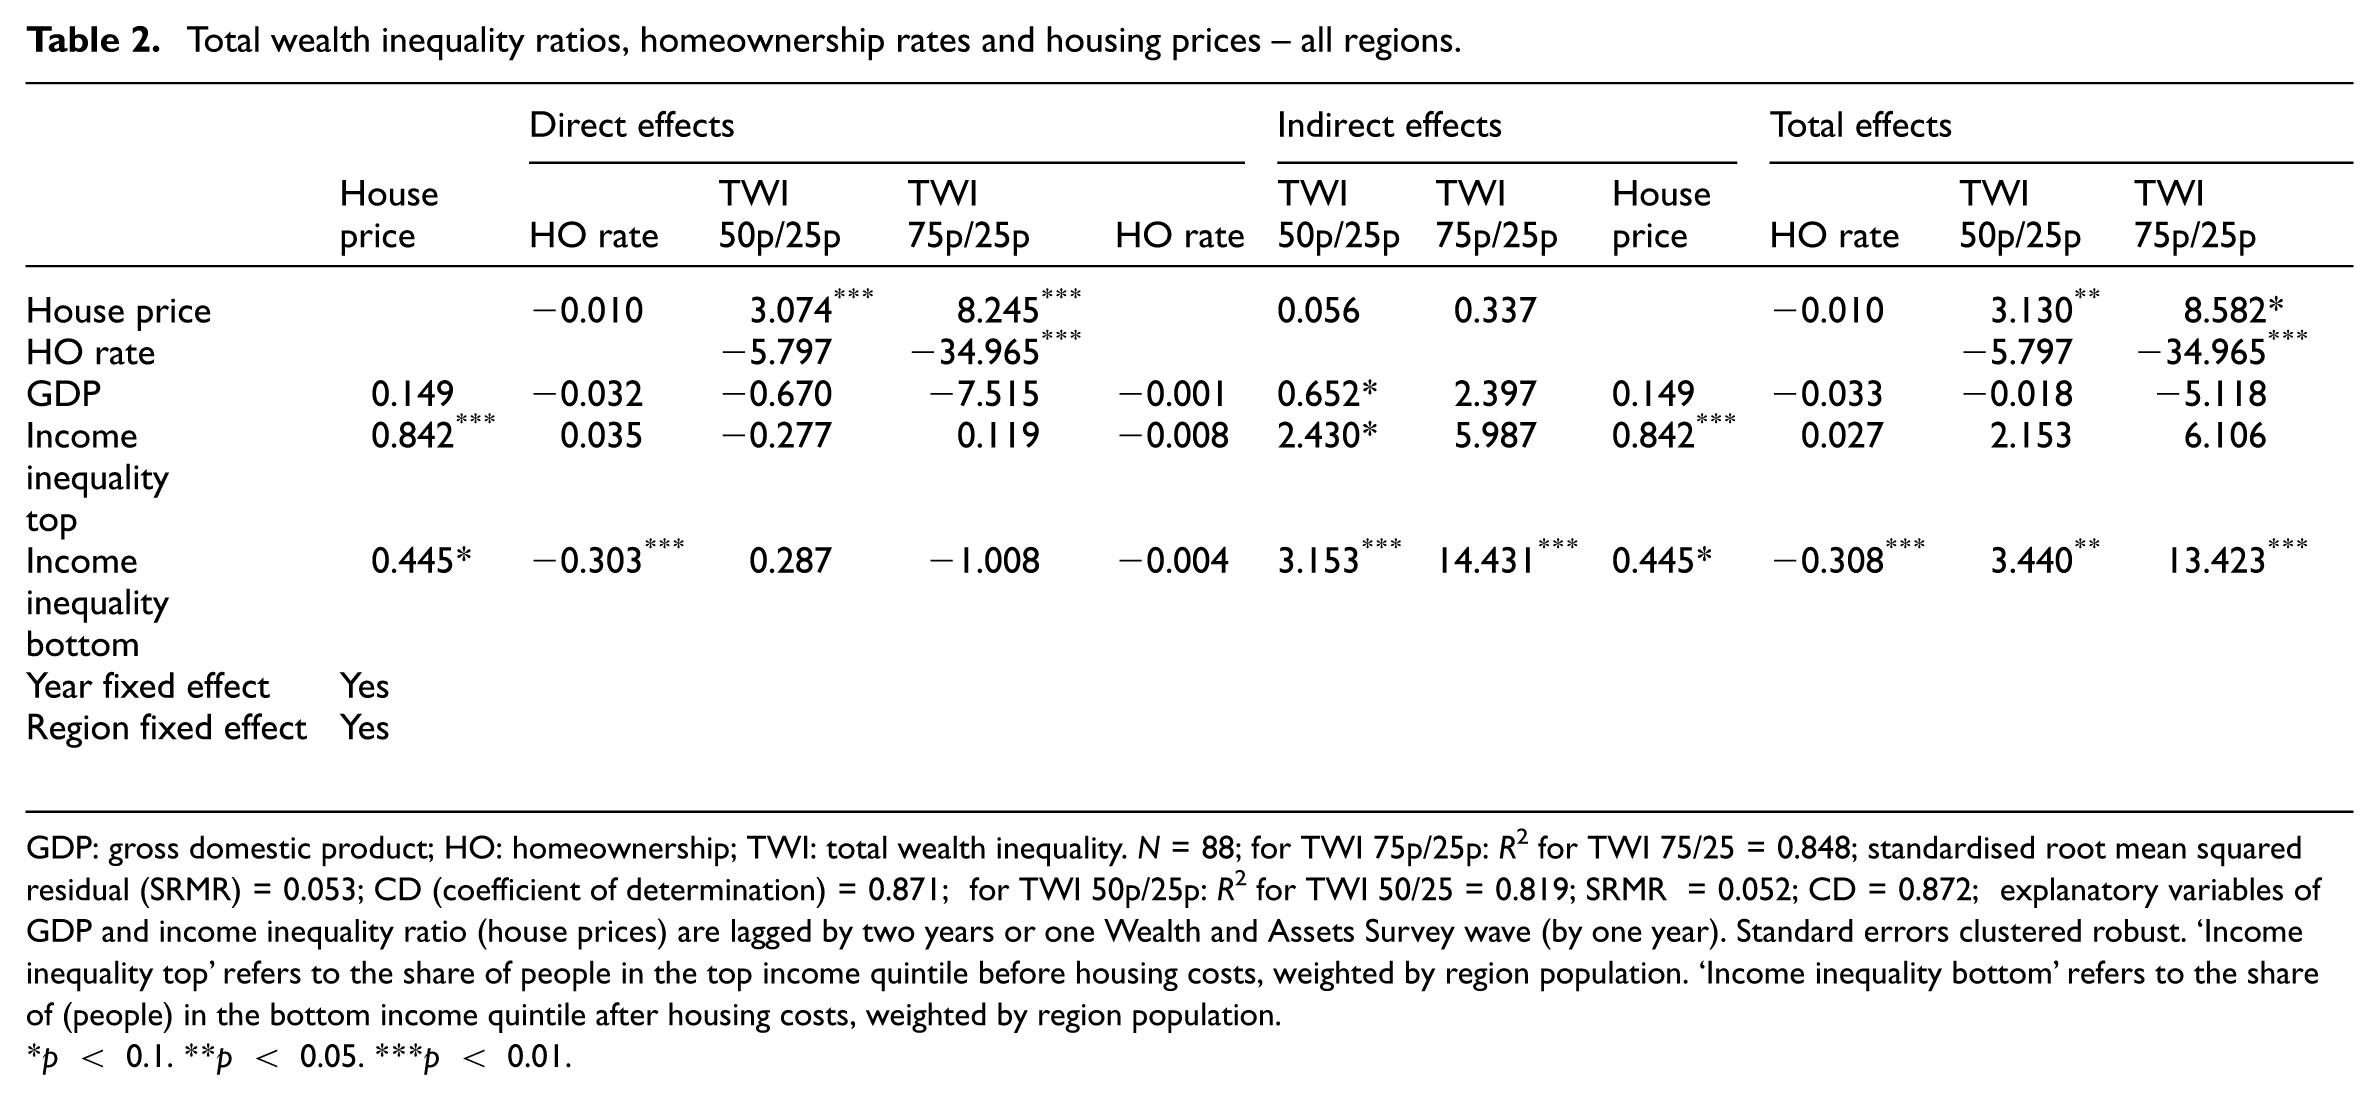
GDP: gross domestic product; HO: homeownership; TWI: total wealth inequality. N = 88; for TWI 75p/25p: R2 for TWI 75/25 = 0.848; standardised root mean squared residual (SRMR) = 0.053; CD (coefficient of determination) = 0.871; for TWI 50p/25p: R2 for TWI 50/25 = 0.819; SRMR = 0.052; CD = 0.872; explanatory variables of GDP and income inequality ratio (house prices) are lagged by two years or one Wealth and Assets Survey wave (by one year). Standard errors clustered robust. ‘Income inequality top’ refers to the share of people in the top income quintile before housing costs, weighted by region population. ‘Income inequality bottom’ refers to the share of (people) in the bottom income quintile after housing costs, weighted by region population.
p < 0.1. **p < 0.05. ***p < 0.01.
Total wealth inequality ratios, homeownership rates and housing prices – excluding London.
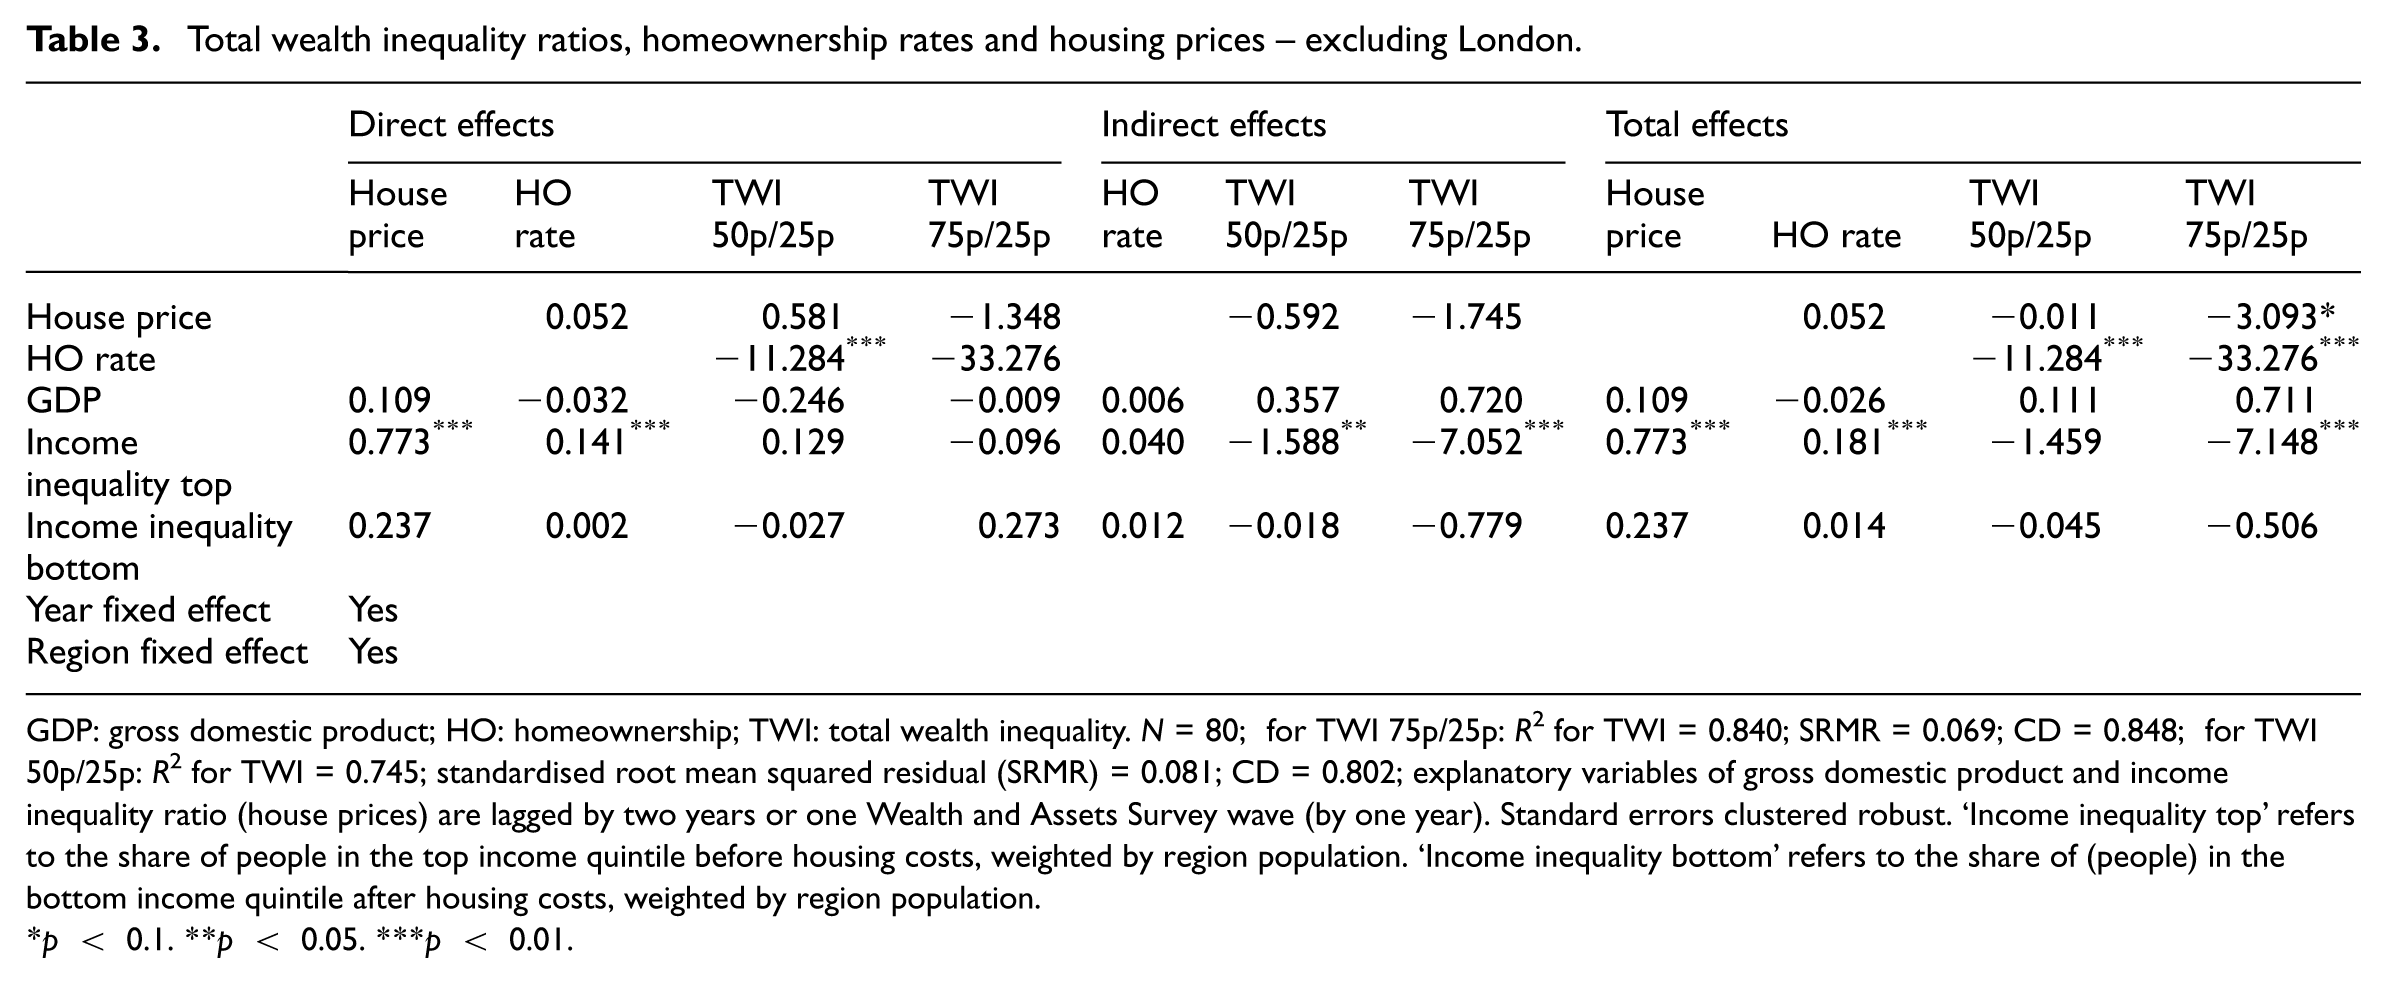
GDP: gross domestic product; HO: homeownership; TWI: total wealth inequality. N = 80; for TWI 75p/25p: R2 for TWI = 0.840; SRMR = 0.069; CD = 0.848; for TWI 50p/25p: R2 for TWI = 0.745; standardised root mean squared residual (SRMR) = 0.081; CD = 0.802; explanatory variables of gross domestic product and income inequality ratio (house prices) are lagged by two years or one Wealth and Assets Survey wave (by one year). Standard errors clustered robust. ‘Income inequality top’ refers to the share of people in the top income quintile before housing costs, weighted by region population. ‘Income inequality bottom’ refers to the share of (people) in the bottom income quintile after housing costs, weighted by region population.
p < 0.1. **p < 0.05. ***p < 0.01.
In all specifications, we use small-sample-adjusted clustered standard errors (clustered at the region level). The model explains 74%–85% of the variation in net wealth (R2 for TWI in Tables 2 and 3). The standardised root mean square residual as an indicator of model fit lies well within the suggested thresholds for a good fit (≤ 0.05) for the overall sample regression and acceptable fit (≤ 0.08) for the without-London regression models (Hu and Bentler, 1999).
In terms of the control variables, we find that the GDP level has a statistically insignificant (p > 0.1) effect on wealth inequality ratios. On the other hand, the estimated coefficients of income inequality depend upon whether or not we include London. In Table 2 (including London), we generally find both measures of income inequality to have a positive effect on TWI as we would expect. This effect is particularly strong and significant for the bottom of the income distribution, indicating that an increase in the proportion of low-income households in a region widens total wealth inequalities. However, this variable turns insignificant in Table 3, implying it is largely driven by London. In Table 3, the coefficient on the top measure of the income distribution turns negative, implying that outside of London an increase in the proportion of high-income earners is actually associated with a compression in wealth inequalities.
Examining in detail the main variables of interests, the results consistently show a negative association between homeownership rates and the wealth inequality ratios within regions in Britain, where the estimated coefficient ranges from −5.797 for TWI 50p/25p to −34.965 for TWI 75p/25p across two different model specifications in Table 2. What this means is that a 1% increase in the homeownership rate is associated with, at the low end, an approximately 0.06 unit decrease in the 50p/25p wealth inequality ratio, and a 0.35 unit decrease in the 75p/25p wealth inequality ratio. The results are similar and stronger for the TWI 50p/25p ratio when we exclude London (Table 3). These findings are in line with the existing literature which shows that higher homeownership rates are associated with lower levels of wealth inequality, even if the causal direction of the relationship is unclear.
The effect of house price inflation on wealth inequalities is more ambivalent. When we include London, the results reveal that house price inflation has a direct positive effect on TWI, with the estimated coefficients on house price level significant and positive for both TWI ratios. Specifically, a 1% increase in house prices is associated with a 0.03 widening of the 50p/25p wealth inequality ratio and an approximately 0.09 widening of the 75p/25p wealth inequality ratio.
To put the coefficients into context, this implies that the 75% increase of house prices in London over the sample period can almost entirely explain the rise in the 75:25 ratio. The total effect of house price inflation on the 50p/25p TWI ratio is statistically significant at the 5% level, whereas it becomes marginally significant at the 10% level for the TWI 75/25 ratio. When we exclude London, however, the total effect of house price inflation on wealth inequalities becomes negative and significant (at the 10% level) for the 75p/25p TWI, and negative but insignificant for the 50p/25p wealth inequality ratio (Table 3: see columns 10 and 11 for total effects). This negative effect of house prices on wealth inequalities appears to be largely direct, implying that outside of London house price inflation actually works to compress wealth inequalities. Combining this result with our descriptive analysis, we can therefore sketch an illustrative story for three neighbouring regions: London, East of England and South-East England. All three experienced significant levels of house price inflation but the latter two regions had higher homeownership rates (71%–75%). Consequently, whereas house price gains in London worked to widen wealth inequalities, house price inflation in the South-East and East of England may have actually compressed them. 9
Discussion and conclusion
Having presented our descriptive analysis and regression results, this final section revisits the main findings in the context of the existing literature.
Our first finding is that the negative correlation between homeownership rates and wealth inequalities, which has been well documented across countries, also holds across regions in Britain. Specifically, increases in homeownership rates over time within regions are associated with a compression in wealth inequalities. This relationship is robust to the inclusion of a range of control variables, and the magnitude of the effect is also substantive.
Broadly speaking, there are two possible interpretations of this coefficient. The first is that declining homeownership rates have in some way caused wealth inequalities to increase within regions over time. It may be, for example, that tighter mortgage lending post 2008 (Meen and Whitehead, 2020), lower anticipated house price inflation or weakening social norms around homeownership have reduced the incentives of lower-wealth renters to save up to become homeowners, thus leading their net wealth to decline relative to higher-wealth homeowners. Another explanation – and more likely in our opinion – is that another variable has widened wealth inequalities and this has been reflected in lower rates of homeownership: the most likely candidate being the inheritance of wealth (Bourquin et al., 2024) which has become an increasingly important driver of wealth inequalities.
Our second finding, and the most provocative one, relates to regional differences in the relationship between house prices and wealth inequalities. Few will be surprised that house price inflation is associated with widening wealth inequalities in London: rapid house price inflation there has effectively transferred wealth from lower-wealth renters and prospective owners to higher-wealth homeowners and landlords. More specifically, a 1% increase in house prices is associated with a 0.086 increase in the 75p/25p TWI ratio. Outside of London, however, our analysis suggests that the transmission mechanism between house price inflation and wealth inequalities is much weaker and may even go in the opposite direction. The distinct contribution of this article, therefore, is to demonstrate that not only has London (like other superstar cities) experienced higher house price inflation – this is well known – but the transmission mechanism between house price inflation and wealth inequalities is also stronger in London (and potentially other superstar cities).
Several factors are likely to explain this regional discrepancy in the relationship between house price inflation and wealth inequalities. The first is the pre-existing distribution of housing wealth: because housing wealth was more unequally distributed in London in the first place – as reflected most notably in lower homeownership rates but also in the relatively unequal distribution of housing wealth among homeowners – house price gains were also more unequally distributed. Second, because homeowners and landlords in London had relatively high levels of mortgage debt as a proportion of property value (compared to homeowners and landlords in other regions), this likely levered the effect of positive house price inflation on their total wealth. Finally, house price rises are partly a function of rent rises which appear to hit low-income households in London particularly hard (relative to the rest of Britain), severely limiting their ability to accumulate wealth.
Footnotes
Appendix
Descriptive statistics for model variables.
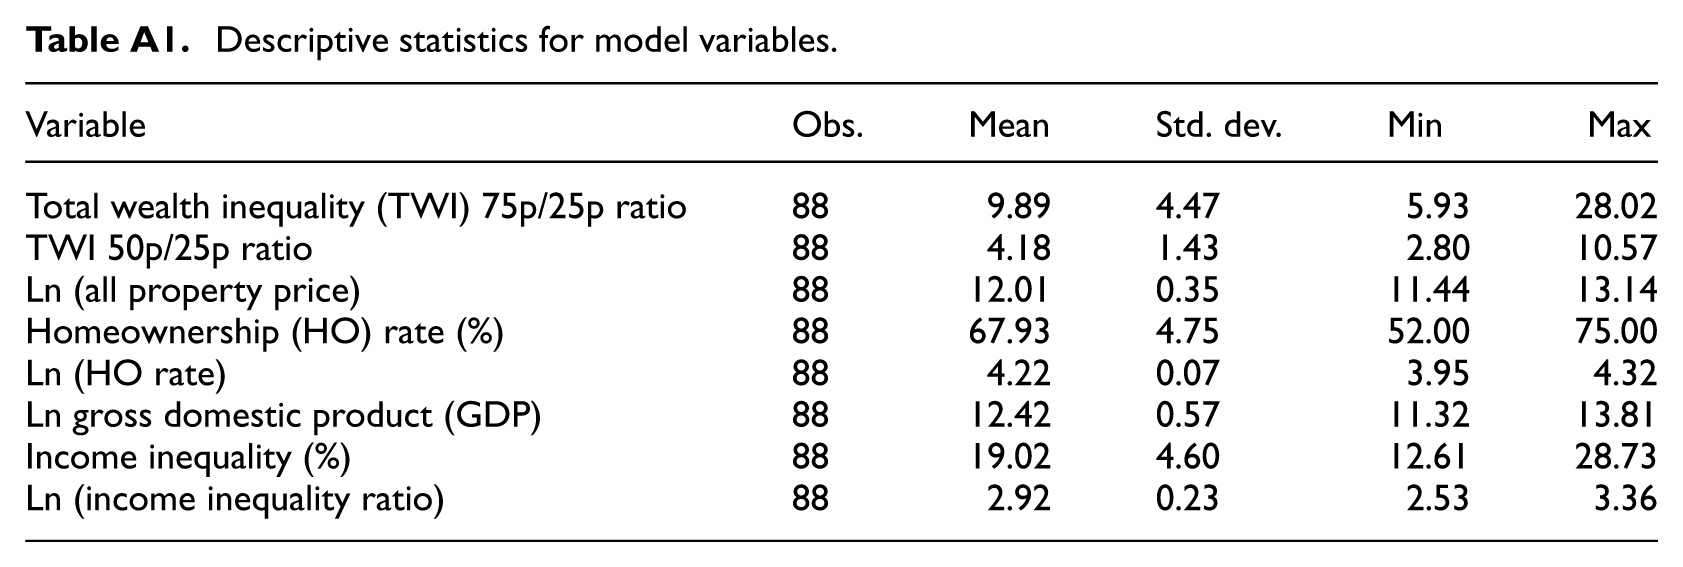
| Variable | Obs. | Mean | Std. dev. | Min | Max |
|---|---|---|---|---|---|
| Total wealth inequality (TWI) 75p/25p ratio | 88 | 9.89 | 4.47 | 5.93 | 28.02 |
| TWI 50p/25p ratio | 88 | 4.18 | 1.43 | 2.80 | 10.57 |
| Ln (all property price) | 88 | 12.01 | 0.35 | 11.44 | 13.14 |
| Homeownership (HO) rate (%) | 88 | 67.93 | 4.75 | 52.00 | 75.00 |
| Ln (HO rate) | 88 | 4.22 | 0.07 | 3.95 | 4.32 |
| Ln gross domestic product (GDP) | 88 | 12.42 | 0.57 | 11.32 | 13.81 |
| Income inequality (%) | 88 | 19.02 | 4.60 | 12.61 | 28.73 |
| Ln (income inequality ratio) | 88 | 2.92 | 0.23 | 2.53 | 3.36 |
Funding
The authors disclosed receipt of the following financial support for the research, authorship, and/or publication of this article: This research is a part of a funded project titled ‘A Regional Analysis of Housing-Wealth Inequality Dynamics in Britain’, funded by the Reading Real Estate Foundation between October 2021 and September 2023.
Declaration of conflicting interests
The authors declared no potential conflicts of interest with respect to the research, authorship, and/or publication of this article.