
Abstract
Urban rapid transit systems, such as light rail transit (LRT), may be associated with gentrification. Previous quantitative studies have adopted various analytical methods and reported mixed findings. However, they have often failed to differentiate gentrification from other forms of neighborhood change or assumed a homogeneous transit-gentrification relationship across space and time. This study argues that the relationship between transit and neighborhood change can vary across different zones and time periods within the urban area served by a transit line. A Bayesian modeling approach was employed to examine the spatiotemporally varying association between distance to LRT and neighborhood change from the planning to opening stages of the LRT line in Kitchener-Waterloo, a mid-sized urban area in Canada. Income improvement associated with LRT predominantly occurred in the opening stage of the transit line, while dwelling value growth related to LRT mainly occurred in the planning and construction stages. Neighborhoods showing significant associations between LRT and increases in income or dwelling value were found around central business district stations and near the northern and southern terminals. Some of these changes might be categorized as LRT-related gentrification. The research framework and advanced modeling approach presented in this study, as well as the novel concept of analyzing the relationship between transit and neighborhood change as a spatiotemporally variable phenomenon are valuable for transportation and gentrification research.
Introduction
In recent decades, light rail transit (LRT) development has expanded globally in both large and mid-sized cities. As an urban rapid transit solution balancing capacity, speed, and flexibility, LRT is expected to enhance mobility and promote walkable communities. It is also advocated as a catalyst for economic growth and city image enhancement, particularly within transit-oriented development contexts (Ferbrache and Knowles, 2017; Olesen, 2020).
Despite the expected benefits of LRT, concerns have emerged about its potential links to gentrification, an extensively researched and often controversial form of neighborhood upgrading. While neighborhood upgrading generally involves improvements in socio-economic characteristics and the physical environment and is usually viewed as beneficial, gentrification often excludes low-income residents from these benefits (Walks and Maaranen, 2008). Gentrification is generally understood as the transformation of central city neighborhoods from working-class or vacant areas to middle-class spaces, often displacing low-income groups (Lees et al., 2008). Transit development may attract investments, raise property prices, and displace disadvantaged residents, but empirical evidence on transit-related gentrification remains inconclusive (Padeiro et al., 2019).
Previous quantitative studies have employed diverse gentrification measures, statistical methods, timeframes, and spatial scales. However, many have failed to distinguish gentrification from other forms of neighborhood upgrading. Even when this distinction was made, existing studies have predominantly assumed a consistent relationship between a transit line and gentrification across all stations and focused only on opening phases. Nonetheless, uncertainties exist regarding the timing and spatial patterning of transit-related gentrification, meaning that the transit-gentrification relationship may vary across different time periods and zones within the urban area served by a transit line.
This paper seeks to contribute to the ongoing debate on transit-related gentrifica-tion by presenting a comprehensive spatiotemporal study of LRT-related neighborhood change. The key question is when and where LRT development is associated with neighborhood upgrading, particularly gentrification. Answering this question can help identify or anticipate neighborhood change during LRT development and determine the times and locations for addressing gentrification if it is deemed undesirable. An advanced Bayesian spatiotemporal model with a varying regression coefficient is used to capture the spatiotemporal variability in the relationship between LRT and neighborhood change. This modeling framework, initially developed in the public health domain (e.g. Song et al., 2019; Song and Luan, 2022), has yet to be used for analyzing gentrification.
The study area is Kitchener-Waterloo, a rapidly growing mid-sized urban area in Canada. The findings offer valuable insights for urban areas globally, especially mid-sized cities that have recently implemented or are planning LRT systems. The modeling approach is applicable to other case studies, with flexibility to be further modified. The concept of analyzing the spatiotemporally varying relationship is essential for accurately understanding transit-related gentrification in future research. This novel approach helps to mitigate overgeneralization, which often arises when neighborhood change patterns are averaged across transit stations and time periods, masking critical localized variations.
Background
Linking public transit to gentrification
Gentrification literature has continually evolved, with ongoing debates on its definitions, causes, and impacts (Lees et al., 2008). As a process involving the influx of more affluent residents, gentrification is viewed by some as beneficial for fiscal revenue and social diversity, while others highlight its negative effects, such as the loss of affordable housing (Atkinson and Bridge, 2004). Displacement is central to discussions about gentrification, as most studies confirm that in-movers are often wealthier, whiter, and more educated than out-movers (Zuk et al., 2018). When public transit contributes to gentrification and displacement, its intended benefits are called into question.
Gentrification is often explained from supply-side (Smith, 1979) and demand-side (Ley, 1986) perspectives, both of which provide theoretical links to transit. From the supply-side perspective, new transit development enhances accessibility and enables more intensive land use, thereby increasing potential ground rent and attracting investments (Revington, 2015). From the demand-side perspective, transit is a desirable urban amenity that attracts higher-income in-movers by enhancing connectivity with jobs and other destinations (Zuk et al., 2018).
Ecological gentrification offers an additional theoretical lens, showing how transit development within broader sustainability strategies may drive gentrification. Along with the concepts of environmental and green gentrification, it demonstrates how urban environmental sustainability improvements attract investments and wealthier residents, displacing disadvantaged groups (Checker, 2011; Dooling, 2009; Gould and Louis, 2012). In North America, transit is frequently integrated with densification planning under the “sustainability-as-density” approach, which promotes high-density housing in transit-accessible neighborhoods and has been linked to rising housing prices and displacement (Quastel et al., 2012). As eco-friendly living gains popularity, higher-income professionals, particularly in creative and technology sectors, are increasingly attracted to transit-oriented high-density communities in city centers, exacerbating ecological gentrification (Rice et al., 2020).
Despite the theoretical links between transit and gentrification, quantitative studies have shown mixed findings. Empirical evidence of transit-induced gentrification has been associated with various forms of urban rapid transit, including bus rapid transit (BRT; e.g. Brown, 2016), LRT (e.g. Bardaka et al., 2018), and metro systems (e.g. Lin and Chung, 2017). Others found little to no evidence of transit-related gentrification (e.g. Deka, 2017; Dong, 2017). Furthermore, some studies reported differing results across regions or transit lines, highlighting the importance of local geographical contexts (e.g. Baker and Lee, 2019; Grube-Cavers and Patterson, 2015).
Inconsistencies in how transit and gentrification were measured may explain some of the divergence in findings. Transit influence was measured relatively consistently by proximity, including distance to the nearest station (e.g. Lin and Chung, 2017) or binary indicators based on station buffer zones (e.g. Brown, 2016). Gentrification, however, has been measured using diverse indicators, including income, ethnicity, education, and housing prices (Padeiro et al., 2019). These census-based indicators primarily capture socio-economic upgrading but not displacement, an essential yet difficult-to-measure aspect of gentrification (Bardaka, 2024). Displacement is best identified using population movement data, such as eviction records (Delmelle et al., 2021), which are often unavailable. Due to data constraints, this study continues to rely on census-based indicators, while acknowledging their limitations and interpreting gentrification-related findings with caution.
Spatiotemporal variability in transit-related gentrification
Empirical studies have employed diverse statistical methods, including various forms of difference-in-differences analysis (e.g. Bardaka et al., 2018; Dong, 2017) and regression modeling (e.g. Chapple et al., 2017; Lin and Chung, 2017). However, existing studies have either not captured or only partially addressed the spatiotemporal variability in transit-related gentrification. This concerns how the transit-gentrification relationship varies across space and time, as well as spatial and temporal autocorrelation, where changes in a neighborhood during one time period influence other neighborhoods or time periods.
Gentrification studies often emphasize that it can only occur in gentrifiable neighborhoods, typically defined by income levels below the regional average or similar socio-economic criteria (e.g. Chapple, 2009; Freeman, 2005; Grube-Cavers and Patterson, 2015). However, gentrifiability has not always been addressed in studies about transit-related gentrification (Padeiro et al., 2019). Without defining gentrifiability, analytical results might be masked by non-gentrifiable neighborhoods. For example, Baker and Lee (2019) found stronger transit effects when only gentrifiable neighborhoods were included, compared to when all neighborhoods were considered. Nevertheless, gentrifiability, defined to some degree arbitrarily and inconsistently across studies, may also introduce uncertainties. Furthermore, gentrifiability essentially divides neighborhoods into two categories, assuming transit has distinct effects on each. However, transit effects are more complex in reality and can vary significantly even within gentrifiable areas, making this dichotomy potentially misleading.
Small census units like census tracts are common neighborhood proxies in gentrification studies (Finio, 2022). Positive spatial autocorrelation is expected at this scale, meaning that nearby neighborhoods tend to exhibit similar changes. This may arise from discrepancies between the analytical units and the actual change areas, or from spillover effects, where the interconnected nature of small neighborhoods allows changes in transit-served neighborhoods to influence proximate neighborhoods (Bardaka et al., 2018; Brown, 2016; Grube-Cavers and Patterson, 2015). A small proportion of studies have used spatial methods to account for spatial autocorrelation, such as spatial difference-in-differences analysis (Bardaka et al., 2018) and spatial autoregressive models (Baker and Lee, 2019).
The temporal and spatial dimensions of neighborhood change are equally important. Previous studies have used temporal units of analysis ranging from several years to several decades (Padeiro et al., 2019). Most studies have focused on a single period for each transit line, examining the effects of its opening. However, a new transit line can influence nearby neighborhoods before it opens due to investments during planning and construction stages (Ellis-Young and Doucet, 2024; Golub et al., 2012). There could also be a significant delay between a transit line’s opening and gentrification (Dong, 2017).
The transit-gentrification relationship may not remain constant over a long-term study period. Studies analyzing multiple time periods have found varying effects of the same transit system on gentrification over time (Chapple et al., 2017; Chava and Renne, 2022). However, these studies assessed each period separately without treating neighborhood change as a continuous process. Similar to the spatial dimension, positive temporal autocorrelation is likely, as changes in one period influence the next (e.g. gentrifying neighborhoods attracting more higher-income in-movers), and the key neighborhood transformation period may not align with the temporal unit of analysis. Overlooking the spatial and temporal structures of neighborhood change may lead to unreliable results.
Considering the spatiotemporal variability, we propose that an analytical framework for studying transit-related gentrification should: (1) account for the spatiotemporal variations in the relationship between transit and neighborhood change and minimize uncertainties from arbitrarily defining gentrifiability; (2) select an appropriate spatial unit of analysis and properly handle spatial autocorrelation; and (3) choose a suitable temporal unit, examine multiple time periods, and account for temporal autocorrelation. With these aspects being carefully addressed, the timing and spatial patterning of transit-related gentrification may be better assessed.
Study area: Kitchener-Waterloo
The LRT under examination is ION LRT, serving Kitchener and Waterloo, two adjacent cities within the Region of Waterloo, Ontario, Canada. These cities are often collectively referred to as “Kitchener-Waterloo” and are considered “twin cities.” This mid-sized urban area, with a population of around 378,000 in 2021, is among the fastest-growing regions in the country. As a globally recognized innovation hub, Kitchener-Waterloo hosts numerous technology firms, including major multinationals like Google, and two renowned universities that draw students and researchers globally.
Figure 1 presents a map of ION LRT with its development timeline and key destinations within the study area, a map of the relative location of Kitchener-Waterloo, and a map outlining the spatial unit of analysis. The neighborhood spatial unit is the dissemination area (DA), the smallest census geographic unit for sociodemographic data. The DA helps to capture local variations in sociodemographic characteristics more precisely, which might be masked at the larger census tract level.
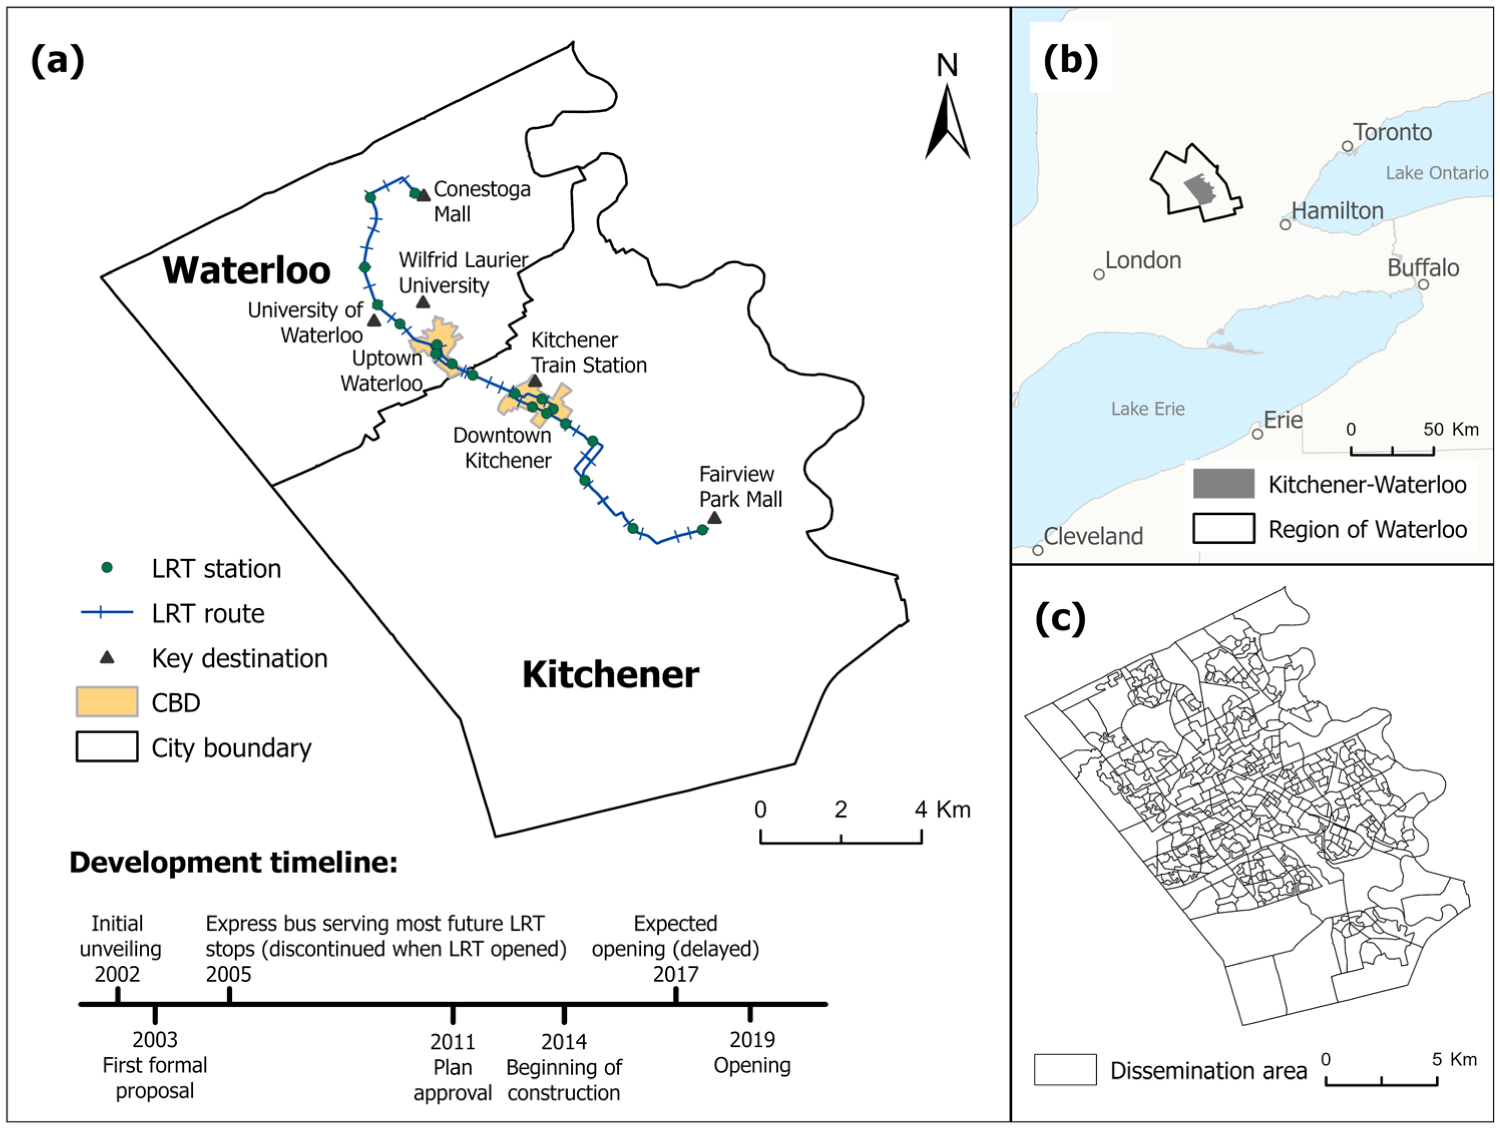
Maps of (a) ION LRT with its development timeline and key destinations, (b) relative locations of Kitchener-Waterloo and the Region of Waterloo to Toronto and other cities, and (c) dissemination areas within Kitchener-Waterloo.
ION LRT began operating a single route with 19 stations in Kitchener-Waterloo in 2019. It runs between two vibrant shopping centers, passing by two universities, the regional train station, and two central business districts (CBD), known as Uptown Waterloo and Downtown Kitchener. Qualitative research that employed field observations and interviews has identified signs of gentrification and displacement related to ION LRT even before its opening, including the loss of affordable housing, the rise of exclusionary neighborhood cultures, and distress among original residents due to changes in neighborhood physical and social environments (Doucet, 2021; Ellis-Young and Doucet, 2024). A gap remains in quantitative research using statistical modeling to systematically analyze LRT-related neighborhood change in Kitchener-Waterloo.
This study examines neighborhood change at five-year census intervals between 2001 and 2021, during which Kitchener-Waterloo experienced significant population growth and sociodemographic shifts. The first two periods (2001–2011) correspond to the LRT planning stage, during which its arrival was expected but not assured. The third period (2011–2016) covers the approval of LRT and the beginning of construction, while the final period (2016–2021) includes the opening phase of LRT.
Methodology
This study employed a Bayesian spatiotemporal regression model that allows the association between neighborhood change and distance to LRT to vary across time and space, while effectively addressing spatial and temporal autocorrelation in neighborhood change. Unlike past studies that relied on predefined gentrifiability to isolate the transit-gentrification relationship from transit effects on other neighborhoods, this approach avoids such dichotomies. By examining each individual neighborhood in each time period, it captures where and when significant transit influences occur without pre-grouping neighborhoods. Gentrification status was only assessed after identifying neighborhoods with significant associations.
Variables and data
Income and dwelling value were measured as indicators of neighborhood change, representing demand and supply aspects, respectively (Finio, 2022). Rent was also considered but excluded due to insufficient data. Specifically, this study used average income, defined as average total income for persons with income, and dwelling value per room, calculated by dividing average dwelling value by average number of rooms. The use of dwelling value per room enables more meaningful temporal comparisons by accounting for possible housing size changes and aligns with measures used in previous Canadian research (e.g. Moos et al., 2019). Changes in the two indicators over five-year periods were used to represent neighborhood change and operationalized as dependent variables in regression modeling. These indicators also served as explanatory variables for their changes, based on the hypothesis that changes depend on initial conditions. Both indicators were adjusted to 2021 dollars and log-transformed, following common practices (Baker and Lee, 2019; Bardaka et al., 2018; Bunten et al., 2024; Chapple et al., 2017).
The key explanatory variable was distance to LRT, measured in kilometers from each DA’s population-weighted centroid to the nearest station using road networks. This variable was held constant, assuming residents anticipated future LRT stations due to its early unveiling and an express bus roughly following the planned route. A series of sociodemographic, dwelling, and built environment variables were included as control variables. Table 1 presents descriptions and summary statistics for all regression variables. More explanatory variables (e.g. visible minorities, parks, and university-proximate neighborhoods) were tested but excluded due to a lack of significant associations.
Summary statistics for variables used in this study.
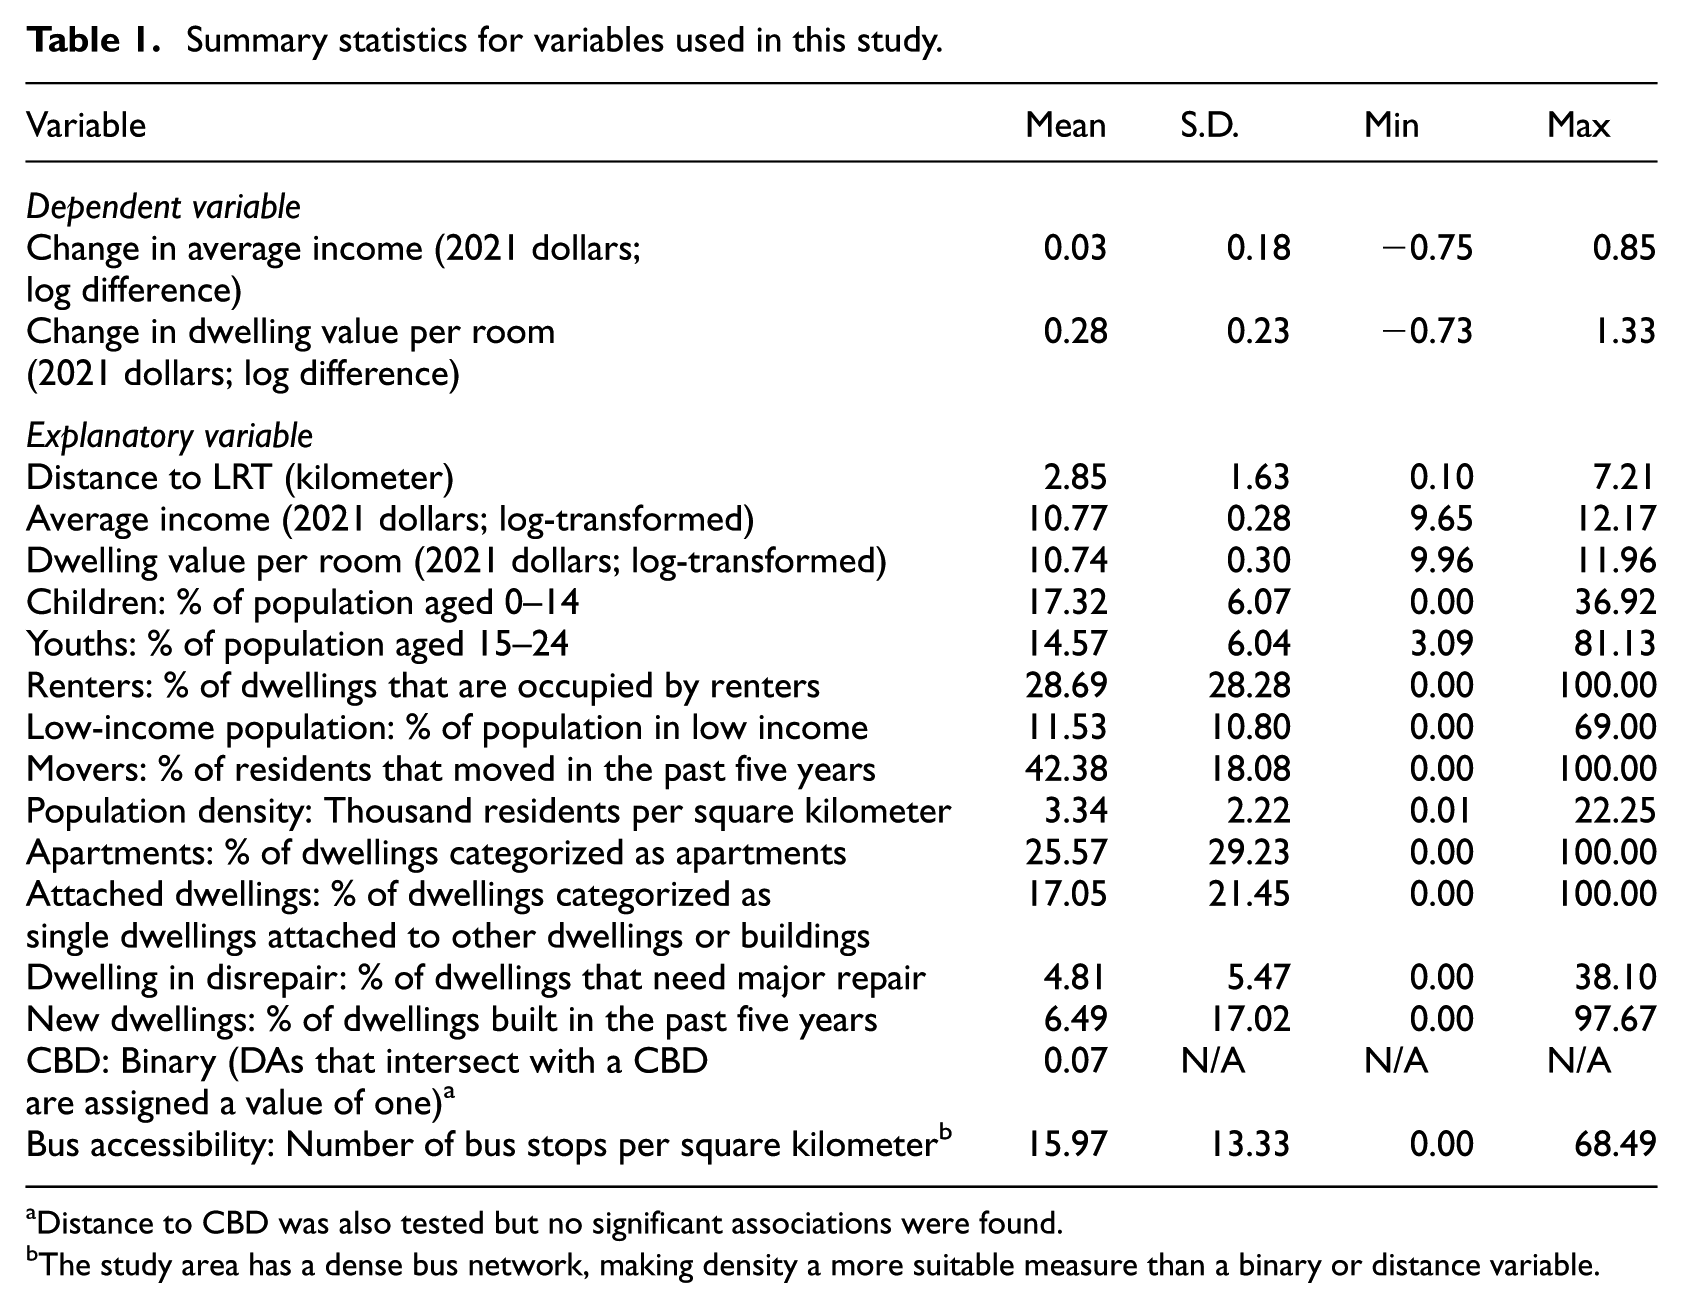
Distance to CBD was also tested but no significant associations were found.
The study area has a dense bus network, making density a more suitable measure than a binary or distance variable.
Datasets from the 2001, 2006, 2011, 2016, and 2021 censuses by Statistics Canada were used to derive sociodemographic and dwelling variables. All census data were harmonized to 2021 DA boundaries following the approach outlined by Allen and Taylor (2018). Out of 476 DAs in Kitchener-Waterloo, 34 and 43 were excluded from modeling income changes and dwelling value changes, respectively, due to insufficient census data. These primarily consisted of sparsely populated or newly developed areas with little or no population in 2001, as well as several university-adjacent neighborhoods dominated by students, with insufficient reporting on incomes and dwelling values. Additional datasets from Region of Waterloo Open Data were used to identify CBDs, bus stops, and LRT stations. Census-based explanatory variables were measured at the start of each five-year period. Bus accessibility was measured within each period in a year with available data, while CBD was held constant.
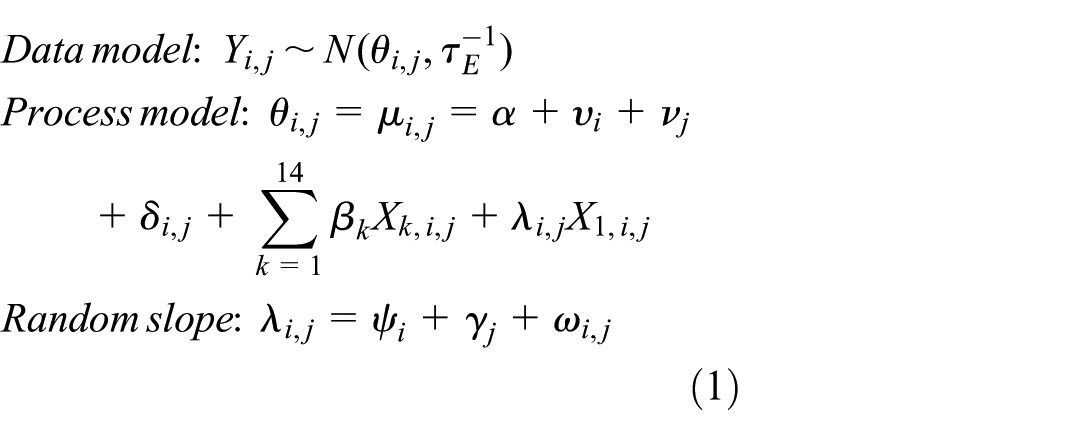
Spatiotemporal modeling
A Bayesian hierarchical spatiotemporal model specified in the equation below was fitted for each dependent variable. Unlike conventional regression models that assume fixed relationships between the dependent and explanatory variables, this approach allows the effect of distance to LRT on neighborhood change to differ by DA and year, making it well-suited to the objectives of this study.
The dependent variable
Each unknown parameter must be assigned a prior distribution in Bayesian modeling. In the absence of sufficient prior knowledge, commonly used vague or weakly informative priors were applied, as specified in the equation below.
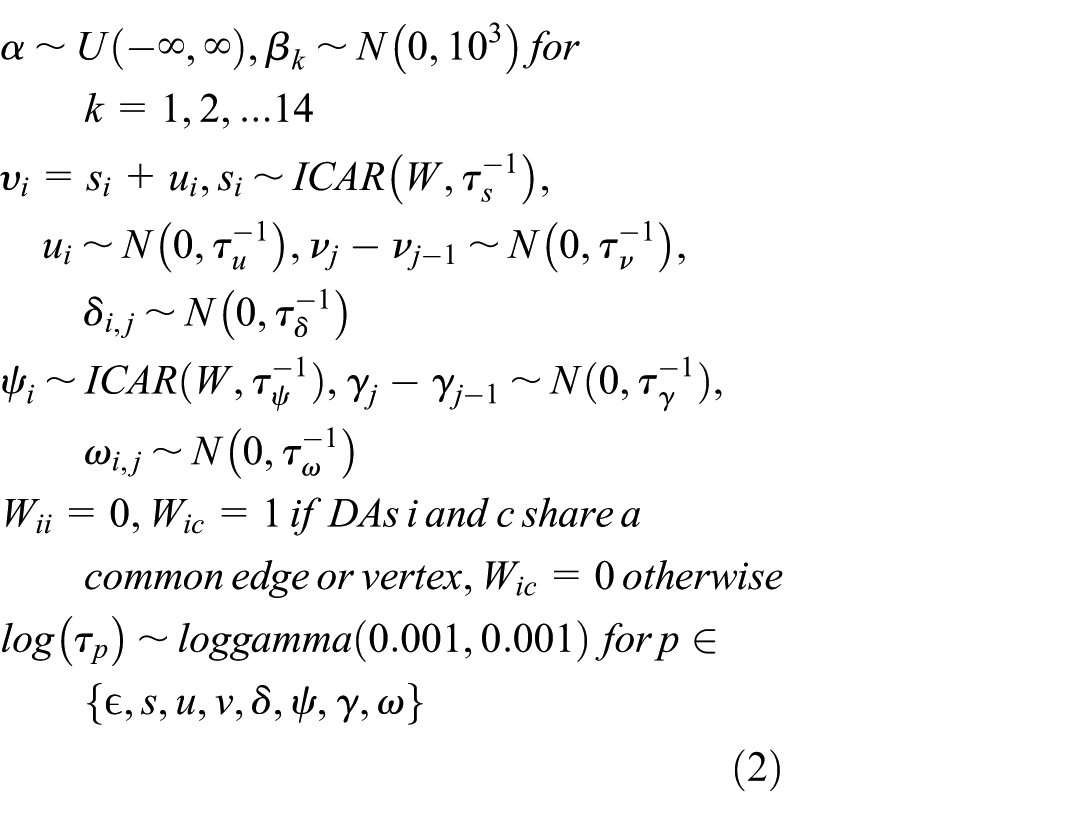
Several tests were conducted to verify the model. First, Moran’s I statistics were computed to confirm spatial autocorrelation in each dependent variable. Second, variance inflation factors were calculated to ensure no significant multicollinearity among explanatory variables. Last, the deviance information criterion (Spiegelhalter et al., 2002) and Watanabe–Akaike information criterion (Watanabe, 2009) were used to compare the model with alternatives, including a base model without the random slope term and models incorporating Types II, III, and IV space-time interactions described in Knorr-Held (2000). The current model outperformed all tested alternatives. All models were fitted using the Integrated Nested Laplace Approximation (INLA) approach with the latest R-INLA package (www.r-inla.org), which provides a computationally efficient method for Bayesian modeling (Rue et al., 2009, 2017).
Results
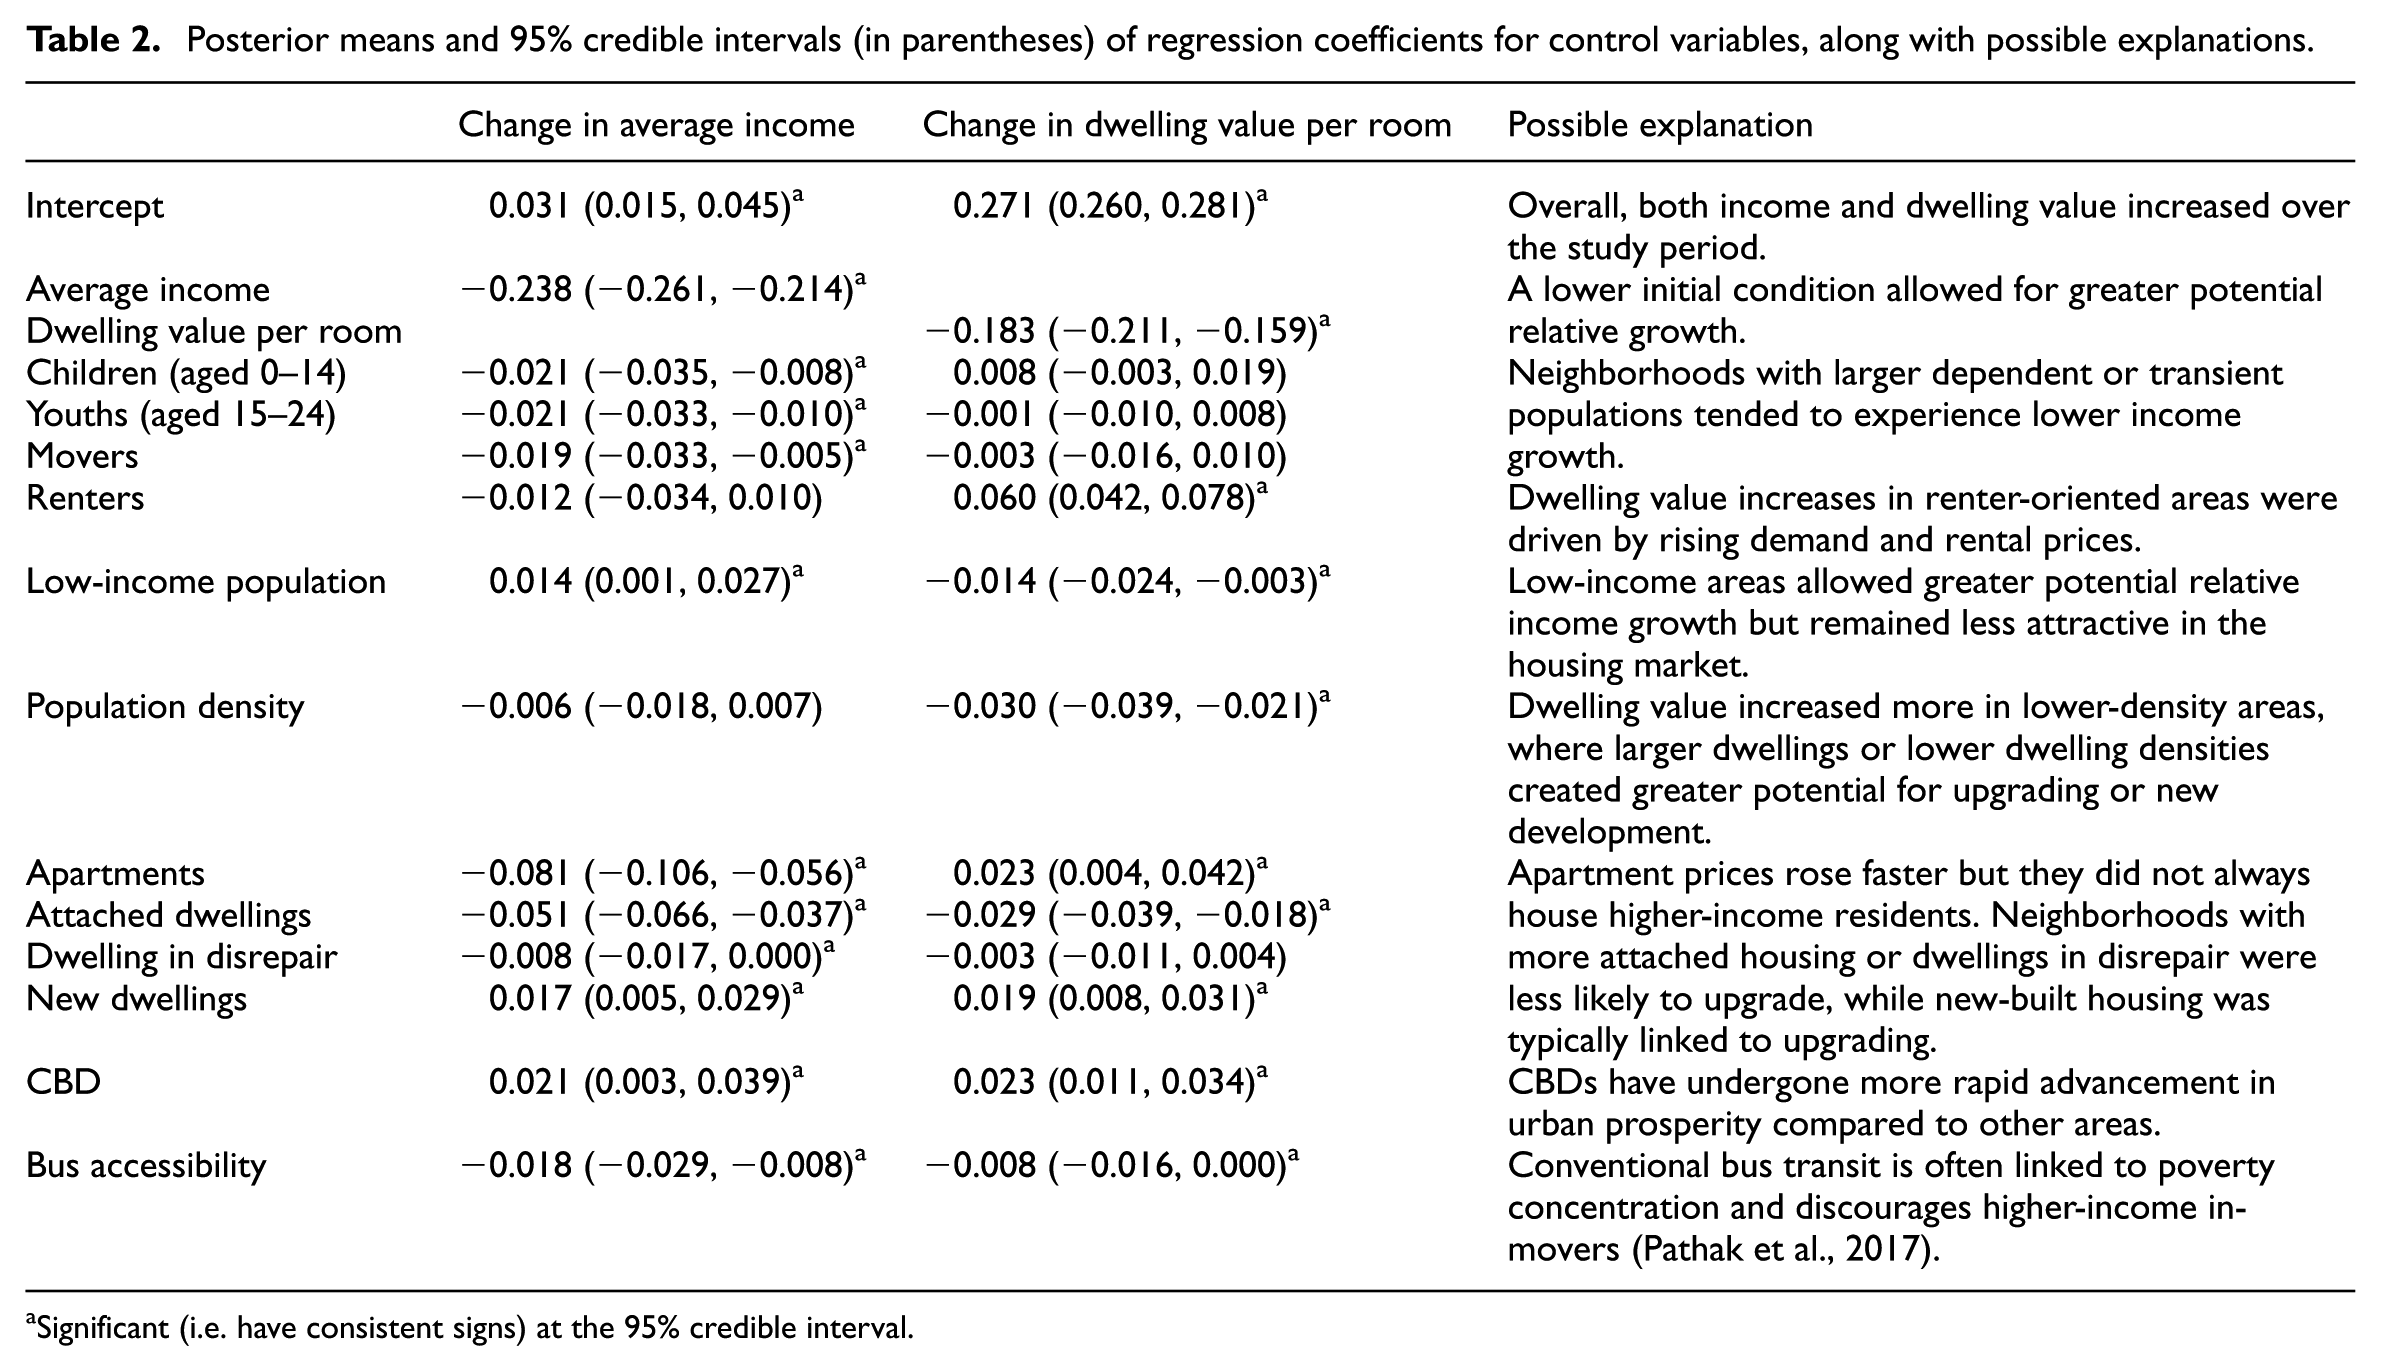
Significant associations with the dependent variables were found for most control variables. As they are not the focus of this study, their results and possible explanations are summarized in Table 2 without further discussion. Figures 2 and 3 illustrate the main results of this study, showing regression coefficients associated with distance to LRT. Without further investigation of gentrification status, the regression coefficients reflect associations with neighborhood upgrading, defined here as improvements in income and dwelling value in any neighborhood type.
Posterior means and 95% credible intervals (in parentheses) of regression coefficients for control variables, along with possible explanations.
Significant (i.e. have consistent signs) at the 95% credible interval.
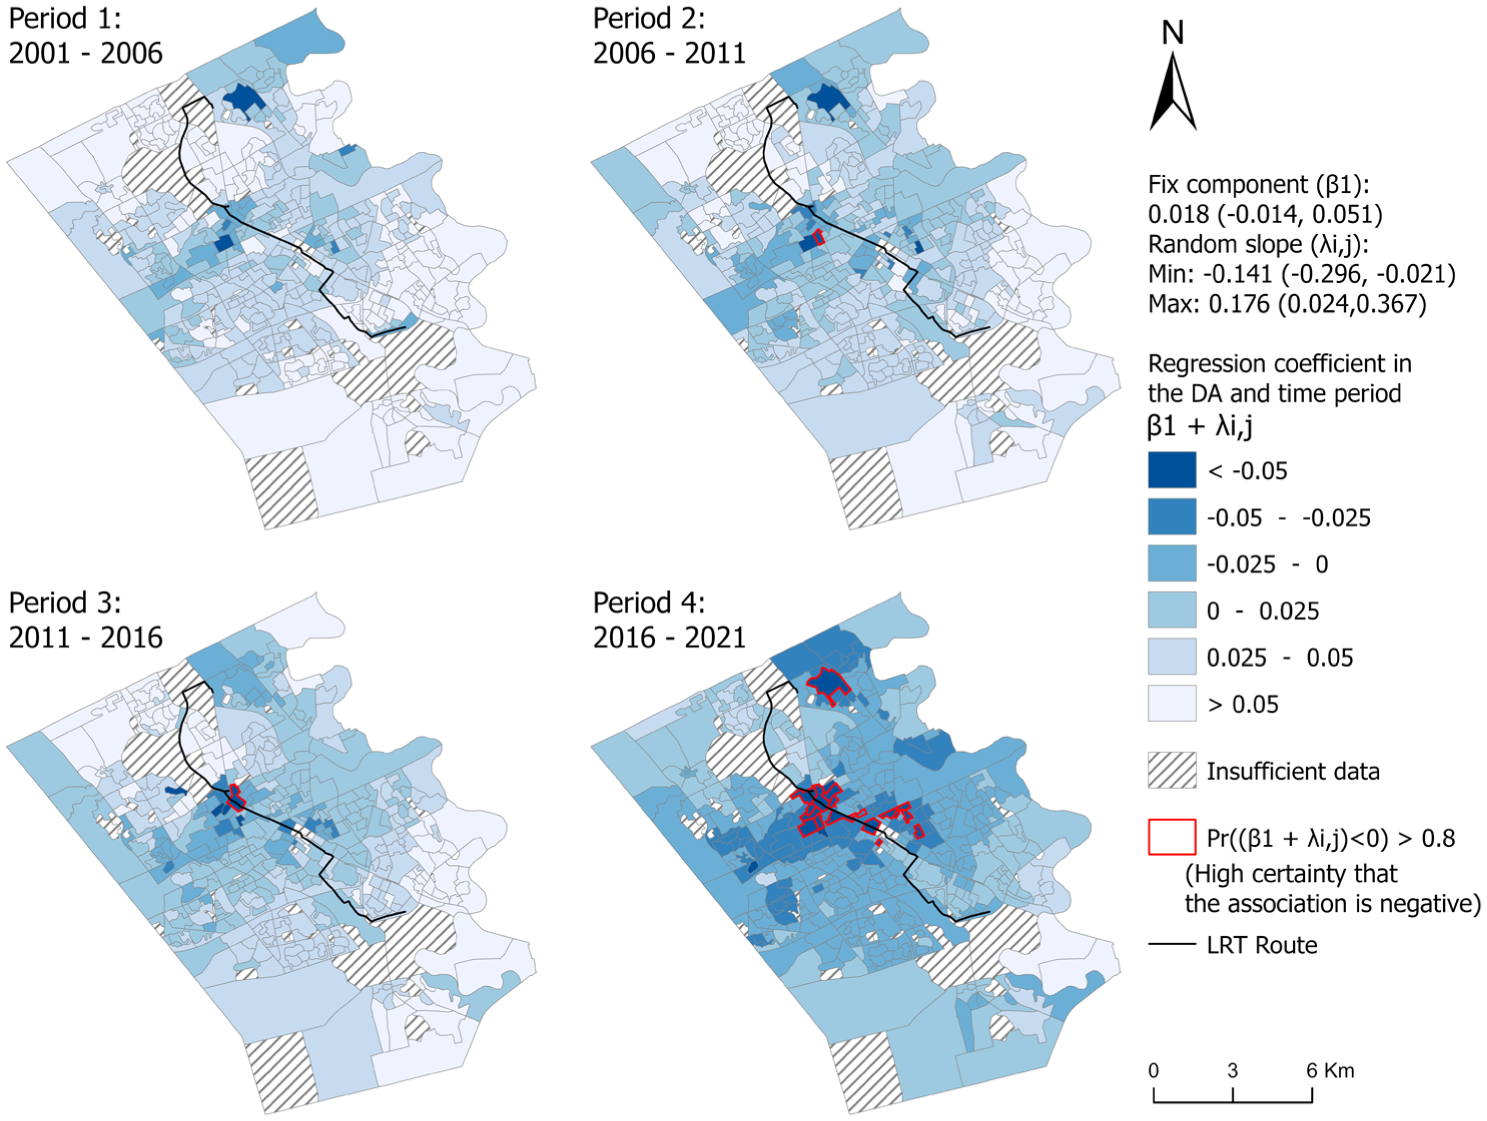
Spatiotemporally varying relationship between distance to LRT and the change in average income.
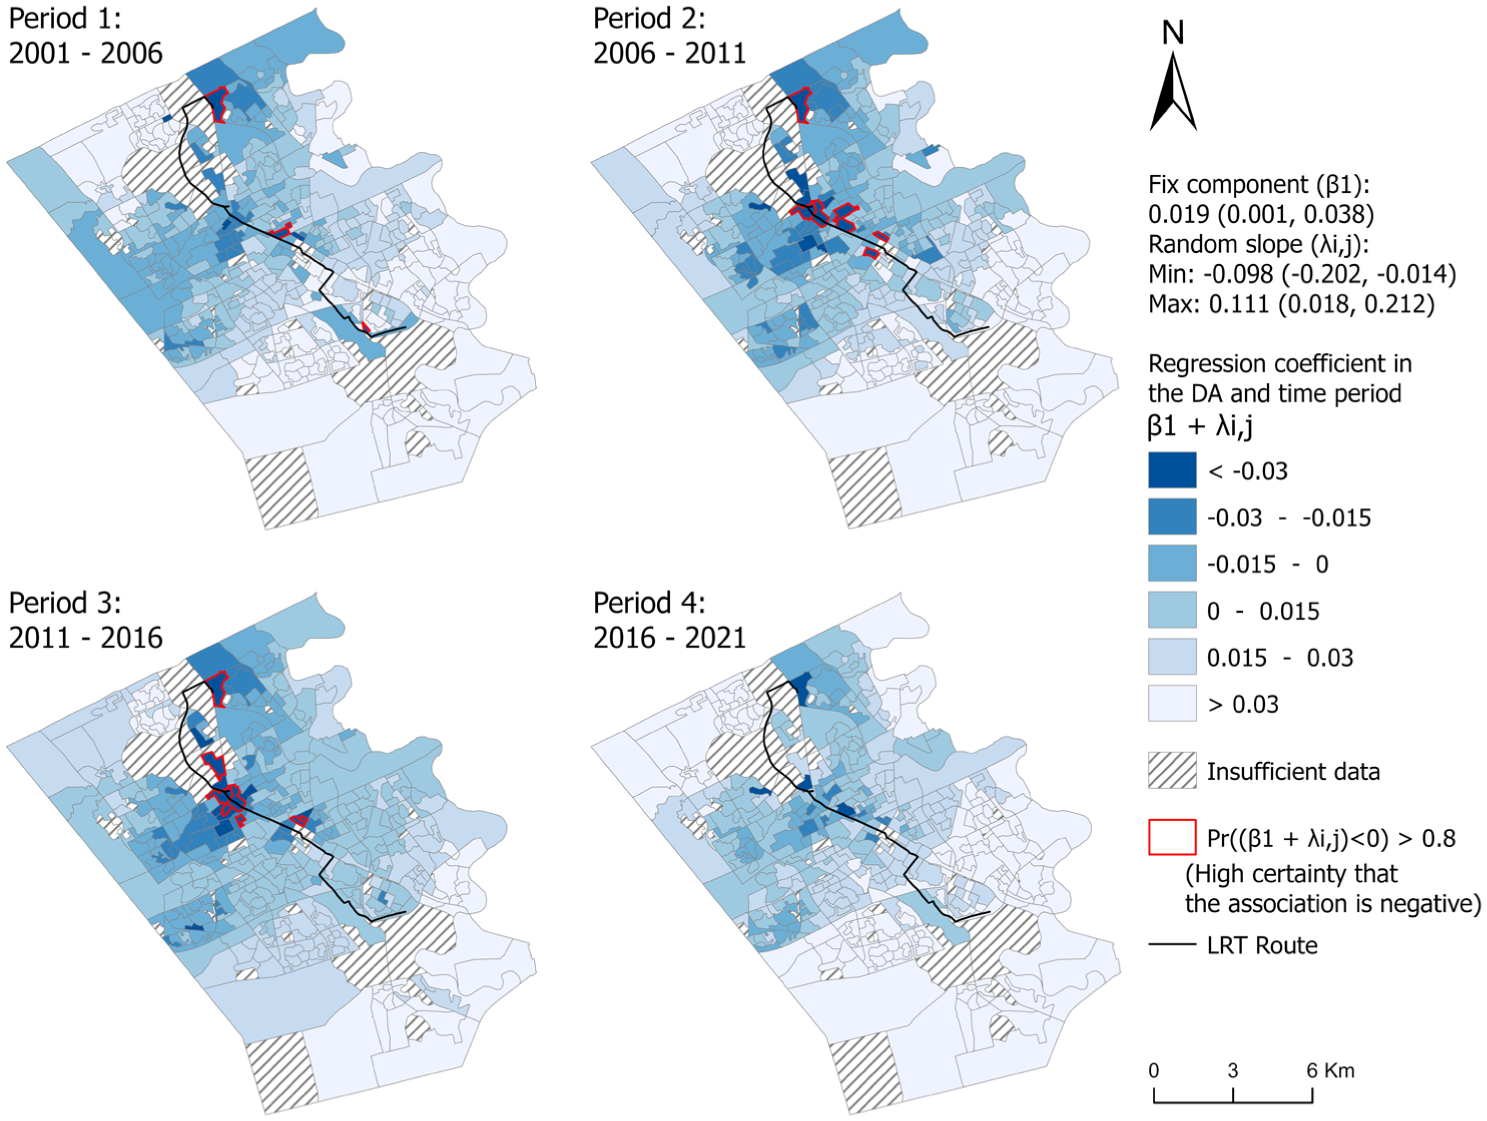
Spatiotemporally varying relationship between distance to LRT and the change in dwelling value per room.
Focusing on the fixed component (
The local relationship is represented by the posterior mean of the sum of the fixed component and the random slope of the regression coefficient (
For average income (Figure 2), the number of neighborhoods with negative coefficients gradually grew over time, and a few neighborhoods in the central and northeastern zones showed high posterior probabilities of negative coefficients in the fourth period, indicating a significant link between proximity to stations and income growth during the LRT opening stage in these areas. High posterior probabilities were also found with two of these neighborhoods in earlier periods. As for dwelling value per room (Figure 3), negative coefficients with high posterior probabilities appeared in some neighborhoods in the central and northeastern zones during the first three periods, particularly in the second and third periods. To focus only on neighborhoods with LRT-related upgrading for further discussion, the locations of neighborhoods identified with significant associations (i.e. high posterior probabilities of negative regression coefficients) are summarized in Figure 4. Table 3 details LRT-related upgrading in each of these neighborhoods. Average incomes and dwelling values per room at the start and end of the study period, in comparison to the regional average, are included in the table to help discuss possible gentrification.
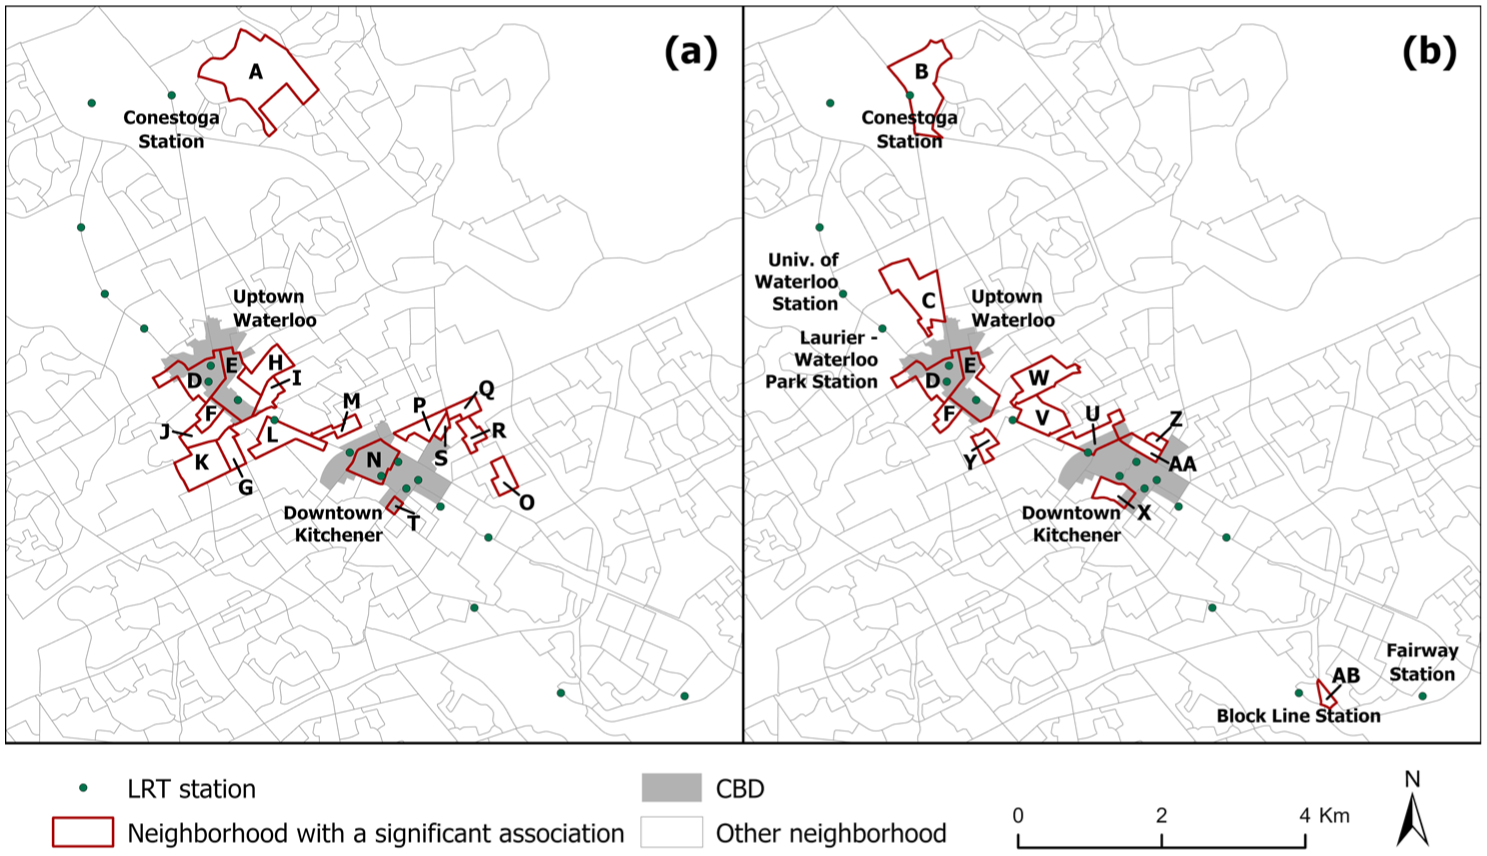
Maps of (a) neighborhoods with a significant association between average income improvement and proximity to LRT, and (b) neighborhoods with a significant association between dwelling value growth and proximity to LRT.
Neighborhoods with significant associations between proximity to LRT and upgrading: timing, locations, incomes, and dwelling values
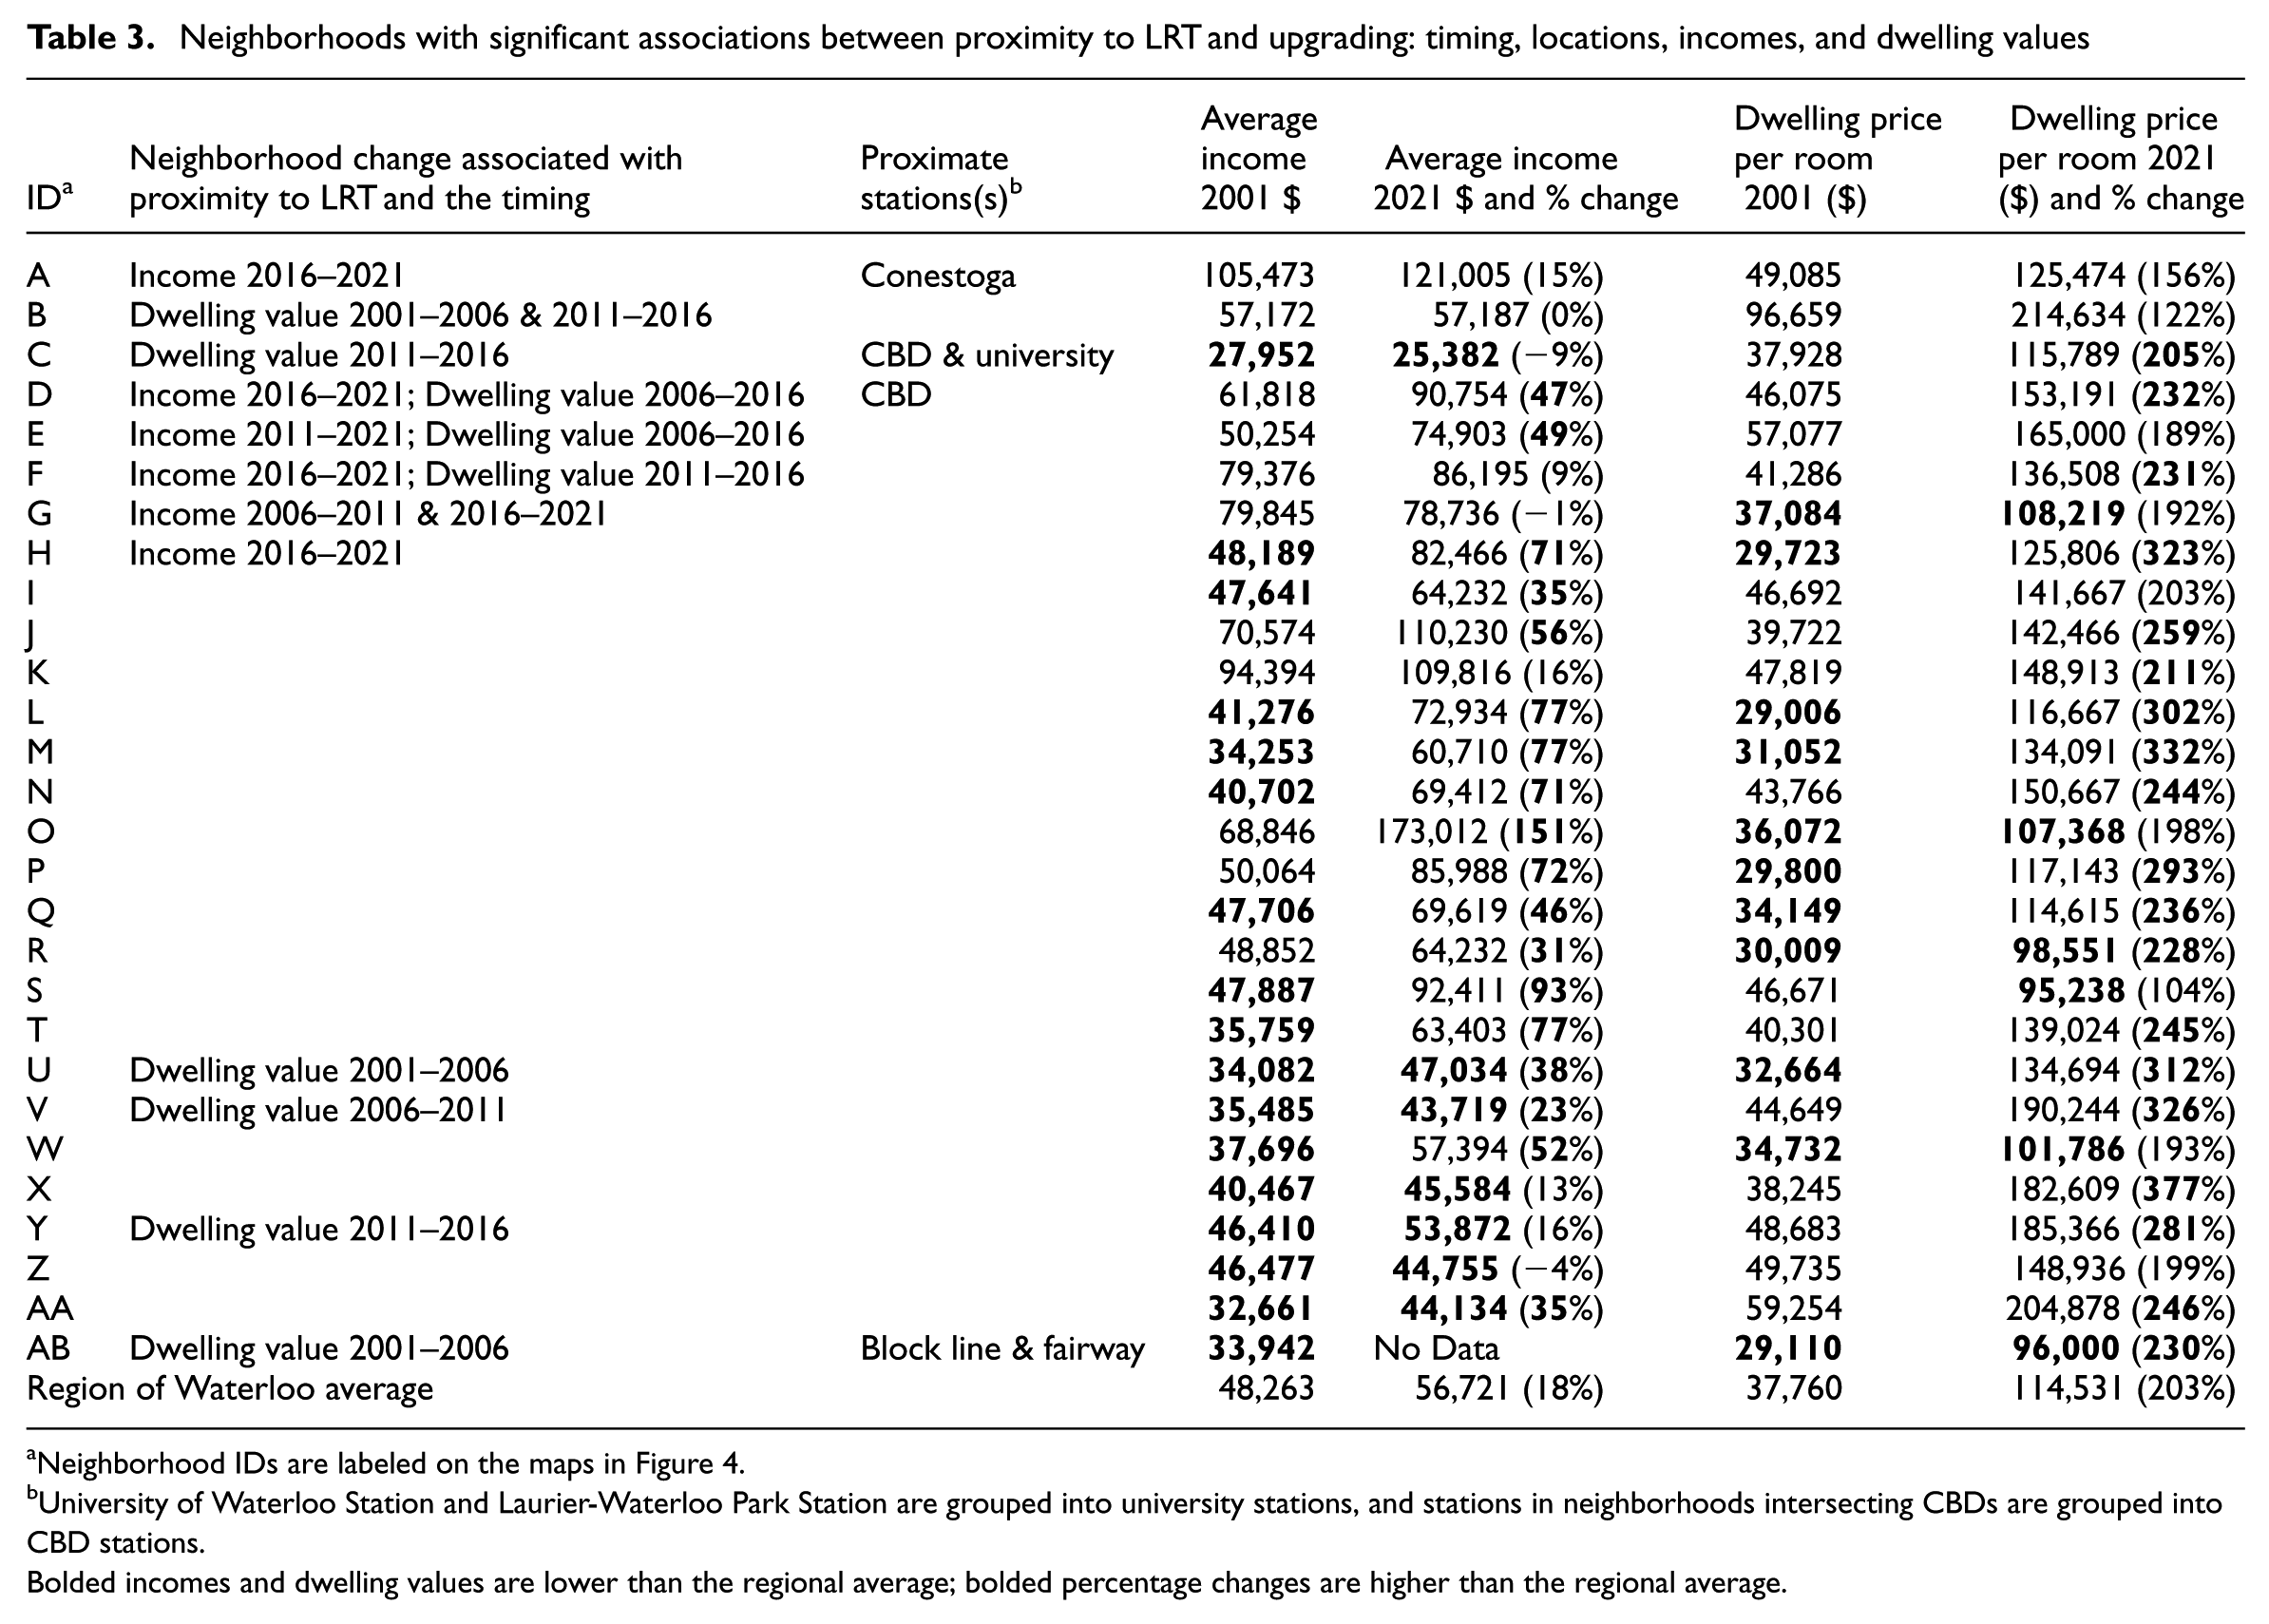
Neighborhood IDs are labeled on the maps in Figure 4.
University of Waterloo Station and Laurier-Waterloo Park Station are grouped into university stations, and stations in neighborhoods intersecting CBDs are grouped into CBD stations.
Bolded incomes and dwelling values are lower than the regional average; bolded percentage changes are higher than the regional average.
Discussion
LRT-related neighborhood upgrading
Focusing on the spatial patterns of neighborhoods with significant LRT-related upgrading (Figure 4), several key findings stand out. First, neighborhoods showing significant LRT-related income improvement and dwelling value increase were found in similar but not entirely consistent locations. Second, the population-weighted centroids of all these neighborhoods lie within 1.5 km of the stations via road networks, implying that the LRT’s influence was mostly limited to walkable areas from stations. This also aligns with previous studies that used predefined transit influence zones based on fixed buffers, typically ranging from 0.5 to 1 mi (Bardaka et al., 2018).
Furthermore, three of these neighborhoods were found near the northern or southern LRT terminals, with the rest clustered around the two CBDs. By incorporating spatial variability into modeling, this finding provides valuable insight into the specific locations where transit-related neighborhood change occurred. This level of spatial detail has rarely been captured in previous quantitative studies, which often generalized results at the city or transit-line level. Nonetheless, the observed patterns align with gentrification theories and some qualitative research. Neighborhoods near LRT terminals may have attracted greater residential demand due to improved access to city centers, which concentrate jobs and commercial activity. As for CBD stations, CBDs were already included as a control variable, but proximity to LRT possibly added additional value. This may reflect major investments along the LRT corridors within CBDs, including the development of high-end condominiums that increased housing prices and attracted higher-income residents (Doucet, 2021; Ellis-Young and Doucet, 2024).
Temporally, as summarized in Table 3, LRT-related dwelling value increase mainly occurred in the second and third periods (2006–2016), while LRT-related income improvement predominantly occurred in the fourth period (2016–2021). Although both indicate neighborhood change status, income reflects the current status, while dwelling value represents anticipated future changes (Bunten et al., 2024). Investors may drive up housing prices during LRT planning and construction, anticipating future demand, while higher-income residents often move in only after LRT service begins. This is evident in two neighborhoods (D and E) which showed LRT-related income improvements following dwelling value increases. Some argue that housing prices, driven by speculation after the transit project announcement, may not accurately reflect actual neighborhood sociodemographic change in analyses comparing periods before and after LRT opening (He et al., 2024; Melser, 2020). However, this study’s inclusion of temporal variability addresses this concern by capturing when different types of change occur, reconfirming that neighborhood change may occur in stages, with sociodemographic shifts typically following changes in dwelling value.
Possible gentrification
Recognizing that gentrification typically involves socio-economic upgrading driven by investments and demographic shifts, but that not all upgrading is equivalent to gentrification, LRT-related gentrification should be identified within neighborhoods exhibiting LRT-related upgrading. Table 3 shows that six neighborhoods (L, M, Q, U, W, and AB) had both income and dwelling value below the regional average in 2001, signaling underinvestment and the presence of lower-income population before LRT development. By a conventional definition, these areas were gentrifiable, meaning that their upgrading might be classified as possible gentrification. All six experienced faster growth in at least one indicator compared to the regional average, and five (excluding AB), located near CBD stations, had at least one indicator over the regional average by 2021, suggesting signs of gentrification.
Due to data limitations, this research did not directly measure displacement when defining gentrification. However, the criteria used for identifying gentrification can be flexibly adjusted. Thresholds used to define gentrifiability and fast growth can be modified, and additional variables may be incorporated to suit different research or planning contexts. Since this approach narrows the assessment of LRT-related gentrification to neighborhoods where LRT-related upgrading occurred, complementary qualitative methods such as field investigations may become more manageable for assessing gentrification, although this is beyond the scope of the current study.
Although this study did not directly confirm displacement, the observed increases in dwelling values related to LRT, particularly those outpacing the regional average, raise concerns about the loss of affordable housing, a common gentrification-related outcome. The Region of Waterloo (2023) has already reported declines in affordable housing along the LRT corridor, especially after 2016. In addition to value increases of existing units, in the CBDs, this problem has been driven by the demolition and renovation of affordable units and the construction of high-end units, contributing to both direct and exclusionary displacement (Doucet, 2021). While government-led transit infrastructure is often framed as advancing equity, transit-served areas often become less affordable, excluding the populations most dependent on transit (Kramer, 2018). Cities planning or implementing transit projects should therefore monitor where and when these impacts occur and take proactive steps to ensure that transit investments benefit disadvantaged populations.
Limitations and future research
Several limitations of this research are worth noting. This study only analyzed changes in income and dwelling value, while other indicators, such as education, demographic compositions, and social status could be explored to better understand patterns of neighborhood change. Where available, variables that directly capture displacement should also be incorporated as dependent variables.
It should also be noted that census-reported dwelling values may not reflect actual market prices, which were unavailable for this study. Although commonly used in relevant studies, self-assessed home value indicators often lag behind market-based measures, underestimate shifts during rapid changes, and are influenced by neighborhood sociodemographic characteristics and changes in the housing compositions (Immergluck and Hollis, 2024). Nevertheless, such measures remain meaningful as they capture residents’ perceptions, an essential aspect of gentrification as a social and psychological process that shapes living experiences and housing decisions. To partially address this limitation, this study calculated dwelling value per room and included control variables to account for housing composition shifts and reporting biases among population groups. Where market-based data are available, future research could benefit from comparing both indicators to enhance the robustness of findings.
While distance to LRT was used as the transit variable, it may not fully capture the added value of LRT. Future research could incorporate other variables, such as improved walkability scores or accessible areas resulting from LRT, if quantifiable. Also, more control variables, such as job concentrations could be included if available. Furthermore, this study used the DA as a neighborhood proxy, but other spatial units (e.g. planning neighborhoods and census tracts) could be examined. Similarly, examining different temporal units and timeframes could provide further insights. This study included four time periods, with only one corresponding to the LRT’s opening, since ION LRT was newly developed. There could be a time lag between LRT opening and the occurrence of gentrification.
Finally, LRT may also have contributed to other forms of neighborhood change that warrant further investigation. Gentrification is not an isolated process, particularly in a region shaped by a strong technology sector and two universities, where the knowledge economy can drive gentrification, youthification (influx of young adults aged 25–34), and studentification (influx of post-secondary students) simultaneously (Moos et al., 2019). Future research could explore the spatiotemporal patterns of all these processes in relation to LRT.
Conclusion
Urban rapid transit systems like LRT could contribute to neighborhood change, including gentrification, potentially displacing disadvantaged residents. Previous empirical research has reported mixed results. We argue that the relationship between LRT and neighborhood change may vary spatially across the urban area it serves and temporally from the planning to opening stages of a transit line. This study analyzed the spatiotemporally varying relationship between distance to LRT and neighborhood change in Kitchener-Waterloo with a Bayesian modeling approach. LRT-related upgrading, including increases in income and dwelling value, was evident in some neighborhoods around CBD stations and near the northern and southern terminals. LRT-related dwelling value increase mainly occurred during LRT planning and construction phases, while LRT-related income improvement was predominantly found during the opening stage. Moreover, upgrading in some neighborhoods, mainly located near CBD stations, could be classified as gentrification related to LRT development.
Overall, this study confirms the spatiotemporal variability in LRT-related neighborhood upgrading and gentrification. While the debate over whether transit projects are associated with gentrification continues and findings remain mixed, this research offers a distinct perspective with empirical evidence: the outcome largely depends on the specific locations and time periods examined within a transit project. Analyses assuming a consistent relationship between transit and neighborhood change over a long time period or across all station areas of the same line, or distinguishing only between gentrifiable and non-gentrifiable neighborhoods, could yield misleading results. This highlights the need for theoretical frameworks that conceptualize LRT-related gentrification as a spatiotemporally dynamic and context-dependent process, as well as for empirical research worldwide that captures local spatiotemporal variation to accurately and precisely identify transit-related gentrification.
The research framework and advanced modeling approach presented here, as well as the novel concept of examining transit-related neighborhood change as a spatiotemporally variable phenomenon, could aid future research in understanding the relationship between public transit and gentrification. While the case study presented focused on a mid-sized city in Canada, the approach is adaptable to a range of urban contexts and those implementing different forms of transit system; for example, BRT, which has become increasingly popular in the Global South (Venter et al., 2018). As more evidence is gathered worldwide and as understanding grows regarding where, when, and why transit projects contribute to gentrification, it will become increasingly possible to determine when and where concerns should be addressed, and how transit projects can be designed to minimize negative impacts on disadvantaged residents. These insights can help planners and policymakers around the world integrate transport services and land development for long-term sustainable and equitable cities.
Footnotes
Acknowledgements
The authors would like to thank Markus Moos for providing comments on an earlier draft of this manuscript.
Funding
The authors received no financial support for the research, authorship, and/or publication of this article.
Declaration of conflicting interests
The authors declared no potential conflicts of interest with respect to the research, authorship, and/or publication of this article.